Article

Response of Grassland Vegetation Growth to Drought in Inner Mongolia of China from 2002 to 2020

1
School of Mining and Geomatics Engineering, Hebei University of Engineering, Handan 056038, China
2
School of Urban Planning and Design, Peking University Shenzhen Graduate School, Peking University, Shenzhen 518055, China
3
School of Artificial Intelligence, Shenzhen Polytechnic University, Shenzhen 518055, China
4
State Key Laboratory of Remote Sensing Science, Jointly Sponsored by Beijing Normal University and Institute of Remote Sensing and Digital Earth of Chinese Academy of Sciences, Beijing 100875, China
*
Author to whom correspondence should be addressed.
Atmosphere 2023, 14(11), 1613; https://doi.org/10.3390/atmos14111613
Submission received: 2 October 2023 / Revised: 24 October 2023 / Accepted: 25 October 2023 / Published: 27 October 2023
(This article belongs to the Section Biosphere/Hydrosphere/Land–Atmosphere Interactions)

Abstract

:
Drought poses a significant environmental risk and can deeply affect the growth of grasslands. However, there is still uncertainty regarding the precise impact of varying levels of drought on grassland growth. To address this gap, we utilized several key indicators, including the Normalized Difference Vegetation Index (NDVI), Enhanced Vegetation Index (EVI), Global Orbiting Carbon Observatory-2-based Solar-induced Chlorophyll Fluorescence (GOSIF), and Gross Primary Productivity (GPP), in conjunction with drought indices (the Standardized Precipitation Evapotranspiration Index (SPEI) and soil moisture (SM). Our study aimed to comprehensively assess the consistency of spatiotemporal patterns in grassland vegetation and its responsiveness to different drought levels in the Inner Mongolia region from 2002 to 2020. The results indicated that NDVI, EVI, GOSIF, and GPP in grassland vegetation across Inner Mongolia exhibited significant increasing trends from 2002 to 2020. Specifically, NDVI, EVI, GOSIF, and GPP all displayed consistent spatial patterns, with 25.83%, 21.18%, 22.65%, and 48.13% of the grassland area showing significant increases, respectively. Drought events, as described through SPEI and SM, from June 2007 to September 2007 and June 2017 to July 2017 were selected to evaluate the response of grassland vegetation to drought. The drought events of 2007 and 2017 resulted in reductions in NDVI, EVI, GOSIF, and GPP relative to the multi-year average (2002–2020). GOSIF exhibited a more intense response to drought, suggesting that GOSIF may reflect the inhibition of water stress on grassland photosynthesis better than NDVI and EVI for the drought in 2007 and 2017. The reductions in NDVI, EVI, GOSIF, and GPP in grassland increased significantly across different drought levels, with the sharpest reductions observed during extreme drought. Under the severe and extreme drought events, the most substantial reductions in NDVI, EVI, GOSIF, and GPP were observed in the temperate steppe (TS). Moreover, the effects of different drought severity levels within the same grassland type varied, with the most significant reductions in NDVI, EVI, GOSIF, and GPP observed during extreme drought. Our results provide new perspectives for developing and implementing effective strategies to address grassland carbon cycling management and climate change in Inner Mongolia.

1. Introduction

Drought is a common hydrometeorological phenomenon and a significant environmental risk that increases vegetation mortality and reduces vegetation productivity and sequestration of carbon [1,2,3,4]. For the past several decades, the frequency and severity of drought events have shown a rapidly increasing trend with rising temperature [5,6,7]. Earth system models also project a vast expansion of regions often affected by extreme and severe droughts in the coming decades [8,9]. Grassland areas cover approximately 25% of the Earth’s land surface, yet they store approximately 34% of global terrestrial carbon [10,11,12]. Grasslands are among the most fragile ecosystems and are highly susceptible to droughts [10,11]. Recently, some studies have indicated that drought is the key factor influencing grassland ecosystem dynamics [11,13,14]. Therefore, it is important to study the response of grassland vegetation growth to drought under the background of global warming.
Remote sensing observations have proven to be invaluable in monitoring drought characteristics and quantifying its impact on grasslands over varying time intervals and spatial scales [15,16]. Recently, remote sensing approaches have been developed, and vegetation indices (e.g., the Normalized Difference Vegetation Index (NDVI), Enhanced Vegetation Index (EVI), and Near-Infrared Reflectance of Vegetation (NIRv)) and drought indices (e.g., the Temperature-Vegetation Dryness Index (TVDI), Soil Water Deficit Index (SWDI), Standardized Precipitation Evapotranspiration Index (SPEI), etc.) have been widely applied to assess the effects of drought events on grassland ecosystems [3,17]. Traditionally used vegetation indices (such as NDVI, EVI, and NIRv) do not directly reflect changes in actual photosynthesis in grassland ecosystems when water stress occurs [11,18,19]. Some studies have also used Solar-induced Chlorophyll Fluorescence (SIF) to monitor vegetation response to drought events at different spatial and temporal scales [11,17,20,21].
Unlike traditional vegetation indices, SIF is directly related to the actual photosynthetic function of plants and can reveal rapid changes in water stress within the vegetation canopy [22,23]. However, the degree of change in photosynthesis or productivity is highly sensitive to different drought levels [10,24]. Generally, extreme and severe drought events can result in additional reductions in grassland photosynthesis or productivity due to increased mortality and physiological function recession [24]. Previous studies have primarily focused on the effect of specific drought levels on grassland, leaving the response of grassland ecosystems to different intensities of drought largely unexplored. Moreover, different types of grassland ecosystems exhibit varying responses to droughts. Therefore, a more precise investigation into the spatiotemporal evolution patterns of grassland ecosystems and their response to different drought levels is warranted.
Inner Mongolia is highly responsive to global climate change, with more than 74% of its area covered by various types of grasslands [25,26]. This region has experienced increased temperatures, reduced precipitation, and more frequent droughts over the past few decades [26]. Understanding the spatial and temporal patterns of grassland NDVI, EVI, GOSIF, and GPP and their responses to different drought levels in Inner Mongolia is of great significance to enhancing ecological security in Northern China [26]. The primary objective of this study was to quantify the spatiotemporal variation in the characteristics of grassland ecosystems and their response to different intensities of drought in Inner Mongolia over the past two decades (2002–2020) using NDVI, EVI, GOSIF, GPP, SPEI, and soil moisture (SM) data. Additionally, we assessed variations in NDVI, EVI, GOSIF, and GPP losses in different grassland types under the same drought severity levels. This study aimed to answer the following questions: (1) What are spatial and temporal patterns in the characterization of Inner Mongolia grasslands, such as NDVI, EVI, GOSIF, and GPP? (2) To what extent do typical drought events influence grassland ecosystems in Inner Mongolia? (3) How do NDVI, EVI, GOSIF, and GPP reductions vary in different grassland biomes? Our results provide a more robust understanding and reduced uncertainty by applying a single data source and scientific basis to examine grassland ecosystems’ responses to droughts at various levels.

2. Materials and Methods
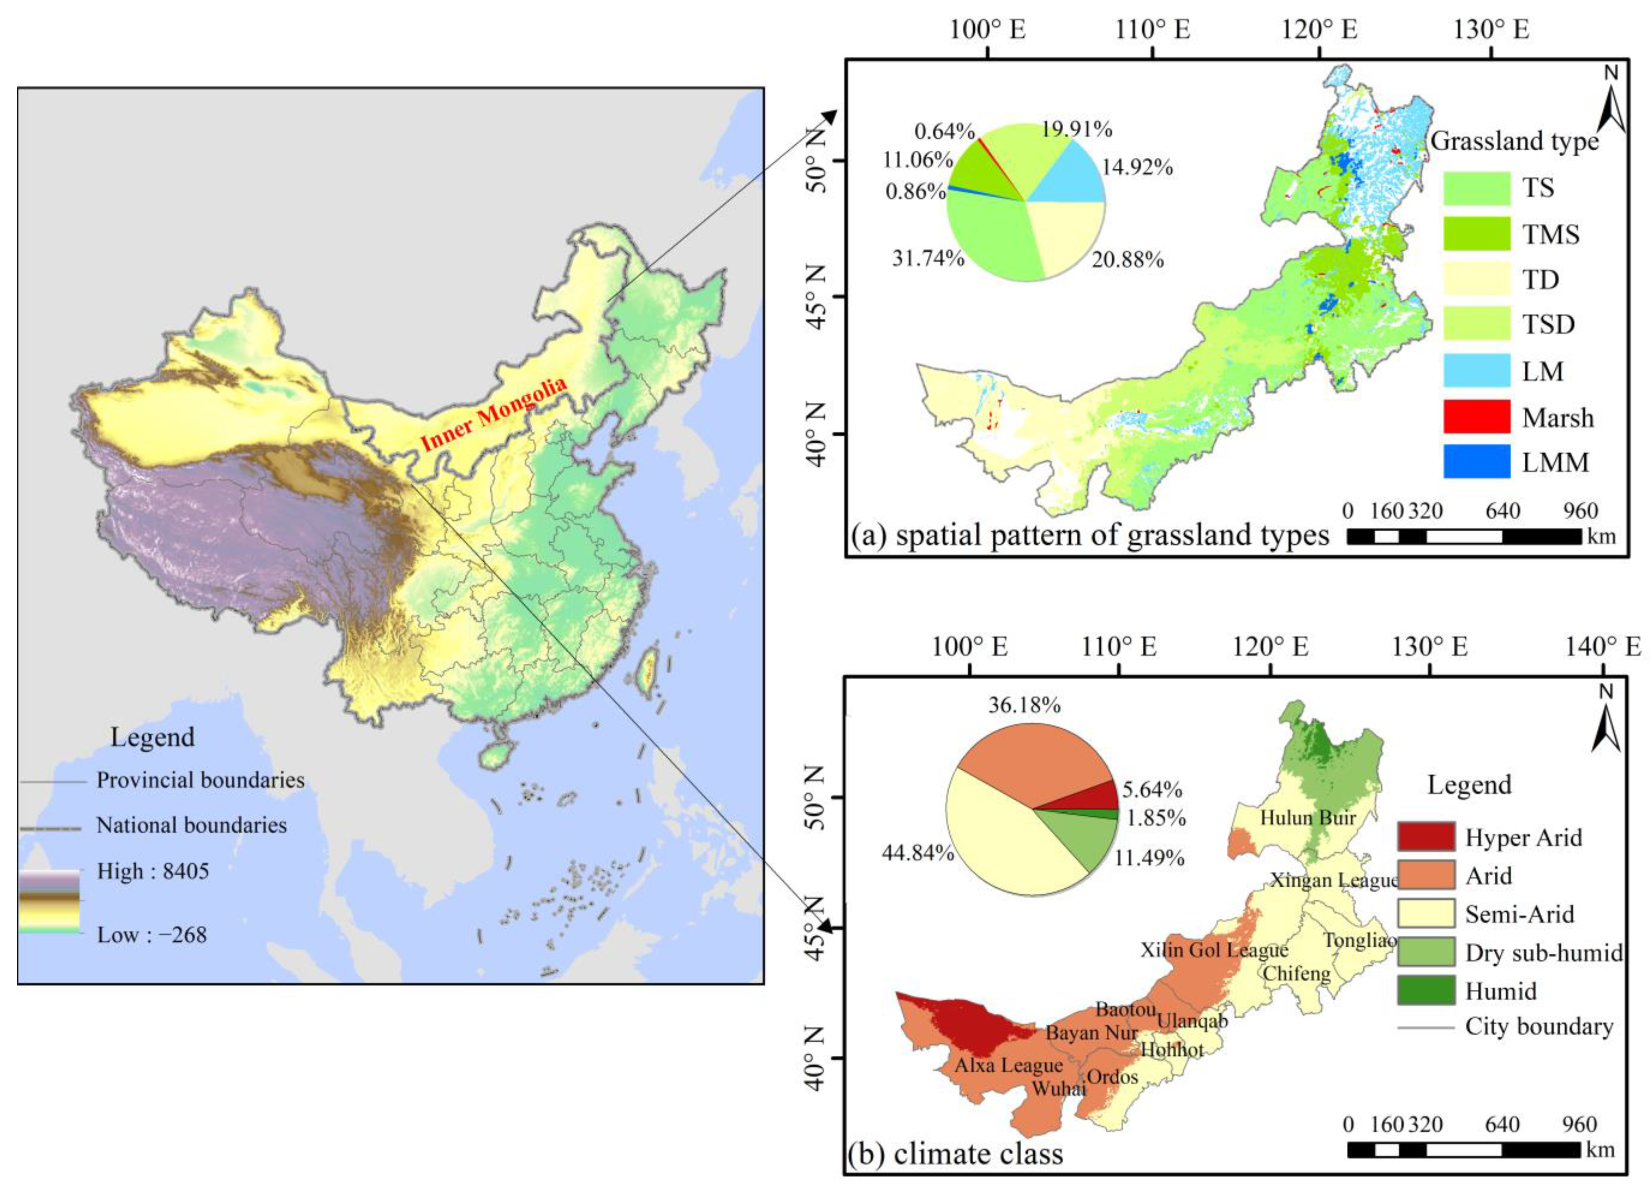
2.1. Study Area

Inner Mongolia, situated between 37°24′ N to 53°23′ N and 97°12′ E to 126°04′ E, is located in northern China and covers an expansive area of approximately 118.3 × 10⁴ km2. The topography is characterized as long and narrow, with elevations decreasing from the southwest to the northeast (Figure 1). Influenced significantly by the Asia monsoon, Inner Mongolia is a typical temperate continental monsoon climate. Consequently, the mean annual rainfall varies from 50 to 550 mm and diminishes from the northeast to the southwest [27,28]. The annual mean temperature typically falls within the range of −4~10 °C and progressively increases from the northeast to the southwest [26,27,28,29]. Grasslands dominate the Inner Mongolia landscape, constituting the primary vegetation types and covering approximately 74% of the entire region. Nevertheless, due to the temporal variability of precipitation and the effects of global warming, Inner Mongolia has experienced a heightened frequency of droughts over the past decades [30].

2.2. Data Sources and Preprocessing

2.2.1. MODIS Products

In this study, Moderate Resolution Imaging Spectroradiometer (MODIS) products, specifically NDVI, EVI, and GPP, were used to monitor the vegetation because of their high-quality data sources (https://e4ftl01.cr.usgs.gov/, accessed on 1 August 2023). The NDVI and EVI were using a 1-month temporal resolution and a 0.05°spatial resolution from the MOD13C2 product. To mitigate the impact of aerosol and atmospheric and molecular scattering, the maximum value composite (MVC) method was used to generate yearly NDVI and EVI datasets [31]. GPP data were sourced from the MOD17A2H product, featuring a temporal resolution of 8 days and a spatial resolution of 500 m. The monthly and yearly GPP data to achieve a spatial resolution of 0.05°, starting from the 8-day data, were synthesized and resampled [32]. The period from 2002 to 2020 was considered in this study.

2.2.2. GOSIF Data

A global Orbiting Carbon Observatory-2 (OCO-2) Solar-induced chlorophyll fluorescence (SIF) dataset, known as GOSIF, was measured in W·m−2·μm−1·sr−1. The period from January 2002 to December 2020 was retrieved from the following website: http://data.globalecology.unh.edu/data/GOSIF_v2/, accessed on 1 August 2023. GOSIF was developed by integrating discrete OCO-2 SIF soundings, remote sensing data from MODIS, and meteorological reanalysis data and showed a high correlation with GPP from 91 Global Flux Network (FLUXNET) sites [33]. It offers global coverage with high spatial and temporal resolutions (0.05°and 8 days). GOSIF has gained widespread use in assessing terrestrial photosynthesis and studying vegetation responses to drought under the background of global climate change [34,35]. In this study, monthly and yearly GOSIF data were used to evaluate its effectiveness in tracking vegetation changes and monitoring drought conditions.

2.2.3. SPEI Data

The SPEI dataset was originally proposed by Vicente-Serrano et al. [36]. The SPEI is calculated based on available water (monthly precipitation) and atmospheric evaporation demand (potential evapotranspiration) and offers the advantage of providing multi-time-scale data while accounting for potential evapotranspiration in drought assessments [37]. Meanwhile, the SPEI dataset has also been widely used to assess the impacts of drought on vegetation productivity in Inner Mongolia [38,39]. The SPEI dataset has been widely used in numerous studies to assess drought trends [23,40]. SPEI version 2.8 is available for access at the following website: https://digital.csic.es/handle/10261/288226, accessed on 1 August 2023. Considering that the SPEI with a three-month time scale (SPEI-3) can better reflect the severity and duration of grassland drought [26], SPEI-3 was used to assess the effect of drought events on grassland vegetation growth in Inner Mongolia. The SPEI values and corresponding drought levels are described in Table 1 [36,41].

2.2.4. Soil Moisture Data

The Climate Change Initiative (CCI) SM dataset, which provides surface soil moisture information, is a product of the European Space Agency (ESA, Paris, France) CCI [42,43]. The latest release (v07.1) spans 43 years from November 1978 to December 2021 and is accessible via this link: https://catalogue.ceda.ac.uk/uuid/, accessed on 1 August 2023. The SM CCI COMBINED dataset, which has a spatial resolution of 0.25° × 0.25° and a volumetric unit (m3/m3), was selected to assess drought conditions in the Inner Mongolia grassland from 2002 to 2020. The reliability of the dataset has been validated in various regions worldwide [44,45,46]. Previous studies have also indicated that CCI-SM data are suitable for the in situ SM data in Inner Mongolia [47,48,49]. We also tested the CCI-SM data with 17 in situ data of Inner Mongolia from 2000 to 2010. The results indicate that monthly CCI-SM data have a good consistency with the in situ data, and over 94% of stations (16/17) passed the 0.05 significance level test (Figure S1).

2.2.5. Other Data

The climate class was characterized using the aridity index (AI), which was computed based on annual precipitation, annual temperature, and annual reference evapotranspiration (ET0) data from the 1970–2000 period. This dataset is accessible at https://csidotinfo.wordpress.com/data/global-aridity-and-pet-database/, accessed on 1 August 2023. In this study, Hyper Arid (AI < 0.03), Arid (0.03 < AI ≤ 0.2), Semi-Arid (0.2 < AI ≤ 0.5), Dry sub-humid (0.5 < AI ≤ 0.65), and Humid (AI > 0.65) were categorized by using AI values in Inner Mongolia (Figure 1b) [50,51].
The classification of grassland types in Inner Mongolian of China was obtained from the Inner Mongolian Institute of Grassland Surveying and Planning [52,53]. The Inner Mongolian grassland comprises predominant types, including temperate steppe (TS), temperate meadow-steppe (TMS), temperate desert type (TD), temperate steppe-desert (TSD), lowland meadow (LM), Marsh, and temperate mountain meadow (TMM) (Figure 1a).

2.3. Methods

2.3.1. Theil–Sen Median Trend and M-K Test

Theil–Sen Median slope and Mann–Kendall (M-K) nonparametric trend analysis methods were used to assess the change trends of NDVI, EVI, GOSIF, and GPP during the period from 2002 to 2020. These methods are favored for their simplicity, computational efficiency, and robustness against data distribution or measurement errors. The calculation of the trend is performed using the following equations [54,55,56]:
β = M e d i a n ( x j x i j i ) , i < j
S = i = 1 n 1 j = i + 1 n sgn ( x j x i )
sgn ( θ ) = 1 0 1 if ( θ < 0 ) if ( θ = 0 ) if ( θ > 0 )
V a r ( S ) = n ( n 1 ) ( 2 n + 5 ) 18
Z = ( S 1 ) / V a r ( S )     S > 0 0 S = 0 ( S + 1 ) / V a r ( S )     S < 0
where β denotes the change trend; n denotes the length of the time series of NDVI, EVI, GOSIF, and GPP; sgn is the sign function; i and j are serial numbers; xi and xj denote the values at moments i and j, respectively; β > 0 indicates an increasing trend; β < 0 indicates a decreasing trend; and |Z| ≥ 1.96 indicates that the change trend is significant at 0.05 confidence level. The spatial distribution and change trend maps were produced using GIS software ArcGIS Desktop (version 10.2).

2.3.2. Standardized Anomaly

The calculated standardized anomaly (SA) for each variable at the pixel level during the ith month of a drought period can be performed using the following equation [2,57]:
SA grassland ( i , j ) = Var ( i , j ) Var 2002 2020 ( i , j ) ¯ σ ( Var 2002 2020 ( i , j ) )
where SAgrassland (i, j) and Var(i, j) are the standardized anomaly and value of each variable (CCI-SM, NDVI, EVI, GOSIF, GPP) at the ith grid for the jth month during the drought period, respectively; Var 2002 2020 ( i , j ) ¯ and σ ( Var 2002 2020 ( i , j ) ) are the average and standard deviation of each variable at the ith grid for the jth month during 2002–2020, respectively.

2.3.3. Grassland NDVI, EVI, GOSIF, and GPP Loss Assessment

NDVI, EVI, GOSIF, and GPP reductions induced by drought are calculated as the difference between the mean values of NDVI, EVI, GOSIF, and GPP during drought reference years [10].
Δ Var = Var drought Var mean Var mean × 100
where Δ Var represents the percentage reduction in NDVI, EVI, GOSIF, and GPP during drought years; Vardrought and Varmean denote the value of NDVI, EVI, GOSIF, and GPP during drought years (SPEI-12 < −1.0), near normal years (−1.0 < SPEI-12 ≤ 1.0), drought months (SPEI-3 < −1.0), and near normal months (−1.0 < SPEI-3 ≤ 1.0), respectively.

3. Results

3.1. Spatiotemporal Patterns of NDVI, EVI, GOSIF, and GPP from 2002 to 2020

Figure 2a illustrates the change trends in monthly grassland NDVI and EVI from 2002 to 2020, revealing apparent periodical characteristics with a one-year cycle. Notably, the maximum values of grassland NDVI, reaching around 0.40, consistently occurred in July or August each year, signifying the period when grassland growth and metabolism were most vigorous. Conversely, the minimum values of grassland NDVI, dropping below 0.1, were consistently observed in January, indicating minimal grassland growth during that period. The change trends of monthly grassland EVI exhibited similar patterns to NDVI, but the fluctuation range of EVI values was lower than NDVI (Figure 2a). Monthly grassland GOSIF and GPP also displayed clear periodic characteristics throughout the period from 2002 to 2020 (Figure 2b). GOSIF exhibited patterns similar to those of GPP, with the maximum value appearing in August 2018, reaching 0.1371 W·m−2·μm−1·sr−1. Conversely, the minimum GOSIF value was recorded in February 2014, with a value of −0.0121 W·m−2·μm−1·sr−1. In the case of grassland GPP, its maximum value was observed in July 2012, reaching 126.61 gC·m−2·month−1. Overall, the monthly variations in grassland NDVI, EVI, GOSIF, and GPP consistently exhibited a one-year cycle in Inner Mongolia between 2002 and 2020.
In Figure 3, the yearly trends of NDVI, EVI, GOSIF, and GPP from 2000 to 2020 are depicted. All four variables exhibited significant increasing trends during this period, with change rates of 0.0024 a−1, 0.0018 a−1, 0.0012 W·m−2·μm−1·sr−1·a−1, and 4.6950 gC·m−2·a−1, respectively (p < 0.01). The peak values for grassland NDVI, EVI, GOSIF, and GPP were observed in 2018, reaching 0.4617, 0.3145, 0.1394 W·m−2·μm−1·sr−1, and 447.7892 gC·m−2, respectively. Conversely, the minimum lowest values for grassland NDVI and EVI were recorded in 2009 at 0.3593 and 0.2381 (Figure 3a), while the lowest values for grassland GOSIF and GPP were observed in 2007, with values of 0.0856 W·m−2·μm−1·sr−1·a−1 and 322.67 gC·m−2·a−1 (Figure 3b).
Figure 4 illustrates the spatial patterns and change trends of grassland NDVI, EVI, GOSIF, and GPP in Inner Mongolia between 2002 and 2020. The annual mean values of these variables showed similar spatial distribution characteristics, gradually increasing from the northwest to the southeast (Figure 4a–d). High values were primarily concentrated in the eastern part of Inner Mongolia, including LM regions and TMS regions (Figure 1 and Figure 4a–d), while lower values prevailed in the western regions, which are predominantly TD and TSD (Figure 1 and Figure 4a–d). Spatial variability in grassland change trends across Inner Mongolia from 2002 to 2020 was evident. For NDVI and EVI, approximately 82.13% and 80.18% of the region displayed increasing trends. Notably, 25.83% and 21.18% of the grassland NDVI and EVI values showed significant increasing trends, primarily concentrated in Tongliao, Ordos, and Alxa League (Figure 1 and Figure 4e,f). Conversely, only 0.91% and 0.82% of the grassland NDVI and EVI values exhibited significant decreasing trends, scattered in areas such as Chifeng and Alxa League (Figure 1 and Figure 4e,f). As for grassland GOSIF and GPP, the areas showing increasing trends (84.42% and 96.89%) were substantially higher than those with decreasing trends (15.58% and 3.11%). Specifically, 22.65% and 48.13% of grassland GOSIF and GPP values showed significant increasing trends, which were primarily distributed in Xingan League, Tongliao, Chifeng, Ordos, and Alxa League (Figure 4g,h). These regions are mainly covered by TS, TSD, and TMS (Figure 1). Conversely, only 0.50% and 0.26% of the grassland GOSIF and GPP values showed significant decreasing trends in the study area (Figure 4g,h).

3.2. Changes in Drought from 2002 to 2020

Figure 5 indicates the SPEI and standardized anomaly of CCI-SM (SACCI-SM) change trends from 2002 to 2020 in Inner Mongolia grassland. As shown in Figure 5, SPEI values exhibited frequent fluctuations at the times of 1 month (SPEI-1) or 3 months (SPEI-3), while remaining relatively stable at longer time scales (SPEI-12). The pronounced amplitude and higher frequency of wet and dry changes were primarily associated with SPEI-1 (Figure 5a). From 2002 to 2020, Inner Mongolia grassland experienced a total of 96 drought months, including 50 mild, 33 moderate, 12 severe, and 1 extreme drought months. Among these, the lowest SPEI-1 value (−2.05) was recorded in March 2019 (Figure 5a). In contrast, SPEI-3 exhibited greater stability and provided insight into seasonal-scale dry–wet changes. During the same period, a total of 119 drought months were recorded, comprising 54 mild droughts, 48 moderate droughts, 14 severe droughts, and 3 extreme droughts. The lowest SPEI-3 value (−2.08) occurred in June 2017 (Figure 5b). SPEI-12, reflecting the annual-scale dry–wet variation, was the most stable among the three indices. From 2002 to 2012, SPEI-12 identified 57 mild droughts, 71 moderate droughts, 23 severe droughts, and 6 extreme droughts. The lowest SPEI-12 value (−2.11) was found in March 2018 (Figure 5c). In particular, SPEI-3 values were observed as −1.34, −1.45, −1.42, and −1.33 in June, July, August, and September 2007, respectively, and −2.08 and −2.0 were observed in June and July 2017, respectively (Figure 5b).
The soil moisture status of Inner Mongolia grassland was identified using SACCI-SM (Figure 5d). From 2002 to 2020, a total of 112 drought months were identified using the soil moisture (SACCI-SM < 0), with the minimum value of SACCI-SM appearing in December 2020 (SACCI-SM = −2.54). Notably, from June 2007 to September 2007, SACCI-SM values consistently fell below −1 in Inner Mongolia grassland. Specifically, in June, July, August, and September 2007, SACCI-SM values were −1.59, −1.30, −1.71, and −1.91, respectively. In June and July 2017, SACCI-SM values were −1.02 and −1.12, respectively (Figure 5d). Considering droughts indicated by SPEI-3 and SACCI-SM, June 2007 to September 2007 and June 2017 to July 2017 were selected to analyze the response of grassland vegetation growth to droughts.
Figure 6 and Figure 7 present the spatial patterns of SPEI-3 and SACCI-SM in Inner Mongolia grassland for June, July, August, and September 2007 and June and July 2017. As illustrated in Figure 6, the percentage of grassland areas affected by severe and extreme drought was 47.98%, 59.24%, 63.01%, and 64.16%, respectively (Figure 6a–d). These regions are primarily situated in the central eastern part of Inner Mongolia, with milder drought conditions observed in the western regions. The spatial distribution of SACCI-SM closely mirrored that of SPEI-3. The proportion of areas with SACCI-SM values less than −1 was 61.38%, 48.37%, 41.31%, and 54.23%, respectively (Figure 6e–h). In June and July 2017, 61.27% and 56.36% of the grassland area showed extreme drought conditions, concentrated in the central eastern part of Inner Mongolia (Figure 7a,b). The spatial distribution of SACCI-SM closely paralleled that of SPEI-3, with proportions of areas experiencing SACCI-SM values less than −1 at 50.80% and 45.70%, respectively (Figure 7c,d).

3.3. Divergent Grassland Vegetation Growth Response to Two Drought Events

Figure 8 and Figure 9 show the spatial distributions of SA for NDVI, EVI, GOSIF, and GPP in June, July, August, and September 2007, as well as June and July 2017. Spatially, both NDVI and EVI indicated a widespread decline (SA < −0.5) in these months, particularly in the east-central regions of Inner Mongolia (SA < −2) (Figure 8a–h). Specifically, NDVI decreased by 17.39%, 11.38%, 10.80%, and 6.18% in June (−0.047), July (−0.039), August (−0.036), and September (−0.016), respectively, relative to the multi-year average (Figure 9a,b). Similarly, EVI declined by 18.33%, 13.97%, 11.24%, and 4.98% in June, July, August, and September, confirming a widespread vegetation browning phenomenon following drought from June to September 2007. Compared to NDVI and EVI, GOSIF indicated a similar spatial distribution pattern but displayed more drastic changes from June to September (Figure 8i–l). GOSIF decreased by 34.37%, 30.42%, 29.88%, and 14.12% in June (−0.015 Wm−2 μm−1 sr−1), July (−0.024 Wm−2 μm−1 sr−1), August (−0.023 Wm−2 μm−1 sr−1), and September (−0.005 Wm−2 μm−1 sr−1), respectively, relative to the multi-year average (2002–2020) (Figure 9e,f). The spatial distributions of SA for GPP indicated a net loss in carbon sequestration relative to the multi-year average because of the drought events. As a result, GPP decreased by 26.59%, 26.51%, 25.41%, and 10.28% in June (−10.93 gCm−2), July (−17.58 gCm−2), August (−16.23 gCm−2), and September (−3.48 gCm−2), respectively, relative to the multi-year average (2002–2020) (Figure 9g,h). SM decreased by 11.06%, 7.52%, 21.01%, and 6.91% in June, July, August, and September, respectively, relative to the multi-year average (2002–2020) (Figure 9i,j).
In June–July 2017, NDVI, EVI, GOSIF, and GPP revealed a significant inhibition of grassland vegetation growth in east-central Inner Mongolia (SA < −0.5) (Figure 10). NDVI decreased by 7.31% and 5.22% in June (−0.022) and July (−0.019), respectively (Figure 11a,b). Similarly, EVI exhibited reductions of 9.05% and 6.36% in June (−0.017) and July (−0.015), respectively (Figure 11c,d). Under the influence of drought stress, GOSIF decreased by 10.20% and 17.01% in June (−0.006 Wm−2 μm−1 sr−1) and July (−0.015 Wm−2 μm−1 sr−1), respectively, signifying a clear inhibition of grassland vegetation growth (Figure 11e,f). GPP decreased by 8.33% and 14.91% in June (−4.001 gCm−2) and July (−10.893 gCm−2), respectively (Figure 11g,h). SM decreased by 9.06% and 7.52% in June and July, respectively (Fig.11i and 11j). Notably, the decrease in GPP in June was less pronounced than in July. This differential response was particularly evident in GOSIF, while NDVI and EVI failed to capture this variability. Therefore, GOSIF emerges as a superior indicator for assessing the impact of drought events on grassland photosynthesis.
Based on the responses of NDVI, EVI, and GOSIF to two drought events, NDVI, EVI, and GOSIF experienced water stress during the peak growth stage of grassland vegetation. However, GOSIF exhibited a more pronounced response to drought, with its change trend closely mirroring that of GPP. Therefore, GOSIF serves as a valuable indicator that closely reflects the processes associated with GPP during drought events.

3.4. NDVI, EVI, GOSIF, and GPP Loss at Different Drought Levels

In order to evaluate the impact of different drought severity levels on grassland vegetation, we examined the NDVI, EVI, GOSIF, and GPP reductions across varying drought severities in Inner Mongolia. In general, all levels of drought (moderate, severe, and extreme) led to a decline in NDVI, EVI, GOSIF, and GPP (Table 2). However, the extent of NDVI, EVI, GOSIF, and GPP reductions varied significantly. For NDVI, the average reductions caused by moderate, severe, and extreme droughts were 8.82%, 14.46% and 26.81%, respectively. Similarly, EVI exhibited average reductions of 8.71%, 15.04%, and 27.11% under moderate, severe, and extreme drought conditions, respectively. Notably, GOSIF showed much larger reductions in the grassland of Inner Mongolia, with reductions of 20.58%, 22.83%, and 67.31% under moderate, severe, and extreme droughts, respectively. For GPP, the average reduction caused by moderate, severe, and extreme droughts was 10.52%, 18.01%, and 27.05%, respectively. Overall, NDVI, EVI, GOSIF, and GPP exhibited decreased significant declines with increasing drought severity, with GOSIF displaying the most pronounced response to drought.
The reductions in NDVI, EVI, GOSIF, and GPP across various grassland types along the drought severity gradient exhibited notable differences (Figure 12). During extreme drought conditions, the most significant NDVI reductions were observed in TS, with an average loss of −31.54%. LM, TMS, and TSD also experienced substantial NDVI reductions, with averages of 16.88%, −16.52%, and −27.37% (Figure 12a). A similar pattern was observed for EVI reductions, where TS, LM, TMS, and TSD exhibited reductions of −31.69%, −17.25%, −20.45%, and −25.30%, respectively (Figure 12b). Remarkably, GOSIF reductions were most pronounced in TS, with an average loss of −92.15%, followed by LM, TSD, and TMS (Figure 12c). Regarding GPP, TS experienced the highest average loss (−32.29%), followed by TSD, TMS, and LM (Figure 12d). For severe drought conditions, GOSIF reductions in TS, LM, TMS, and TSD were −65.83%, −53.23%, −33.96%, and −53.94%, respectively (Figure 12c). GPP exhibited average losses of −23.42%, −15.40%, −15.28%, and −16.87%, in TS, LM, TMS, and TSD, respectively (Figure 12d). These findings highlight the significant variation in NDVI, EVI, GOSIF, and GPP reductions across different grassland types within the context of the same level of drought. TS displayed the most substantial decrease ratio, while TMS exhibited the smallest decrease ratio.
We also assessed the reductions in NDVI, EVI, GOSIF, and GPP across TS in June and July 2017. The most significant TS reductions were observed in GOSIF and GPP in June 2017. The average loss of GOSIF and GPP was −39.04% and 39.14% during extreme drought conditions and −23.09% and −17.9% during severe drought (Figure 13a). Similar results were also found for July 2017: the average loss of GOSIF and GPP was −40.39% and 46.51% during extreme drought conditions and −9.84% and −8.99% during severe drought (Figure 13b).

4. Discussion

4.1. NDVI, EVI, GOSIF, and GPP Loss at Different Drought Levels

NDVI, EVI, GOSIF, and GPP showed an increasing trend from 2002 to 2020, indicating an improvement in vegetation growth (Figure 3). This can be explained by the increased rainfall and ecological protection in the study area [26,58]. Lower values of NDVI, EVI, GOSIF, and GPP were found in 2007, 2009, 2016, and 2017, which may be correlated with the large-scale droughts in these years [59]. The results indicate that droughts are the key drivers of vegetation change in Inner Mongolia, which has been reported in previous research [26,60]. In this study, an overall decrease in grassland vegetation growth during the 2007 and 2017 drought events was found in Inner Mongolia (Figure 8 and Figure 10). This finding aligns with similar observations in other regions, such as southwest or northern China, Midwestern U.S., the tropical Amazon, and temperate Europe [2,61,62]. Moreover, we found that the decrease in grassland GOSIF was much more substantial than that observed in NDVI and EVI during the 2007 and 2017 drought events (Figure 9 and Figure 11). This heightened sensitivity of GOSIF to drought events in Inner Mongolia’s grassland is significant. SIF captures information about vegetation photosynthesis, such as Absorbed Photosynthetically Active Radiation (FPAR) and light use efficiency [63]. As a sensitive indicator of vegetation photosynthesis, SIF can more realistically and sensitively reflect variations in canopy photosynthesis compared to traditional vegetation indices [19]. For example, studies conducted in Midwestern U.S. and Hulun Buir grassland have demonstrated that GOSIF is more sensitive to drought than NDVI and EVI [20,62]. Previous studies have also highlighted the superior performance of SIF in capturing variations in GPP during drought events [37,62]. Our findings further support the viewpoint, as the trend of GPP closely aligns with that of GOSIF for the 2007 and 2017 drought events (Figure 9 and Figure 11). The significant correlation between droughts and GOSIF also supports previous studies, suggesting that GOSIF has the advantage in assessing drought-induced stress on vegetation in the Yellow River Basin [64], the three-River Headwaters Region, China [65], and Europe [66].

4.2. NDVI, EVI, GOSIF, and GPP Response under Different Drought Severities

This study also quantified the grassland NDVI, EVI, GOSIF, and GPP losses under different drought severity levels, and reductions varied with grassland type within the context of the same drought level, which is critical for identifying grasslands most sensitive to severe and extreme drought events (Table 2 and Figure 12). Our findings confirmed that NDVI, EVI, GOSIF, and GPP all exhibited a substantial decrease as drought severity increased, which is consistent with previous research [10,25]. For different grassland types, TS ecosystems were the most vulnerable to severe and extreme droughts in Inner Mongolia. TS regions, primarily studied in the semi-arid region of central Inner Mongolia (Figure 1b), displayed the highest reduction rates. This heightened vulnerability can be attributed to the unique characteristics of semi-arid ecosystems, which tend to exhibit the most pronounced physiological and functional responses to drought stress [67,68]. These findings align with similar observations in other semi-arid regions, such as southeastern Australia and northern China [69,70].
The TSD ecosystems exhibited the second-largest reduction in response to drought. TSD regions are mostly found in the arid western part of Inner Mongolia (Figure 1). While TSD ecosystems have adapted to living in arid conditions, extreme or severe droughts can still have detrimental effects. These conditions can lead to structural changes and reduced photosynthesis, as observed in our study and supported by previous research [25,67].

4.3. Uncertainties

While this study provides valuable insights into NDVI, EVI, GOSIF, and GPP trends and their responses to droughts in Inner Mongolia grassland, several limitations should be considered. Firstly, the GOSIF dataset, while offering continuity in spatiotemporal distribution, features a relatively coarse resolution (0.05° × 0.05°). Additionally, GOSIF is derived from a machine learning method based on OCO-2 satellite data, which introduces certain internal uncertainties [23,33]. Secondly, previous studies have found that the grasslands in Inner Mongolia may experience compound droughts [71]. This study focused on the response to individual drought events, and further research should investigate how grassland vegetation responds to these more complex and compounded drought scenarios (such as integration of soil moisture and SPEI). Moreover, this study assessed the impact of SPEI on grassland vegetation. The vapor pressure deficit (VPD), soil moisture, and human activities can also affect vegetation growth [72,73,74,75], and ignoring these variables will inevitably result in some uncertainties in the presented results. Therefore, these questions will need to be discussed and analyzed in future studies.

5. Conclusions

In this study, we utilized NDVI, EVI, GOSIF, GPP, and drought indices to assess the spatiotemporal evolution patterns of grassland dynamics and the effect of drought events on grassland ecosystems in Inner Mongolia of China. This study shows that NDVI, EVI, GOSIF, and GPP exhibited significant increasing trends from 2000 to 2020 in 25.83%, 21.18%, 22.65%, and 48.13% of the grassland areas, respectively. Compared with NDVI and EVI, the responses of GOSIF to drought was more intense, and it better reflected the impact of drought events on grassland photosynthesis in 2007 and 2017. The reductions in NDVI, EVI, GOSIF, and GPP intensified as drought severity levels increased. The influence of drought events on NDVI, EVI, GOSIF, and GPP reductions in different grassland types under extreme drought conditions was obviously different, and the effects of different drought levels in the same grassland type were also different. These findings underscore the critical importance of effectively managing land carbon cycling and addressing the challenges posed by climate change, particularly in regions like Inner Mongolia where grassland ecosystems play a vital role.

Supplementary Materials

The following supporting information can be downloaded at: https://www.mdpi.com/article/10.3390/atmos14111613/s1, Figure S1: The correlation coefficient between CCI-SM and in-situ data in Inner Mongolia from 2000 to 2010.

Author Contributions

Conceptualization, A.Z. and X.Z.; methodology, A.Z.; software, R.X.; validation, A.Z., R.X. and L.Z.; formal analysis, R.X.; investigation, R.X.; resources, X.Z.; data curation, A.Z.; writing—original draft preparation, L.Z.; writing—review and editing, A.Z.; visualization, A.Z.; supervision, A.Z.; project administration, X.Z.; funding acquisition. All authors have read and agreed to the published version of the manuscript.

Funding

This research was funded by the National Key Research and Development Program of China, grant number 2021YFB3901201; the National Natural Science Foundation of Hebei Province, China, grant number D2022402030; and the Guangdong Basic and Applied Basic Research Foundation, grant number 2021A1515110769.

Institutional Review Board Statement

Not applicable.

Informed Consent Statement

Not applicable.

Data Availability Statement

All of the data used in this study are publicly available. The data presented in this study are available in Section 2.2.

Conflicts of Interest

The authors declare no conflict of interest.

References

  1. Heim, R.R., Jr. A review of twentieth-century drought indices used in the United States. Bull. Am. Meteorol. Soc. 2002, 83, 1149–1166. [Google Scholar] [CrossRef]
  2. Li, X.; Li, Y.; Chen, A.; Gao, M.; Slette, I.J.; Piao, S. The impact of the 2009/2010 drought on vegetation growth and terrestrial carbon balance in Southwest China. Agric. For. Meteorol. 2019, 269, 239–248. [Google Scholar] [CrossRef]
  3. West, H.; Quinn, N.; Horswell, M. Remote sensingfor drought monitoring & impact assessment: Progress, past challenges and future opportunities. Remote Sens. Environ. 2019, 232, 111291. [Google Scholar] [CrossRef]
  4. AghaKouchak, A.; Huning, L.S.; Sadegh, M.; Qin, Y.; Markonis, Y.; Vahedifard, F.; Love, C.A.; Mishra, A.; Mehran, A.; Obringer, R.; et al. Toward impact-based monitoring of drought and its cascading hazards. Nat. Rev. Earth Environ. 2023, 4, 582–595. [Google Scholar] [CrossRef]
  5. Bennett, A.C.; McDowell, N.G.; Allen, C.D.; Anderson-Teixeira, K.J. Larger treessuffer most during drought in forests worldwide. Nat. Plants 2015, 1, 15139. [Google Scholar] [CrossRef] [PubMed]
  6. Feng, W.; Lu, H.; Yao, T.; Yu, Q. Drought characteristicsand its elevation dependence in the Qinghai–Tibet plateau during the last half-century. Sci. Rep. 2020, 10, 14323. [Google Scholar] [CrossRef] [PubMed]
  7. Liu, Y.; Dang, C.; Yue, H.; Lyu, C.; Dang, X. Enhanced droughtdetection and monitoring using sun-induced chlorophyll fluorescence over Hulun Buir Grassland, China. Sci. Total Environ. 2021, 770, 145271. [Google Scholar] [CrossRef]
  8. Vicente-Serrano, S.M.; Quiring, S.M.; Pena-Gallardo, M.; Yuan, S.; Dominguez-Castro, F. A reviewof environmental droughts: Increased risk under global warming? Earth-Sci. Rev. 2020, 201, 102953. [Google Scholar] [CrossRef]
  9. Cao, D.; Zhang, J.; Han, J.; Zhang, T.; Yang, S.; Wang, J.; Prodhan, F.A.; Yao, F. Projected increasesin global terrestrial net primary productivity loss caused by drought under climate change. Earths Future 2022, 10, e2022EF002681. [Google Scholar] [CrossRef]
  10. Lei, T.; Feng, J.; Lv, J.; Wang, J.; Song, H.; Song, W.; Gao, X. Net PrimaryProductivity Loss under different drought levels in different grassland ecosystems. J. Environ. Manag. 2020, 274, 111144. [Google Scholar] [CrossRef]
  11. Wang, X.; Pan, S.; Pan, N.; Pan, P. Grassland productivityresponse to droughts in northern China monitored by satellite-based solar-induced chlorophyll fluorescence. Sci. Total Environ. 2022, 830, 154550. [Google Scholar] [CrossRef] [PubMed]
  12. Deng, L.; Shangguan, Z.; Bell, S.M.; Soromotin, A.V.; Peng, C.; An, S.; Wu, X.; Xu, X.; Wang, K.; Li, J.; et al. Carbon in Chinese grasslands: Meta-analysis and theory of grazing effects. Carbon Res. 2023, 2, 19. [Google Scholar] [CrossRef]
  13. Sun, J.; Liu, W.; Pan, Q.; Zhang, B.; Lv, Y.; Huang, J.; Han, X. Positive legaciesof severe droughts in the Inner Mongolia grassland. Sci. Adv. 2022, 8, eadd6249. [Google Scholar] [CrossRef] [PubMed]
  14. Da Silva, J.L.B.; Moura, G.B.d.A.; da Silva, M.V.; de Oliveira-Júnior, J.F.; Jardim, A.M.d.R.F.; Refati, D.C.; Lima, R.d.C.C.; de Carvalho, A.A.; Ferreira, M.B.; de Brito, J.I.B.; et al. Environmental Degradation of Vegetation Cover and Water Bodies in the Semiarid Region of the Brazilian Northeast via Cloud Geoprocessing Techniques Applied to Orbital Data. J. S. Am. Earth Sci. 2023, 121, 104164. [Google Scholar] [CrossRef]
  15. AghaKouchak, A.; Farahmand, A.; Melton, F.S.; Teixeira, J.; Anderson, M.C.; Wardlow, B.D.; Hain, C.R. Remote sensingof drought: Progress, challenges and opportunities. Rev. Geophys. 2015, 53, 452–480. [Google Scholar] [CrossRef]
  16. Jiao, W.; Wang, L.; McCabe, M.F. Multi-sensor remote sensing for drought characterization: Current status, opportunities and a roadmap for the future. Remote. Sens. Environ. 2021, 256, 112313. [Google Scholar] [CrossRef]
  17. Jiao, W.; Wang, L.; Smith, W.K.; Chang, Q.; Wang, H.; D’Odorico, P. Observed increasingwater constraint on vegetation growth over the last three decades. Nat. Commun. 2021, 12, 3777. [Google Scholar] [CrossRef]
  18. Meroni, M.; Rossini, M.; Guanter, L.; Alonso, L.; Rascher, U.; Colombo, R.; Moreno, J. Remote sensing of solar-induced chlorophyll fluorescence: Review of methods and applications. Remote. Sens. Environ. 2009, 113, 2037–2051. [Google Scholar] [CrossRef]
  19. Xu, H.J.; Wang, X.P.; Zhao, C.Y. Drought sensitivityof vegetation photosynthesis along the aridity gradient in northern China. Int. J. Appl. Earth Obs. 2021, 102, 102418. [Google Scholar] [CrossRef]
  20. Liu, Y.; You, C.; Zhang, Y.; Chen, S.; Zhang, Z.; Li, J.; Wu, Y. Resistance andresilience of grasslands to drought detected by SIF in inner Mongolia, China. Agric. For. Meteorol. 2021, 308–309, 108567. [Google Scholar] [CrossRef]
  21. Zhao, A.; Wang, D.; Xiang, K.; Zhang, A. Vegetation photosynthesischanges and response to water constraints in the Yangtze River and Yellow River Basin, China. Ecol. Indic. 2022, 143, 109331. [Google Scholar] [CrossRef]
  22. Mohammed, G.H.; Colombo, R.; Middleton, E.M.; Rascher, U.; van der Tol, C.; Nedbal, L.; Goulas, Y.; Pérez-Priego, O.; Damm, A.; Meroni, M.; et al. Remote sensing of solar-induced chlorophyll fluorescence (SIF) in vegetation: 50 years of progress. Remote Sens. Environ. 2019, 231, 111177. [Google Scholar] [CrossRef] [PubMed]
  23. Zhang, T.; Zhou, J.; Yu, P.; Li, J.; Kang, Y.; Zhang, B. Response of ecosystem gross primary productivity to drought in northern China based on multi-source remote sensing data. J. Hydrol. 2023, 616, 128808. [Google Scholar] [CrossRef]
  24. Wang, Q.; Zeng, J.; Qi, J.; Zhang, X.; Zeng, Y.; Shui, W.; Xu, Z.; Zhang, R.; Wu, X.; Cong, J. A multi-scale daily SPEI dataset for drought characterization at observation stations over mainland China from 1961 to 2018. Earth. Syst. Sci. Data 2021, 13, 331–341. [Google Scholar] [CrossRef]
  25. Wang, S.; Li, R.; Wu, Y.; Zhao, S. Vegetation dynamicsand their response to hydrothermal conditions in Inner Mongolia, China. Glob. Ecol. Conserv. 2022, 34, e02034. [Google Scholar] [CrossRef]
  26. Tong, S.; Bao, G.; Bao, Y.; Huang, X. Monitoring oflong-term vegetation dynamics and responses to droughts of various timescales in Inner Mongolia. Ecosphere 2023, 14, e4415. [Google Scholar] [CrossRef]
  27. Tong, S.; Zhang, J.; Bao, Y. Inter-decadal spatiotemporal variations of aridity based on temperature and precipitation in Inner Mongolia, China. Pol. J. Environ. Stud. 2017, 26, 819–826. [Google Scholar] [CrossRef]
  28. Bian, Y.; Dai, H.; Zhang, Q.; Yang, L.; Du, W. Spatial distributionof potential evapotranspiration trends in the Inner Mongolia Autonomous Region (1971–2016). Theor. Appl. Climatol. 2020, 140, 1161–1169. [Google Scholar] [CrossRef]
  29. Chen, X.; Peng, J.; Li, H. Seasonal andregional differences of air temperature changes in Inner Mongolia. Geogr. Res. 2009, 28, 27–35. [Google Scholar]
  30. Cai, S.; Song, X.; Hu, R.; Leng, P.; Li, X.; Guo, D.; Zhang, Y.; Hao, Y.; Wang, Y. Spatiotemporal characteristicsof agricultural droughts based on soil moisture data in Inner Mongolia from 1981 to 2019. J. Hydrol. 2021, 603, 127104. [Google Scholar] [CrossRef]
  31. Holben, B.N. Characteristics ofmaximum-value composite images from temporal AVHRR data. Int. J. Remote Sens. 1986, 7, 1417–1434. [Google Scholar] [CrossRef]
  32. Li, M.; Chu, R.; Sha, X.; Xie, P.; Ni, F.; Wang, C.; Jiang, Y.; Shen, S.; Islam, A.R.M.T. Monitoring 2019 Drought and Assessing Its Effects on Vegetation Using Solar-Induced Chlorophyll Fluorescence and Vegetation Indexes in the Middle and Lower Reaches of Yangtze River, China. Remote. Sens. 2022, 14, 2569. [Google Scholar] [CrossRef]
  33. Li, X.; Xiao, J. A global, 0.05-degree product of solar-induced chlorophyll fluorescence derived from OCO-2, MODIS, and reanalysis data. Remote Sens. 2019, 11, 517. [Google Scholar] [CrossRef]
  34. Mohammadi, K.; Jiang, Y.; Wang, G. Flash droughtearly warning based on the trajectory of solar-induced chlorophyll fluorescence. Proc. Natl. Acad. Sci. USA 2022, 119, e2202767119. [Google Scholar] [CrossRef]
  35. Yao, T.; Liu, S.; Hu, S.; Mo, X. Response ofvegetation ecosystems to flash drought with solar-induced chlorophyll fluorescence over the Hai River Basin, China during 2001–2019. J. Environ. Manag. 2022, 313, 114947. [Google Scholar] [CrossRef]
  36. Vicente-Serrano, S.M.; Beguería, S.; López-Moreno, J.I. A multiscalardrought index sensitive to global warming: The standardized precipitation evapotranspiration index. J. Clim. 2010, 23, 1696–1718. [Google Scholar] [CrossRef]
  37. Zhang, R.; Bento, V.A.; Qi, J.; Xu, F.; Wu, J.; Qiu, J.; Li, J.; Shui, W.; Wang, Q. The firsthigh spatial resolution multi-scale daily SPI and SPEI raster dataset for drought monitoring and evaluating over China from 1979 to 2018. Big Earth Data 2023, 7, 860–885. [Google Scholar] [CrossRef]
  38. Hua, T.; Wang, X.; Zhang, C.; Lang, L.; Li, H. Responses of vegetation activity to drought in northern China. Land Degrad. Dev. 2017, 28, 1913–1921. [Google Scholar] [CrossRef]
  39. Li, C.; Leal Filho, W.; Yin, J.; Hu, R.; Wang, J.; Yang, C.; Li, S.; Ayal, D.Y. Assessing vegetation response to multi-time-scale drought across inner Mongolia plateau. J. Clean. Prod. 2017, 179, 210–216. [Google Scholar] [CrossRef]
  40. Mohammed, S.; Alsafadi, K.; Enaruvbe, G.O.; Bashir, B.; Elbeltagi, A.; Széles, A.; Alsalman, A.; Harsanyi, E. Assessing theimpacts of agricultural drought (SPI/SPEI) on maize and wheat yields across Hungary. Sci. Rep. 2022, 12, 8838. [Google Scholar] [CrossRef]
  41. Musei, S.K.; Nyaga, J.M.; Dubow, A.Z. SPEI-based spatial and temporal evaluation of drought in Somalia. J. Arid. Environ. 2021, 184, 104296. [Google Scholar] [CrossRef]
  42. Zuo, D.; Cai, S.; Xu, Z.; Peng, D.; Kan, G.; Sun, W.; Pang, B.; Yang, H. Assessment of meteorological and agricultural droughts using in-situ observations and remote sensing data. Agric. Water Manag. 2019, 222, 125–138. [Google Scholar] [CrossRef]
  43. Dorigo, W.; Wagner, W.; Albergel, C.; Albrecht, F.; Balsamo, G.; Brocca, L.; Chung, D.; Ertl, M.; Forkel, M.; Gruber, A.; et al. ESA CCI Soil Moisture for improved Earth system understanding: State-of-the art and future directions, Remote. Sens. Environ. 2017, 203, 185–215. [Google Scholar] [CrossRef]
  44. Liu, K.; Li, X.; Wang, S.; Zhang, H. A robustgap-filling approach for European Space Agency Climate Change Initiative (ESA CCI) soil moisture integrating satellite observations, model-driven knowledge, and spatiotemporal machine learning. Hydrol. Earth Syst. Sci. 2023, 27, 577–598. [Google Scholar] [CrossRef]
  45. González-Zamora, Á.; Sanchez, N.; Pablos, M.; Martínez-Fernández, J. CCI soilmoisture assessment with SMOS soil moisture and in situ data under different environmental conditions and spatial scales in Spain. Remote Sens. Environ. 2019, 225, 469–482. [Google Scholar] [CrossRef]
  46. Zhang, L.; Liu, Y.; Ren, L.; Jiang, S.; Yang, X.; Yuan, F.; Wang, M.; Wei, L. Drought monitoringand evaluation by ESA CCI soil moisture products over the Yellow River Basin. IEEE J. Sel. Top. Appl. Earth Obs. Remote Sens. 2019, 12, 3376–3386. [Google Scholar] [CrossRef]
  47. Luo, M.; Sa, C.; Meng, F.; Duan, Y.; Liu, T.; Bao, Y. Assessing remotely sensed and reanalysis products in characterizing surface soil moisture in the Mongolian Plateau. Int. J. Digit. Earth 2021, 14, 1255–1272. [Google Scholar] [CrossRef]
  48. Zhang, H.; Kattel, G.R.; Wang, G.; Chuai, X.; Zhang, Y.; Miao, L. Enhanced soil moisture improves vegetation growth in an arid grassland of Inner Mongolia Autonomous Region, China. J. Arid. Land 2023, 15, 871–885. [Google Scholar] [CrossRef]
  49. Ling, X.; Huang, Y.; Guo, W.; Wang, Y.; Chen, C.; Qiu, B.; Ge, J.; Qin, K.; Xue, Y.; Peng, J. Comprehensive evaluation of satellite-based and reanalysis soil moisture products using in situ observations over China. Hydrol. Earth Syst. Sci. 2021, 25, 4209–4229. [Google Scholar] [CrossRef]
  50. Trabucco, A.; Zomer, R.J. Global Aridity Index (Global-Aridity) and Global Potential Evapotranspiration (Global-PET) Geospatial Database; CGIAR Consortium for Spatial Information: Lima, Peru, 2009. [Google Scholar]
  51. Sun, Z.; Long, D.; Yang, W.; Li, X.; Pan, Y. Reconstruction ofGRACE data on changes in total water storage over the global land surface and 60 basins. Water Resour. Res. 2020, 55, e2019WR026250. [Google Scholar] [CrossRef]
  52. Li, S.; Xie, Y.; Brown, D.G.; Bai, Y.; Hua, J.; Judd, K. Spatial variabilityof the adaptation of grassland vegetation to climatic change in Inner Mongolia of China. Appl. Geogr. 2013, 43, 1–12. [Google Scholar] [CrossRef]
  53. Xie, Y.; Zhang, Y.; Lan, H.; Mao, L.; Zeng, S.; Chen, Y. Investigating long-term trends of climate change and their spatial variations caused by regional and local environments through data mining. J. Geogr. Sci. 2018, 28, 802–818. [Google Scholar] [CrossRef]
  54. Feng, D.; Wang, J.; Fu, M.; Liu, G.; Zhang, M.; Tang, R. Spatiotemporal variationand influencing factors of vegetation cover in the ecologically fragile areas of China from 2000 to 2015: A case study in Shaanxi Province. Environ. Sci. Pollut. Res. 2019, 26, 28977–28992. [Google Scholar] [CrossRef] [PubMed]
  55. Yin, S.; Guo, M.; Wang, X.; Yamamoto, H.; Ou, W. Spatiotemporal variationand distribution characteristics of crop residue burning in China from 2001 to 2018. Environ. Pollut. 2021, 268, 115849. [Google Scholar] [CrossRef] [PubMed]
  56. Meng, N.; Wang, N.A.; Cheng, H.; Liu, X.; Niu, Z. Impacts ofclimate change and anthropogenic activities on the normalized difference vegetation index of desertified areas in northern China. J. Geogr. Sci. 2023, 33, 483–507. [Google Scholar] [CrossRef]
  57. Wang, X.; Qiu, B.; Li, W.; Zhang, Q. Impacts ofdrought and heatwave on the terrestrial ecosystem in China as revealed by satellite solar-induced chlorophyll fluorescence. Sci. Total Environ. 2019, 693, 133627. [Google Scholar] [CrossRef]
  58. Huang, J.; Xue, Y.; Sun, S.; Zhang, J. Spatial and temporal variability of drought during 1960–2012 in Inner Mongolia, north China. Quat. Int. 2015, 355, 134–144. [Google Scholar] [CrossRef]
  59. Kang, Z.; Zhang, S.; Bai, Y.; Malak, H.; Zhang, J. Spatio-temporal Changes of Grassland Net Primary Prod luctivity (NPP) in Inner Mongolia and its Response to Drought. Acta. Agrestia. Sinica 2021, 29, 156–165. [Google Scholar]
  60. Wang, S.; Li, R.; Wu, Y.; Zhao, S. Effects of multi-temporal scale drought on vegetation dynamics in Inner Mongolia from 1982 to 2015, China. Ecol. Indic. 2022, 136, 108666. [Google Scholar] [CrossRef]
  61. Song, L.; Li, Y.; Ren, Y.; Wu, X.; Guo, B.; Tang, X.; Shi, W.; Ma, M.; Han, X.; Zhao, L. Divergent vegetationresponses to extreme spring and summer droughts in Southwestern China. Agric. For. Meteorol. 2019, 279, 107703. [Google Scholar] [CrossRef]
  62. Qiu, R.; Li, X.; Han, G.; Xiao, J.; Ma, X.; Gong, W. Monitoring droughtimpacts on crop productivity of the US Midwest with solar-induced fluorescence: GOSIF outperforms GOME-2 SIF and MODIS NDVI, EVI, and NIRv. Agric. For. Meteorol. 2022, 323, 109038. [Google Scholar] [CrossRef]
  63. Yang, X.; Tang, J.; Mustard, J.F.; Lee, J.E.; Rossini, M.; Joiner, J.; Munger, J.W.; Kornfeld, A.; Richardson, A.D. Solar-induced chlorophyll fluorescence that correlates with canopy photosynthesis on diurnal and seasonal scales in a temperate deciduous forest. Geophys. Res. Lett. 2015, 42, 2977–2987. [Google Scholar] [CrossRef]
  64. Geng, G.; Yang, R.; Liu, L. Downscaled solar-induced chlorophyll fluorescence has great potential for monitoring the response of vegetation to drought in the Yellow River Basin, China: Insights from an extreme event. Ecol. Indic. 2022, 138, 108801. [Google Scholar] [CrossRef]
  65. Miao, J.; An, R.; Zhang, Y.; Xing, F. Substantial Reduction in Vegetation Photosynthesis Capacity during Compound Droughts in the Three-River Headwaters Region, China. Remote Sens. 2023, 15, 4943. [Google Scholar] [CrossRef]
  66. Queißer, M. Deficit in carbon uptake of vegetation on the British Iles during the 2018 European summer drought. Egypt. J. Remote Sens. 2021, 24, 571–578. [Google Scholar] [CrossRef]
  67. Li, W.; Pacheco-Labrador, J.; Migliavacca, M.; Miralles, D.; Hoek van Dijke, A.; Reichstein, M.; Forkel, M.; Zhang, W.; Frankenberg, C.; Panwar, A.; et al. Widespread and complex drought effects on vegetation physiology inferred from space. Nat. Commun. 2023, 14, 4640. [Google Scholar] [CrossRef]
  68. Du, L.; Mikle, N.; Zou, Z.; Huang, Y.; Shi, Z.; Jiang, L.; McCarthy, H.R.; Liang, J.; Luo, Y. Global patternsof extreme drought-induced loss in land primary production: Identifying ecological extremes from rain-use efficiency. Sci. Total Environ. 2018, 628, 611–620. [Google Scholar] [CrossRef]
  69. Xu, H.J.; Wang, X.P.; Zhao, C.Y.; Yang, X.M. Assessing the response of vegetation photosynthesis to meteorological drought across northern China. Land. Degrad. Dev. 2021, 32, 20–34. [Google Scholar] [CrossRef]
  70. Tian, F.; Wu, J.; Liu, L.; Leng, S.; Yang, J.; Zhao, W.; Shen, Q. Exceptional drought across Southeastern Australia caused by extreme lack of precipitation and its impacts on NDVI and SIF in 2018. Remote Sens. 2019, 12, 54. [Google Scholar] [CrossRef]
  71. Liu, X.; Sun, G.; Fu, Z.; Ciais, P.; Feng, X.; Li, J.; Fu, B. Compound droughtsslow down the greening of the Earth. Glob. Change Biol. 2023, 29, 3072–3084. [Google Scholar] [CrossRef]
  72. Ge, W.; Deng, L.; Wang, F.; Han, J. Quantifying thecontributions of human activities and climate change to vegetation net primary productivity dynamics in China from 2001 to 2016. Sci. Total Environ. 2021, 773, 145648. [Google Scholar] [CrossRef] [PubMed]
  73. Liu, L.; Gudmundsson, L.; Hauser, M.; Qin, D.; Li, S.; Seneviratne, S.I. Soil moisturedominates dryness stress on ecosystem production globally. Nat. Commun. 2020, 11, 4892. [Google Scholar] [CrossRef]
  74. Zhong, Z.; He, B.; Wang, Y.P.; Chen, H.W.; Chen, D.; Fu, Y.H.; Chen, Y.; Guo, L.; Deng, Y.; Huang, L.; et al. Disentangling the effects of vapor pressure deficit on northern terrestrial vegetation productivity. Sci. Adv. 2023, 9, eadf316. [Google Scholar] [CrossRef] [PubMed]
  75. Santos, R.C.; Lopes, A.L.; Sanches, A.C.; Gomes, E.P.; da Silva, E.A.; da Silva, J.L. Intelligent automated monitoring integrated with animal production facilities. Eng. Agric. 2023, 43, e20220225. [Google Scholar] [CrossRef]
Figure 1. Spatial pattern of grassland types (a) and climate class (b) in Inner Mongolia of China.
Atmosphere 14 01613 g001
Figure 2. Temporal trends of monthly average grassland (a) NDVI, EVI, (b) GOSIF, and GPP from 2002 to 2020.
Atmosphere 14 01613 g002
Figure 3. Temporal variations of annual maximum (a) NDVI, EVI, (b) GOSIF, and GPP during 2002 to 2020.
Atmosphere 14 01613 g003
Figure 4. Spatial patterns and change trends of grassland NDVI (a,e), EVI (b,f), GOSIF (c,g), and GPP (d,h) with 0.05° spatial resolution in Inner Mongolia between 2002 and 2020.
Atmosphere 14 01613 g004
Figure 5. Temporal changes of SPEI-1 (a), SPEI-3 (b), SPEI-12 (c) and SACCI-SM (d) at monthly, seasonal, and annual scales.
Atmosphere 14 01613 g005
Figure 6. Spatial pattern of SPEI-3 (0.5° spatial resolution) (ad) and SACCI-SM (0.25° spatial resolution) (eh) in June, July, August, and September 2007.
Atmosphere 14 01613 g006
Figure 7. Spatial pattern of SPEI-3 (0.5° spatial resolution) (a,b) and SACCI-SM (0.25° spatial resolution) (c,d) in June and July 2017.
Atmosphere 14 01613 g007
Figure 8. The spatial distributions of SA for NDVI (ad), EVI (eh), GOSIF (il), and GPP (mp) in June, July, August, and September 2007.
Atmosphere 14 01613 g008aAtmosphere 14 01613 g008b
Figure 9. Temporal variation of NDVI (a,b), EVI (c,d), GOSIF (e,f), GPP (g,h), and SM (i,j) during the June, July, August, and September drought in 2007. Δ is the different between values of monthly NDVI, EVI, GOSIF, and GPP in May, June, July, August, September, and October 2007 and multi-year monthly average values of NDVI, EVI, GOSIF, GPP, and SM from 2002 to 2020.
Atmosphere 14 01613 g009
Figure 10. The spatial distributions of SA for NDVI (a,b), EVI (c,d), GOSIF (e,f), and GPP (g,h) in June and July 2017.
Atmosphere 14 01613 g010
Figure 11. Temporal variation of NDVI (a,b), EVI (c,d), GOSIF (e,f), GPP (g,h), and SM (i,j)during the May to October drought in 2017. Δ is the different between values of monthly NDVI, EVI, GOSIF, and GPP in May, June, July, August, September, and October 2017 and multi-year monthly average values of NDVI, EVI, GOSIF, GPP, and SM from 2002 to 2020.
Atmosphere 14 01613 g011
Figure 12. NDVI (a), EVI (b), GOSIF (c), and GPP (d) reductions (%) in different grassland types along the drought severity gradient.
Atmosphere 14 01613 g012
Figure 13. Reductions in NDVI, EVI, GOSIF, and GPP across TS in June (a) and July (b) 2017.
Atmosphere 14 01613 g013
Table 1. Classification of drought levels based on the SPEI values.
ClassificationSPEI ValueStatus
1SPEI ≥ −0.5No drought
2−0.5 < SPEI ≤ −1.0Mild drought
3−1.0 < SPEI ≤ −1.5Moderate drought
4−1.5 < SPEI ≤ −2.0Severely drought
5SPEI ≤ −2.0Extreme drought
Table 2. The NDVI, EVI, GOSIF, and GPP reductions along the different drought levels in Inner Mongolia grassland.
Moderate DroughtSevere DroughtExtreme Drought
NDVI8.82%14.46%26.81%
EVI8.71%15.04%27.11%
GOSIF20.58%22.83%67.31%
GPP10.52%18.01%27.05%
Disclaimer/Publisher’s Note: The statements, opinions and data contained in all publications are solely those of the individual author(s) and contributor(s) and not of MDPI and/or the editor(s). MDPI and/or the editor(s) disclaim responsibility for any injury to people or property resulting from any ideas, methods, instructions or products referred to in the content.

