Article

Atmospheric Circulation Patterns during the Summertime Precipitation in Southeastern Iran

by
Mohammad Hasan Mahoutchi
1,
Esmaeil Abbasi
2,
Faramarz Khoshakhlagh
1,
Iman Rousta
3,*,
Haraldur Olafsson
4,
Piotr Baranowski
5 and
Jaromir Krzyszczak
5,*
1
Faculty of Geography, University of Tehran, Azin Alley, Vesal Shirazi St. Enqelab St, Tehran P.O. Box 141556465, Iran
2
Department of Environmental Science, Persian Gulf Research Institute, Persian Gulf University, Bushehr P.O. Box 7516913817, Iran
3
Department of Geography, Yazd University, Yazd P.O. Box 8915818411, Iran
4
Institute for Atmospheric Sciences-Weather and Climate and Department of Physics, University of Iceland and Icelandic Meteorological Office (IMO), Bustadavegur 7, IS-108 Reykjavik, Iceland
5
Institute of Agrophysics, Polish Academy of Sciences, Doświadczalna 4, 20-290 Lublin, Poland
*
Authors to whom correspondence should be addressed.
Atmosphere 2023, 14(11), 1673; https://doi.org/10.3390/atmos14111673
Submission received: 7 August 2023 / Revised: 1 November 2023 / Accepted: 8 November 2023 / Published: 11 November 2023
(This article belongs to the Section Meteorology)

Abstract

:
The accurate recognition of atmospheric circulation patterns is vital for understanding the intricate relationships among various climatic elements. Therefore, the main goal of this study is to comprehensively identify circulation patterns during the occurrence of the summertime Extended Area Precipitation Event (EAPE) in southeastern Iran. The data used in this study encompass precipitation rates from synoptic and rain gauge stations, Geopotential Height (GPH), omega (upward motion speed), u-wind (east-west), and v-wind (north-south) components at different atmospheric levels, along with satellite images from the visible spectrum. In this research, both subjective and objective clustering methods have been utilized to identify synoptic circulation patterns based on 500-hPa GPH data. Summer precipitation was chosen for analysis because its characteristics and relationships with large-scale circulation patterns are less understood compared to those of winter precipitation. Examination of the 500-hPa GPH data for sixty-two identified cases of EAPE over southeast Iran revealed that the causative factors for these events are comprised of five recurring patterns (referred to here for convenience as AP, BP, CP, DP, and EP). Three of these patterns (AP, BP, and DP) significantly contributed to 71% of all EAPE cases. It was evident that the five patterns responsible for creating the EAPE in southeastern Iran had distinct directions.

1. Introduction

Atmospheric circulation plays a vital role in shaping the climate of each region, meaning that the predominant atmospheric circulation pattern in a region reflects the prevailing climatic conditions [1,2,3,4]. Identifying these circulation patterns and understanding how they influence various atmospheric phenomena at different spatial scales is one of the most attractive and practical topics of interest for researchers in the field of atmospheric sciences [5]. The interaction between atmospheric circulations and climatic fluctuations has been a subject of study for many climatologists [2,4,6,7,8,9] and it is very often examined when trying to understand and predict the climate of a specific area. Researchers have also delved into synoptic weather patterns and their connections with meteorological elements, including precipitation [10]. Since precipitation is significantly affected by climatic factors, it is crucial to identify the circulation patterns associated with this meteorological element.
Several studies explored the interactions between circulation patterns and precipitation. Chen et al. [11] demonstrated that the interannual changes in summer precipitation patterns within the South China Sea (SCS) result from a complex interplay of factors, including the South China Sea trough, tropical depressions, and the interaction between the South China Sea trough and easterly waves or tropical depressions. Also, mechanical forcing due to topography, and thermal forcing from the land surface adjacent to the Tibetan Plateau, are considered to play the leading roles in shaping the South Asian Summer Monsoon (SASM) [12,13,14,15]. Yang et al. [16] emphasized the significant influence of the location and intensity of the West Pacific Subtropical High (WPSH) on the type, frequency, and vertical structure of summer precipitation in eastern China. Additionally, Yamada et al. [17] revealed that the frequency of persistent blocking of atmospheric circulation over western Russia can impact the monsoon variability in South Asia, leading to anomalous precipitation events, as it was in the summer of 2010. The dynamics of intense monsoon precipitation events over Pakistan and northwest India during 2010 and 2011 were investigated by Raghavan et al. [18]. They found that interactions between the West Pacific subtropical high (WPSH), the SASM trough, and the sub-tropical westerlies created favorable conditions for the development of convective instabilities over Indo-Pak, ultimately resulting in catastrophic flooding.
The interplay between atmospheric processes and diverse geographical features is particularly evident across the Iranian plateau. These conditions have given rise to a conspicuous range of climates across this vast land [19], especially with regard to precipitation, which exhibits spatial variability and significant changes over time [20]. Climatic studies conducted for Iran focused mainly on the colder months of the year, as not only the majority of annual precipitation is recorded during this period [21], but also extreme precipitation and destructive atmospheric phenomena tend to occur during these months. Conversely, the characteristics of warm-season precipitation, notably during the summer, have been less frequently examined by researchers [20]. Nevertheless, several studies have assessed summertime precipitation in Iran. For example, while investigating rainfall patterns in southwestern Pakistan, Snead [22] considered the occurrence of summer rainfall in the Baluchistan region of Pakistan and the southeastern coasts of Iran as primarily resulting from convective storms. Additionally, he noted the influence of the westward expansion of the Indian monsoon low. Sawyer [23] believed that the intensification of convective activity and increased moisture ascent under subtropical high-pressure systems would elevate the base of the inversion layer to a greater altitude, ultimately leading to the occurrence of convective precipitation.
Taghizadeh [24], who delved into the precipitation of August 1987, pointed to the dynamic interaction between pressure systems in the middle and lower latitudes. Parvand [25], while exploring summer precipitation in southeastern Iran, concluded that this precipitation has occurred due to the expansion of southwestern monsoons. Junbakhsh [26] considered the torrential precipitations of August 1995 in Lar City as a result of the interaction between pressure systems at medium and low latitudes. Saligheh [27,28] brought to light how the summer monsoon precipitations of South Asia affect southeastern Iran through two patterns: (a) the monsoon low-pressure system extending over parts of Iran, combined with a prevailing high-pressure system in northwest Iran; (b) the monsoon low-pressure system transporting moisture from the Indian Ocean and the Bay of Bengal to southeastern Iran. The ground heating leads to the formation of a heat low, driving the ascent of monsoon moisture-laden weather. Furthermore, Saligheh [29] demonstrated how the infiltration of moisture, driven by Pakistan’s low-pressure cyclonic movement from the east, contributes to summer precipitations in southeastern Iran. Arabi [30] showcased the expansion and penetration of the monsoon low-pressure system from the south and southeast, combined with the migration of high-pressure systems from the north, resulting in precipitation. The high-pressure system ushers in cold air, while the monsoon low-pressure system facilitates the inflow of moisture from the Indian Ocean into Iran. Saligheh [31] identified that a part of the precipitation in southeastern Iran was due to the monsoon low-pressure system originating in India. Mofidi [20] pointed out that the location and intensity, or lack thereof, of the Turkmenistan anticyclone and the quasi-stationary trough over eastern Turkey at the 700 hPa level were more crucial for the occurrence of summer precipitation in Iran compared to other factors. His findings contradicted previous results, indicating that only 15% of the summer precipitation in the heart of the Iranian plateau could be attributed to India’s monsoon lows and the SASM heating system. AfsharManesh [32] used principal component analysis and demonstrated that the synoptic patterns of precipitation in southeastern Iran encompass four patterns: low pressure, blocking, monsoon low, and Pakistan low pressure. Alijani et al. [33,34] revealed a close relationship between monthly and year-to-year variations in summer precipitation in southeastern Iran and changes in monsoon intensity on the Indian subcontinent. Abkharabat et al. [35] indicated that summer precipitation in southeast Iran coincides with the expansion of the low-pressure system over the Gang region in eastern Iran, extending from the ground level up to 850 hPa, while at middle and upper atmospheric levels the presence of a trough from the westerly wave does not persist in the area. Armesh et al. [36] pointed out that an expansion of the low-pressure systems over the Persian Gulf and Pakistan at ground level and the extension of the high-pressure zone from Turkey along the Zagros Mountains in a northwest-southeast direction across Iran has caused a monsoon expansion. KhoshAkhlagh et al. [37] showed that three synoptic patterns, including the trough, monsoon system, and high-pressure systems, play a pivotal role in the occurrence of precipitation in southeastern Iran.
The main purpose of this study is to comprehensively identify the atmospheric circulation patterns during the summertime EAPE in southeastern Iran and to seek to unravel the mechanism that governs the summertime EAPE in this region and its relationship with the summer atmospheric circulation structure.

2. Materials and Methods
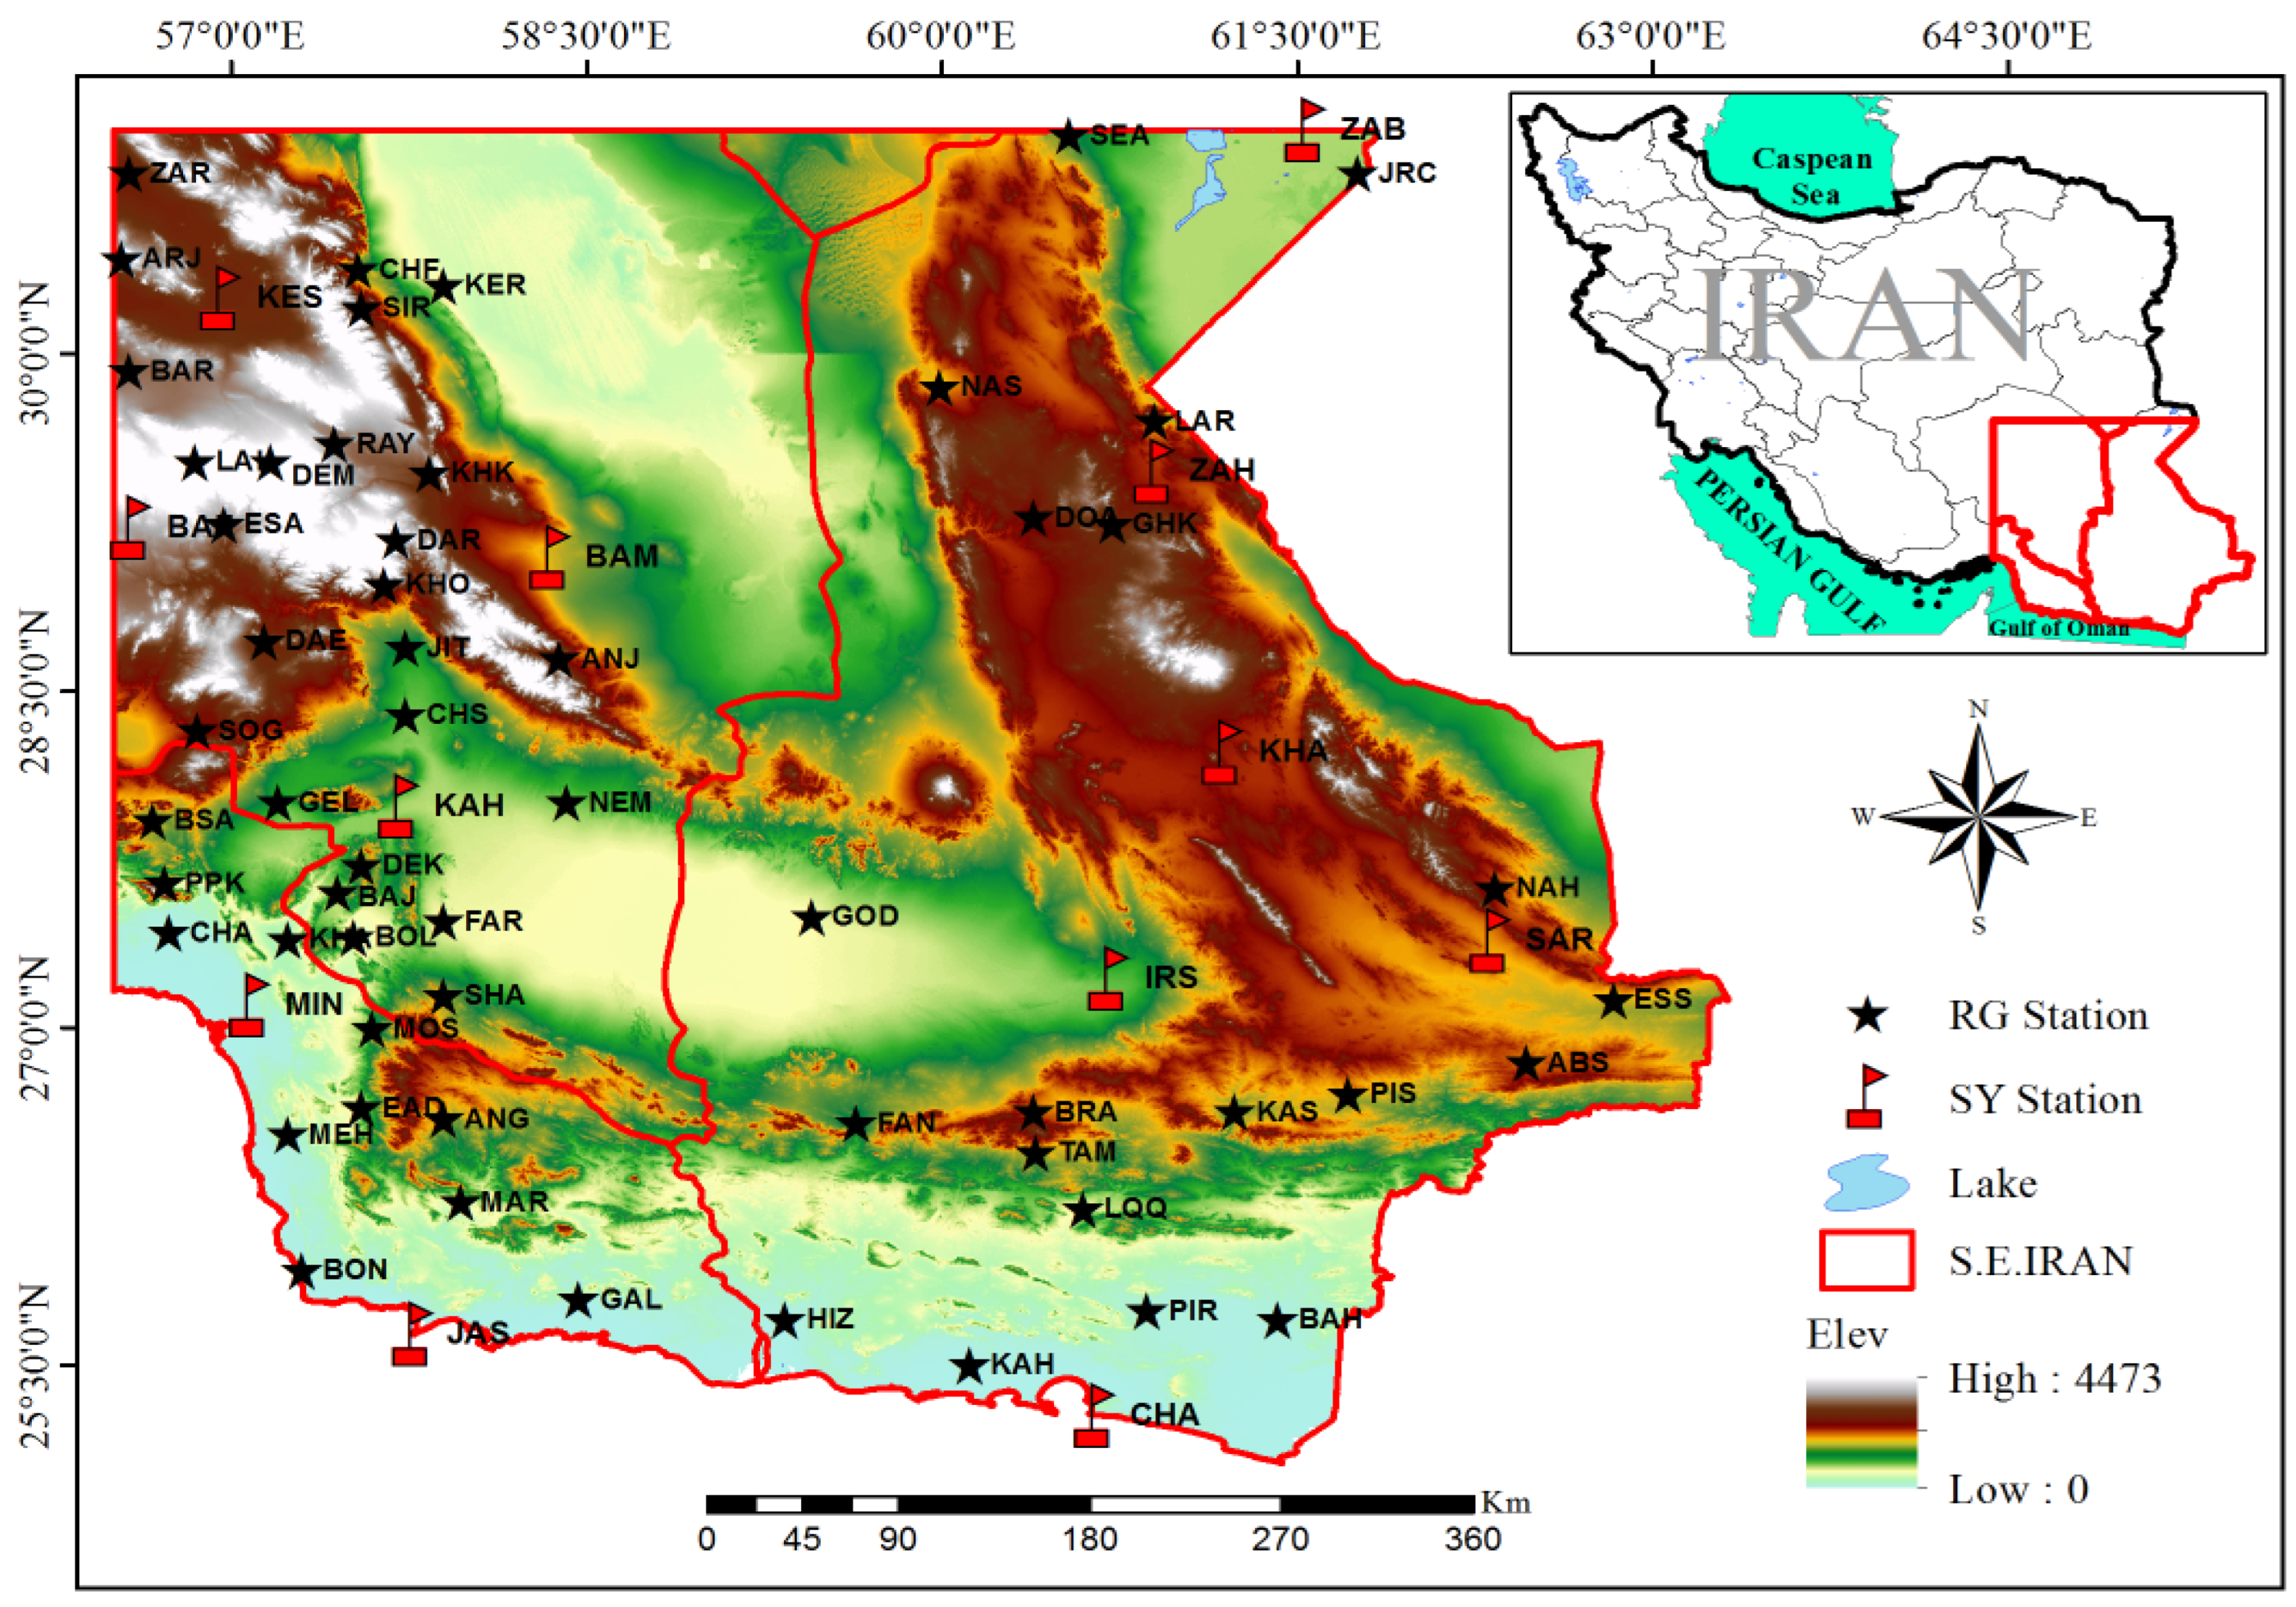
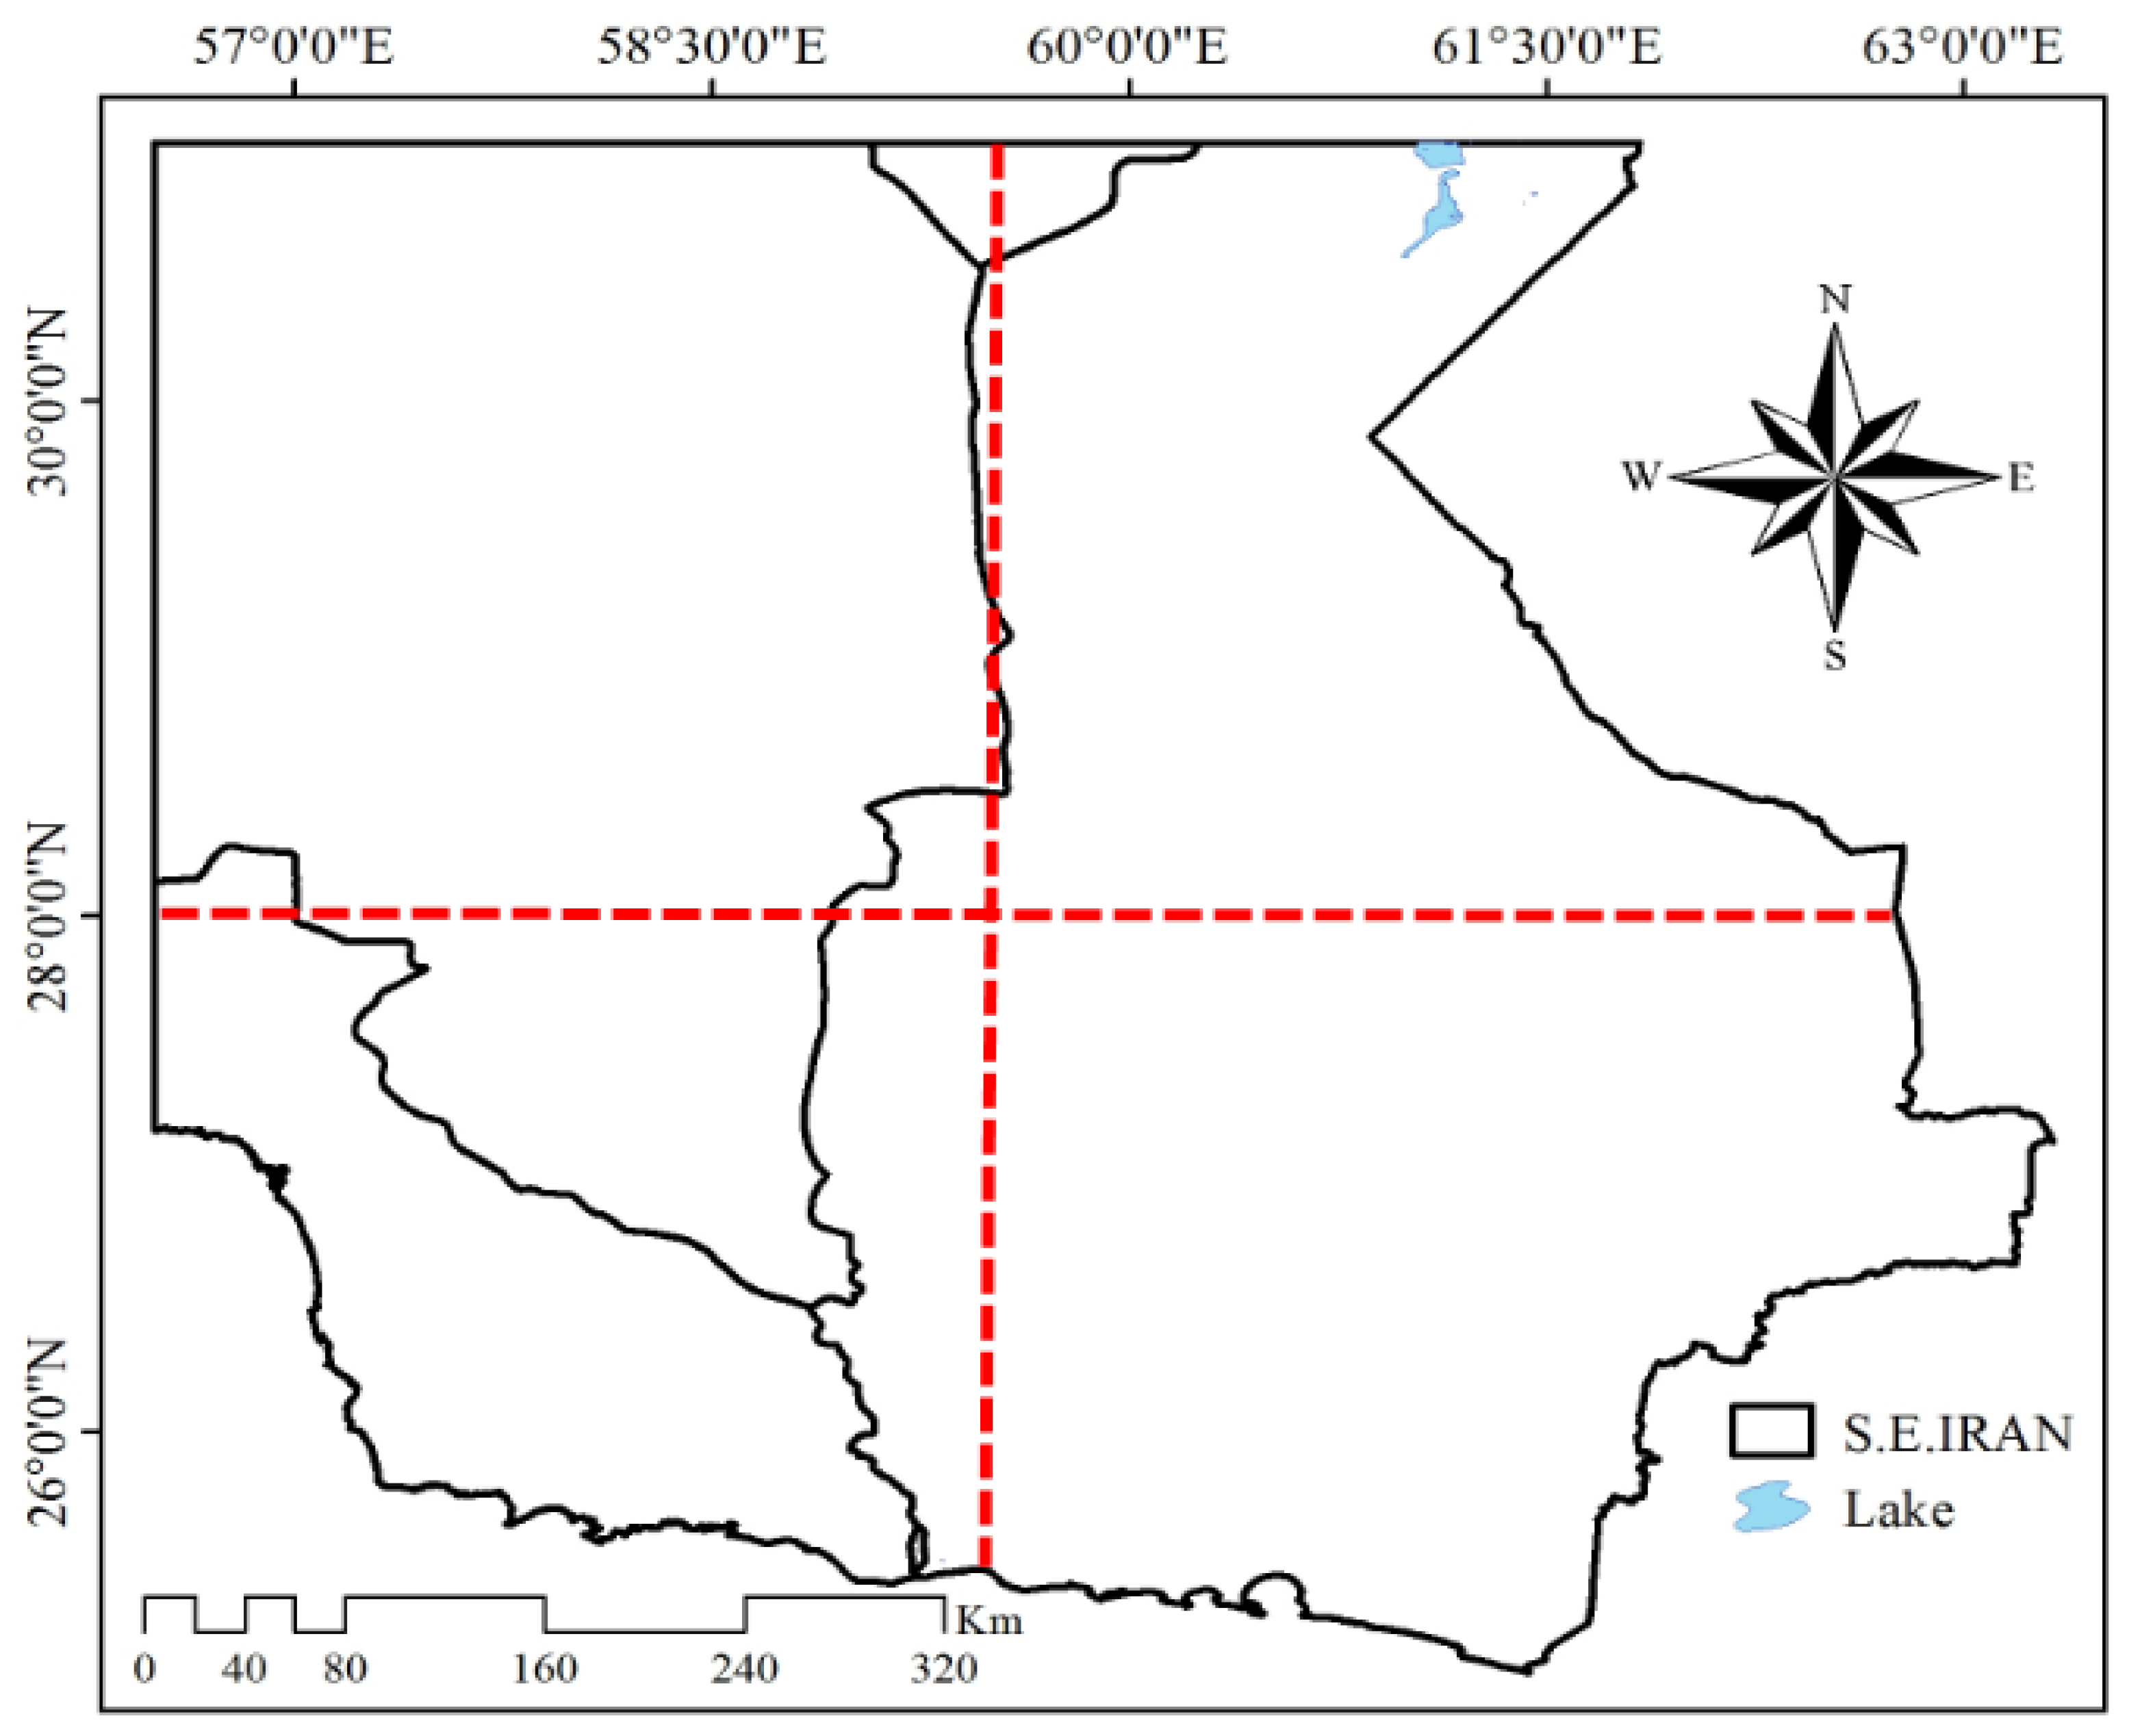
2.1. Study Area

The area under study is situated in the southeast of Iran. This region extends from approximately 31° N to the southern shores of Iran and spans from around 56°30′ E to the eastern borders of the country [38,39,40]. It encompasses the provinces of Sistan, Baluchestan, Kerman, and Hormozgan (as depicted in Figure 1). The diversity of vegetation cover in this area is high, with the mangrove forests in the southern part, bordering the Oman Sea, standing as one of the most significant types. The eastern part of the region, situated in the Sistan and Baluchestan provinces, is covered by desert and characterized by an arid climate. One of its distinctive features is the presence of the 120-day winds, which blow from late spring to late summer, mostly in the north-south direction. These winds are influenced by the north-south pressure gradient created by a persistent cold high-pressure system located over the high mountains of the Hindu Kush in northern Afghanistan and a thermal low-pressure system that develops over the desert regions of eastern Iran and western Afghanistan due to prolonged surface heating. Additionally, the influence of monsoon precipitation plays a significant role in shaping the climate of this region [41,42,43]. The western reaches, located in Kerman province, are home to mountain ranges [44]. In the southwest of the area (Hormozgan province), the climate is characterized by a long warm season with sultry air that lasts from March to November [42,43].
Given the profound reliance of the southeastern region of Iran’s ecosystem on summer precipitation, which accounts for a significant portion of the region’s annual precipitation, it is essential to investigate the systems responsible for generating rainfall in this area. The South Asian Summer Monsoon (SASM) typically commences around 20 May and retreats by 15 September. Therefore, in the current study, the research period had to align with this timeframe [45,46,47,48,49,50,51,52,53].

2.2. Data

The period from 1989 to 2017 was chosen for this research to consider the long-term climate patterns and to obtain statistically valid results. Due to the limited number of synoptic stations in the study area, rain gauge stations were also used. The data from both synoptic and rain gauge stations were obtained from the Islamic Republic of Iran Meteorology Organization (IRIMO) [54] and the IRAN Water Resources Management Company (IRANWRMC) [55]. In summary, data from 12 synoptic stations (Table 1) and 56 rain gauge stations (Table 2) spanning from 20 May to 15 September (119 days) between 1989 and 2017 (29 years) were used to analyze the summer precipitation period in southeastern Iran. The locations of these 68 stations are presented in Figure 1.
To select the circulation patterns, additional data including Geopotential Height (GPH), omega (upwards motion speed), u-wind (zonal component), and v-wind (meridional component) components were obtained from the ECMWF reanalysis ERA5 version [56] with a resolution of 0.25° × 0.25°. Additionally, to identify cloudiness on specific days, visible range satellite images were downloaded from the EUMETSAT satellite [57].

2.3. Methods

To discern the synoptic patterns of summer precipitation in southeastern Iran, the precipitation data was analyzed to identify extended area precipitation events (EAPEs) within the research area and determine the pressure systems and wind patterns contributing to these events.
In climatic research, various criteria have been introduced to assess whether a precipitation event is widespread. In some of the research conducted so far for Iran, a criterion based on the number of weather stations involved in the precipitation event, often ranging from 30% to 50% of the stations in the research area, was assumed [58,59]. However, relying solely on the number of stations as an indicator for identifying the EAPE, without considering other conditions, may have its shortcomings. On the one hand, the stations involved may be clustered in only one specific part of the area, indicating a lack of regional extent. On the other hand, the unique characteristics of the study area should also be taken into account. In general, it is preferable to pay more attention to the spatial criterion, which implies that precipitation is not local, but is connected to the large-scale circulation of the atmosphere. Consequently, the possibility of studying atmospheric phenomena at different levels using synoptic methods should be considered, as was performed in other studies [60,61]. To apply the spatial criterion and determine the regional extent, the study area was divided into four sectors, two by a latitudinal line and two by a longitudinal line (Figure 2).
To identify the EAPEs in southeastern Iran, two criteria have been established. These criteria are outlined as follows [62]:
  • The number of stations reporting precipitation on each rainy day should equal or exceed four.
  • The spatial criterion (regional extent) stipulates that precipitation must have occurred in at least 50% of the study area (two quarters).
After pinpointing the rainy days, the first criterion was examined to identify the EAPE. Days with precipitation at four or more stations were identified, and subsequently, the regional extent (spatial) criterion was applied.
To identify the circulation patterns that lead to the occurrence of summer precipitation in southeastern Iran and to determine the location of pressure systems and their impact on southeastern Iran, the GPH, u-wind, and v-wind component maps for 850, 700, 500, and 200 hPa levels, as well as omega cross-sections for 1000, 850, 700, 500, and 200 hPa levels, were all utilized. This data was obtained from the ECMWF reanalysis ERA5 database and plotted on all days when EAPE occurred.
There are two primary methods for classifying synoptic patterns [63,64]. The first is subjective classification, and the second involves using objective methods, such as correlation analysis, cluster analysis, nonlinear techniques, neural networks, and more [64,65], all used to identify consistent weather patterns [66]. Hierarchical clustering methods are well-suited for the exploratory phase of research [67], with Ward’s method [68] being one of the main hierarchical clustering techniques in climatic classifications that has been employed in various studies [66,67,69,70]. In cluster analysis, data are grouped based on the distance or similarity between them. Several methods exist to measure the distance between data, with the Euclidean distance [71,72] being one of the most widely used. In this study, Ward’s method was employed for clustering and the Euclidean distance method was used to measure the similarity and distance between the data.
Ultimately, the circulation patterns based on 500 hPa GPH were identified using both subjective [73,74,75] and objective methods [63,65,66,76,77,78]. Maps were selected for each pattern and relevant parameters were provided alongside the cloudiness map. The trajectory of precipitation systems (patterns) impacting the southeast of Iran was determined by averaging the paths of each of these precipitation systems.

3. Results

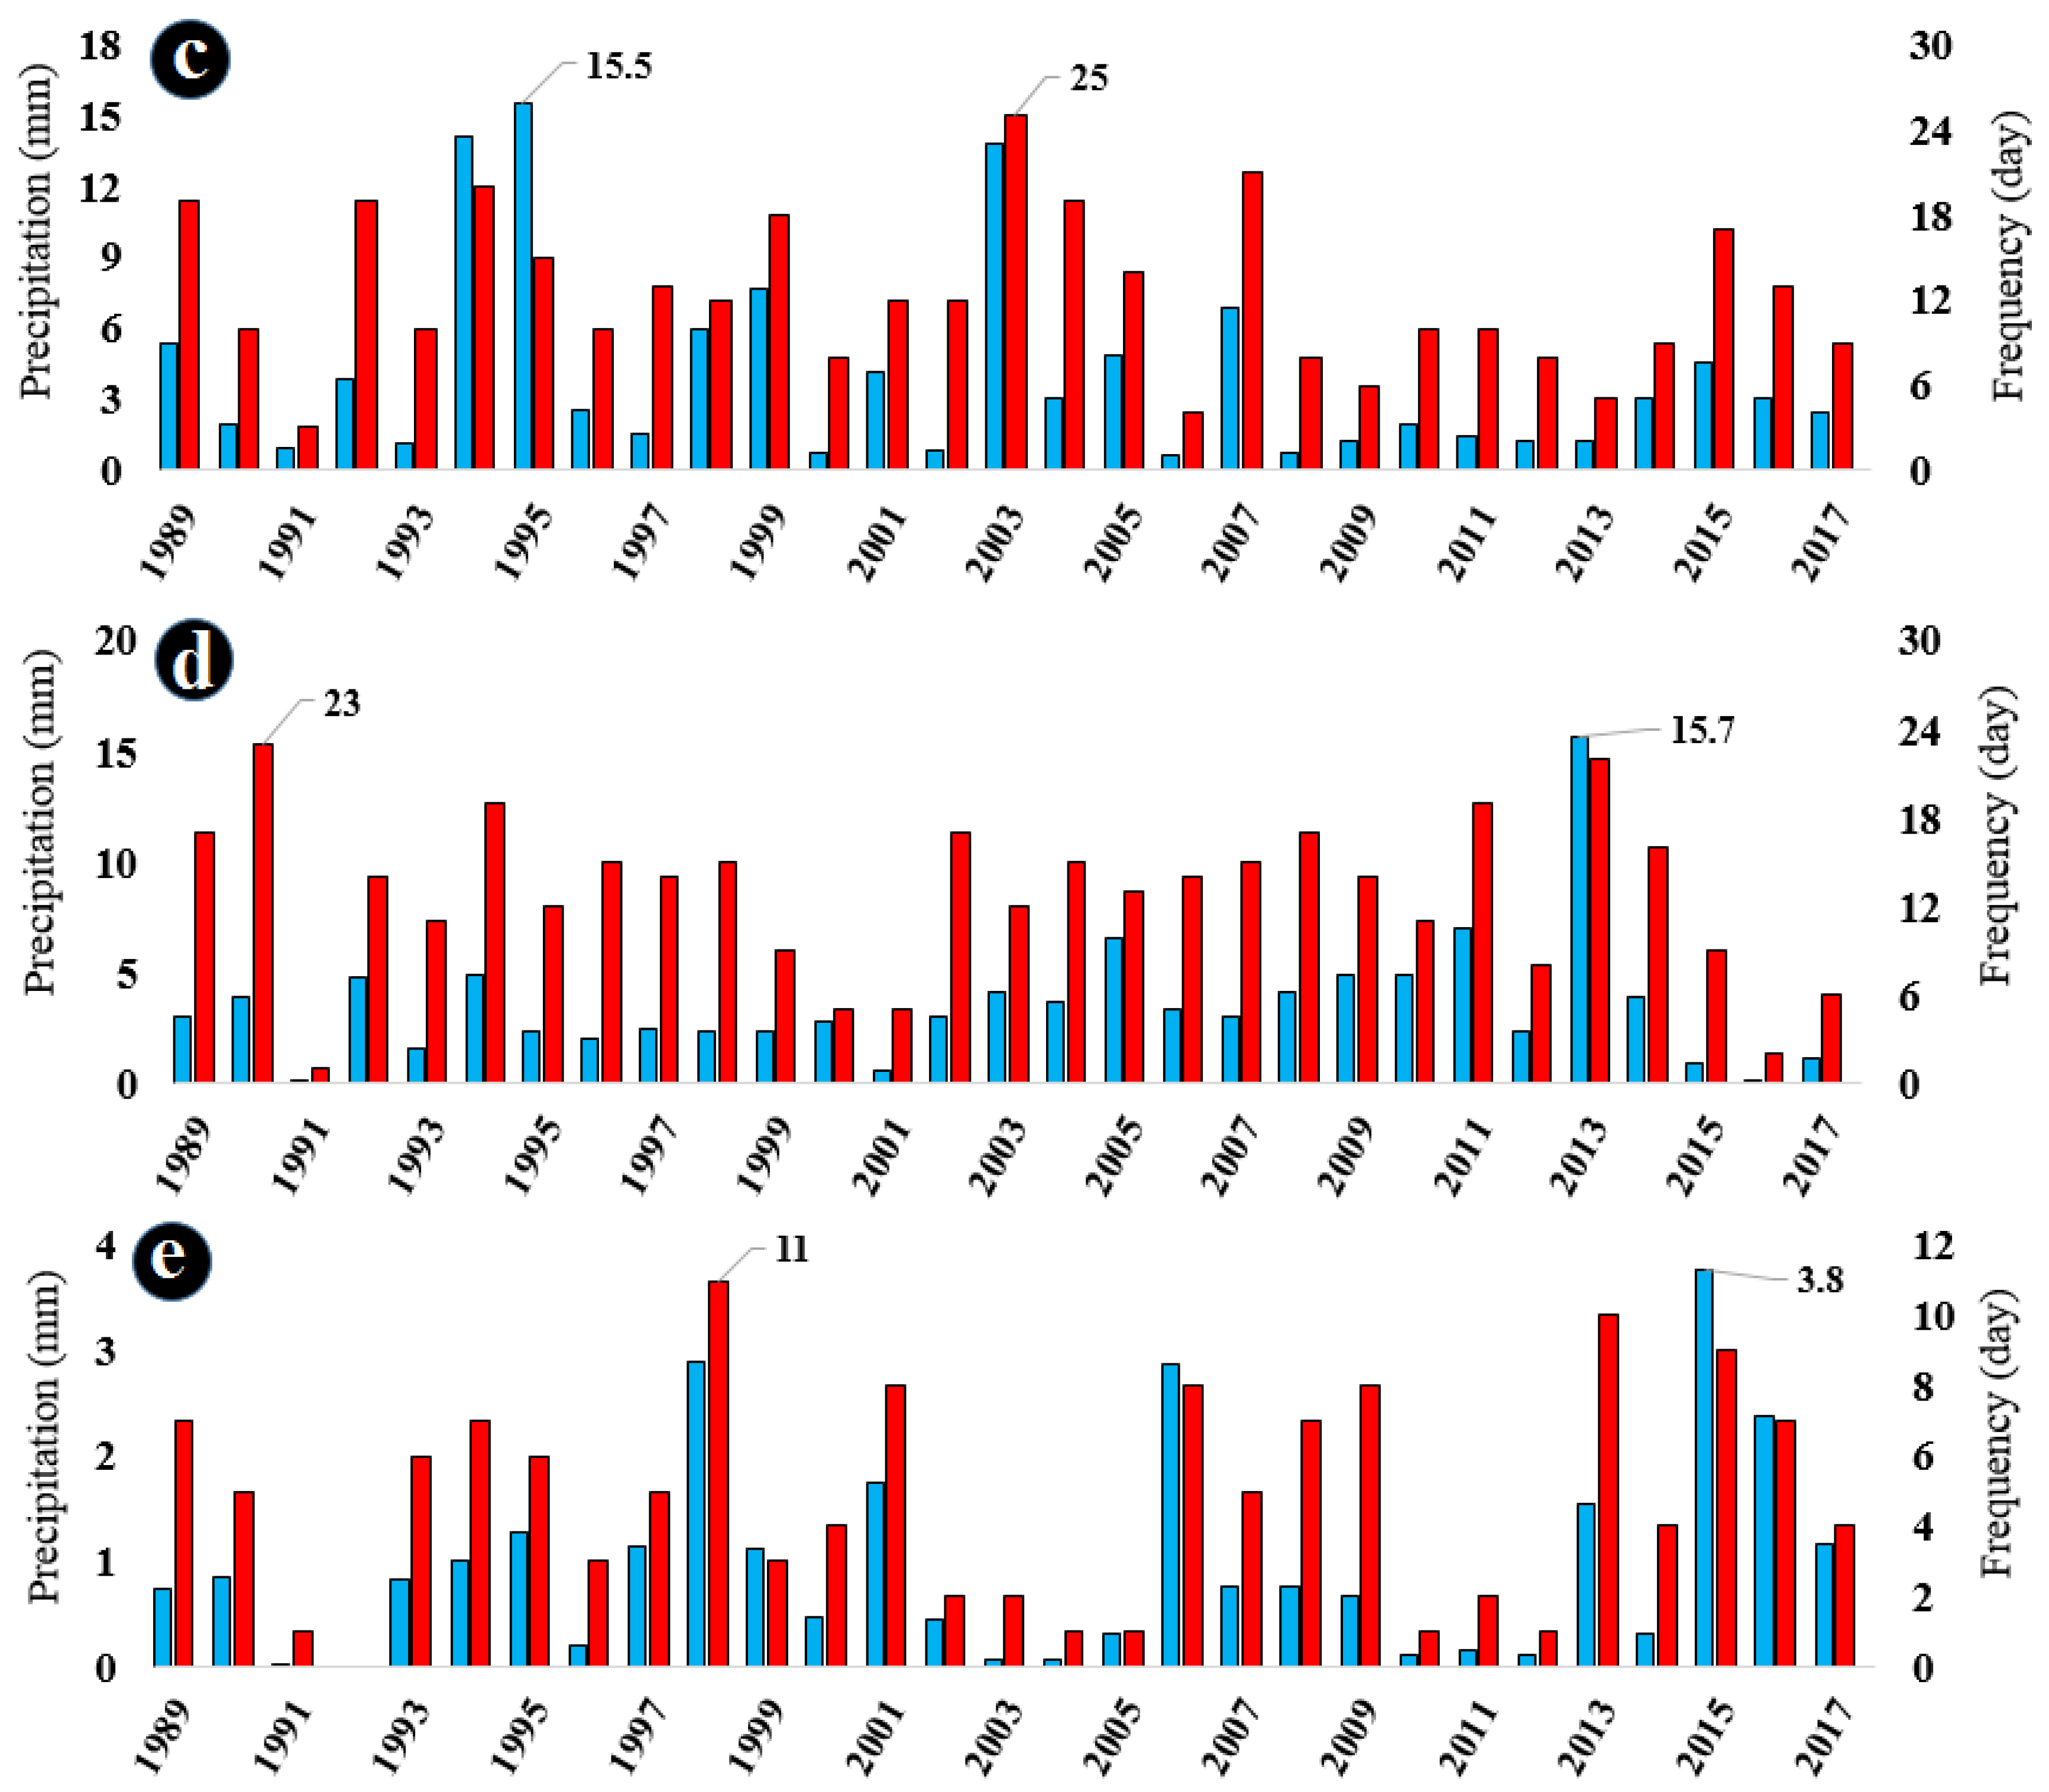
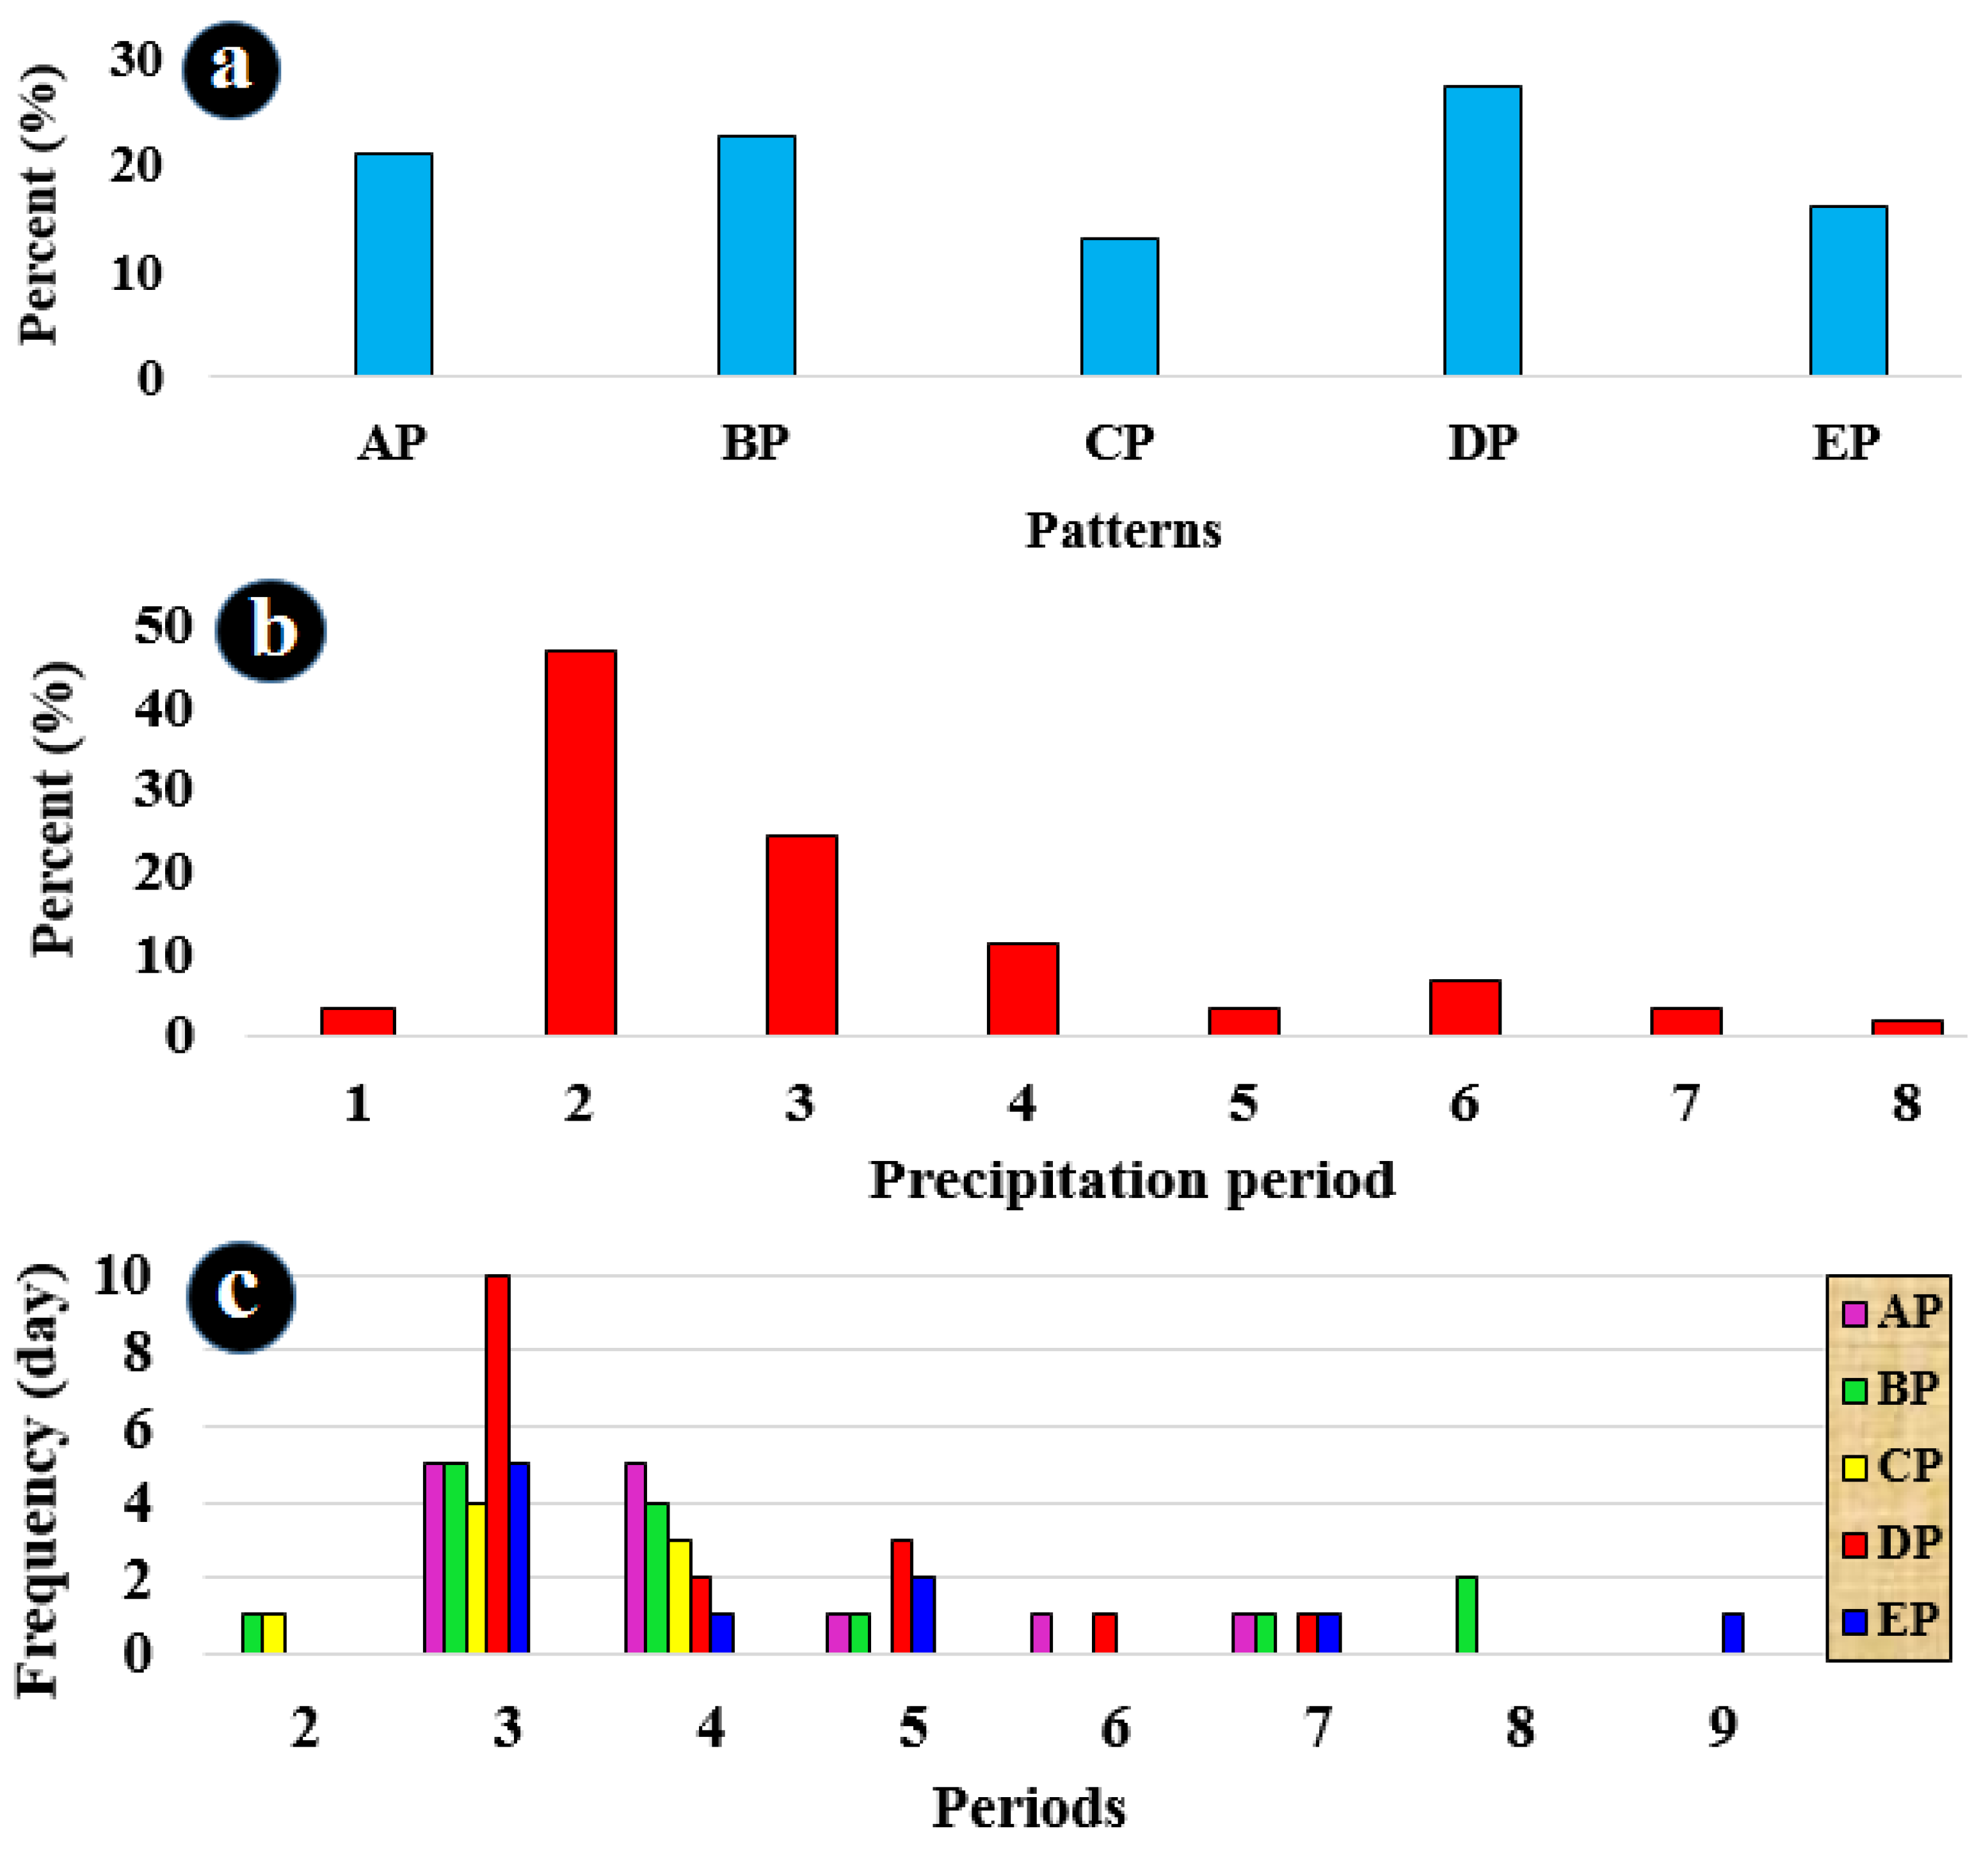
3.1. Statistical Analysis of Summer Precipitation in Southeastern Iran

The research period spanned 3451 days and 1226 of those days experienced precipitation. Analysis revealed that the largest number of rainy days (370) occurred in August, followed by July (359), June (256), May (138), and September (103). The statistics for May and September only account for part of the month. In the further parts of the manuscript, the term May will stand for the last ten days of May and the term September will stand for the first half of September.
When the number of rainy days for each month was divided by the total number of rainy days, it becomes clear that May contributed to 8.4%, June to 20.9%, July to 29.3%, August to 30.2%, and September to 11.3% of the total rainy days. The mean, standard deviation, and coefficient of variation of precipitation for each month indicate that July holds the highest average precipitation at 4 mm. In Figure 3a, the frequency of rainy days for each year during the research period is shown. According to this figure, 2007 stands out with 65 days of precipitation, marking the highest occurrence during the research period, while in 1991 the lowest incidence, with just 10 days of precipitation, was recorded. Precipitation values for each year of the research period (Figure 3b) reveal that the highest total summer precipitation, equal to 64.6 mm, was observed in 2007 (primarily due to the tropical cyclone Gonu). In contrast, the lowest total summer precipitation was recorded in 1991, with just 1.7 mm. The trend line reveals a minimal increase in the sum of summer precipitation in southeastern Iran throughout the research period.
Figure 4a–e illustrates the frequency of precipitation days and the average precipitation rate from May to September during the research period. The average number of rainy days from May to September is 4, 9, 12, 13, and 5 days, respectively. Additionally, the average precipitation rate from May to September is 0.9, 3.8, 4, 3.5, and 1 mm, respectively.

3.2. Extended Area Precipitation Events (EAPEs)

Following the predefined criteria, the number of stations recording precipitation in the research area was determined. Rainy days occurring at four or more stations, along with their frequency, are depicted in Figure 5. Among the 78 rainy days, precipitation was recorded at four stations, during 60 rainy days at five stations, on 20 rainy days at six stations, and so forth. There was even one instance of precipitation observed simultaneously at thirty-seven stations. From the rainy days and the number of stations involved in each rainy day, it was found that in southeastern Iran, 79% of rainy days (974 days out of 1226) saw precipitation reported at three stations or fewer, while 16% of rainy days (200 days) had precipitation reported at four to nine stations. A smaller portion, 5% of rainy days (52 days), had precipitation reported at ten to thirty-seven stations.

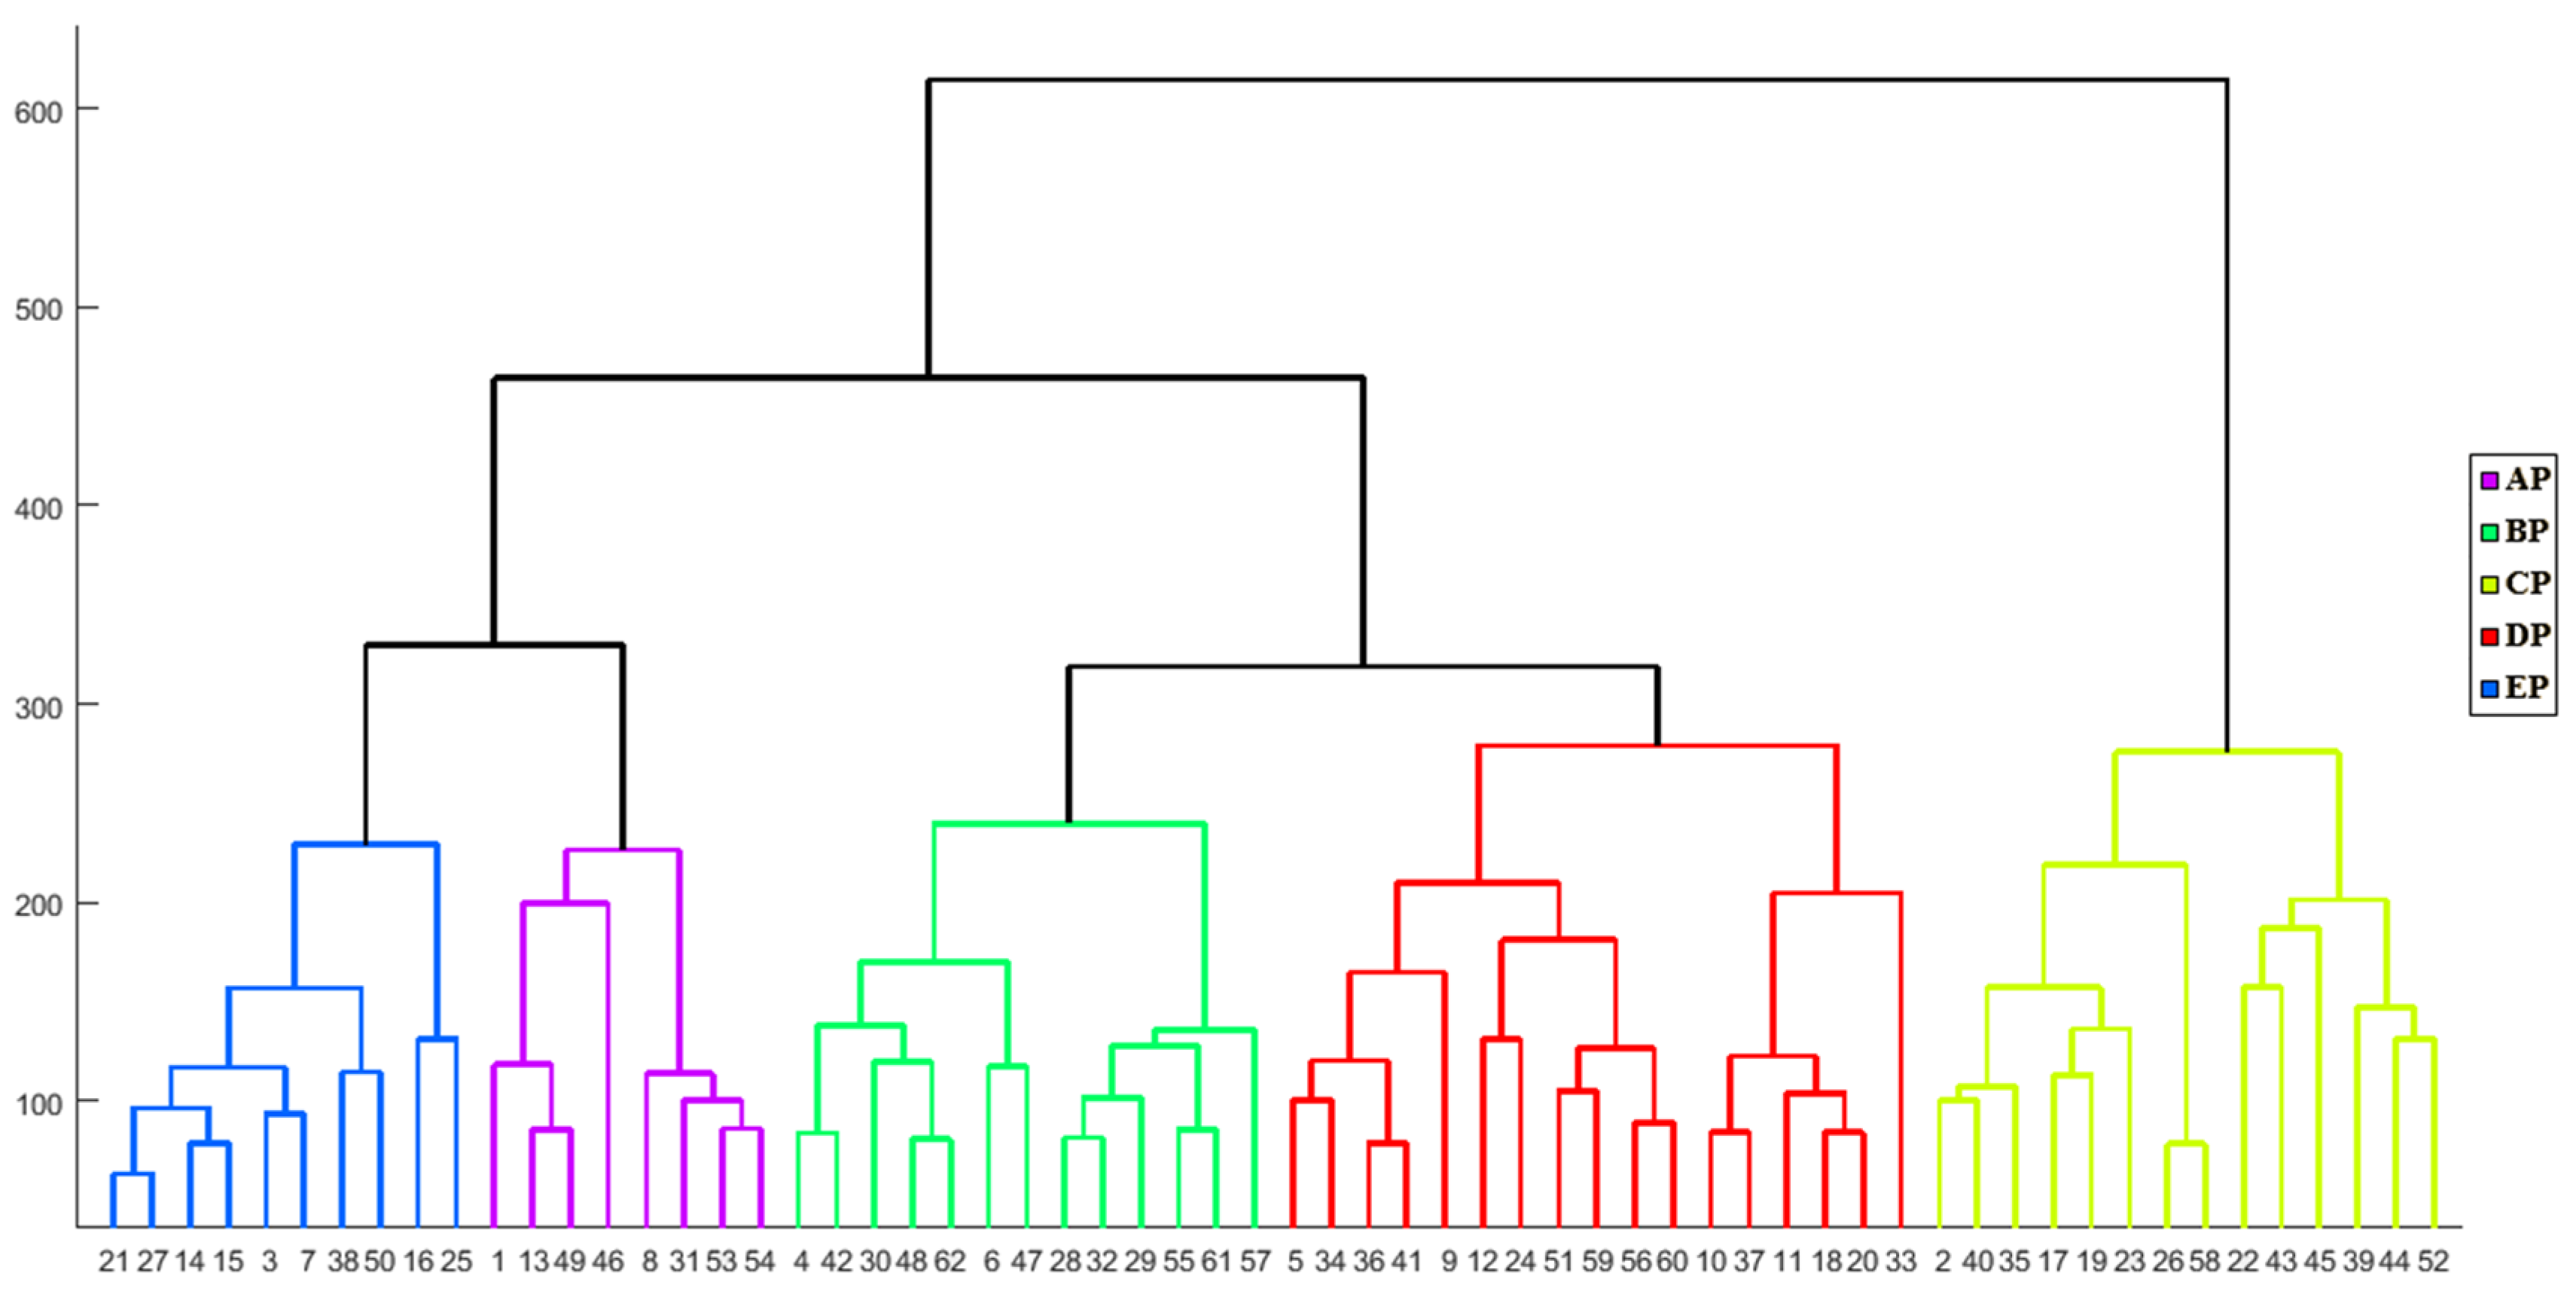
3.3. Cluster Analysis of Synoptic Situations during EAPEs

3.3.1. Subjective Method

To analyze the synoptic patterns of EAPE in southeastern Iran, maps were plotted for all EAPE days (62 days), including the days before and after the precipitation day. These maps allowed us to determine which patterns led to the occurrence of EAPE in the study area and provided insight into their synoptic characteristics.

3.3.2. Objective Method

In the distance-based clustering method, observations are grouped based on their distances from each other. This means that observations or elements with smaller distances are assigned to the same group. The general term for clustering methods based on the distance between elements is “distance-based clustering”. The main goal of clustering is to create groups and categories where within-group variation is minimized compared to between-group variation [67]. To cluster the rainy days, Ward’s method was applied to the input matrix of 56,481 × 62 (the number of grid points multiplied by the number of days with EAPE, respectively). This resulted in the identification of five patterns (Figure 6). It is worth noting that patterns obtained from both the subjective and objective methods showed significant similarities. In fact, in some areas, the synoptic patterns obtained from the subjective method were the same as the patterns obtained from the objective method [79,80].
Both subjective and objective methods revealed that the circulation patterns causing EAPE in southeast Iran can be categorized into five distinct patterns. For simplicity, they are named AP, BP, CP, DP, and EP. The primary aim of clustering is to minimize diversity or variance within groups while maximizing the variance between groups. Therefore, each of the five identified clusters around the 300 abscissa value of the dendrogram plot is considered an independent synoptic pattern. Members within each cluster or synoptic pattern exhibit the least distance or the highest similarity to each other. Visual examination of the members or maps within each cluster demonstrates that these clusters are entirely distinct from one another, representing unique synoptic patterns. As a result, the identified clusters or synoptic patterns are labeled as AP, BP, CP, DP, and EP, and are analyzed in terms of their meteorological conditions. In Figure 7a, the frequency of precipitation associated with these patterns can be observed. The DP pattern was responsible for seventeen events of EAPE, making up 27% of cases, which was the highest incidence. It was followed by the BP pattern with fourteen events (23%), the AP pattern with thirteen events (21%), and the EP and CP patterns were responsible for ten (16%) and eight (13%) events, respectively. Out of these five patterns, three (AP, BP, and DP) were responsible for 71% of the summer’s EAPE events.

3.4. Annual Frequency of EAPE
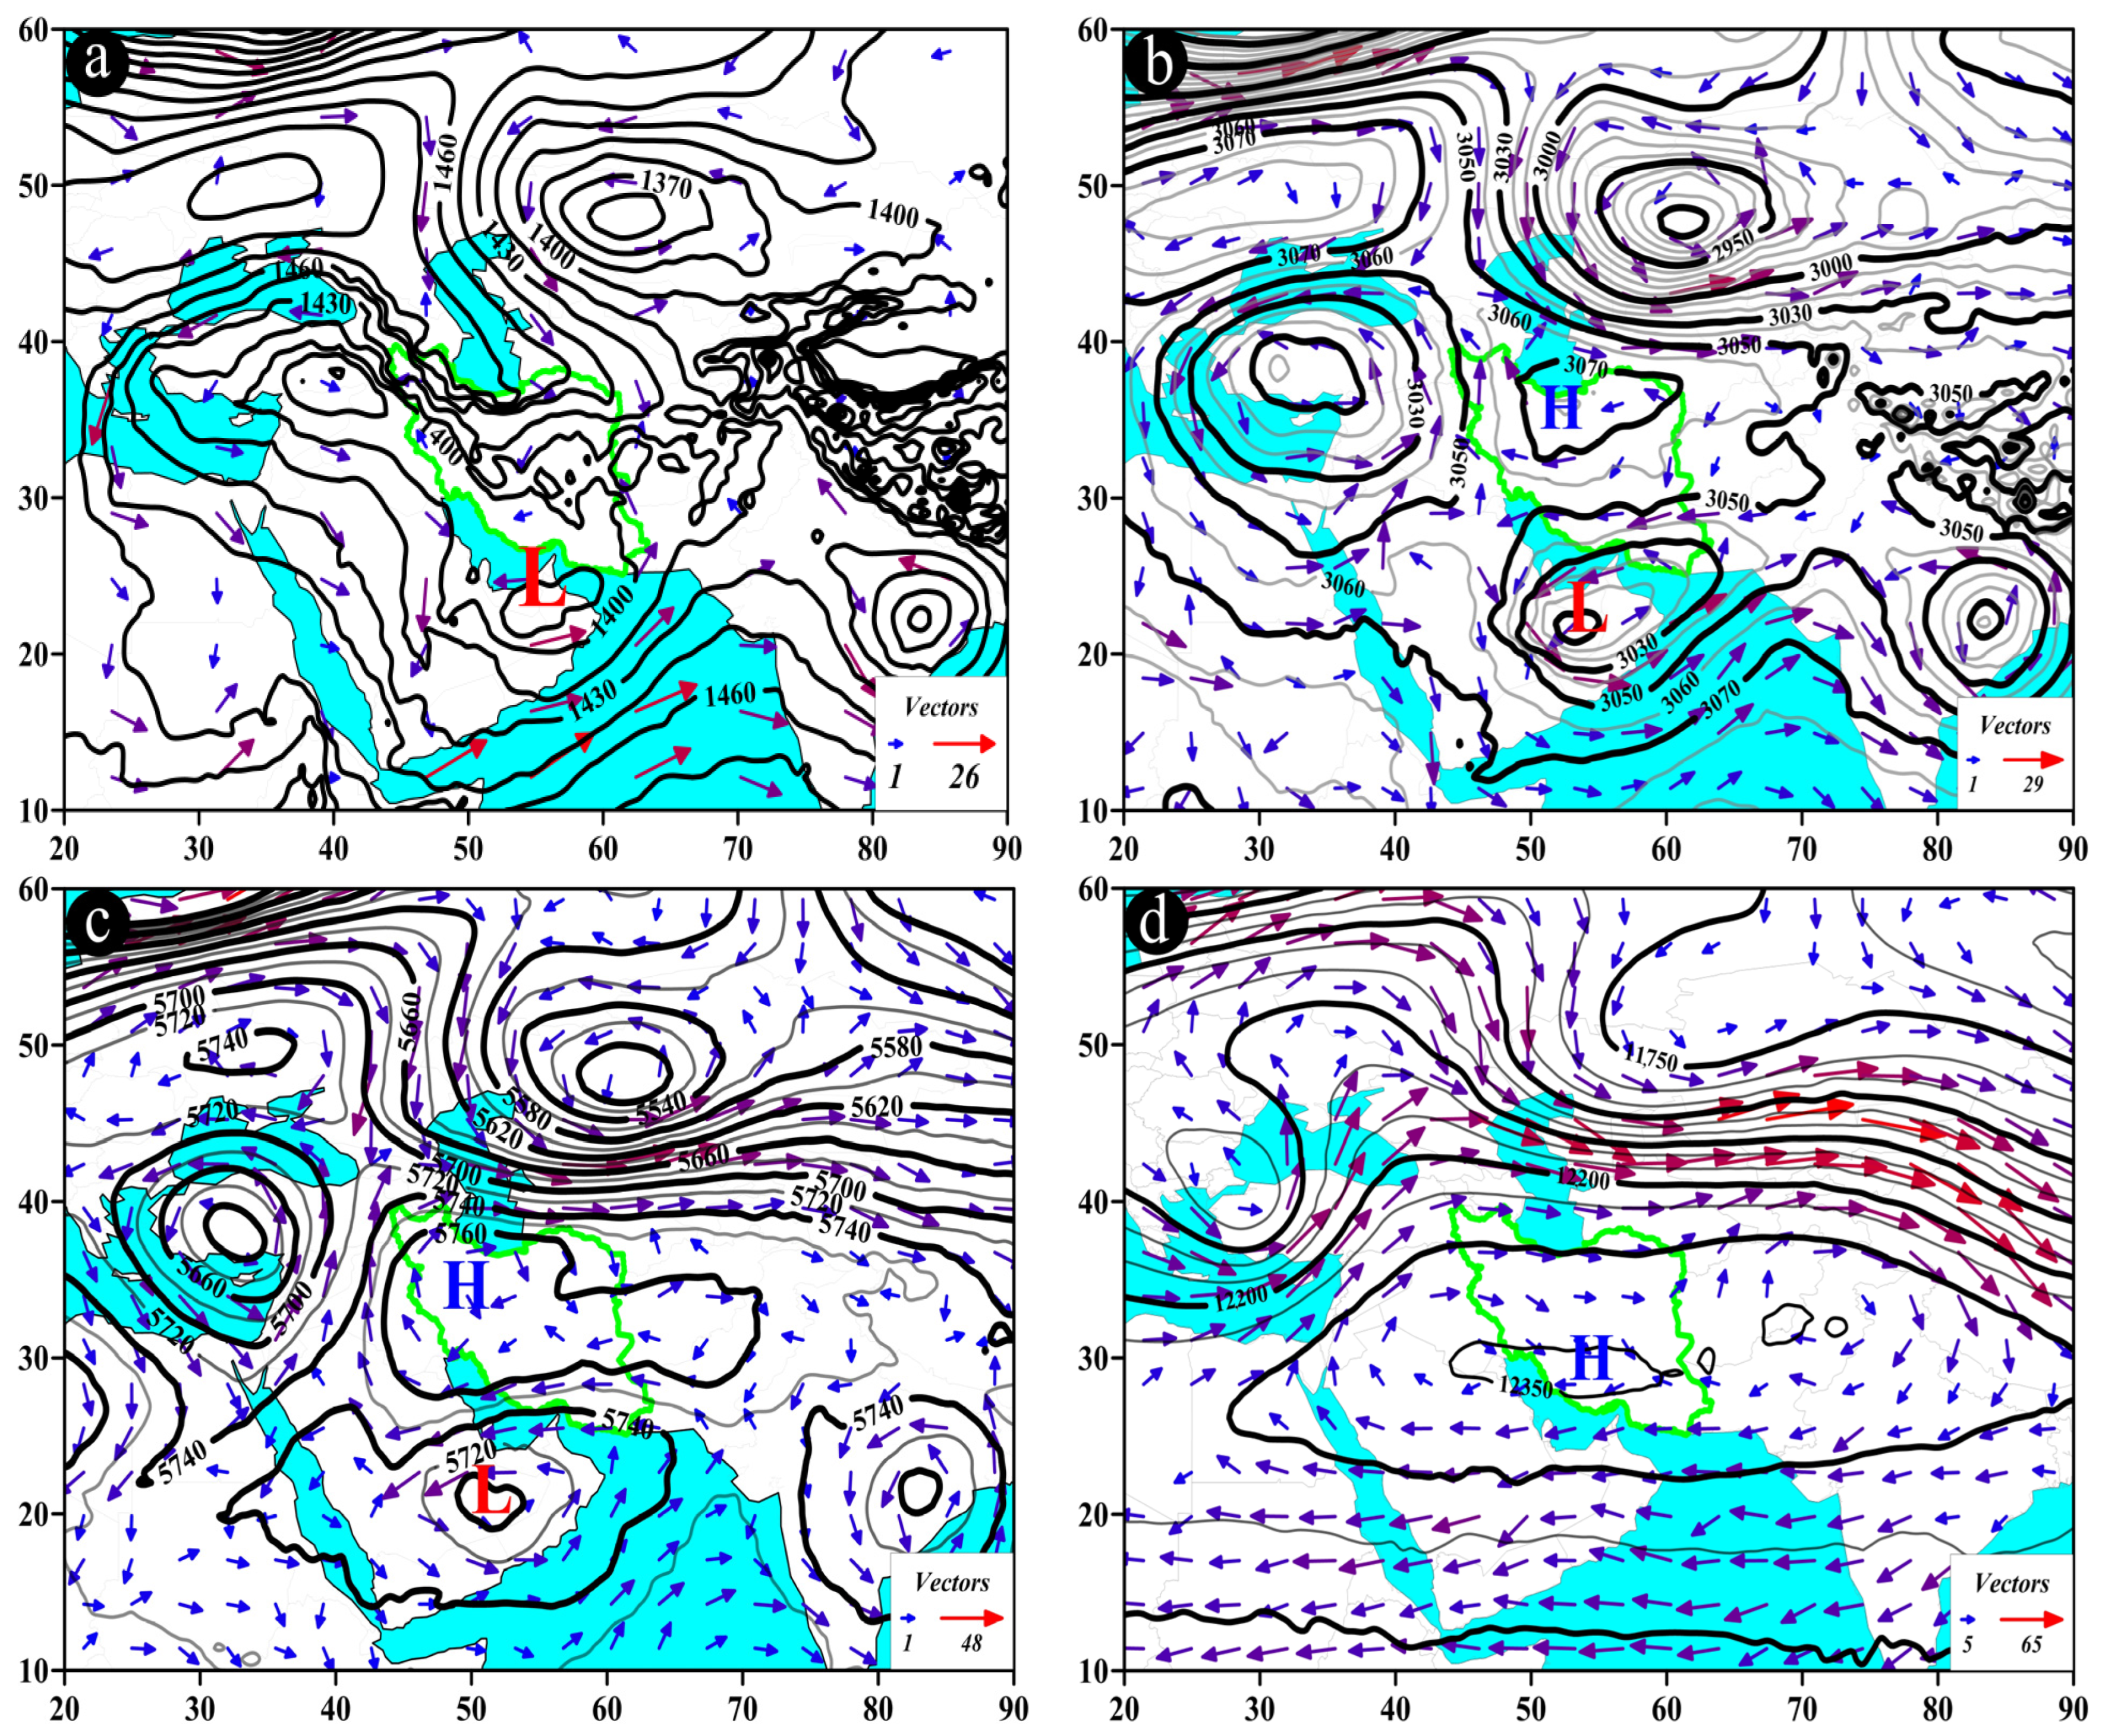
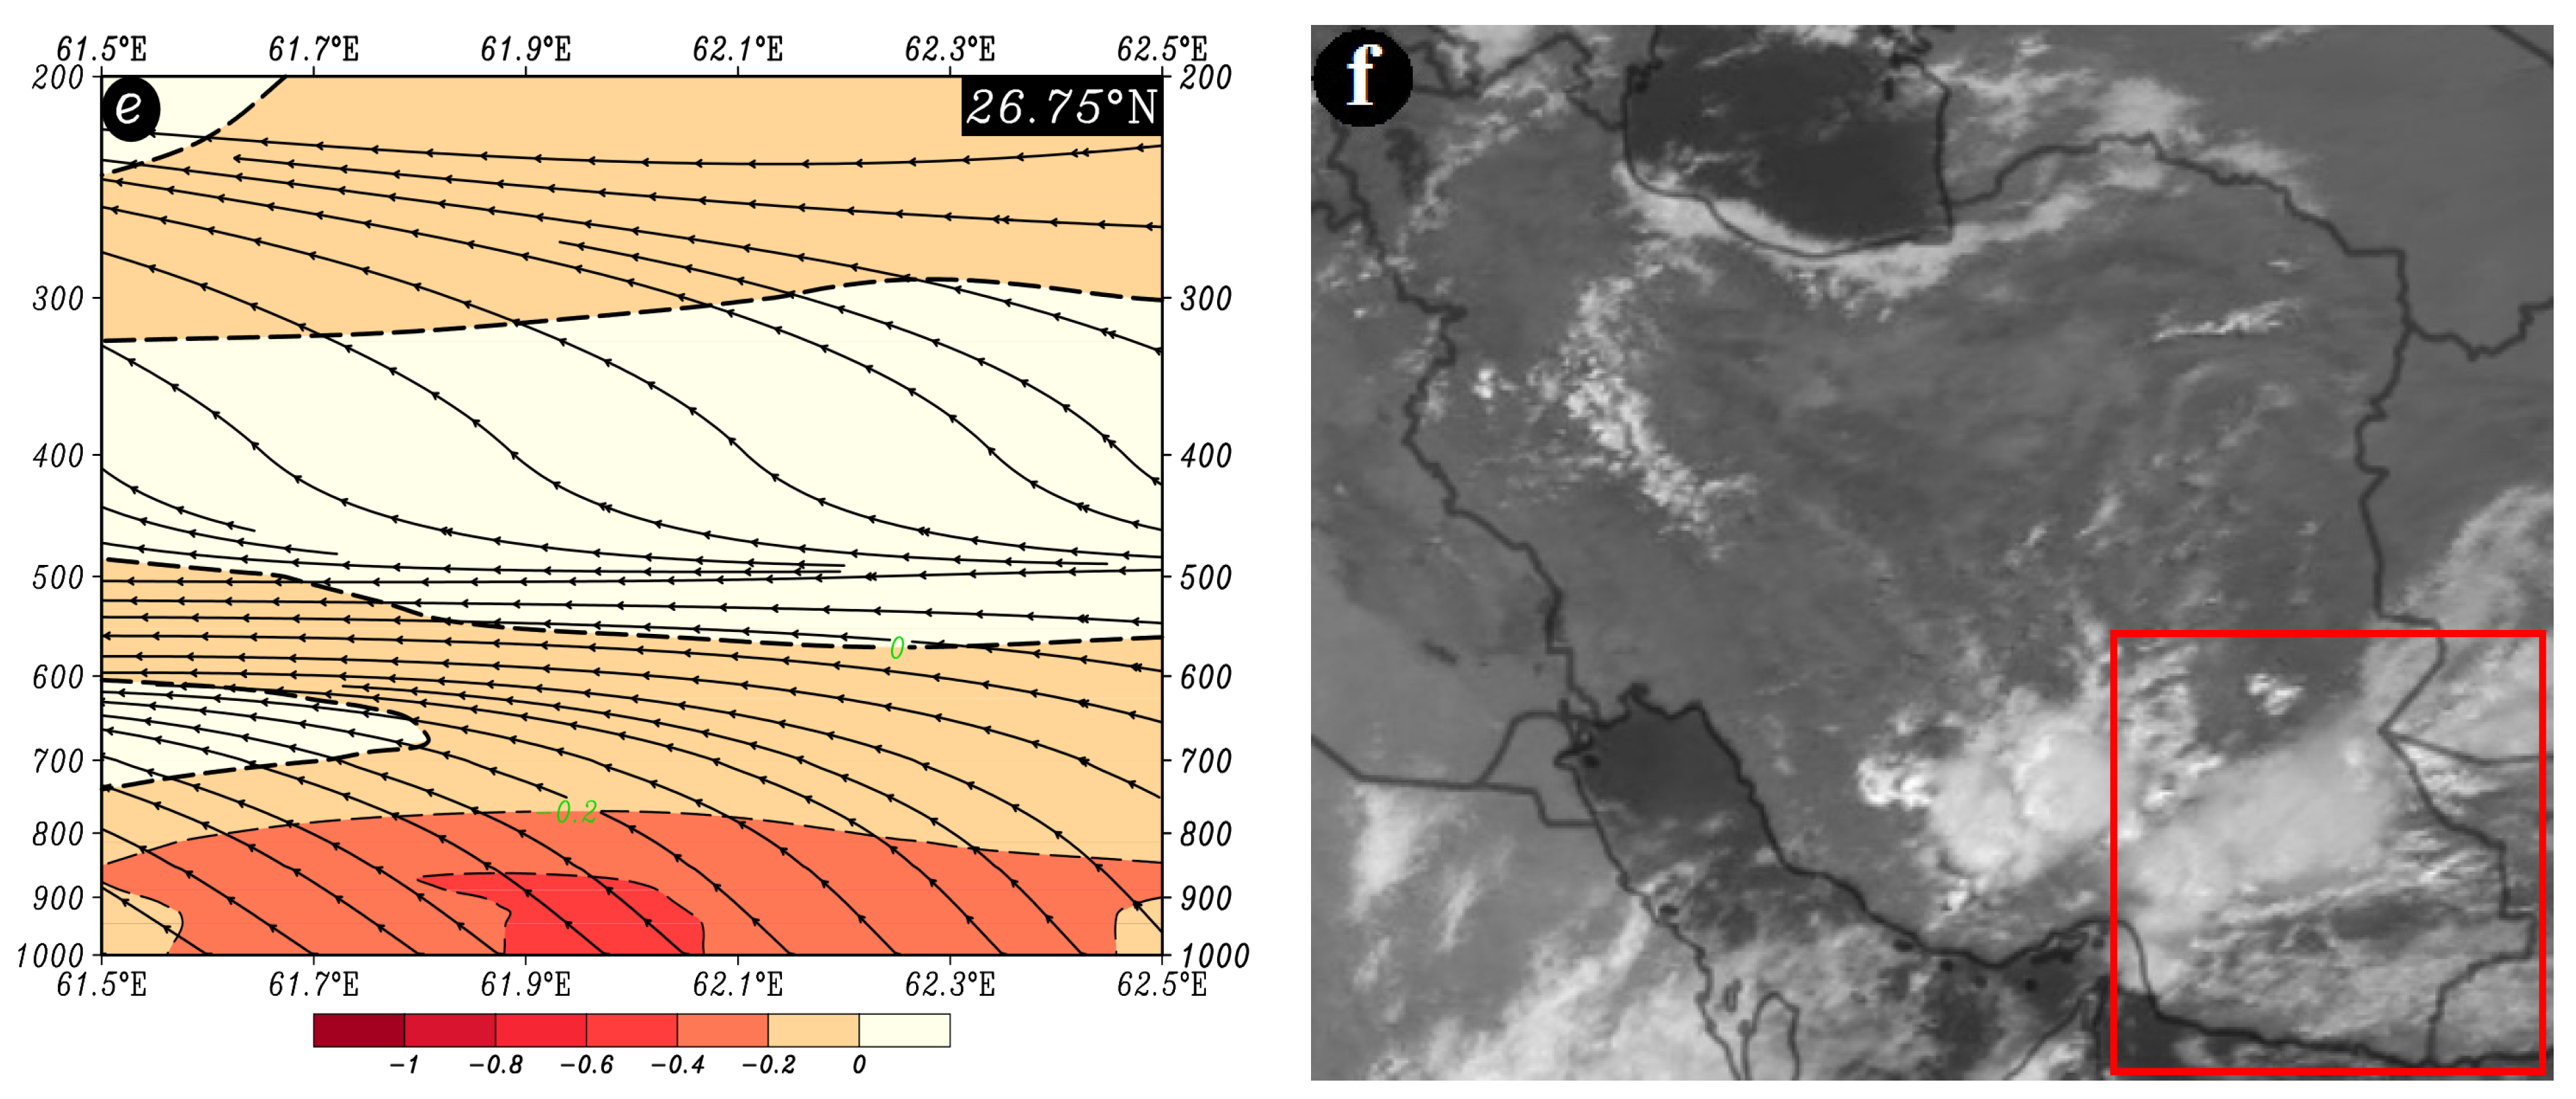
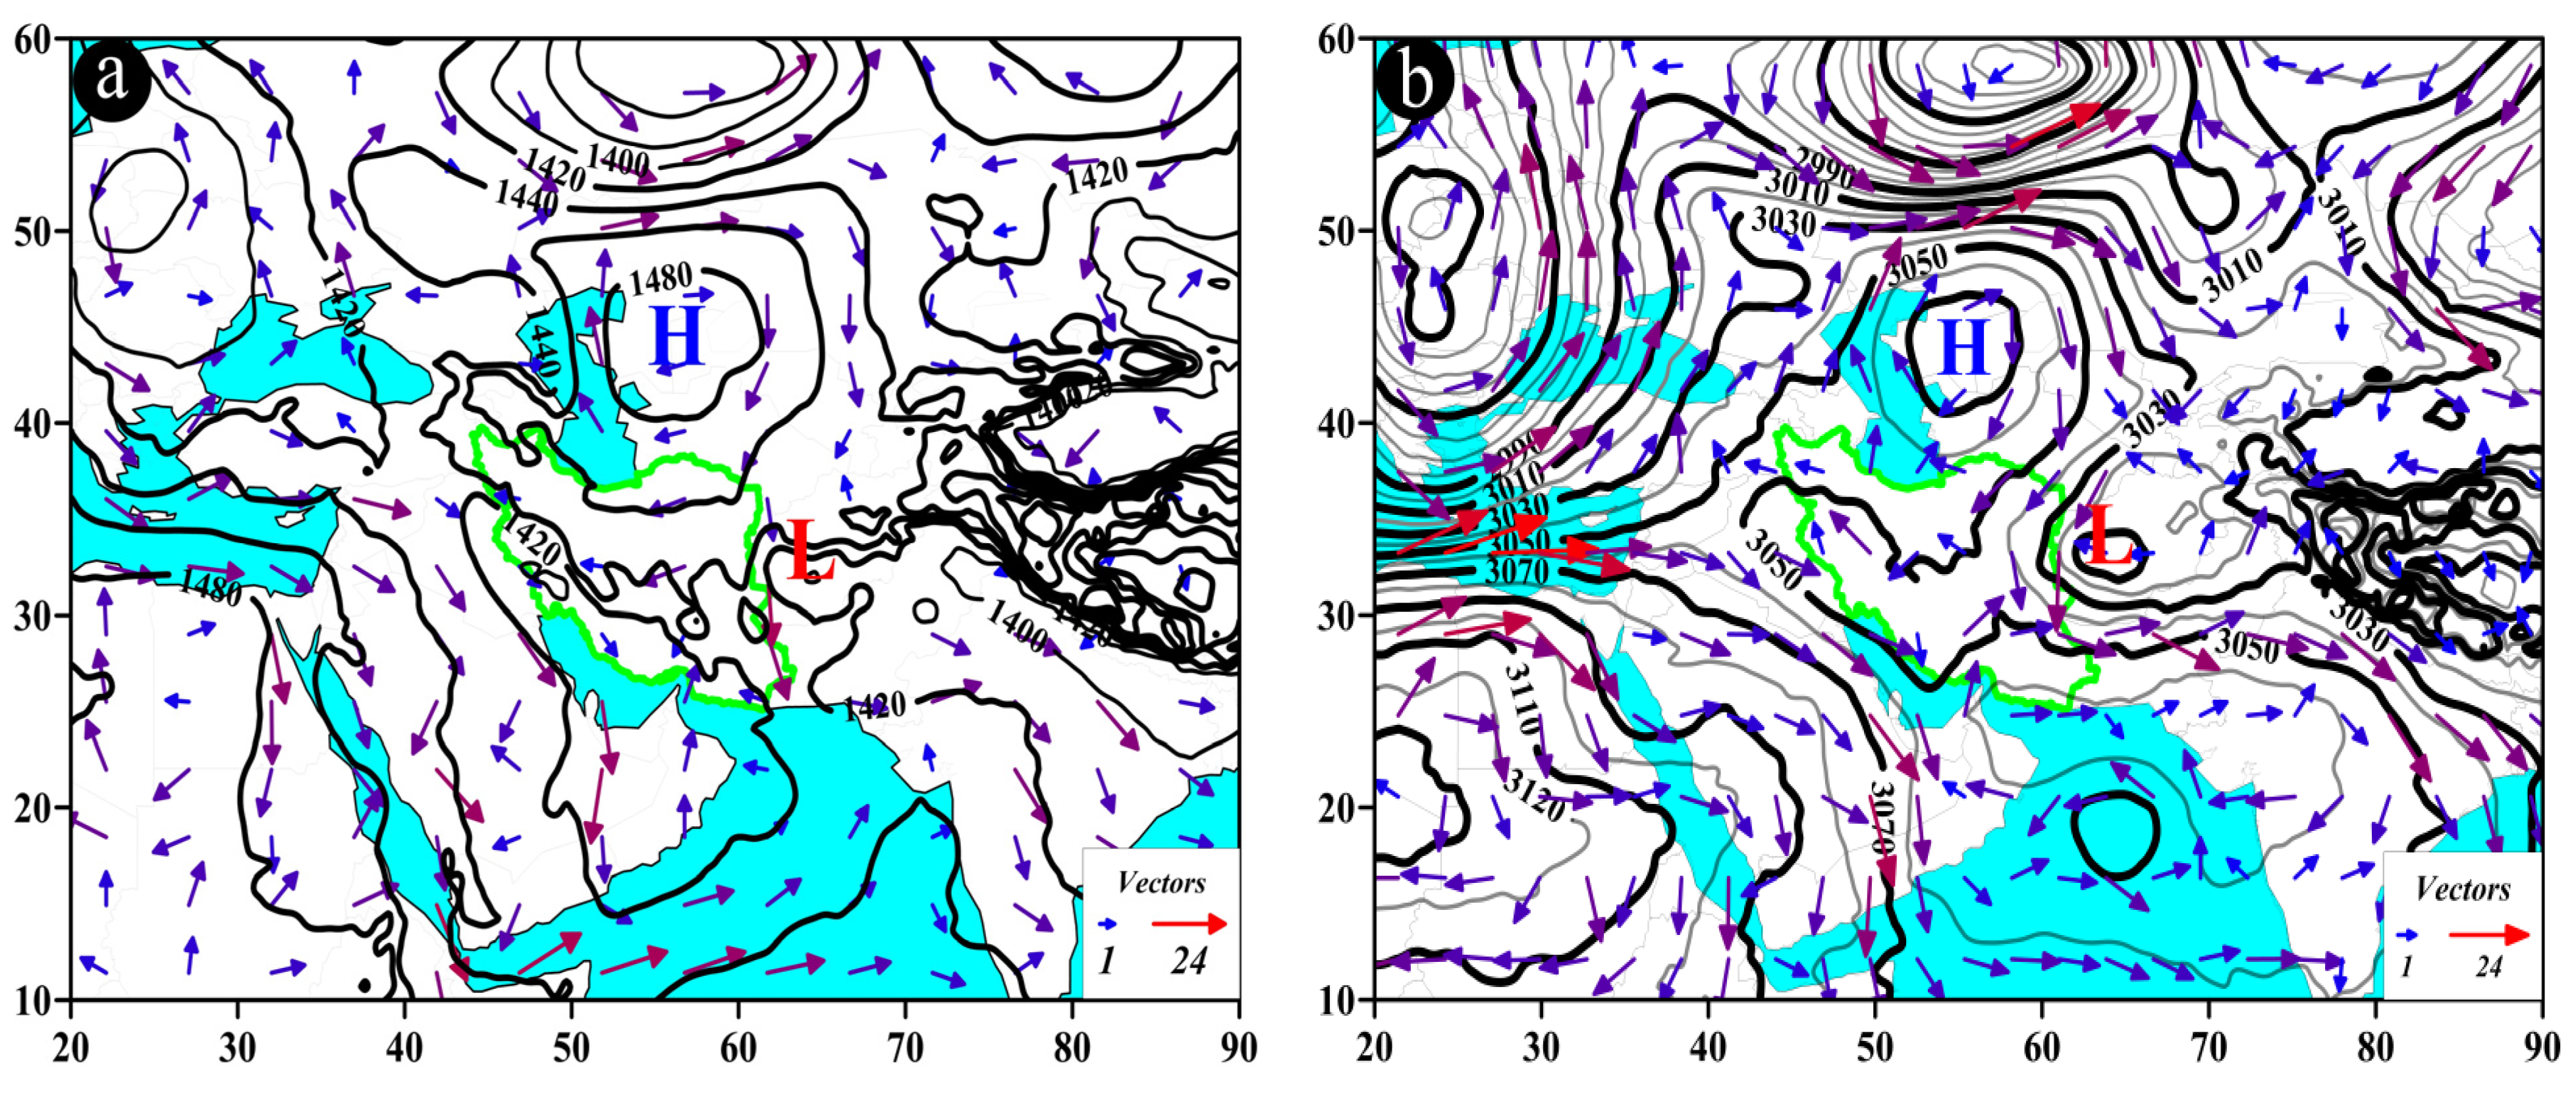
Figure 7b displays the EAPE periods in the study area and their frequency of occurrence. This helps to identify the intervals during which EAPE patterns dominate in the southeast of Iran. It was discovered that EAPE in the southeastern region is characterized by precipitation periods lasting from two to nine days. Three-day precipitation periods were observed 29 times (47%), and four-day precipitation periods occurred 15 times (24%), indicating that 71% (44) of EAPE events in the study area typically last between three to four days. Five- and seven-day periods were observed seven (11%), and four (7%) times, respectively. Two-, six-, and eight-day periods occurred two (3%) times each, and a nine-day precipitation period was observed only once (2%).
Figure 7c shows the precipitation periods and the frequency of pattern occurrences during these periods. This allows us to understand which patterns are more active in EAPEs and observe the frequencies of associated circulation patterns. The density of patterns in different precipitation periods indicates that they are mainly occurring during three-, four-, and five-day precipitation periods. The DP and BP, as well as the AP patterns, were most frequently observed over southeast Iran. The DP pattern, with 10 EAPE events during the three-day precipitation period, was the most common. The EP pattern, on the other hand, was observed during the longest precipitation period of nine days.

3.5. Case Studies

1.
AP pattern (on the example of 25 May 1996)
The AP pattern, also known as the trough pattern, is presented in Figure 8. In this pattern, typically occurring at the level of 850 hPa, low-pressure cores are observed over the study area, northwestern Iran, Turkmenistan, and Uzbekistan (Figure 8a). At the 700 hPa level, the trough is positioned over the west of Iran and the Persian Gulf, with the study area situated in front of the trough. At this pressure level, a deep trough with a northeast-southwest axis, extending up to 18° N latitude, can be observed over northeastern Africa, particularly Egypt and Sudan. Wind direction over the study area varies from southwest to northeast and from west to east, with wind speeds ranging from 3 to 9 m/s (Figure 8b).
One distinctive feature of this pattern at the 500 hPa pressure level is the presence of a trough over the west of Iran, with the study area located in front of the trough. The trough axis runs in a north-south direction, and the flow direction in the study area is from southwest to northeast (Figure 8c). At the 200 hPa pressure level, a north-south-oriented trough extends along the 42° E longitude, affecting the study area (Figure 8d). At 58.25° E, along the latitude from 28.6° N to 28.8° N, at the pressure levels between 400 and 500 hPa, the highest ascending conditions are observed with an omega rate of −0.8 pascal per second (Pa/s) or lower. The streamline map also indicates the occurrence of ascending conditions from lower to upper levels of the atmosphere (Figure 8e). All these factors contribute to the occurrence of precipitation events over the study area (Figure 8f).
2.
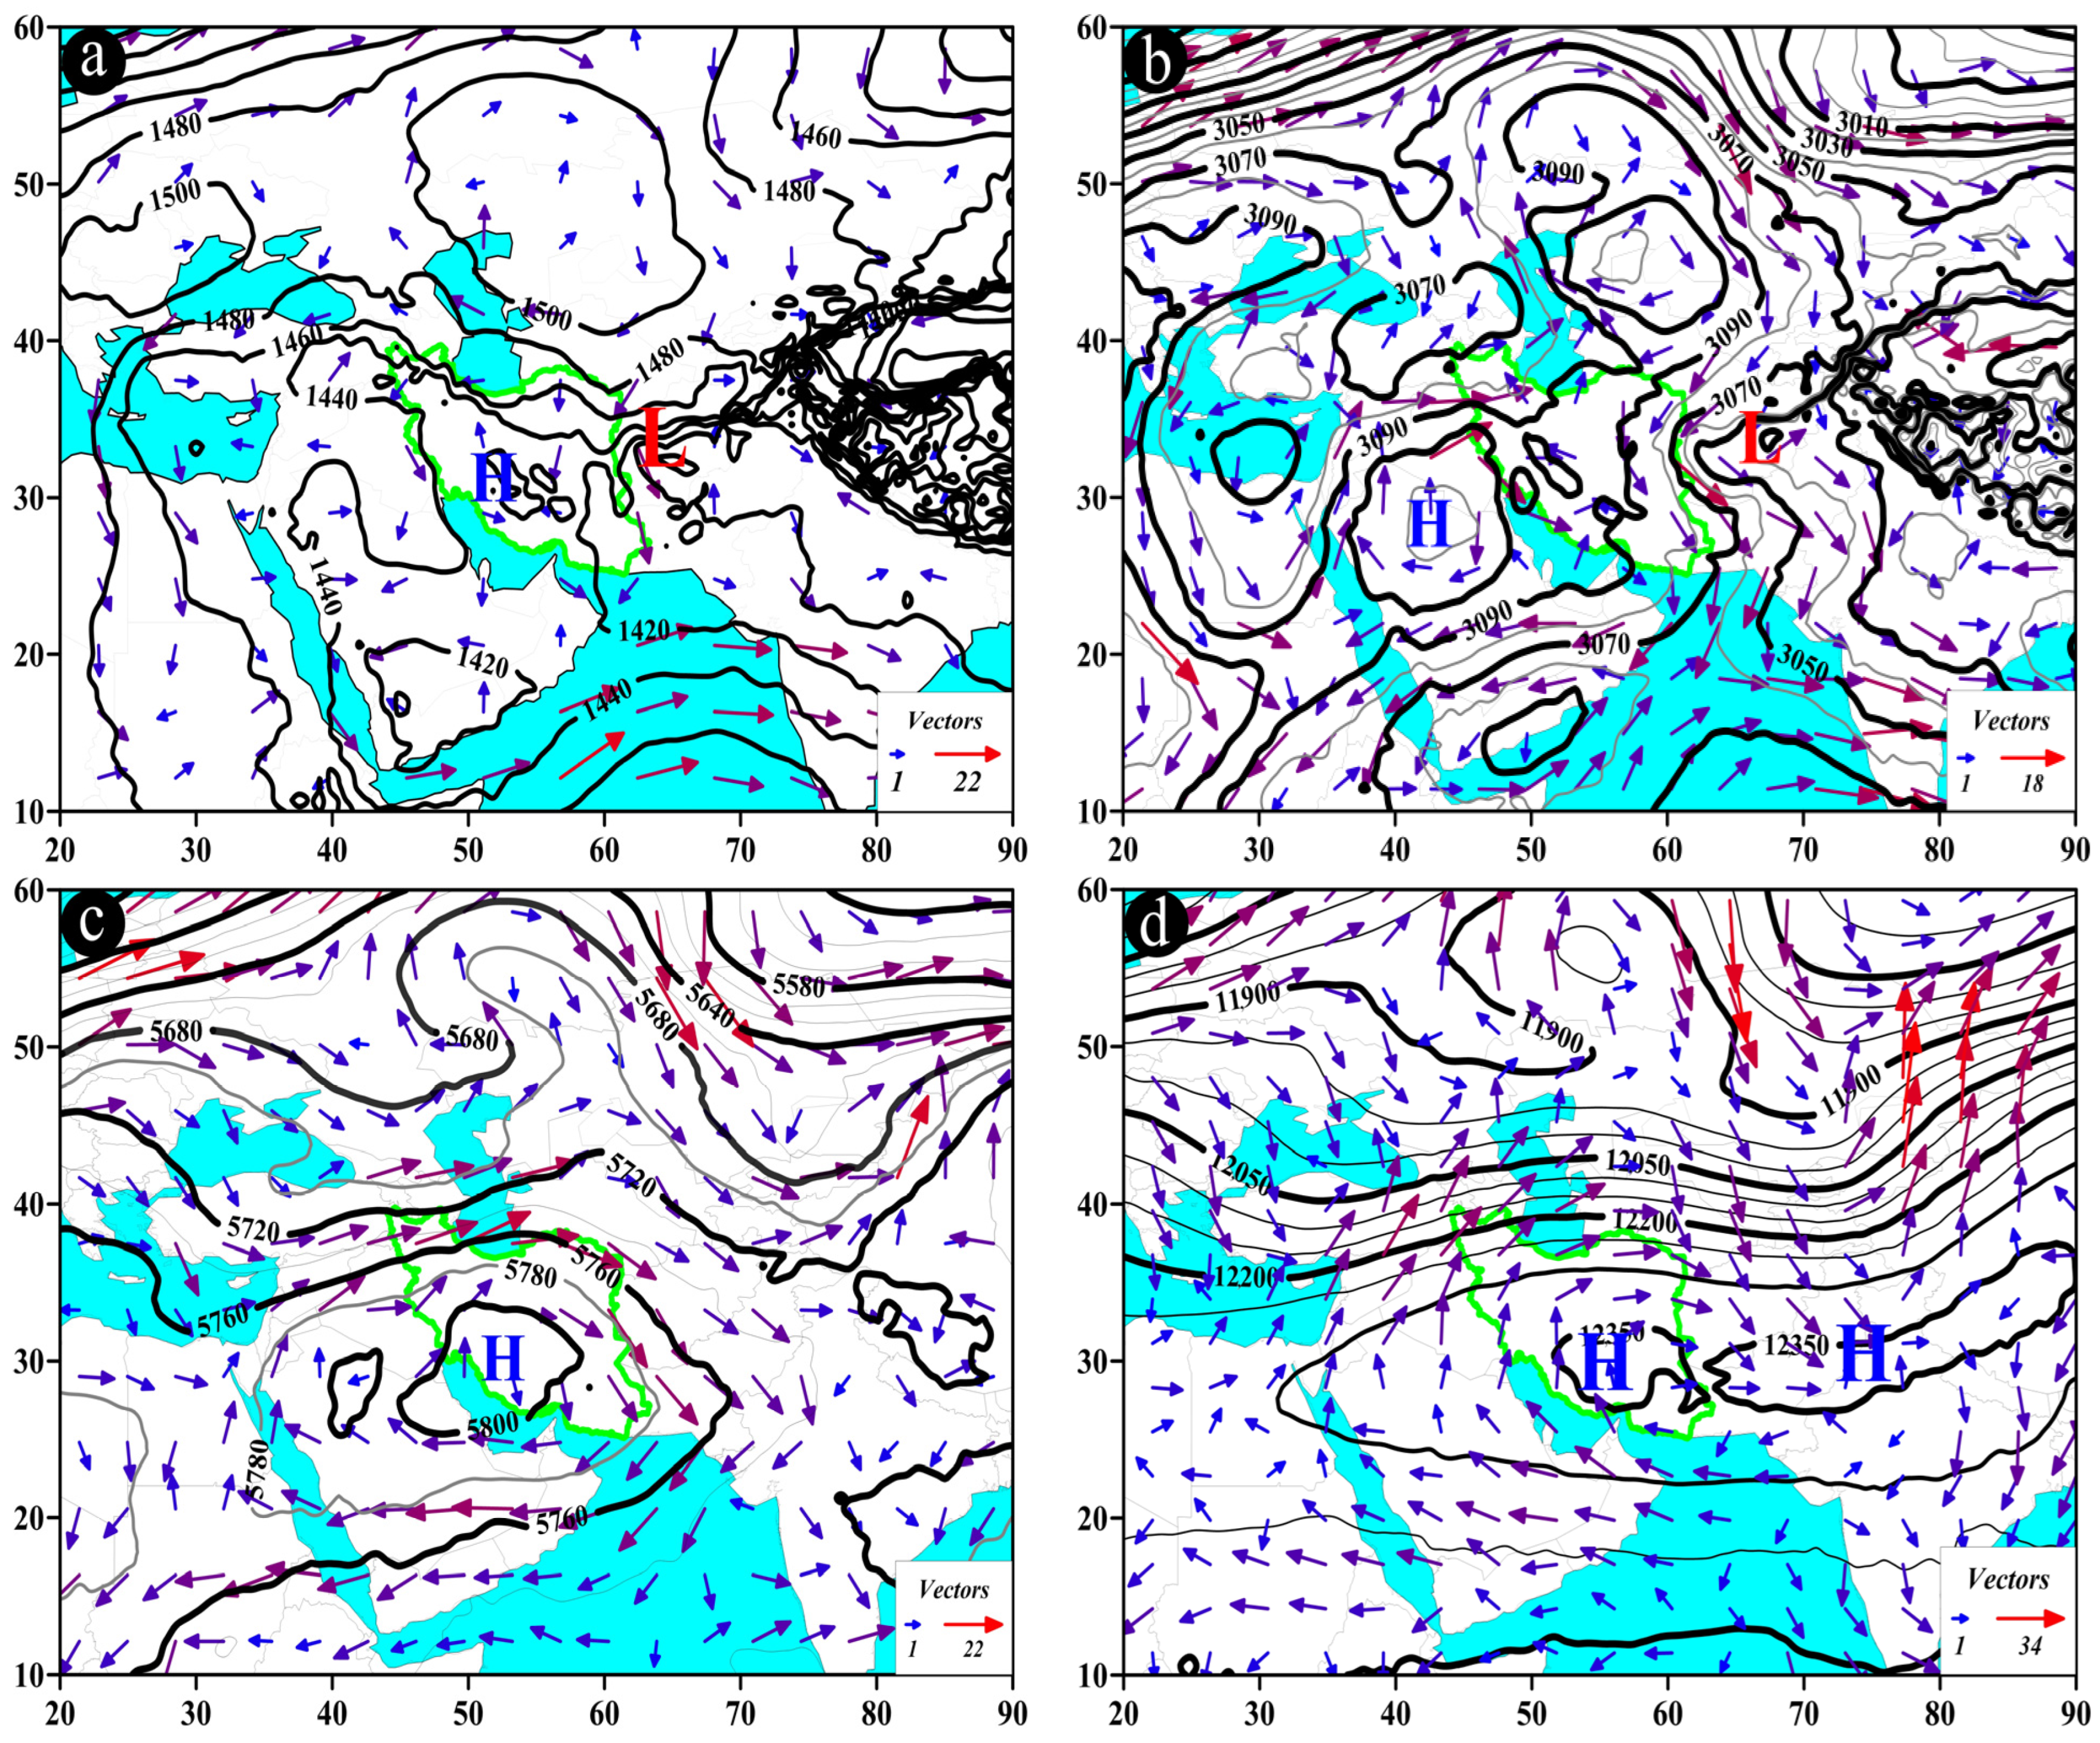
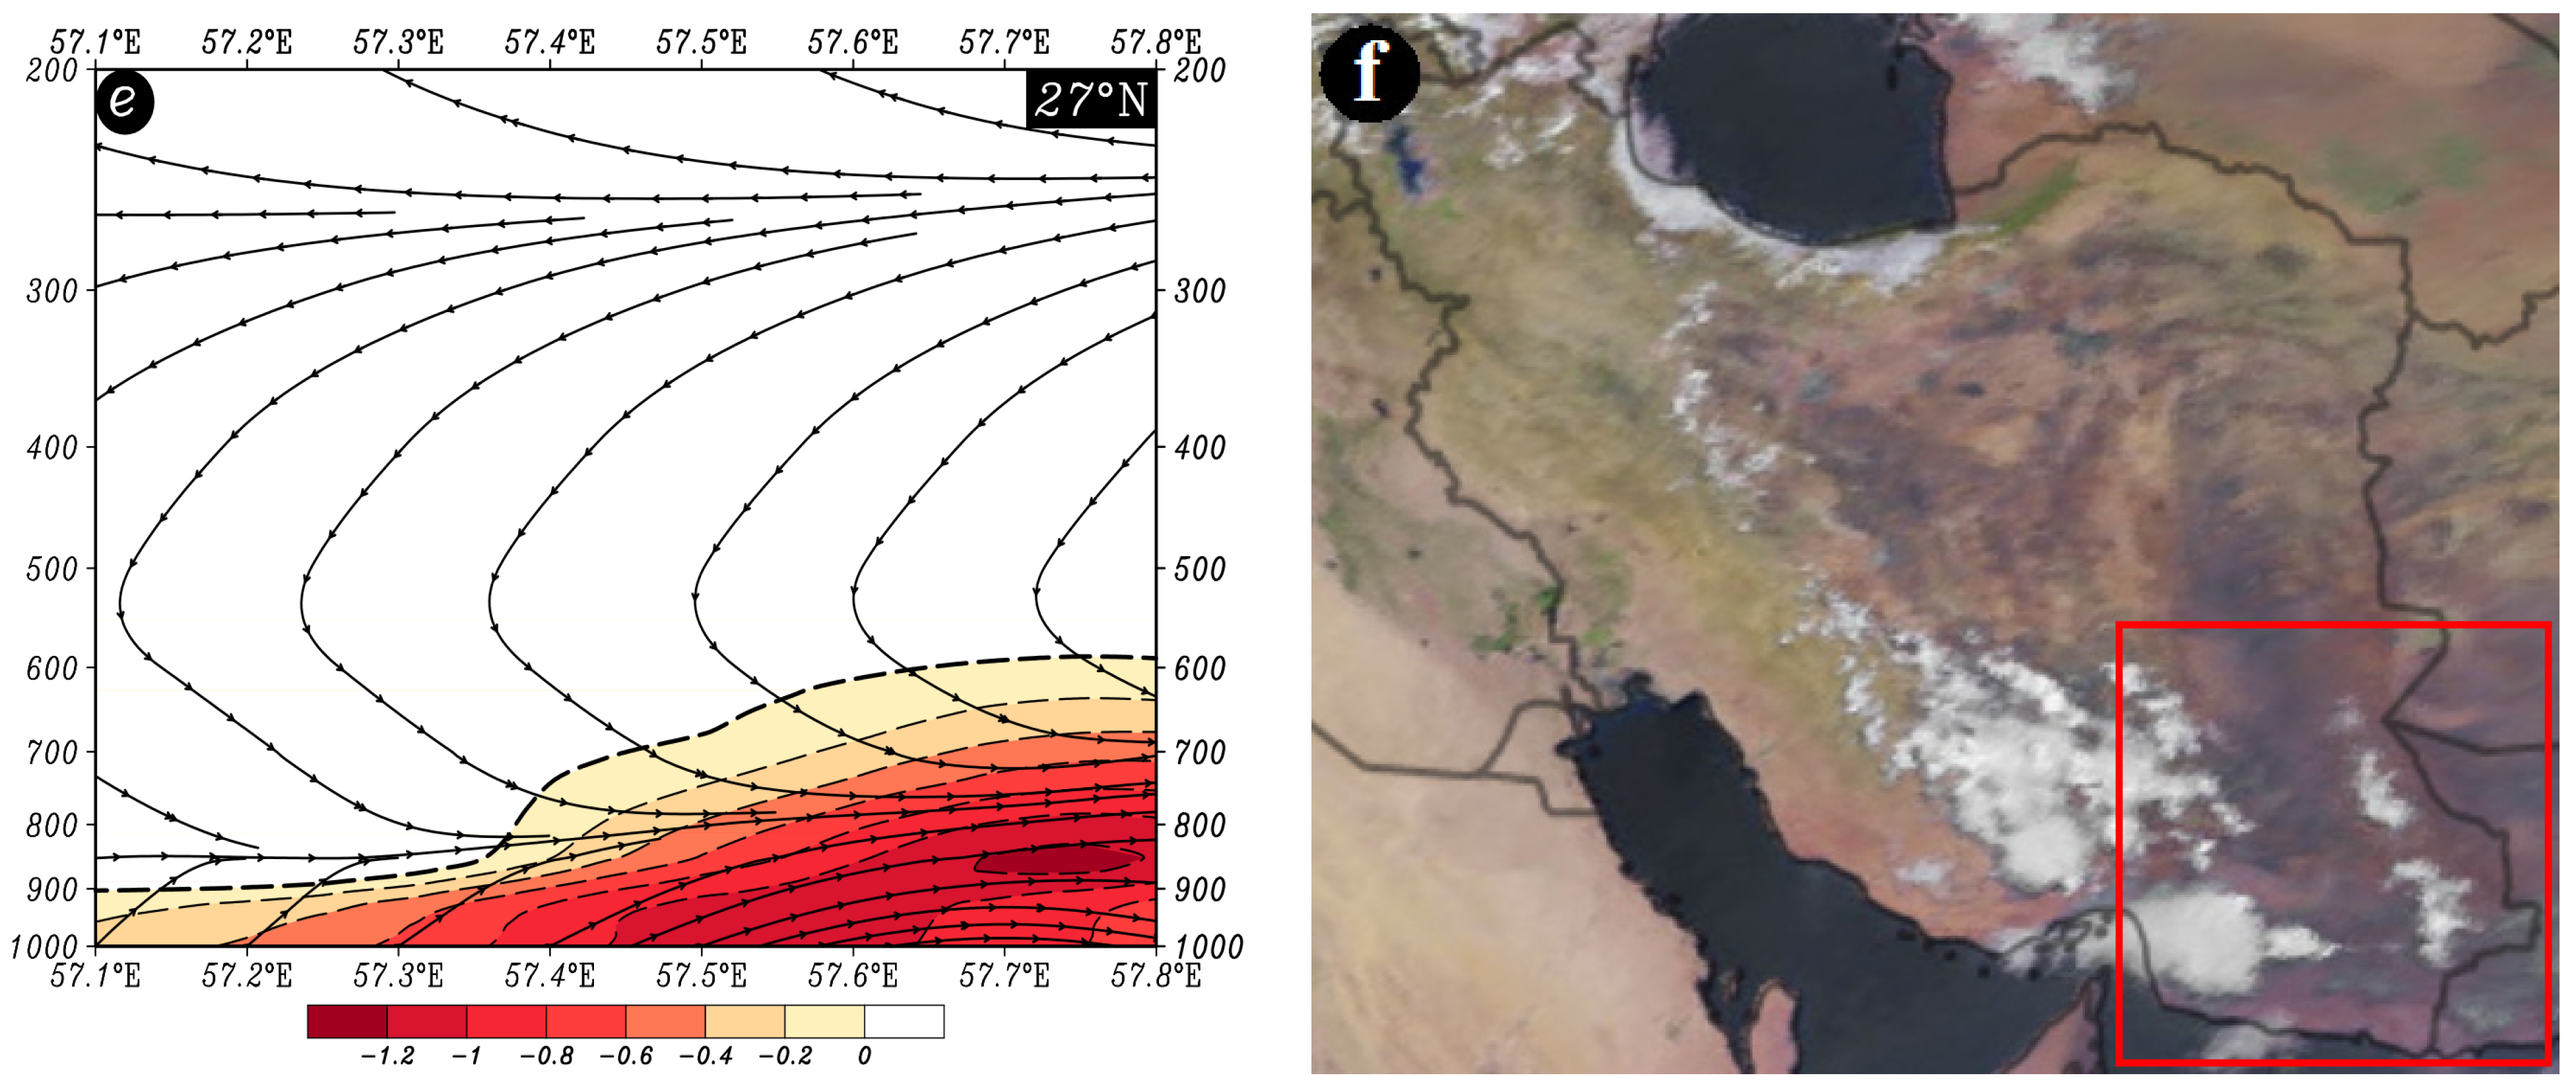
BP pattern (on the example of 23 July 1995)
The BP pattern, also referred to as the monsoon tongue pattern, is illustrated in Figure 9. In this pattern, the low-pressure center is typically located above the Gulf of Oman, north of the Arabian Sea, and northeast of the Arabian Peninsula at the 850 hPa pressure level, with its tongues extending over the study area (Figure 9a). At the 700 hPa pressure level, a low-pressure center is observed over the northeast of the Arabian Peninsula, with its extensions reaching across southeastern Iran. This influence is directed from southeast to northwest, and wind speeds range from 6 to 18 m/s (Figure 9b).
A prominent circulation feature at the 500 hPa level is the presence of a monsoon system over the east and northeast of the Arabian Peninsula. The core of the monsoon system migrates west and northwest from the eastern Arabian Sea to the Arabian Peninsula and Iran [81,82,83,84,85] while its extensions affect the study area with a cyclonic motion. The direction of this influence is southeast to northwest, with wind speeds varying from about 5 to 15 m/s (Figure 9c). At the 200 hPa level, two high-pressure cores can be observed over the southern and southwestern parts of Asia, including Iran, and also over the northwest of Pakistan and eastern Afghanistan. These are known as the dual high cores of the South Asia High (SAH) [86,87,88]. Wind flows over the study area are from east to west, with wind speeds ranging from 6 to 15 m/s (Figure 9d).
At 26.75° N, along longitudes ranging from 61.9° E to about 62.1° E, the highest upward vertical motion occurs in the 1000 to 850 hPa range, with an omega rate of −0.4 Pa/s and less. The streamlines map confirms the presence of upward motion from lower to upper levels of the atmosphere (Figure 9e). This phenomenon (Figure 9e) depicts the breakdown of upward movements in the mid-troposphere, explaining the limited occurrence of heavy precipitation despite high precipitable water content in the atmosphere. Such conditions contribute to the formation of light rains over the study area (Figure 9f).
3.
CP pattern (on the example of 8 August 2006)
The CP pattern, also known as the boundary pattern, is presented in Figure 10. At an 850 hPa pressure level, a low-pressure center is typically situated over the western region of Afghanistan, and its extensions cover the study area. Concurrently, a high-pressure system is observable over southwest Asia, particularly in central Iran, which can result in a pressure gradient and an increase in instability. Due to the cyclonic circulation of the low-pressure system, the prevailing wind direction is northeast-southwest, with wind speeds ranging from 3 to 15 m/s over the study area (Figure 10a). At a 700 hPa pressure level, a low-pressure center is observed over western Afghanistan and eastern Iran, with its extensions covering the eastern parts of the study area. Again, the cyclonic circulation of the low system imparts a northeast-southwest direction, with wind speeds ranging from 3 to 12 m/s. Concurrently, a high-pressure system is apparent over the southwest of Iran, with its extensions covering the western parts of the study area (Figure 10b).
In the CP pattern, a significant circulation feature at the 500 hPa pressure level is the juxtaposition of the low-pressure system over Afghanistan and the high-pressure system over southwest Asia. This juxtaposition leads to the compression of contour lines and intensification of gradients over the study area. Following the interaction of these two systems, the direction of atmospheric flow at the 500 hPa level is northwest-southeast over the study area. Due to the heightened gradient at this level, wind speeds vary from 5 to 25 m/s (Figure 10c).
At the 200 hPa pressure level, the dual high cores of SAH are visible over southwest and south Asia (Figure 10d). At approximately 28.25° N and along longitudes ranging from 58.1 to 58.4° E within the 700 to 600 hPa range, the most pronounced upward motion is observed, with an omega rate ranging from −0.6 to −0.8 Pa/s. The streamline map also confirms the presence of upward motion (Figure 10e). This figure (Figure 10e) depicts the breakdown of upward motions in the mid-troposphere, explaining the limited occurrence of substantial precipitation despite the high content of precipitable water in the atmosphere. Such conditions are responsible for the formation of precipitation events over the study area (Figure 10f).
4.
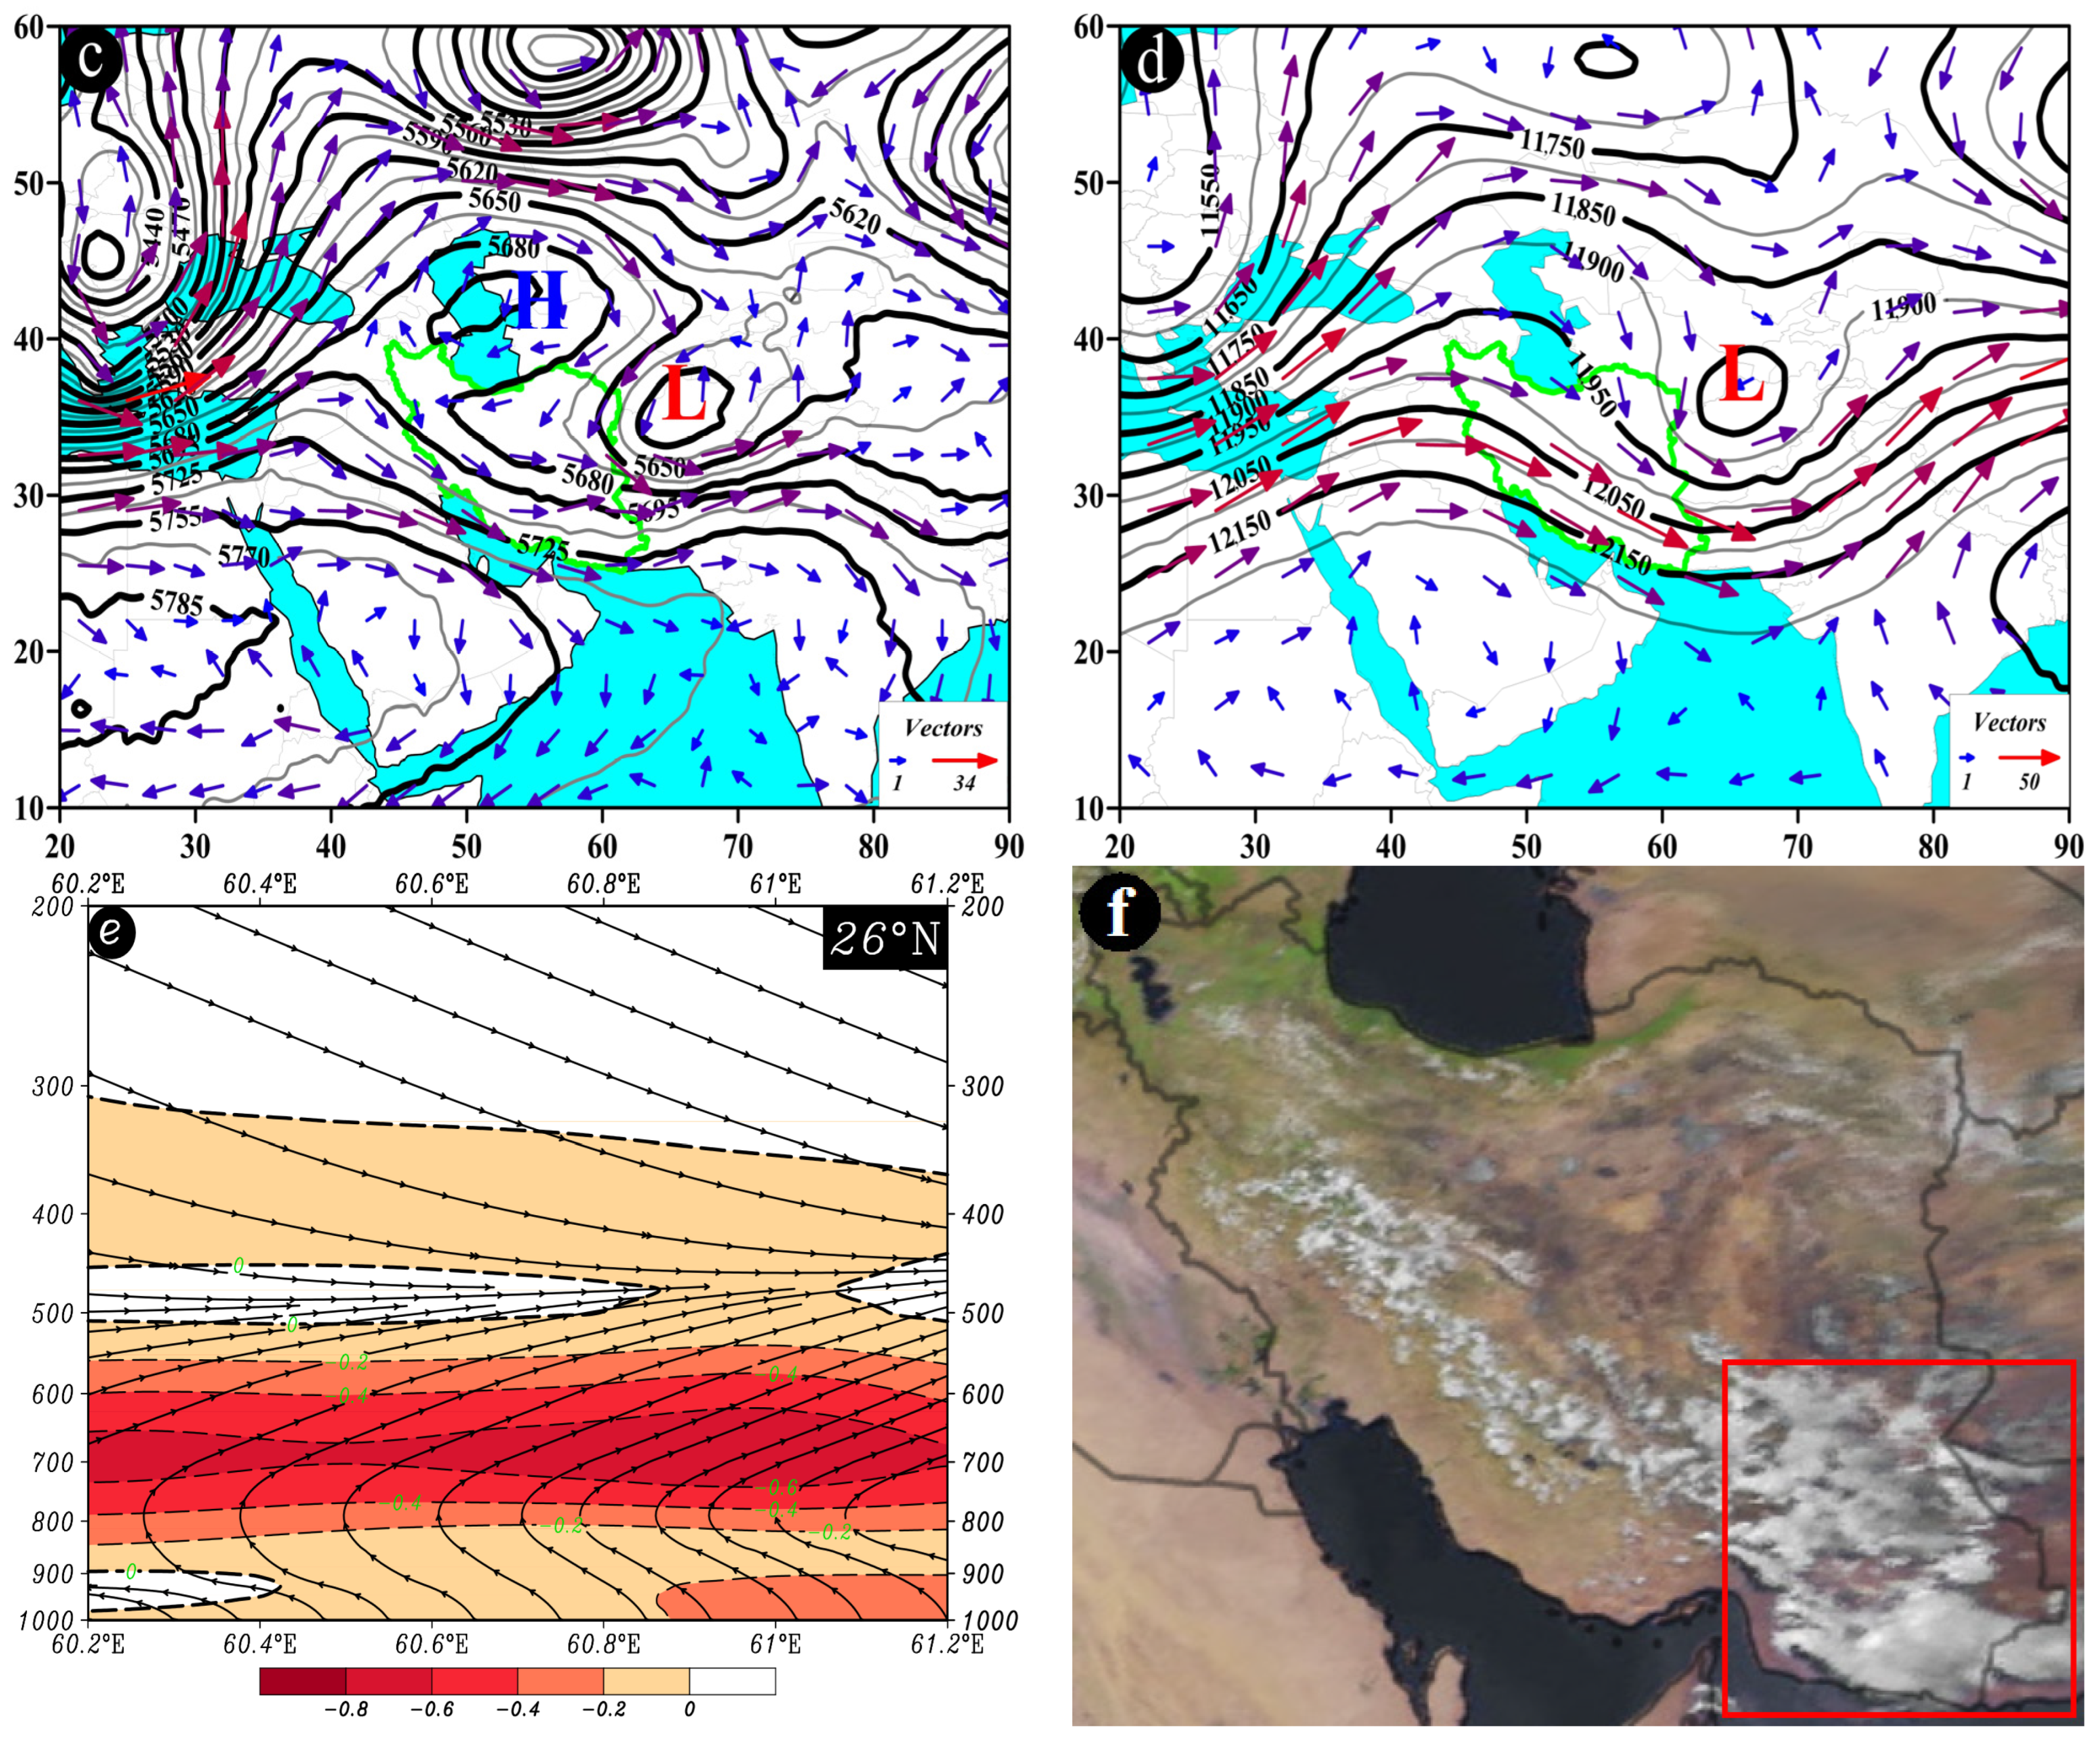
DP pattern (on the example of 11 June 2005)
The DP pattern, also referred to as the blocking low pattern, is illustrated in Figure 11. At the 850 hPa pressure level, a low-pressure center is situated over central and northern Afghanistan, while a high-pressure center over the north and northeast of the Caspian Sea, above Uzbekistan and Kazakhstan, is commonly observed. The cyclonic circulation of the low core above Afghanistan determines the direction of its impact on the study area, which is primarily northeast-southwest and, to some extent, north-south. Wind speeds over the study area vary from 3 to 18 m/s (Figure 11a). At 700 hPa level, the low center (right blocking arm) is positioned over Afghanistan, with the high-pressure center northeast of the Caspian Sea, spanning Turkmenistan, Uzbekistan, and Kazakhstan. Another low core (left blocking arm) is evident above Eastern Europe. The cyclonic circulation of the low system over Afghanistan results in its impact on the study area, primarily in the northeast-southwest direction, with wind speeds ranging from 3 to 15 m/s (Figure 11b).
A notable feature of the DP pattern at the 500 hPa pressure level is the presence of an omega-shaped blocking pattern. At this level, the low core of the right blocking arm is often situated over Afghanistan, Turkmenistan, or Uzbekistan, while the high core of the blocking system is frequently located above the Caspian Sea. Another low core (left blocking arm) can be observed over the Black Sea or the Northern Mediterranean and Eastern Europe. Due to the cyclonic circulation of the low system of the right blocking arm, its influence on the study area occurs in the northeast-southwest direction, with wind speeds varying from 7 to 25 m/s (Figure 11c). At 200 hPa pressure level, the low core is positioned in northern Afghanistan, southeastern Turkmenistan, and southern Tajikistan. A northeast-southwest trough extends from 35 to about 22° N, covering the study area. The trough’s location above the study area results in northwest-southeast wind directions, with wind speeds ranging from 24 to 45 m/s (Figure 11d). At approximately 26° N, along longitudes from 60.2 to 61.2° E, the highest upward motion conditions can be observed between 750 and 650 hPa, with omega rates less than −0.6 Pa/s. The streamline map also confirms the presence of upward motion from the lower to the upper levels of the atmosphere (Figure 11e). These conditions often result in precipitation falls in the study area (Figure 11f).
5.
EP pattern (on the example of 31 July 2016)
The EP pattern, often referred to as a high pattern, is depicted in Figure 12. In this pattern, at the 850 hPa pressure level, the center of the low-pressure zone is typically situated over eastern to central Afghanistan, and sometimes extending into western Pakistan. The cyclonic circulation results in a northeast-southwest wind direction, with wind speeds varying from 3 to 15 m/s. Simultaneously, a high-pressure center is observed over the central and southwestern parts of Iran (Figure 12a). At the 700 hPa pressure level, a low-pressure core is located over the eastern part of Afghanistan. The influence and impact of this low-pressure system in generating EAPE vary from northeast-southwest to north-south, as well as northwest-southeast. Wind speeds over the study area range from 3 to 9 m/s. Concurrently, the high-pressure core is visible over northeastern Saudi Arabia, and the central and southwestern regions of Iran (Figure 12b).
The distinctive circulation feature at the 500 hPa pressure level Is the presence of a high-pressure system over Southwest Asia, encompassing Iran and the Arabian Peninsula. This anti-cyclonic system results in a northwest-southeast wind direction, with wind speeds ranging from approximately 3 to 15 m/s (Figure 12c). At the 200 hPa pressure level, a high-pressure system with two cores is observed over South and Southwest Asia. The western core is situated above the study area. The atmospheric stream over the coastal and southern areas has an east-west direction, while over the northern part, it is west-east. Wind speeds vary from 6 to 15 m/s (Figure 12d). At 27° N and along longitudes from 57.1 to 57.8° E, the highest upward motion conditions occur between pressure levels of 900 and 800 hPa, with omega rates less than −1.2 Pa/s. The streamline map confirms upward motion from the lower levels up to about 700 hPa (Figure 12e). This figure (Figure 12e) illustrates the breakdown of upward motions in the mid-troposphere, which explains the limited precipitation despite the high precipitable water content in the atmosphere. All of these conditions contribute to the formation of light rains in the study area (Figure 12f).

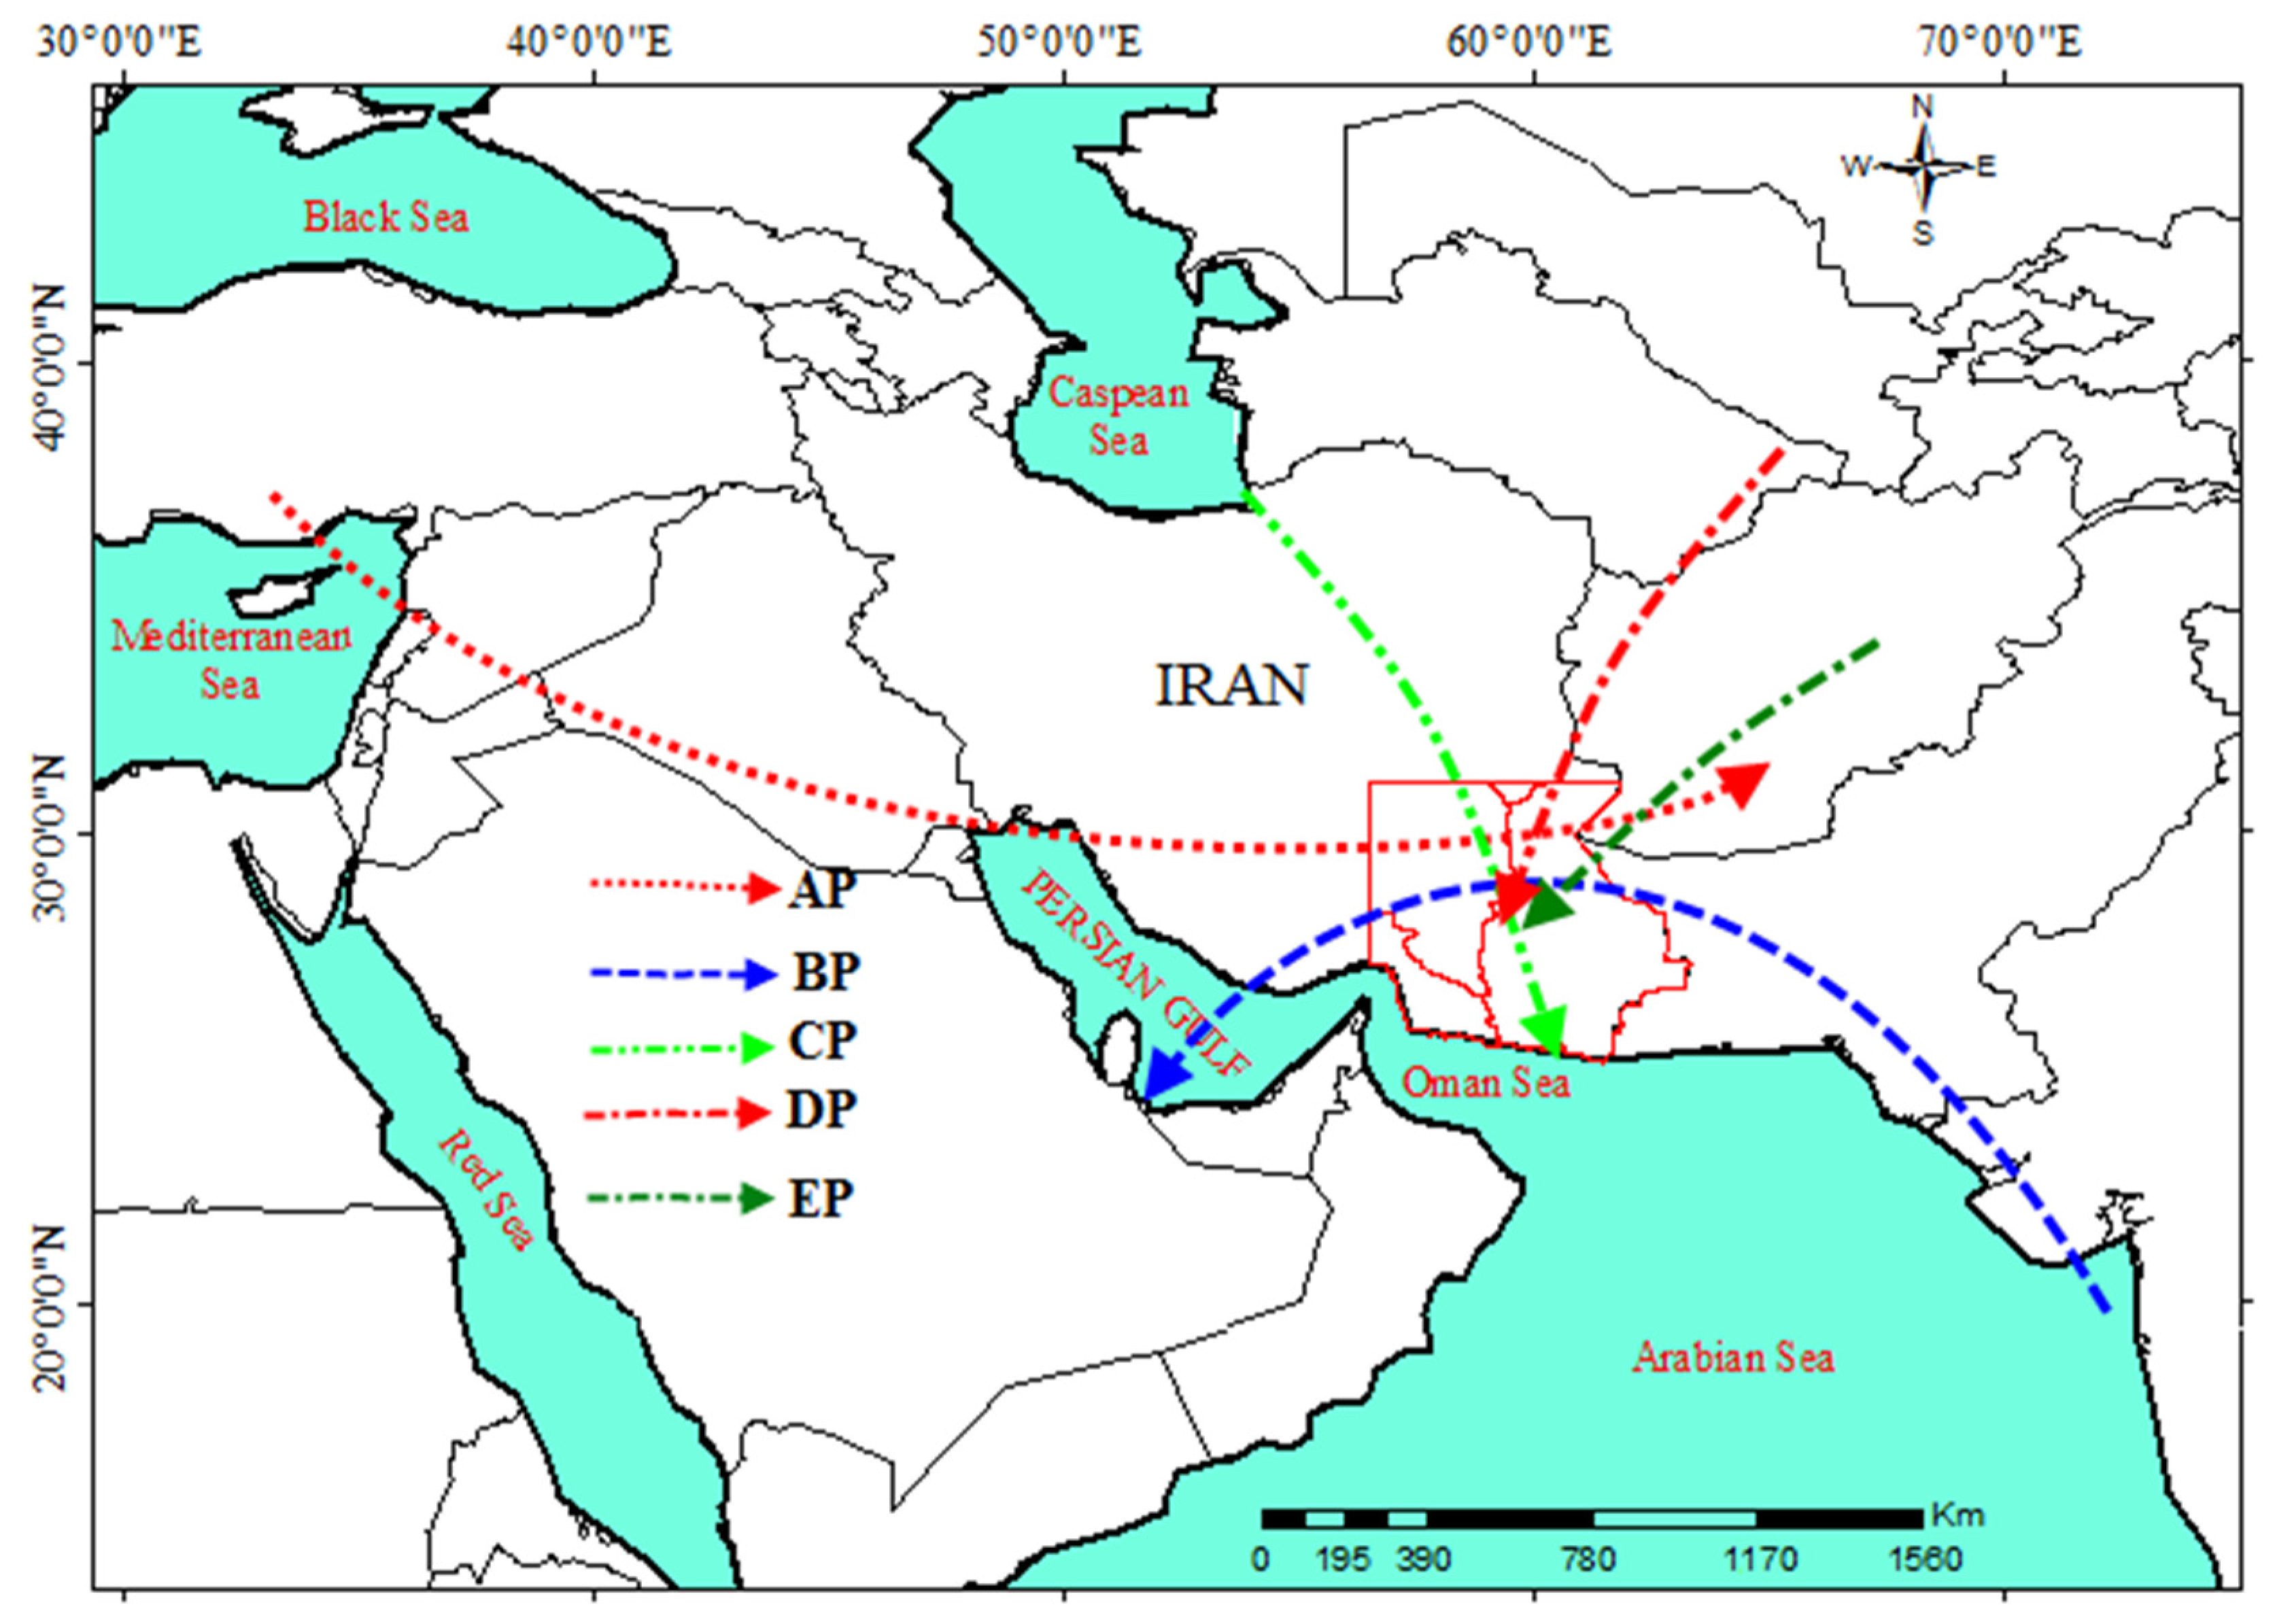
3.6. Trajectory of Circulation Patterns

Figure 13 illustrates the entry routes of the five patterns that give rise to EAPE in southeastern Iran. According to Figure 13, the AP pattern (indicated by a dotted line and a red arrow) takes the form of a trough originating from the east of the Mediterranean Sea, moving eastward towards Iran, particularly the study area, and plays a crucial role in the occurrence of precipitation. In the BP pattern (represented by a dashed line and a blue arrow), the monsoon low-pressure system moves west and northwest from the east of the Arabian Sea toward the Arabian Peninsula and Iran. The influence of this pattern extends to various regions, including the study area, with a cyclonic circulation (counterclockwise) in the southeast-northwest direction. The path of the CP pattern’s impact and its contribution to the creation of EAPE over the study area is northwest-southeast, marked as a dashed line with two points and a green arrow. The DP pattern, which plays the most significant role in generating EAPE in the study area, influences it with a northeast-southwest path, denoted by a dot-dashed line with a red arrow. The northeast-southwest trajectory of the EP pattern is indicated as a dot-dashed line with a green arrow.

4. Discussion

Special attention must be given to the role of circulation patterns and synoptic systems. The intensity and types of pressure systems and atmospheric circulation patterns play a key role in explaining the climatic conditions and the variability of meteorological elements for this specific geographical area [1,2,3,4]. In southeastern Iran, the number of rainy days has shown a decreasing trend, while the precipitation rate remained almost constant during the study period. Analysis revealed that out of 1226 days with precipitation, precipitation was observed simultaneously at four or more stations on only 252 rainy days. Among these 252 rainy days, EAPE occurred only on 62 days. An analysis of these 62 cases of precipitation in the southeast of Iran revealed the existence of five causal patterns (AP, BP CP, DP, and EP) responsible for summer precipitation in southeastern Iran. It was identified that three of these patterns (AP, BP, and DP) were responsible for 71% of the cases of precipitation occurrence in the study area.
The presence of a trough over the west of Iran and the positioning of the study area in front of this trough are prominent features of the AP pattern (trough pattern). This observation aligns with the findings of Saligheh and Sadegineia [89], Armeshetal. [36], and KhoshAkhlagh et al. [37], who have emphasized the significance of the western trough in driving summer precipitations in southeastern Iran. In the case of the BP pattern (monsoon tongue pattern), a distinctive feature is the migration of the monsoon core towards the west and northwest, extending from the eastern Arabian Sea to the Arabian Peninsula and Iran. This impact leads to a southeast-northwest influence on the study area. These findings are consistent with the research of various authors [22,25,27,28,30,31,32,33,34,36,37,58,89,90,91,92] who have highlighted the western and north-western movement of the monsoon system as a major contributor to summer precipitation. Within the CP pattern (border pattern), a high-pressure system is situated to the west of the study area in southwest Asia. Due to its anti-cyclonic circulation, its extensions reach the southeastern regions of Iran. Simultaneously, there is the presence of a low-pressure system over Afghanistan or Pakistan, and in some instances, the southern part of Uzbekistan. This results in a cyclonic impact, with one of its tongues covering the southeastern part of Iran. In this pattern, the convergence of low and high pressure systems over southeastern Iran, resulting in the intensification of gradients and wind speeds, ultimately leads to the creation of instability. The DP pattern (blocking low tongue pattern) is characterized by omega-shaped blockings. The tongue generated by the right blocking arm of the low-pressure system influences the study area in a northeast-southwest direction. This finding is consistent with the research of AfsharManesh [32], who identified the blocking pattern as one of the influential patterns in summer precipitation in southeastern Iran. The main circulation feature of the EP pattern (high pattern) is the presence of a high-pressure system over Southwest Asia, including Iran, especially the study area, and the Arabian Peninsula. This high-pressure system, due to its anti-cyclonic motion, impacts the region in a northwest-southeast direction. When the EP pattern prevails at the 500 hPa level over the study area, the low-pressure systems, particularly the one located in Afghanistan, and their associated tongues, extending down to 700 hPa, play a significant role in generating EAPE in the region. These findings align with the results of KhoshAkhlagh et al. [37], who considered the high-pressure pattern as one of the primary patterns contributing to summer precipitation in southeastern Iran. The entry routes (system entry paths) of the five patterns causing EAPE in southeastern Iran are as follows: west-east for the AP pattern, southeastern-northwestern for the BP pattern, northwest-southeast for the CP pattern, northeast-southwest for the DP pattern, and northeast-southwest for the EP pattern.
The current study challenges the findings of some prior research on precipitation patterns in southeastern Iran. For example, the research conducted by Nahid et al. [93] concluded that the Gulf of Oman basin does not encounter monsoon systems. However, this study reveals that the Gulf of Oman does, in fact, experience monsoon systems, particularly in the BP pattern as described here. Additionally, Mofidi [20] underestimated the significance of monsoon lows in contributing to summer precipitation in southeastern Iran. Contrary to that, it has been demonstrated that the monsoon pattern (BP pattern) alone accounts for 23% of EAPE occurrences in southeastern Iran. Furthermore, when considered alongside the AP and DP patterns, the monsoon pattern plays a substantial role in driving precipitation in southeastern Iran.

5. Conclusions

Accurate identification of upper-level patterns provides valuable insights into the potential development of atmospheric systems [94]. Analyzing the occurrence and identifying the atmospheric patterns responsible for EAPE in southeastern Iran presents a significant challenge in Iran’s climatological research. This issue is crucial for water resource management [33]. Precipitation in southeastern Iran exhibits substantial temporal and spatial variability due to the continuous interaction between extratropical and tropical circulation systems [21]. The combination of temporal and spatial diversity in atmospheric circulation patterns at the regional scale, along with the variations in local geographical features, contributes to the significant climatic diversity in Iran [95].
In this study, contrary to some earlier reports, it was revealed that the causative factors for identified cases of EAPE events in southeast Iran consist of five recurring patterns (named AP, BP, CP, DP, and EP for convenience). It is noteworthy that three of these patterns (AP, BP, and DP) played a major role in the occurrence of 71% of all summertime EAPE cases. One of the most valuable applications of this study is to enhance forecasters’ understanding of atmospheric conditions before the onset of EAPE in southeastern Iran. In general, the findings of this study encompass important concepts that are beneficial for predicting summer precipitation. In other words, this study contributes to a more accurate understanding of summer precipitation patterns and, consequently, to the improvement of the accuracy of precipitation predictions for this region.

Author Contributions

Conceptualization, M.H.M. and E.A.; Data curation, M.H.M. and F.K.; Formal analysis, M.H.M. and E.A.; Funding acquisition, J.K.; Investigation, M.H.M., E.A., F.K., I.R., H.O., P.B. and J.K.; Methodology, M.H.M. and E.A.; Project administration, F.K. and J.K.; Resources, M.H.M.; Software, M.H.M.; Supervision, H.O. and J.K.; Validation, M.H.M., F.K., I.R., H.O., P.B. and J.K.; Visualization, M.H.M.; Writing—original draft, M.H.M., E.A., F.K. and I.R.; Writing—review and editing, I.R., H.O., P.B. and J.K. All authors have read and agreed to the published version of the manuscript.

Funding

This work was supported by Vedurfelagid, Rannis and Rannsoknastofa i vedurfraedi.

Institutional Review Board Statement

Not applicable.

Informed Consent Statement

Not applicable.

Data Availability Statement

The data from synoptic and rain gauge stations can be obtained from the IRIMO [54] and the IRANWRMC [55]. The reanalysis data used in this manuscript is publicly available on the Climate Data Store (CDS) of the European Centre for Medium-Range Weather Forecast [56]. To identify cloudy conditions on sample days, satellite images in a visible range were downloaded from the EUMETSAT satellite [57] which is also publicly available.

Acknowledgments

The authors are thankful to IRIMO and IRANWRMC for the synoptic and rain gauge data stations, respectively. Also, the authors are grateful to ECMWF and EUMETSAT for the reanalysis data and satellite images, respectively. The authors are deeply appreciative to Haraldur Olafsson from Institute for Atmospheric Sciences-Weather and Climate, and Department of Physics, University of Iceland, and Icelandic Meteorological Office (IMO) for his great support, kind guidance, and encouragement.

Conflicts of Interest

The authors declare no conflict of interest.

References

  1. Barry, R.G.; Perry, A.H. Synoptic Climatology: Methods and Applications, 1st ed.; Routledge Kegan & Paul: London, UK, 1973; 552p. [Google Scholar]
  2. Barry, R.G.; Carleton, A.M. Synoptic and Dynamic Climatology, 1st ed.; Routledge: New York, NY, USA, 2001; 640p. [Google Scholar] [CrossRef]
  3. Barry, R.G.; Chorley, R.J. Atmosphere, Weather and Climate, 1st ed.; Taylor & Francis: London, UK, 2009; 536p. [Google Scholar] [CrossRef]
  4. Vasquez, T. Weather Analysis & Forecasting Handbook, 1st ed.; Weather Graphics Technologies: Palestine, TX, USA, 2015. [Google Scholar]
  5. Abbasi, E.; Etemadi, H.; Smoak, J.M.; Amouniya, H.; Mahoutchi, M.H. Dust storm source detection using ANP and WRF models in southwest of Iran. Arab. J. Geosci. 2021, 14, 1529. [Google Scholar] [CrossRef]
  6. Rahimi, Y.G.; Abbasi, E.; Farajzadeh, M. Analysis of the effect of Tropical Cyclone Phet on the occurrence of heavy rainfall and floods in Chabahar, Iran. Weather 2015, 70, 348–352. [Google Scholar] [CrossRef]
  7. Rousta, I.; Khosh Akhlagh, F.; Soltani, M.; Modir Taheri, S.S. Assessment of Blocking Effects on Rainfall in Northwestern Iran; Kanakidou, M., Mihalopoulos, N., Nastos, P., Eds.; Crete University Press: Iraklio, Greek, 2014; Volume 1. [Google Scholar]
  8. Rousta, I.; Moniruzzaman, M.; Olafsson, H.; Zhang, H.; Baranowski, P.; Tkaczyk, P.; Lipińska, H.; Kępkowicz, A.; Krzyszczak, J. Investigation of the Vegetation Coverage Dynamics and its Relation to Atmospheric Patterns in Kabul River Basin in Afghanistan. Pure Appl. Geophys. 2022, 179, 3075–3094. [Google Scholar] [CrossRef]
  9. Abbasi, E.; Etemadi, H.; Smoak, J.M.; Rousta, I.; Olafsson, H.; Baranowski, P.; Krzyszczak, J. Investigation of atmospheric conditions associated with a storm surge in the south-west of Iran. Atmosphere 2021, 12, 1429. [Google Scholar] [CrossRef]
  10. Fiddes, S.L.; Pezza, A.B.; Barras, V. Synoptic climatology of extreme precipitation in alpine Australia. Int. J. Clim. 2015, 35, 172–188. [Google Scholar] [CrossRef]
  11. Chen, T.C.; Tsay, J.D.; Matsumoto, J. Interannual variation of the summer rainfall center in the South China Sea. J. Clim. 2017, 30, 7909–7931. [Google Scholar] [CrossRef]
  12. Webster, P.J.; Toma, V.E.; Kim, H.M. Were the 2010 Pakistan floods predictable? Geophys. Res. Lett. 2011, 38, L04806. [Google Scholar] [CrossRef]
  13. Wu, G.; Liu, Y.; He, B.; Bao, Q.; Duan, A.; Jin, F.F. Thermal controls on the asian summer monsoon. Sci. Rep. 2012, 2, 404. [Google Scholar] [CrossRef] [PubMed]
  14. Wang, Z.; Yang, S.; Duan, A.; Hua, W.; Ullah, K.; Liu, S. Tibetan Plateau heating as a driver of monsoon rainfall variability in Pakistan. Clim. Dyn. 2019, 52, 6121–6130. [Google Scholar] [CrossRef]
  15. Ullah, W.; Guojie, W.; Gao, Z.; Tawia Hagan, D.F.; Bhatti, A.S.; Zhua, C. Observed Linkage between Tibetan Plateau Soil Moisture and South Asian Summer Precipitation and the Possible Mechanism. J. Clim. 2021, 34, 361–377. [Google Scholar] [CrossRef]
  16. Yang, Y.; Wang, R.; Chen, F.; Liu, C.; Bi, X.; Huang, M. Synoptic weather patterns modulate the frequency, type and vertical structure of summer precipitation over Eastern China: A perspective from GPM observations. Atmos. Res. 2021, 249, 105342. [Google Scholar] [CrossRef]
  17. Yamada, T.J.; Takeuchi, D.; Farukh, M.A.; Kitano, Y. Climatological characteristics of heavy rainfall in northern Pakistan and atmospheric blocking over western Russia. J. Clim. 2016, 29, 7743–7754. [Google Scholar] [CrossRef]
  18. Raghavan, K.; Sabin, T.P.; Mujumdar, M.; Priya, P. Extreme monsoon precipitation events over South Asia in a warming world. Geophys. Res. Abstr. 2012, 14, EGU2012-7293. [Google Scholar]
  19. Kaviani, M.R. A statistical analysis of Iran’s rainfall regime. J. Geogr. Educ. Growth 1988, 1, 4–12. [Google Scholar]
  20. Mofidi, A. The Analysis of Summertime Atmospheric Circulation over Iran and It’s Relation to Summertime Precipitation in Iran Plateau. Ph.D. Thesis, Tarbiat Moallem University, Tehran, Iran, 2007; 165p. [Google Scholar]
  21. Alijani, B. Iran Climate; Payame Noor University Press: Tehran, Iran, 2018; 224p. [Google Scholar]
  22. Snead, R.E. Weather patterns in southernwest Pakistan. Arch. Meteorol. Geophys. Bioclimatol. 1968, 16, 316–346. [Google Scholar] [CrossRef]
  23. Sawyer, J.S. The structure of the intertropical front over N.W. India during the S.W. Monsoon. Q. J. R. Meteorol. Soc. 1947, 73, 346–369. [Google Scholar] [CrossRef]
  24. Taghizadeh, H. Analysis of rainfall on 1 August 1987. J. Geol. Educ. Growth 1987, 1, 26–37. [Google Scholar]
  25. Parvand, H. The Effect of Southwestern Monsoon on Iran. Dissertation, University of Tehran, Tehran, Iran, 1991. [Google Scholar]
  26. Junbakhsh, H.A. Synoptic Investigation of Floods in Lar City. Master’s Thesis, Institute of Geophysics, University of Tehran, Tehran, Iran, 1995; 160p. [Google Scholar]
  27. Saligheh, M. Dynamic interaction of mid-latitudes and low latitudes pressure systems in Iran. J. Growth Educ. Geogr. 2001, 57, 21–24. [Google Scholar]
  28. Saligheh, M. Synoptic pattern of summer rainfall in southeastern of Iran. Geogr. Res. Q. 2001, 16, 114–125. [Google Scholar]
  29. Saligheh, M. Modeling the effects of low-pressure climate in the subtropical region. Geogr. Res. Q. 2003, 70, 74–90. [Google Scholar]
  30. Arabi, Z. Synoptic analysis of rainfall from July 21 to 26, 1999 in Iran. Geogr. Res. Q. 2006, 38, 1–16. [Google Scholar]
  31. Saligheh, M. Precipitation mechanisms in the southeast of the country. J. Geogr. Res. 2006, 55, 1–13. [Google Scholar]
  32. AfsharManesh, H. Synoptic Analysis of Summer Precipitation in Southeastern of Iran. Master’s Thesis, University of Tehran, Tehran, Iran, 2010; 145p. [Google Scholar]
  33. Alijani, B.; Mofidi, A.; Jafarpour, Z.; Aliakbari-Bidokhti, A. Circulation patterns of monsoon rains in Iran during July 1994. J. Appl. Res. Geogr. Sci. 2008, 7, 7–38. [Google Scholar]
  34. Alijani, B.; Mofidi, A.; Aliakbari-Bidokhti, A. Atmospheric circulation patterns of the summertime rainfalls of southeastern Iran during July 1994. J. Earth Sp. Phys. 2011, 37, 205–227. [Google Scholar]
  35. Abkharabat, S.; Rezaeibanafsheh, M.; Jahanbakhsh-Asl, S.; Karimi, M.; Rasouli, A.A. Dynamical- synoptical analysis of summer precipitation process in Southeast Iran. Phys. Geogr. Res. Q. 2016, 48, 335–349. [Google Scholar] [CrossRef]
  36. Armesh, M.; Khosravi, M.; Saligheh, M. Synoptic Study of the Influence of Monsoon System in South-East Iran. Clim. Chang. Hazards 2019, 1, 102–135. [Google Scholar]
  37. KhoshAkhlagh, F.; Azizi, G.; Lashkari, H.; Mahoutchi, M.H. Analysis of the Synoptic-Dynamic Patterns of Inclusive Summer Super-Heavy Rainfalls in Southeast Of Iran. Geogr. Plan. Sp. 2019, 9, 185–202. [Google Scholar] [CrossRef]
  38. NCC-a. Atlas of Maps and Spatial Information “Sistan and Baluchestan Provice”; National Cartographic Center (NCC): Tehran, Iran, 2018. Available online: https://www.ncc.gov.ir/en/ (accessed on 18 April 2023).
  39. NCC-b. Atlas of Maps and Spatial Information “Kerman Provice”; National Cartographic Center (NCC): Tehran, Iran, 2018. Available online: https://www.ncc.gov.ir/en/ (accessed on 18 April 2023).
  40. NCC-c. Atlas of Maps and Spatial Information “Hormozgan Provice”; National Cartographic Center (NCC): Tehran, Iran, 2018. Available online: https://www.ncc.gov.ir/en/ (accessed on 18 April 2023).
  41. Mohammadi, M.; Sobhani, B. Relative Humidity Zoning of Sistan-Baluchestan Province Using MODIS Satellite Images. Iran. J. Soil Water Res. 2020, 51, 2681–2695. [Google Scholar] [CrossRef]
  42. NDWMC-a. Yearbook of the National Center for Climate and Drought Crisis Management; National Drought Warnin and Monitoring Center (NDWMC): Tehran, Iran, 2021. Available online: http://ndc.irimo.ir (accessed on 28 April 2023).
  43. NDWMC-b. Country Temperature Bulletin; National Drought Warnin and Monitoring Center (NDWMC): Tehran, Iran, 2021. Available online: http://ndc.irimo.ir (accessed on 3 May 2023).
  44. AlaeeTaleghani, M. Geomorphology of Iran; Ghoomes Pulishing Company: Tehran, Iran, 2017; 360p. [Google Scholar]
  45. Raju, P.V.S.; Mohanty, U.C.; Bhatla, R. Onset characteristics of the southwest monsoon over India. Int. J. Climatol. 2005, 25, 167–182. [Google Scholar] [CrossRef]
  46. Pai, D.S.; Rajeevan, M. Prediction of summer monsoon onset over Summer monsoon onset over Kerala. J. Earth Syst. Sci. 2009, 118, 123–135. [Google Scholar] [CrossRef]
  47. Puviarasan, N.; Sharma, A.K.; Ranalkar, M.; Giri, R.K. Onset, advance and withdrawal of southwest monsoon over Indian subcontinent: A study from precipitable water measurement using ground based GPS receivers. J. Atmos. Sol.-Terr. Phys. 2015, 122, 45–57. [Google Scholar] [CrossRef]
  48. IMD India Meteorological Department. Ministry of Earth Sciences, Government of India. Published 2021. Available online: https://mausam.imd.gov.in/ (accessed on 5 June 2023).
  49. Zeng, X.; Lu, E. Notes and Correspondence: Globally unified monsoon onset and retreat indexes. J. Clim. 2004, 17, 2241–2248. [Google Scholar] [CrossRef]
  50. Fasullo, J.; Webster, P.J. A hydrological definition of Indian Monsoon onset and withdrawal. J. Clim. 2003, 16, 3200–3211. [Google Scholar] [CrossRef]
  51. Singh, N.; Ranade, A. Determination of Onset and Withdrawal Dates of Summer Monsoon across India Using NCEP/NCAR Re-Analysis; Indian Institute of Tropical Meteorology: Maharashtra, India, 2010. [Google Scholar]
  52. Babaeian, I.; Rezazadeh, P. On the relationship between Indian monsoon withdrawal and Iran’s fall precipitation onset. Theor. Appl. Climatol. 2017, 134, 95–105. [Google Scholar] [CrossRef]
  53. Syroka, J.; Toumi, R. On the withdrawal of the Indian summer monsoon. Q. J. R. Meteorol. Soc. 2004, 130, 989–1008. [Google Scholar] [CrossRef]
  54. IRIMO Islamic Republic of Iran Meteorology Oraganization. Statistics & Information Office. Published 2021. Available online: https://www.irimo.ir/eng/index.php (accessed on 17 May 2023).
  55. IRANWRMC. IRAN Water Resources Management Company. Power MInisty. Published 2021. Available online: https://www.wrm.ir/?l=EN (accessed on 26 June 2023).
  56. Hersbach, H.; Bell, B.; Berrisford, P.; Hirahara, S.; Horányi, A.; Muñoz-Sabater, J.; Nicolas, J.; Peubey, C.; Radu, R.; Schepers, D.; et al. The ERA5 global reanalysis. Q. J. R. Meteorol. Soc. 2020, 146, 1999–2049. [Google Scholar] [CrossRef]
  57. EUMETSAT. Monitoring Weather And Climate from Space. Available online: https://www.eumetsat.int/ (accessed on 12 July 2023).
  58. Saligheh, M. Synoptic Patterns of Summer Precipitation in Southeastern Iran. Ph.D. Thesis, Tarbiat Modares University, Tehran, Iran, 1998; 208p. [Google Scholar]
  59. Mofidi, A.; Zarrin, A.; Janbazghobadi, G. Determining the synoptic pattern of autumn heavy and extreme precipitations on the southern coast of the Caspian Sea. J. Earth Sp. Phys. 2007, 33, 131–154. [Google Scholar]
  60. Barati, G.; Moradi, M.; Salimi, R. Synoptic Analysis of Heavy Rainfalls during Spring in Zanjan Province. J. Nat. Environ. Hazards 2016, 4, 77–88. [Google Scholar] [CrossRef]
  61. Mohamadei, B.; Masodeian, S.A. Synoptic Analysis of Heavy Precipitation Events in Iran. Geogr. Dev. Iran. J. 2010, 8, 47–70. [Google Scholar] [CrossRef]
  62. Mahoutchi, M.H. Analysis of South Asian Monsoon and Its Relationship with Summertime Rainfall in Southeast of Iran. Dissertation, University of Tehran, Tehran, Iran, 2018. [Google Scholar]
  63. Yarnal, B. Synoptic Climatology in Environmental Analysis: A Primer; Belhaven Press: London, UK, 1993; p. 195. [Google Scholar]
  64. Khokhlov, V.; Umanska, O. European Atmospheric Circulation Classifications. J. Geogr. Environ. Earth Sci. Int. 2018, 16, 1–8. [Google Scholar] [CrossRef]
  65. Catrina, O.; Ştefan, S.; Crăciun, C. Objective identification of Mediterranean cyclones and their trajectories towards Romania. Meteorol. Appl. 2019, 26, 429–441. [Google Scholar] [CrossRef]
  66. Řehoř, J.; Brázdil, R.; Lhotka, O.; Trnka, M.; Balek, J.; Štěpánek, P.; Zahradníček, P. Precipitation in the czech republic in light of subjective and objective classifications of circulation types. Atmosphere 2021, 12, 1536. [Google Scholar] [CrossRef]
  67. Kalkstein, L.S.; Tan, G.; Skindlov, J.A. An Evaluation of Three Clustering Procedures for Use in Synoptic Climatological Classification. J. Appl. Meteorol. Climatol. 1987, 26, 717–730. [Google Scholar] [CrossRef]
  68. Unal, Y.; Kindap, T.; Karaca, M. Redefining the climate zones of Turkey using cluster analysis. Int. J. Climatol. 2003, 23, 1045–1055. [Google Scholar] [CrossRef]
  69. Ward, J.H. Hierarchical Grouping to Optimize an Objective Function. J. Am. Stat. Assoc. 1963, 58, 236–244. [Google Scholar] [CrossRef]
  70. Darand, M.; Garcia-Herrera, R.; Asakereh, H.; Amiri, R.; Barriopedro, D. Synoptic conditions leading to extremely warm periods in Western Iran. Int. J. Clim. 2018, 38, 307–319. [Google Scholar] [CrossRef]
  71. Govender, P.; Sivakumar, V. Application of k-means and hierarchical clustering techniques for analysis of air pollution: A review (1980–2019). Atmos. Pollut. Res. 2020, 11, 40–56. [Google Scholar] [CrossRef]
  72. Rousta, I.; Javadizadeh, F.; Dargahian, F.; Olafsson, H.; Shiri-Karimvandi, A.; Vahedinejad, S.H.; Doostkamian, M.; Monroy Vargas, E.R.; Asadolahi, A. Investigation of Vorticity during Prevalent Winter Precipitation in Iran. Pure Appl. Geophys. 2018, 178, 6941501. [Google Scholar] [CrossRef]
  73. Khoshakhlagh, F.; Mahoutchi, M.H. Synoptic Analysis of Mashhad Severe Thunderstorms. J. Environ. Sci. Technol. 2020, 21, 235–249. [Google Scholar] [CrossRef]
  74. Lamb, H.H. Types and spells of weather around the year in the British Isles: Annual trends, seasonal structure of the year, singularities. Q. J. R. Meteorol. Soc. 1950, 76, 393–429. [Google Scholar] [CrossRef]
  75. Lensky, I.M.; Dayan, U. Satellite observations of land surface temperature patterns induced by synoptic circulation. Int. J. Climatol. 2015, 35, 189–195. [Google Scholar] [CrossRef]
  76. Baltaci, H.; Silva, M.C.L.; da Gomes, H.B. Climatological conditions of the Black Sea-effect snowfall events in Istanbul, Turkey. Int. J. Climatol. 2021, 41, 2017–2028. [Google Scholar] [CrossRef]
  77. Wiley, J.; Mercer, A. An updated synoptic climatology of Lake Erie and Lake Ontario heavy lake-effect snow events. Atmosphere 2020, 11, 872. [Google Scholar] [CrossRef]
  78. Bodenheimer, S.; Nirel, R.; Lensky, I.M.; Dayan, U. Relationship between AOD and synoptic circulation over the Eastern Mediterranean: A comparison between subjective and objective classifications. Atmos. Environ. 2018, 177, 253–261. [Google Scholar] [CrossRef]
  79. Saaroni, H.; Ziv, B.; Lempert, J.; Gazit, Y.; Morin, E. Prolonged dry spells in the Levant region: Climatologic-synoptic analysis. Int. J. Climatol. 2015, 35, 2223–2236. [Google Scholar] [CrossRef]
  80. Saaroni, H.; Ziv, B.; Harpaz, T.; Lempert, J. Dry events in the winter in Israel and its linkage to synoptic and large-scale circulations. Int. J. Climatol. 2019, 39, 1054–1071. [Google Scholar] [CrossRef]
  81. Krishnamurthy, V.; Ajayamohan, R.S. Composite structure of monsoon low pressure systems and its relation to Indian rainfall. J. Clim. 2010, 23, 4285–4305. [Google Scholar] [CrossRef]
  82. Saha, K. Tropical Circulation Systems and Monsoons; Springer: Berlin/Heidelberg, Germany, 2010. [Google Scholar] [CrossRef]
  83. Cohen, N.Y.; Boos, W.R. Has the number of Indian summer monsoon depressions decreased over the last 30 years? Geophys. Res. Lett. 2014, 41, 7846–7853. [Google Scholar] [CrossRef]
  84. Hurley, J.V.; Boos, W.R. A global climatology of monsoon low-pressure systems. Q. J. R. Meteorol. Soc. 2015, 141, 1049–1064. [Google Scholar] [CrossRef]
  85. Hunt, K.M.R.; Turner, A.G.; Inness, P.M.; Parker, D.E.; Levine, R.C. On the Structure and Dynamics of Indian Monsoon Depressions. Mon. Weather Rev. 2016, 144, 3391–3416. [Google Scholar] [CrossRef]
  86. Duan, A.; Wu, G.; Liang, X. Influence of the Tibetan Plateau on the summer climate patterns over Asia in the IAP/LASG SAMIL model. Adv. Atmos. Sci. 2008, 25, 518–528. [Google Scholar] [CrossRef]
  87. Wei, W.; Zhang, R.; Wen, M.; Rong, X.; Li, T. Impact of Indian summer monsoon on the South Asian High and its influence on summer rainfall over China. Clim. Dyn. 2014, 43, 1257–1269. [Google Scholar] [CrossRef]
  88. Li, Z.K.; Guo, D.; Shi, C.H.; Su, Y.C.; Zhao, L.L.; Cai, J.X.; Wang, L.W. Comparison of the seasonal evolution of the South Asian high associated with two types of El Niño event. Atmos. Ocean Sci. Lett. 2017, 10, 183–190. [Google Scholar] [CrossRef]
  89. Saligheh, M.; Sadegineia, A. Investigation Subtropical High Pressure Spatial Variations in Summer Rainfalls of the Southern Half of Iran. Geogr. Dev. Iran. J. 2010, 8, 83–98. [Google Scholar] [CrossRef]
  90. Ramaswamy, C. On a remarkable case of dynamical and physical interaction between middle and low latitude weather systems over Iran. Mausam 1965, 16, 177–200. [Google Scholar] [CrossRef]
  91. Saligheh, M. Investigation of August 1995 in the south and southeast of Iran. J. Geogr. Educ. Growth 1998, 49, 13–17. [Google Scholar]
  92. Saligheh, M. Coordinatin of subtropical-pressure centers in flood-rains of the south and south-easthern Iran. Case study: The rainfall of july 1976. Q. Geogr. Territ. 2004, 1, 105–119. [Google Scholar]
  93. Nahid, S.; Khaleghi, M.; Aliakbari-Bidokhti, A. A barotropic model for tidal currents induced by wind drift in the Oman Sea. NIVAR 1994, 23, 47–64. [Google Scholar]
  94. Lackmann, G. Midlatitude Synoptic Meteorology; American Meteorological Society: Dallas, TX, USA, 2011. [Google Scholar] [CrossRef]
  95. Mofidi, A.; Zarrin, A. Investigating the Nature, Structure and Temporal Variations of Summertime Atmospheric Circulation over Southwest Asia. J. Clim. Res. 2012, 1391, 15–40. [Google Scholar]
Figure 1. Topography of the study area and location of synoptic and rain gauge stations.
Atmosphere 14 01673 g001
Figure 2. Division of the study area according to latitude and longitude. The red dashed lines mark the division of the study area into four sectors.
Atmosphere 14 01673 g002
Figure 3. (a) Annual frequency of rainy days in the research period, (b) annual precipitation values during the research period 1989–2017. The red dotted lines are the trend lines.
Atmosphere 14 01673 g003
Figure 4. Frequency of rainy days and average precipitation in (a) May, (b) June, (c) July, (d) August, and (e) September during the analyzed period from 1989 to 2017. Red columns represent the number of rainy days, while blue columns represent the average precipitation value in millimeters (mm).
Atmosphere 14 01673 g004aAtmosphere 14 01673 g004b
Figure 5. The number of stations involved in precipitation and the frequency of rainy days.
Atmosphere 14 01673 g005
Figure 6. Dendrogram of cluster analysis of 500-hPa GPH. The numbers on the x-axis are the number of days.
Atmosphere 14 01673 g006
Figure 7. (a) Frequency of EAPE patterns, (b) length of periods with EAPE, and (c) frequency of circulation patterns according to the length of EAPE periods.
Atmosphere 14 01673 g007
Figure 8. Atmospheric patterns observed on 25 May 1996 for (a) 850 hPa, (b) 700 hPa, (c) 500 hPa, and (d) 200 hPa, where black contours present GPH (m) and arrows indicate wind speed and direction (m/s). (e) Area cross-section for 58.25°E and latitudes from 28.5 to 29.5°N, on which shaded areas indicate omega (Pa/s) black lines are presenting the streamline, and arrows indicating the streamline direction. (f) Image in visible range showing clouds over Iran with a red box indicating the study area.
Atmosphere 14 01673 g008aAtmosphere 14 01673 g008b
Figure 9. Atmospheric patterns observed on 23 July 1995 for (a) 850 hPa, (b) 700 hPa, (c) 500 hPa, and (d) 200 hPa, where black contours present GPH (m) and arrows indicate wind speed and direction (m/s). (e) Area cross-section for 26.75°N and longitudes from 61.5 to 62.5°E, on which colored areas indicate omega (Pa/s) black lines are presenting the streamline, and arrows indicating the streamline direction. (f) Image in visible range showing clouds over Iran with a red box indicating the study area.
Atmosphere 14 01673 g009aAtmosphere 14 01673 g009b
Figure 10. Atmospheric patterns observed on 8 August 2006 for (a) 850 hPa, (b) 700 hPa, (c) 500 hPa, and (d) 200 hPa, where black contours present GPH (m), arrows indicate wind speed and direction (m/s), and shaded contours describe vorticity (10−5 s−1). (e) Area cross-section for 28.25° N and longitudes from 56.9 to 58.5° E, on which colored areas indicate omega (Pa/s) black lines are presenting the streamline, and arrows indicating the streamline direction. (f) Image in visible range showing clouds over Iran with a red box indicating the study area.
Atmosphere 14 01673 g010
Figure 11. Atmospheric patterns observed on 11 June 2005 for (a) 850 hPa, (b) 700 hPa, (c) 500 hPa, and (d) 200 hPa, where black contours present GPH (m) and arrows indicate wind speed and direction (m/s). (e) Area cross-section for 26° N and longitudes from 60.2 to 61.2° E, on which colored areas indicate omega (Pa/s) black lines are presenting the streamline, and arrows indicating the streamline direction. (f) Image in visible range showing clouds over Iran with a red box indicating the study area.
Atmosphere 14 01673 g011aAtmosphere 14 01673 g011b
Figure 12. Atmospheric patterns observed on 31 July 2016 for (a) 850 hPa, (b) 700 hPa, (c) 500 hPa, and (d) 200 hPa, where black contours present GPH (m) and arrows indicate wind speed and direction (m/s). (e) Area cross-section for 27° N and longitudes from 57.1 to 57.8° E, on which colored areas indicate omega (Pa/s) black lines are presenting the streamline, and arrows indicating the streamline direction. (f) Image in visible range showing clouds over Iran with a red box indicating the study area.
Atmosphere 14 01673 g012aAtmosphere 14 01673 g012b
Figure 13. Trajectory entrance path of five patterns of EAPE in southeastern Iran.
Atmosphere 14 01673 g013
Table 1. Characteristics of synoptic stations in southeastern Iran.
AbbreviationStationLongitudeLatitudeElevation (m)
BAFBaft56.5829.232280
BAMBam58.3529.11066.9
CHAChabahar60.6525.288
IRSIranshahr60.7127.22591.1
JASJask57.7725.645.2
KAHKahnuj57.7127.99449
KESKerman56.9630.251754
KHAKhash61.1928.231427
MINMinab57.0827.129.6
SARSaravan62.3227.391182
ZABZabol61.5431489.2
ZAHZahedan60.929.481370
Table 2. Characteristics of rain gauge stations in southeastern Iran.
AbbreviationStationLon.Lat.Elev.
(m)
AbbreviationStationLonLatElev.
(m)
AbbreviationStationLonLatElev.
(m)
ABSAnarak Bamposht (Saravan)62.4726.841260ESSEsfandak-Saravan62.8427.121073LARLar paein60.929.71145
ANGAngoharan57.926.59950EADEslamabad Dorpahn57.5526.64470LQQLuriyani Qasr-e Qand60.626.19405
ANJAnjirak58.3928.641435ESAEsmaeilabad56.9729.242201MARMarang57.9726.22360
ARJArjas56.5430.422200FANFanouj59.6426.57721MEHMehmani57.2426.5245
BAHBahoukalat61.4225.742FARFaryab57.927.47300MOSMoshkaldin57.626.99660
BAJBajgan57.4527.6480GALGabrik Lirei58.4725.7915NAHNahouk62.3427.621335
BARBardsir56.5729.922050GELGelashgard57.228570NEMNemdad Kouhestan58.4228470
BSABarroud sargazahmadi56.6727.92980GHKGhatar khonjak60.7229.241695NASNosratabad Sistan59.9929.851123
BOLBolbolabad57.5227.4320GODGolmorti Delgan59.4527.49388PPKPapar Poshtekoh56.7227.64400
BONBounji57.325.9210HIZHiyan Zarabad59.3425.723PIRPirsohrab60.8725.7468
BRABraashk60.3926.621235JITJirouft57.7428.69684PISPishin61.7226.7274
CHAChah Aali56.7427.4230JRCJrikeh-Chahnimeh61.7630.8497RAYRayen57.4429.62207
CHFChahar Farsakh57.5430.37950KAHKahir60.1225.520SEASefidabad60.5430.97844
CHSCheshmeh Shah57.7428.39566KASKajdar Sarbaz61.2426.62885SHASheykh AAli57.927.141760
DARDarzin57.729.171334KERKerman57.930.31680SIRSirch57.5530.21748
DEKDeh Kohan57.5527.72800KHKKhaneh Khatun57.8429.471766SOGSoghan56.8628.321500
DEMDeh Morteza57.1729.522950KHAKharaji57.2427.39190TAMTakht Malek60.426.44816
DOADomak Allahabad60.3929.271491KHOKhorramshahi57.6528.971661ZARZarand56.5730.81680
DAEDowlatabad-Esfandaqeh57.1428.721734LALLalehzar56.8529.522830
Disclaimer/Publisher’s Note: The statements, opinions and data contained in all publications are solely those of the individual author(s) and contributor(s) and not of MDPI and/or the editor(s). MDPI and/or the editor(s) disclaim responsibility for any injury to people or property resulting from any ideas, methods, instructions or products referred to in the content.

