Abstract
The urban heat island effect is a typical feature of urban climates. Problems associated with urban heat islands include an increase in energy consumption and health issues resulting from a reduction in thermal comfort. The method of constructing a heat island network, which helps identify and analyze urban heat island phenomena, has become a focus of research in areas such as the effect of urban greening on the heat island effect. Considering this, Landsat remote sensing images from Tiantai County, Taizhou City, were used to identify and analyze the distribution characteristics of heat island patches in Tiantai County as a whole, using morphological spatial pattern analysis (MSPA) combined with the model of minimum cumulative resistance (MCR). Simultaneously, based on the local climate zones theory, the resistance value was calculated to construct the Tiantai County heat island network, and the following conclusions were formed after analyzing the results: (1) The final constructed heat island network consists of 20 important heat island sources, 60 important heat island corridors, and 130 general heat island corridors. (2) The important heat-island-source land matrix consists primarily of an impermeable surface, bare soil, and sand. Important heat island corridors are mostly found in the impermeable surface area. (3) According to calculations, dense trees have a resistance value of 100. Water bodies and scattered trees have resistance values of 10 and 5, respectively. They all have a blocking effect on the heat island.
1. Introduction
Urban climate and environmental issues have steadily come under research attention as a result of rising urbanization and the development of global warming [1,2]. The structure of urban substrates, wind fields and velocities, and energy balance have all changed as a result of rapid urban-scale expansion, and this has made the local urban climate more complex, with the heat island effect being one of the most frequent examples. The heat island effect causes the buildup of numerous dangerous compounds, resulting in substantial air pollution and the development of respiratory disorders, skin diseases, and mental problems that affect the health of residents [3,4]. The rapidly expanding heat island effect also increases energy consumption and contributes to global warming [5,6,7]. Therefore, it has become vital to figure out how to enhance and optimize the climate and environment in both urban and rural areas as well as reduce the impact of the urban heat island.
Atmospheric heat islands and surface heat islands are the two types of urban heat islands [8,9]. In 1972, Rao was the first to suggest using remote sensing data in research into the urban heat island effect, ushering in a new era of surface-layer heat island research [10]. Urban surface heat islands are more closely related to human health and feelings than urban atmospheric heat islands. Furthermore, the scale effect constrains air temperature data, making it difficult to gain surface coverage of the data, which complicates heat island research at the regional scale of cities [11]. A satellite remote sensing sensor can directly gather thermal radiation information from surface features, and it also has the advantages of a quick acquisition duration, wide coverage, and low acquisition cost [12]. The Landsat Thematic Mapper (TM)/Enhanced Thematic Mapper (ETM+)/Thermal Infrared Sensor (TIRS) and Terra/Aqua Moderate Resolution Imaging Spectroradiometer (MODIS) satellite sensors are currently more frequently utilized to research surface heat islands [13,14,15]. Due to the comparatively high spatial resolution (60–120 m), extended time series, and good numerical quality of Landsat remote sensing picture data, the Landsat 8 OLI_TIRS satellite digital product was chosen for this investigation [16].
Currently, large- and medium-sized cities are the subject of the majority of studies on urban heat islands. Heat islands, however, are not only present in large- and medium-sized cities as a result of urbanization [17,18]. Urban forms are becoming more and more decentralized, and the interaction between urban and rural areas is growing more and more continuous and close for developing nations in the Asian region [19]. People, capital, goods, and information are continually traveling between urban and rural areas. Counties are the fundamental building blocks of regional economic development because they serve as nodes of the urban spatial system, connecting the vast rural areas at the bottom to the major and medium-sized cities at the top [20]. Therefore, it is crucial to research regional county heat islands during the urbanization process.
Techniques ranging from spatial morphology and landscape ecology have been used to study urban heat islands. Numerous studies examined heat islands from the perspective of landscape patches, quantitatively separating heat island patches from the matrix and developing a number of indicators to assess the relationship between the spatial morphology and structural features of urban heat island patch landscapes and the spatiotemporal processes of the urban thermal environment in terms of quantity, morphology, and structure [21,22,23]. Some research used a network approach to construct a cold island network in Wuhan City by calculating the connections among cold island patches [24]. Yu et al.’s research focus shifted to heat island patterns in 2021, and they provided a conceptual framework for measuring and reducing urban heat islands using morphological spatial pattern analysis [25]. Liu et al. used morphological spatial pattern analysis and landscape connectivity models to identify and study the spatial and temporal evolution characteristics of the Yunlong Demonstration Area in Zhuzhou [26]. Nguyen et al. were the first to integrate golf courses with morphological spatial pattern analysis to investigate the cooling effect of golf courses in cities [27]. Later, Yu et al. integrated morphological spatial pattern analysis and circuit theory, proposing a novel method for constructing heat island networks [28]. Based on MSPA and the circuit theory, Hu et al. investigated the characteristics of urban thermal safety patterns in the context of cross-regional differences [15]. Wu et al. investigated the influence of landscape composition and spatial arrangement on the surface thermal environment by combining two research viewpoints, patch and network. Additionally, the Yinchuan City heat island network was built, and the regional cooling effect was calculated [29]. A more thorough understanding of the organization, connection, and accessibility of urban heat island patches can be attained by creating an urban heat island network. Based on this, effective heat island mitigation can be achieved through the intervention and blocking of significant heat island patches and heat island corridors.
MSPA paired with MCR models is currently most commonly utilized in research on ecological corridors [30]. The path with the least cumulative resistance can be simulated using GIS technology and MCR models to construct ecological corridors [31,32,33]. To statistically analyze and optimize ecological corridors, this model often incorporates gravity models, mapping theory, and connection indicators [34,35]. Based on this, this paper shifts its focus to heat island corridors, employing the MSPA-MCR model to construct heat island corridors and networks. Previously, different resistance values were assigned, and integrated resistance surfaces were developed based on the cooling and warming capabilities of different land covers in prior studies on the development of heat island networks [28,29,36]. Nevertheless, the existing approach to investigating heat island resistance surface construction in scientific research is comparatively rudimentary and unrefined. The estimation of the resistance value of heat island networks is frequently provided in a direct manner, devoid of any description or explanation of scientific parameters. This may compromise the precision of the heat island network’s construction. This paper introduced a new classification of the local climate zones (LCZs) given by Stewart and Oke in order to achieve a more precise resistance surface [37,38]. This classification includes 10 different building kinds and seven different land cover types, with the different LCZs representing various combinations of buildings, roads, plants, soils, rocks, and water bodies. The LCZ system, as opposed to land cover, can better explain the form and function of urban and rural areas [39,40]. Resistance values for the various classifications are determined, based on the LCZs, to construct resistance surfaces.
Tiantai County is situated in the western region of Zhejiang Province, where the terrain is dominated by low mountains and hills. Tiantai County has experienced significant growth and progress over the last 10 years. As mountains comprise approximately 74.6% of Zhejiang Province’s land area, the number of mountain towns is considerable. It is expected that urbanization in hilly areas will continue to rapidly rise for a long time [41]. The investigation into heat islands, using Tiantai County as an illustration, will have significant effects for the sustainable development of other mountainous regions undergoing accelerated urbanization. This paper gives theoretical support for minimizing the heat island effect and carrying out ecological planning and development in steep mountainous parts of county regions as well as small- and medium-sized cities. The following are the primary research objectives: (1) Construct a finer resistance surface based on the LCZ system. (2) Construct the Tiantai City heat island network using the MSPA-MCR model and extract the significant heat island corridors using the gravity model. (3) Propose remedies for the identified important sources and corridors of heat islands.
2. Study Area and Data
2.1. Study Area
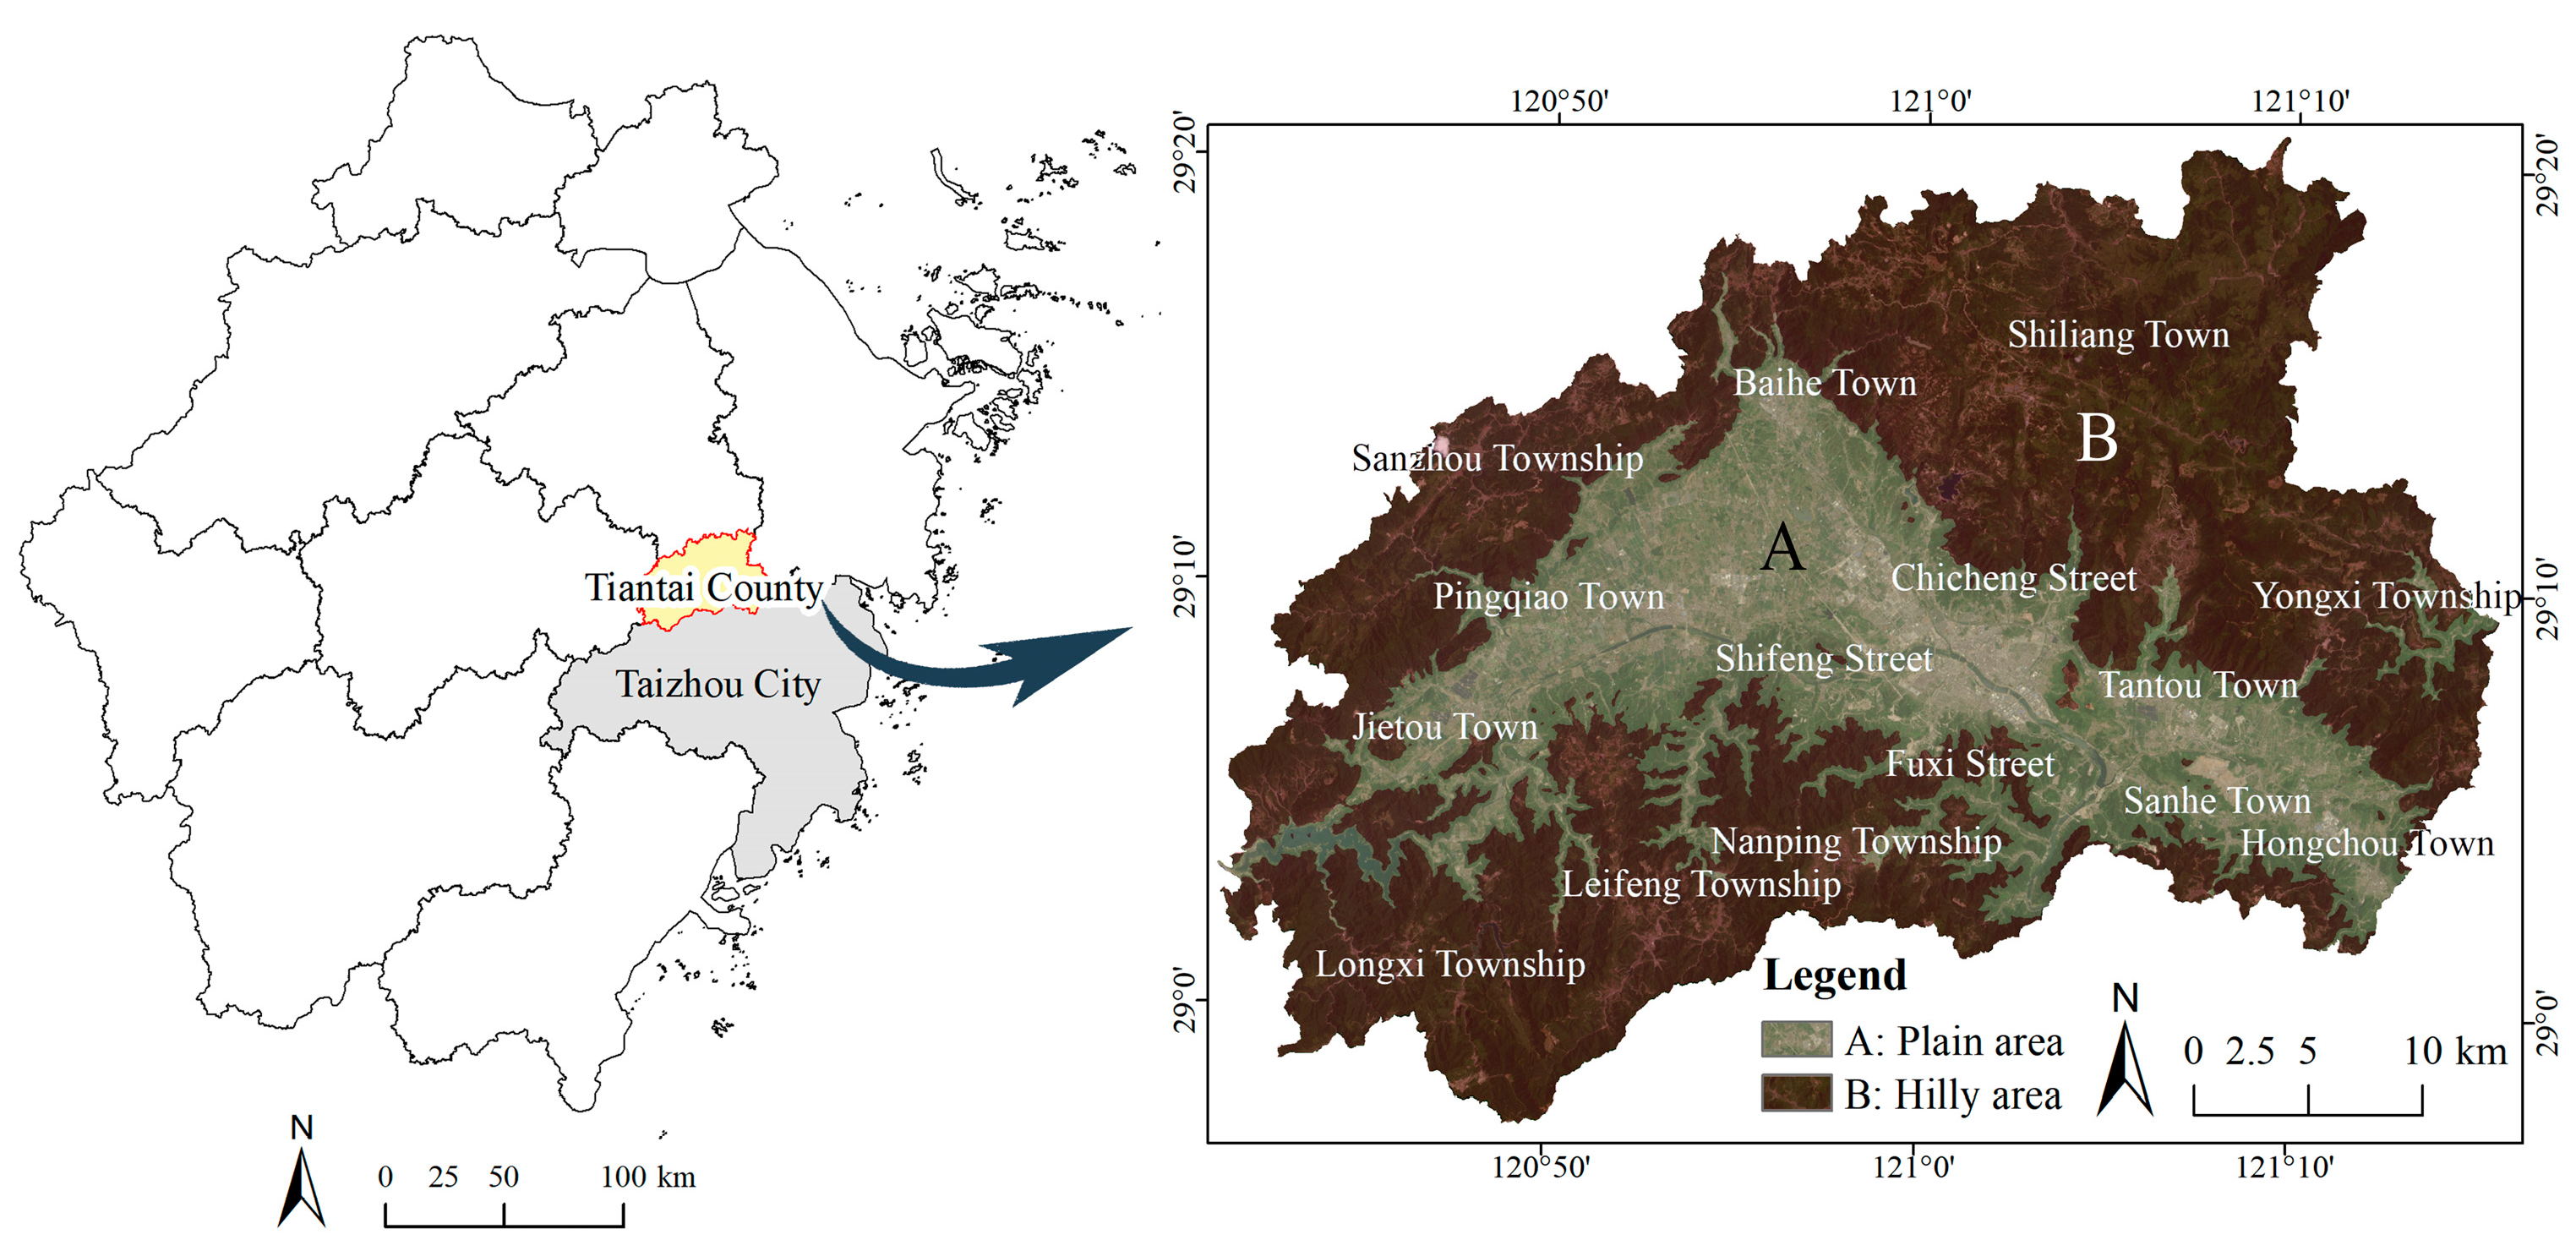
Tiantai County is a part of Taizhou City, Zhejiang Province. It is located in the east-central part of Zhejiang Province, east of Sanmen County, south of Linhai City, west of Pan’an County, north of Xinchang County, northeast of Ninghai County, and southwest of Xianju County, with a total area of 1431.66 km2 (Figure 1). It is approximately located between 120°41′24″–121°15′46″ East and 28°57′02″–29°20′39″ North. The terrain of Tiantai County is dominated by low mountains and hills. Low mountains and hills account for 81% of the county’s total area, while the river basin plains and tablelands account for 19%. The entire terrain is high in the northeast, northwest, and southwest, sloping to the east and southeast, and is surrounded by high mountains on all sides, with river valley plains in the middle. The beginning of the Feng Stream runs through the west–east, folding south, at an altitude of 50–250 m. Tiantai County belongs to the central subtropical monsoon climate zone, with four distinct seasons, abundant precipitation, and sufficient heat. It is also surrounded by mountains and is low and flat in the middle, so it has a small regional climate with a certain basin climate. The average annual temperature is 17.1 degrees, and the average annual precipitation is 1351.4 mm. The average annual frost days are 34.4 days, and the total average annual sunshine hours are 1875.3 h. In recent years, due to the development of urbanization, there has been a significant increase in hot weather and a significant rise in heat island intensity in Tiantai County, which has brought about a series of thermal environmental problems.

Figure 1.
Location of the study area.
2.2. Data
The data in this research were collected from the USGS website (https://earthexplorer.usgs.gov/) on 13 July 2022, with less than 5% cloudiness, using Landsat8 OLI_TIRS satellite product remote sensing images at a resolution of 30 m. ENVI 5.3 was used to pre-process the images for radiometric calibration, atmospheric correction, and research area trimming.
3. Methods
Figure 2 depicts the overall framework for constructing the heat island network in this article. The main steps include: (1) Important heat island source sites were extracted by calculating surface temperatures, MSPA, and connectivity analysis. (2) The WUDAPT process was utilized to produce a map of the LCZs, and the resistance values for each partition were calculated to construct the resistance surfaces. (3) Construct a heat island network using the MCR and gravity models.
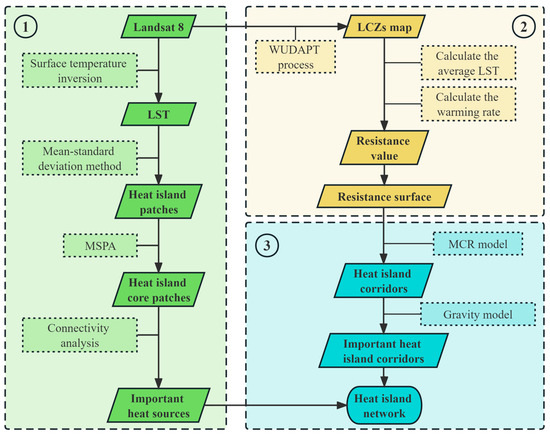
Figure 2.
Logical framework for constructing heat island network.
3.1. MSPA-Based Spatial Analysis of Heat Island Patches
3.1.1. Surface Temperature Inversion and Surface Heat Island Intensity Classification
The atmospheric correction approach (radiative transfer equation method) was employed in this work to invert the surface temperature [42,43]. The surface temperature TS can be expressed as (1).
In Equation (1), K1 and K2 are the calibration constants of the sensor; and B(TS) is the black-body radiation brightness of the temperature, TS, calculated as (2).
In Equation (2), is the atmospheric transmittance; L↑ is the atmospheric upward radiation; L↓ is the atmospheric downward radiation; is the radiant brightness of the thermal infrared spectrum received by the sensor; and is the surface specific radiance.
Use the mean–standard deviation method to categorize the surface heat island classes in the study area based on surface temperature magnitude and classify the surface heat island classes into five categories: low-temperature zone, sub-low-temperature zone, medium-temperature zone, sub-high-temperature zone, and high-temperature zone, as shown in Table 1 [44].

Table 1.
Ranking of heat island grades.
3.1.2. Morphological Spatial Pattern Analysis
MSPA is a mathematical morphology-based processing approach for identifying binary picture pixels. Previous similar studies used regional land-use raster data for measurements, identification, and segmentation of spatial patterns. The approach was used to investigate heat islands in this paper. The heat island raster data were used in an 8-neighborhood analysis technique with Guidos, with the edge width set to 30 m. Finally, data on seven different types of landscape types were obtained: core, islands, pores, edges, bridges, loops, and branches (Table 2).
Table 2.
Spatial morphological types and their ecological implications using MSPA.
3.1.3. Heat Island Source Extraction Based on Landscape Connectivity Analysis
Landscape connectivity indices can quantify the ease of material transport and energy transfer between ecological sources for a specific type of landscape. IIC, PC, and dPC can reflect the level of landscape connectivity and the importance of patches to landscape connectivity and serve as an important reference for ecological source selection based on morphological spatial pattern analysis. Calculating the connectivity index between heat island patches makes it possible to determine the location of important heat island patches. By blocking the connectivity of heat island patches on this basis, the heat island effect can be mitigated to a certain extent. the specific formulae for IIC, PC, and dPC are shown as Equations (3)–(5).
where n is the total number of patches in the area; ai is the area of patch i; aj is the area of patch j; Pij is the maximum of the product of all path probabilities between patch i and patch j; AL is the total area of the landscape in the study area; and PCremove is the index of possible connectivity of the landscape after removing an element from the landscape. IIC = 0 indicates no connectivity between heat island patches, while IIC = 1 indicates full connectivity between patches. 0 ≤ IIC ≤ 1, where IIC = 1 indicates that the patches are completely connected. 0 ≤ PC ≤ 1, with a higher PC number indicating that the patches are more linked.
Because larger core regions are likely to have higher landscape connection, we screened the heat island core patches with an area larger than 0.2 km2 in the study area as the preliminary heat island source data for connectivity index calculation in this paper, based on the MSPA results. Using Conefor Sensinode 2.6, the distance threshold was set to 1000 m, and the connection probability was set to 0.5. The computation results were sorted in descending order by dPC size, and the top 20 patches were chosen as the important heat island sources, which were then transformed into heat island source points in ArcGIS 10.8.
3.2. Heat Island Network Construction Based on MCR Model and Gravity Model
3.2.1. Resistance Surface Construction Based on Local Climate Zones
Stewart et al.’s LCZ system consists of 10 building types and 7 land cover types, where building density is subdivided into compact and open, and land cover is subdivided into dense, scattered trees areas, shrub areas, low plants, bare rock or paved, bare soil or sand, and water bodies [37]. The WUDAPT process [45] was utilized in this work to create the LCZs map using Google Earth and SAGA GIS. The created LCZs maps were coupled with surface temperature data to compute the average temperature and warming rate for each categorization. The warming rate data were further normalized using the standardization method (min–max standardization method) to obtain the resistance values for each classification, from which the resistance surfaces were constructed. LCZ f (bare soil and sand) is used as the standard feature temperature in this paper, while the warming rate of various LCZs is reflected as the ratio of the difference between the mean temperature of the zone and the mean temperature of LCZ f, as shown in the following equation:
where η is the warming rate; Ti is the mean temperature of each LCZ; and T0 is the mean temperature of the LCZ f (bare soil and sand).
3.2.2. Construction of a Potential Heat Island Network Based on the MCR Model
The MCR model is based on calculating the target resistance value between the source and the target using the resistance surface and then running multiple simulations to find the shortest, that is, theoretically best path. In comparison to other network construction methods, the MCR model reduces the cumbersome corridor redundancy and enables speedier and more intuitive results. The formula is (7).
where Dij is the spatial distance from source j to source i; and Ri is the resistance value of spatial unit i.
3.2.3. Extraction of Important Heat Island Corridors Based on Gravity Model
We use a gravity model to quantitatively evaluate the strength of interactions between heat island source patches in this paper, and we obtain a matrix of interactions between heat island patches to determine the relative importance of potential ecological corridors based on the magnitude of the forces acting on them, using the gravity model equation:
where Gij is the interaction force between patches i and j; Ni and Nj are the weight of patch i and patch j; Dij is the potential corridor standardized resistance value from patch i to j; Pi and Si are the resistance value and area of patch i; Pj and Sj are the resistance value and area of patch j; Lij is the cumulative resistance value connecting patches i and j; and Lmax is the maximum resistance value of all corridors. Combining the results of gravity values (F), corridors with F ≥ 1000 are classified as important corridors, while the rest are classified as general corridors.
4. Results
4.1. Characteristics of the Spatial Distribution of Surface Temperature
Figure 3A shows that the highest surface temperature in Tiantai County in 2022 is 52.31 °C and the minimum surface temperature is 13.66 °C. The mean–standard deviation approach was used to classify the study region into five classes: low-temperature zone, sub-low-temperature zone, medium-temperature zone, sub-high-temperature zone, and high-temperature zone. According to Figure 3B and Table 3, the high-temperature and sub-high-temperature zones encompass 214.34 km2 and 144 km2, respectively, accounting for 14.95% and 10.05% of the overall research area. The high-temperature zone in Tiantai County is primarily concentrated in the densely built-up areas of Pingqiao Town (Zone a), Shifeng Street (Zone b), Chicheng Street (Zone c), and Fuxi Street (Zone d), while low-temperature areas are primarily concentrated in the woodland areas of Shiliang Town (Zone e), Tantu Town (Zone f), and Yongxi Township (Zone g). As indicated in Figure 3C, the high-temperature and sub-high-temperature zones are defined as heat island areas in this study, whereas the remaining areas are non-heat island areas.
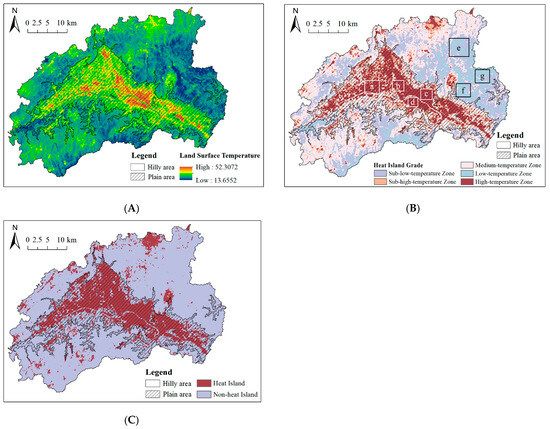
Figure 3.
This is the process of extracting the heat island: (A) distribution of surface temperatures in Tiantai County in 2022; (B) the heat island was classified based on mean-standard deviation method; (C) extract of the heat island area.
Table 3.
The area and proportion of each heat island class.
4.2. Analysis of the Spatial Distribution Characteristics of Heat Island Patches Based on MSPA
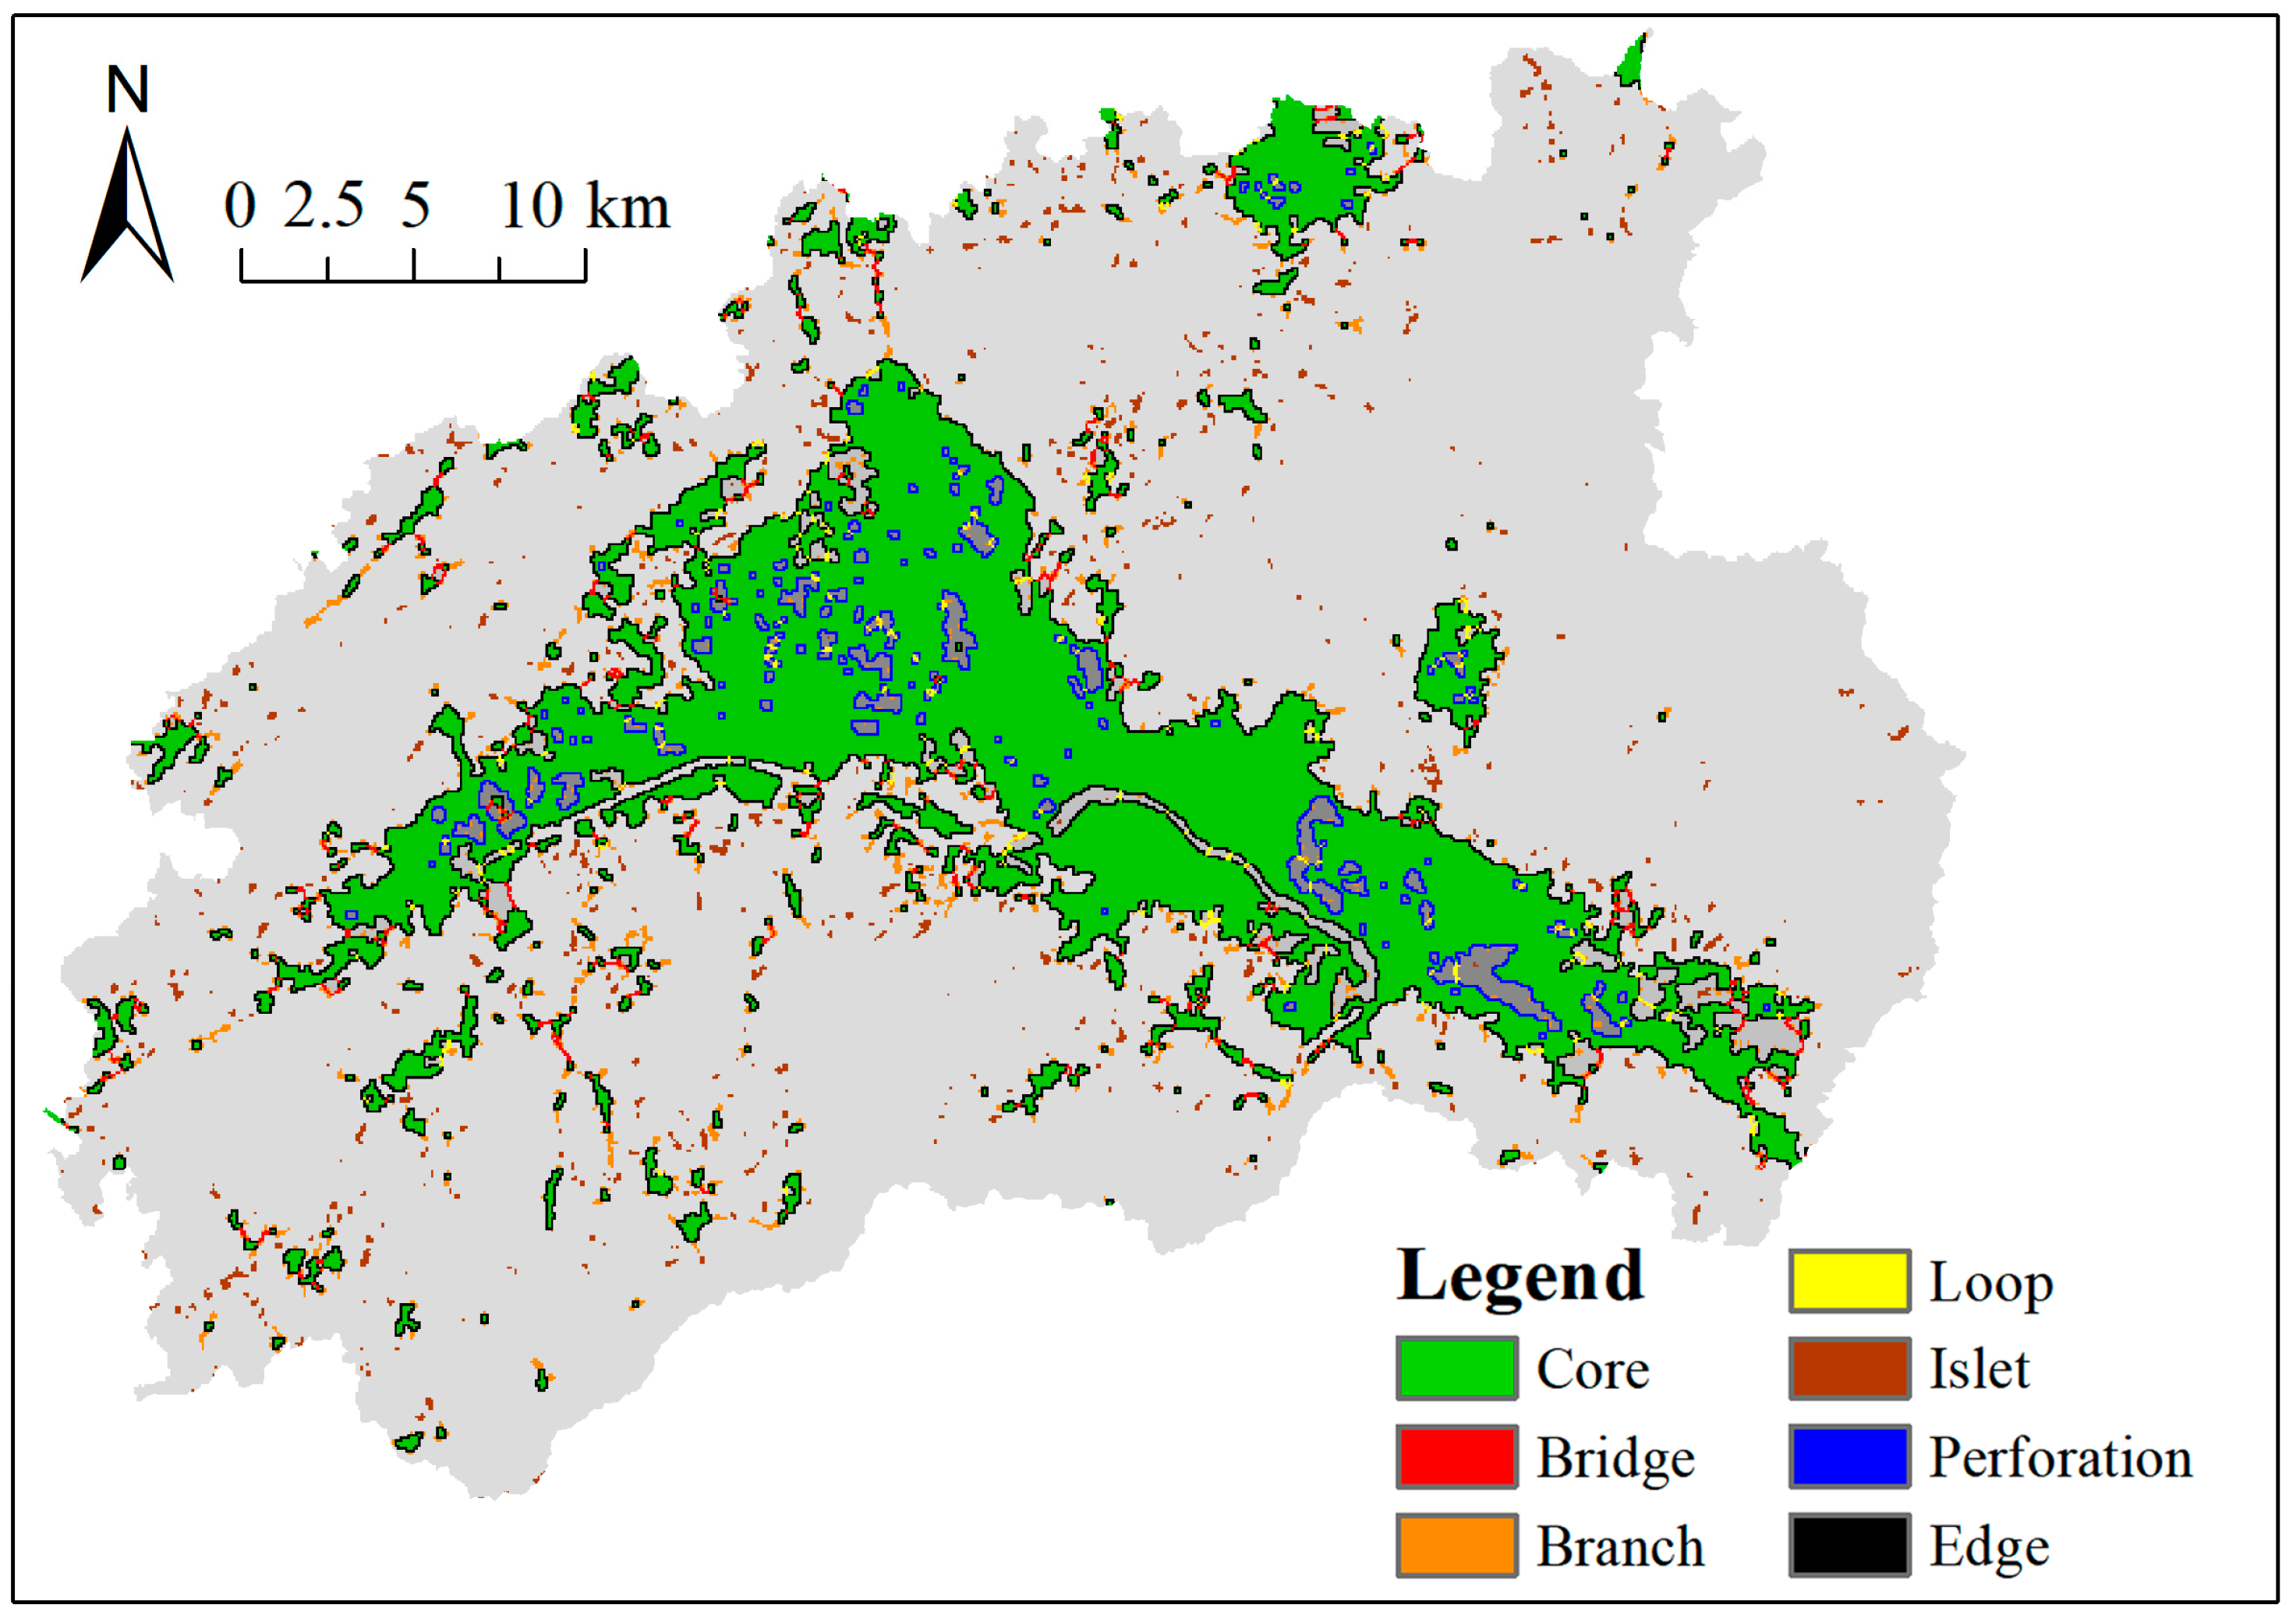
Figure 4 depicts the spatial and temporal distribution pattern of heat islands in Tiantai County in 2022 based on MSPA. According to Table 4, the core area in the study area occupies the largest size of 228.15 km2, accounting for roughly 63.71% of the overall heat island patch area, which is primarily dispersed in the highly built-up area in the middle part of the study area. The branch area, with an area of 68.58 km2, accounts for roughly 19.15% of the overall heat island patch. The islet and edge zones are the third and fourth largest MSPA categories, with an area of 18.49 km2 and 16 km2, respectively, representing roughly 5.16% and 4.47% of the overall heat island patch area. The smallest zones are the bridge zone and the loop zone, with areas of 4.24 km2 and 7.46 km2, respectively, accounting for only 1.18% and 2.08% of the overall heat island patch size.
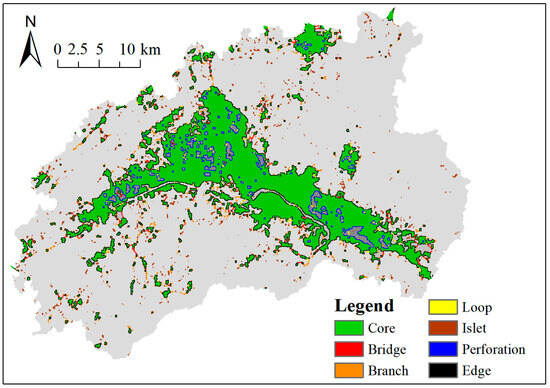
Figure 4.
Classification results of urban heat island patches based on MSPA in Tiantai County in 2022.
Table 4.
Area and proportion of different MSPA types.
4.3. Analysis of Heat Island Patch Connectivity
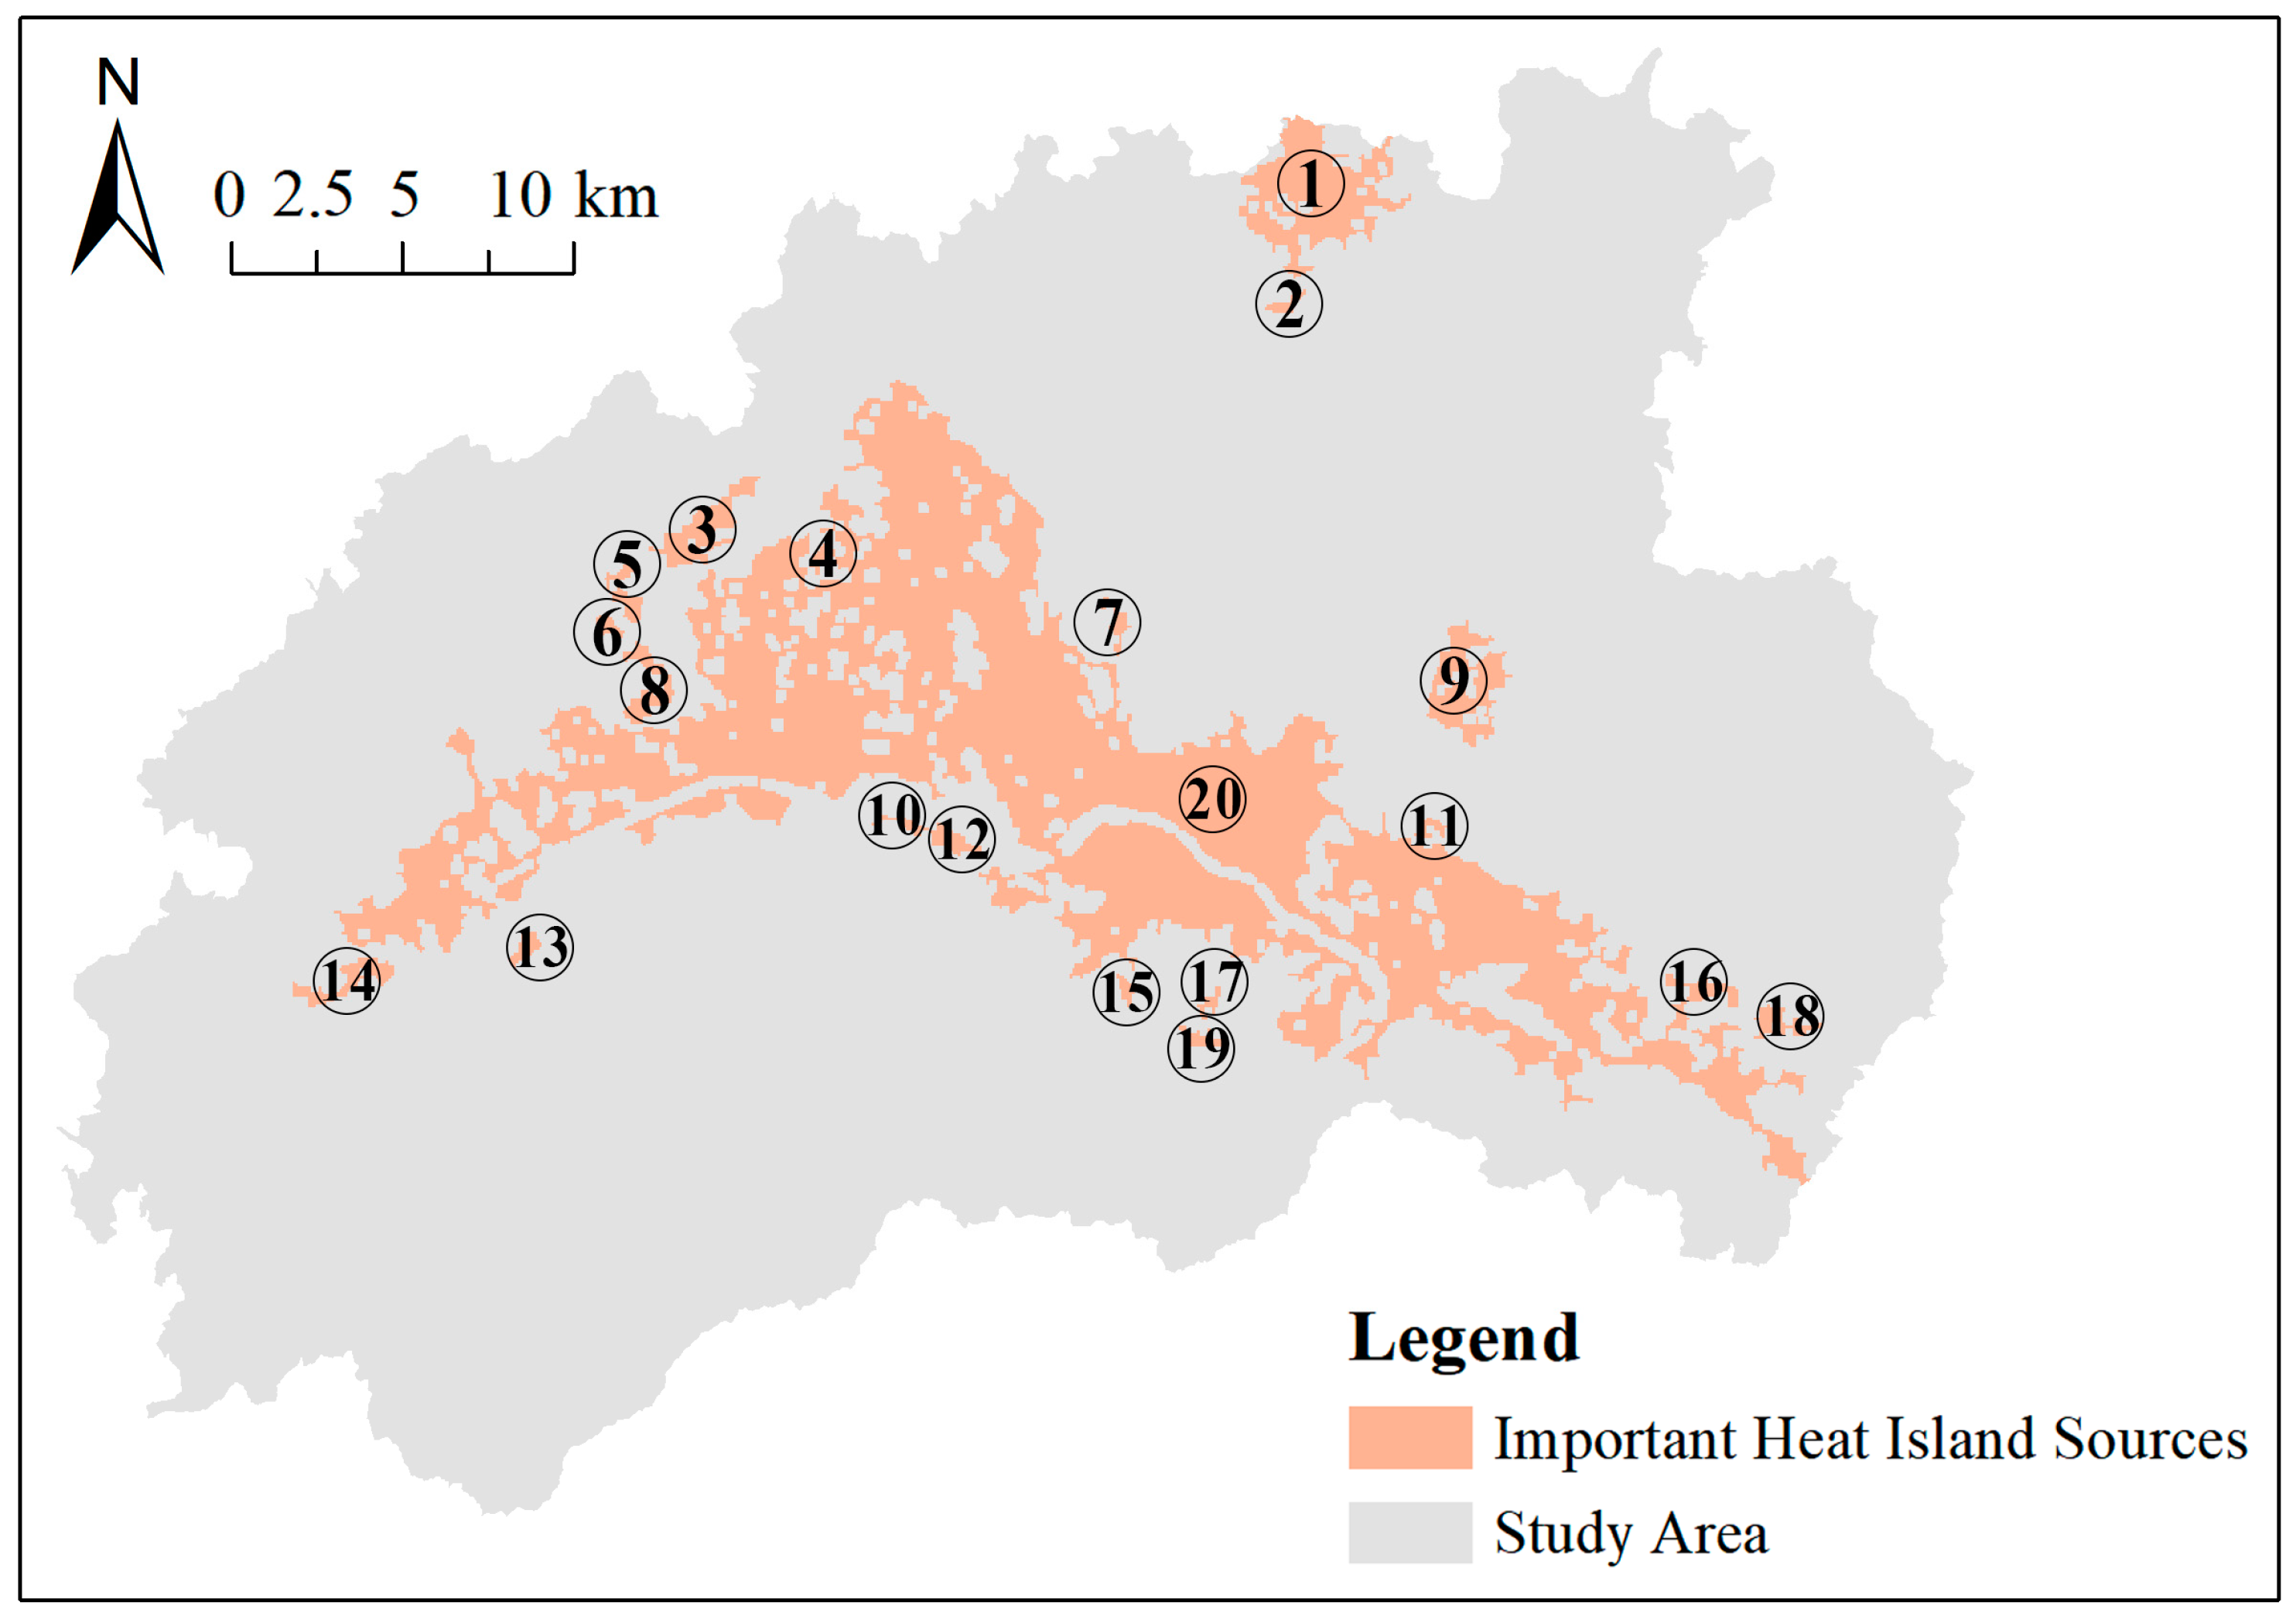
Landscape index analysis using Conefor2.6 was performed, and, after sorting dPC in descending order, the top 20 core area patches were selected as important heat island sources (Figure 5), while the remaining heat island sources were considered general heat island sources. According to Table 5 and Figure 5, the important heat island sources are primarily located in the central impervious surface of Tiantai County and the northern bare soil and sand area. Source 20 has the largest dIIC and dPC, of 99.6 and 99.6, and covers an area of 181.89 km2. It mostly consists of heavily populated districts in Pingqiao Town, Shifeng Street, Chicheng Street, and Fuxi Street. Source 3 has dIIC and dPC values of 1.4 and 2.43, respectively, and an area of 2.59 km2. It primarily consists of the villages of Lingfoot Village, Guantian Shang Village, and Geshanwang Village. All other sources are based on scattered villages with minimal distinction in importance. Sources 20 and 3, which are more important, should be prioritized for blocking the future urban development process to reduce the heat island effect in Tiantai County.
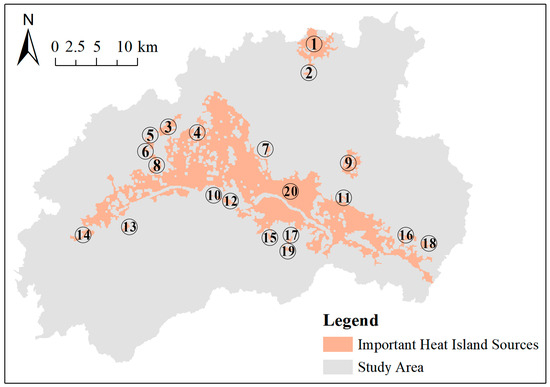
Figure 5.
Distribution of important heat island sources in Tiantai County.
Table 5.
Landscape connectivity index and area statistics of important heat island sources.
4.4. Analysis of the Construction of a Heat Island Network Based on MCR
The LCZs map produced by the WUDAPT process is shown in Figure 6a. The LCZs maps obtained according to this method do not have the classification of LCZ C (Bush, scrub), so the obtained LCZs maps only have 16 classifications. The calculated resistance values shown in Table 6 demonstrate that dense trees have a substantial blocking effect on the heat island effect, while water bodies and scattered trees also have some blocking effect. The resistance surface constructed from the surface temperature calculation of LCZs is shown in Figure 6b. Table 7 shows that the LCZ A (dense trees) area, with a resistance value of 100, has the largest area of 962.01 km2 and is mainly located in the northeast, northwest, and south of the study area. This is followed by the LCZ B (scattered trees) area, with a resistance value of 5, which is 188.99 km2 in size and more dispersed. The area with a resistance value of 1 includes LCZ 1 (compact high-rise), LCZ 2 (compact mid-rise), LCZ 4 (open high-rise), LCZ 7 (lightweight low-rise), LCZ 8 (large low-rise), LCZ 10 (heavy industry), and LCZ E (bare rock or paved), with a total area of 16.67 km2, primarily in the impermeable sections of Chicheng Street, Shifeng Street, and Fuxi Street. Figure 6c depicts the construction of 190 potential heat island corridors in ArcGIS 10.8 for 20 important heat island sources. As shown in Figure 6c, there are more heat island corridors in the center due to the greater number of important heat island sources. The corridors are densely dispersed, and the thermal landscape’s circulation is strengthened. Important heat island sources are closer together, with less resistance to flow paths, which exacerbates the effect of heat islands.
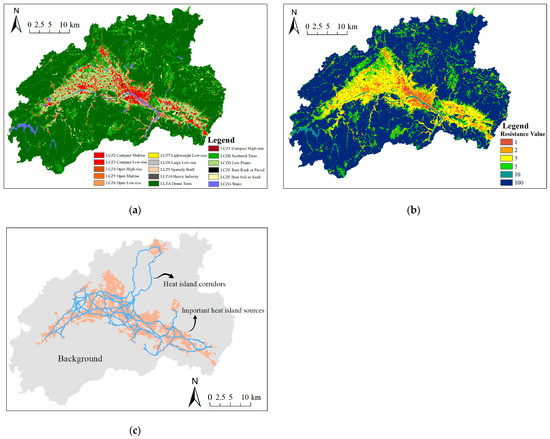
Figure 6.
This is the process of calculating resistance surface based on LCZs system and constructing heat island network in Tiantai County: (a) LCZs map of Tiantai County; (b) calculated resistance surface; (c) preliminary constructing of the heat island network in Tiantai County.
Table 6.
Resistance value of partition type based on LCZ.
Table 7.
Area distribution statistics for each resistance value.
4.5. Analysis of Important Heat Island Corridor Extraction Based on Gravity Model
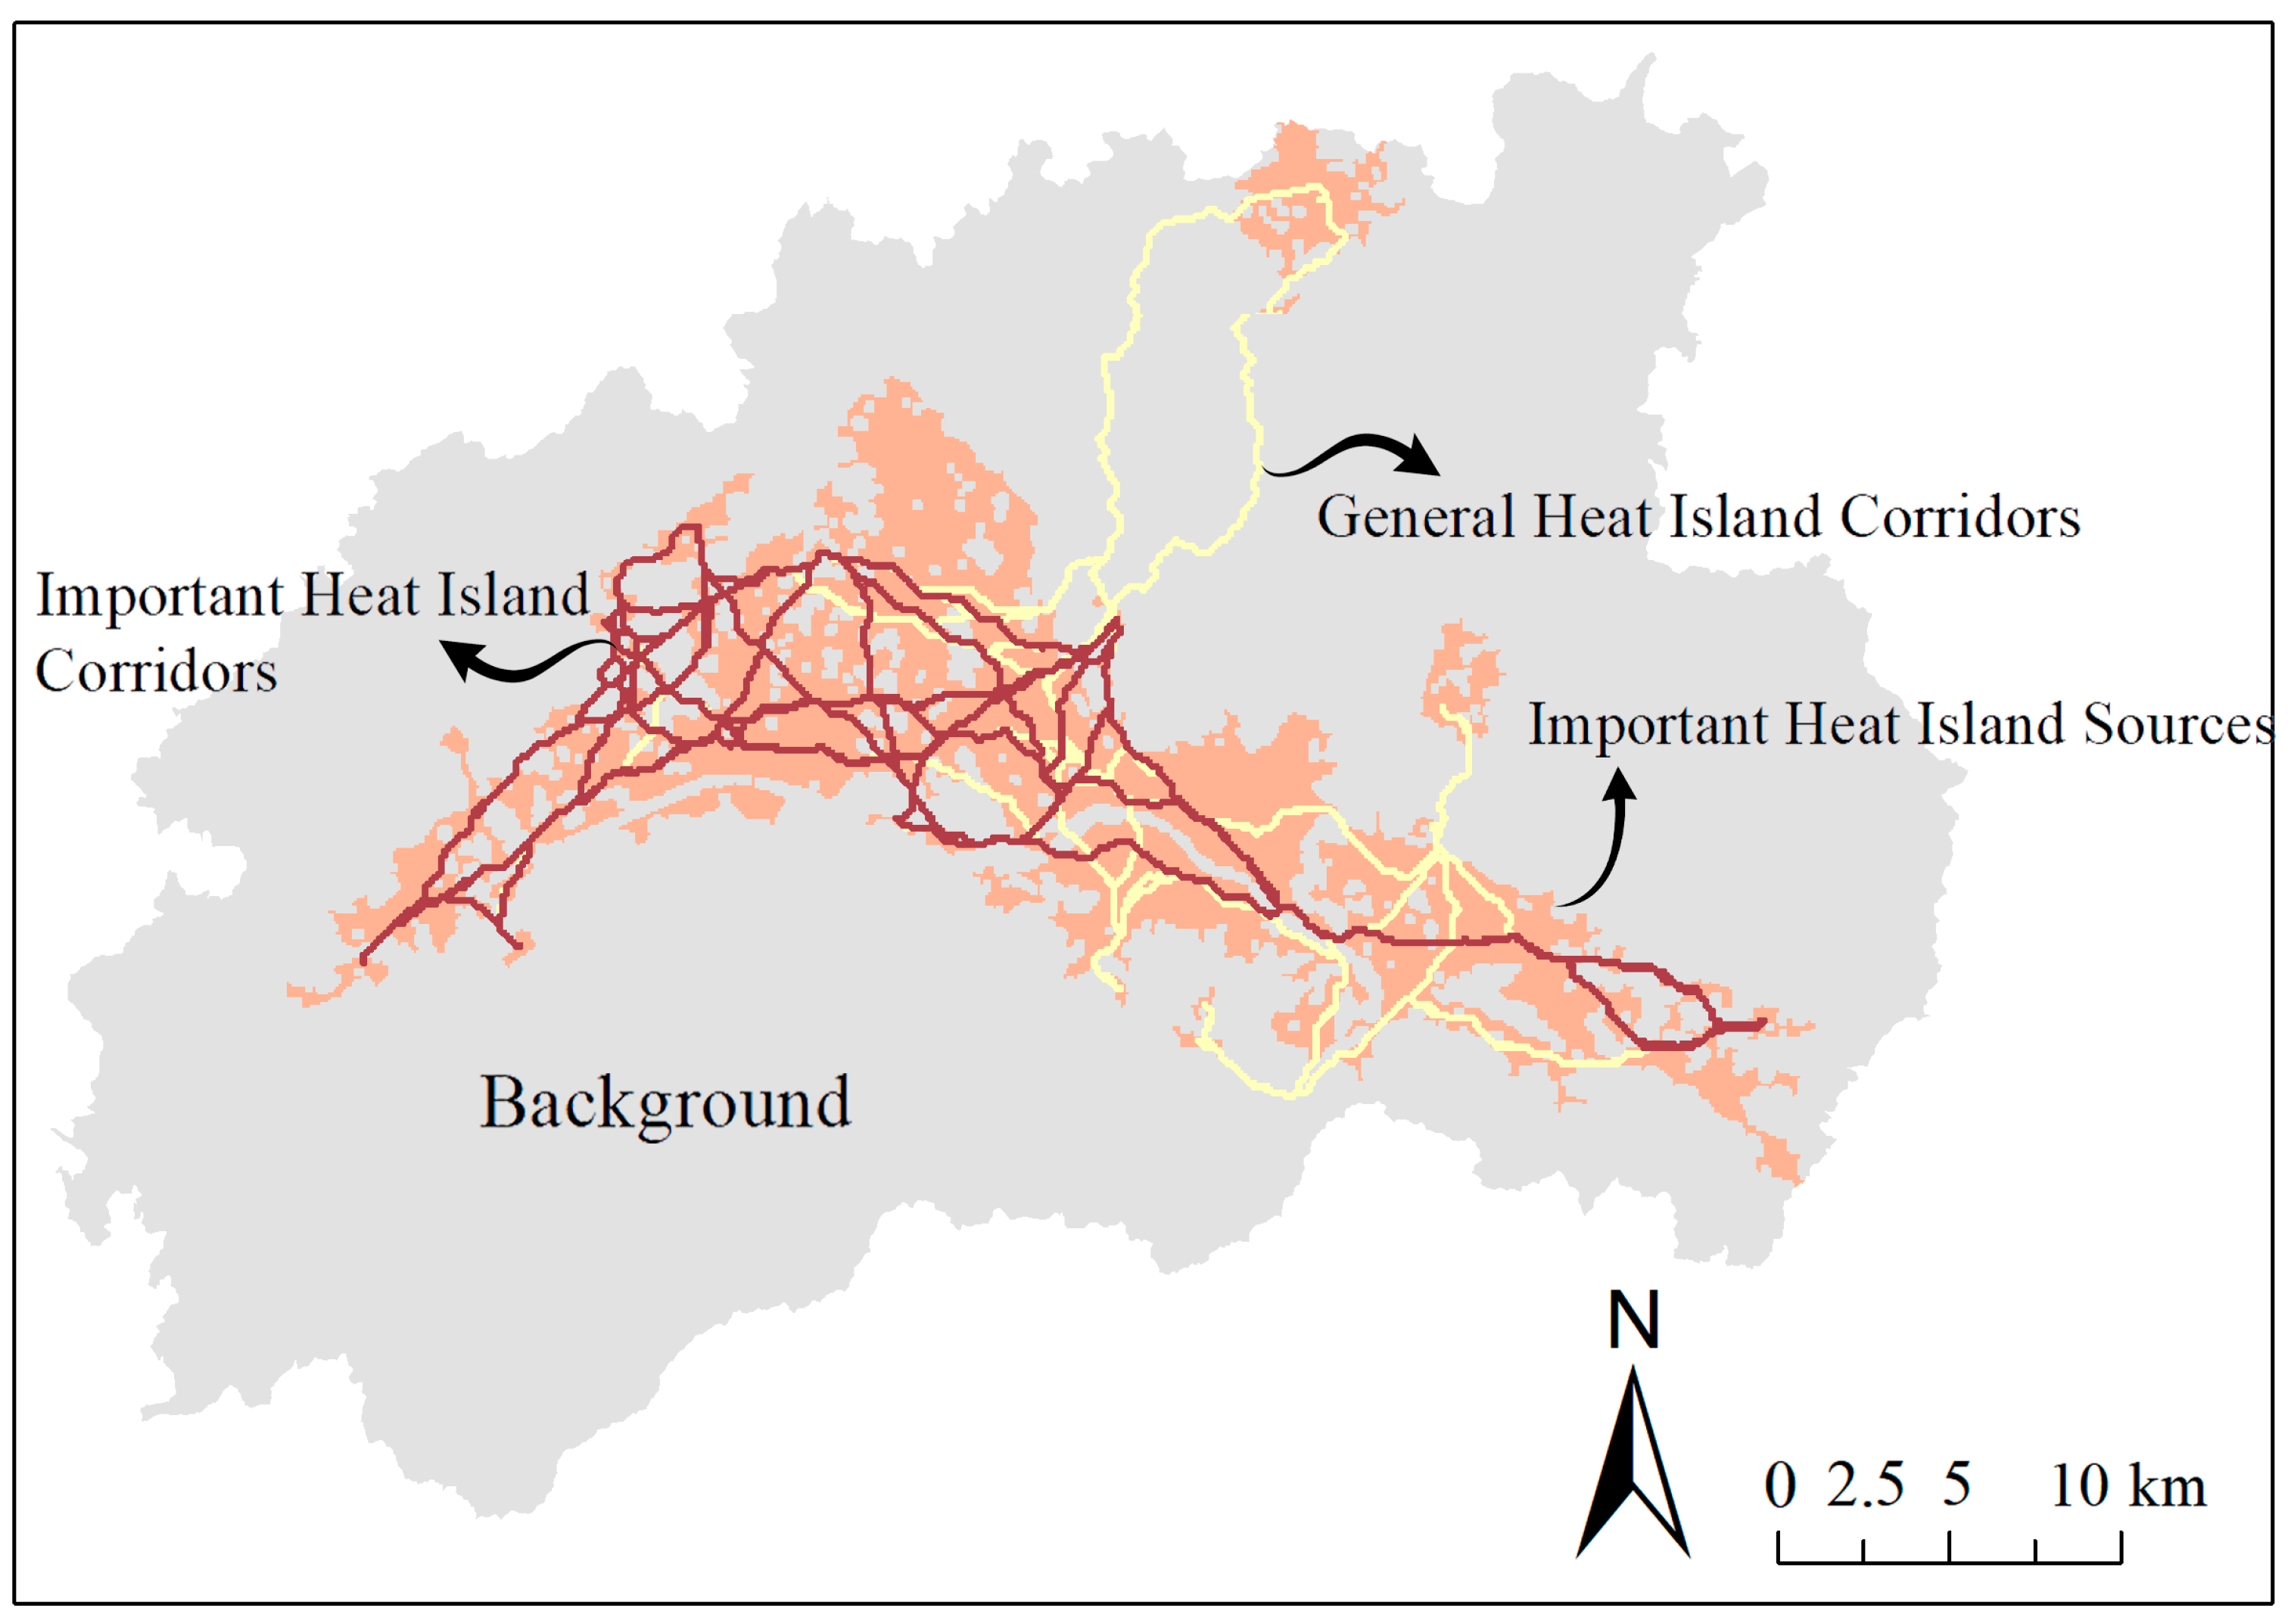
By calculating the inter-patch interaction force matrix (Table 8) and plotting the heat island corridor hierarchy (Figure 7), using the gravity model, the corridors with inter-patch forces greater than 1000 were identified as important heat island corridors, and the rest were general heat island corridors, yielding 60 important heat island corridors and 130 general heat island corridors. Figure 7 shows that the important heat island corridors in Tiantai County’s heat island network are mostly focused in the central region, with essentially no heat island sources in the surrounding densely wooded areas. The matrices of Source 1 and Source 2 are mainly bare soil and sand, and both are located in the northern part of the study area, so it is difficult for Source 1 and Source 2 to form important heat island corridors with all other heat island sources because of their distance from the other sources. The contact force between sources 16 and 18 is the largest at 71,993.3; with their proximity to one another and the lower resistance of the circulation routes, they are more prone to form heat islands. The contact force between source 1 and source 17 is the smallest, 0.04. The two heat island sources are located in the north and south extremities of Tiantai County, where heat islands are more difficult to form due to the greater distance between the sources and the higher resistance.
Table 8.
Force matrix based on gravity model.

Figure 7.
Heat island corridor classification map.
5. Discussion
5.1. The Rationality of the Research Method
A combination of MSPA and MCR models was employed in this paper. This method has previously been utilized in ecological network construction studies, and the MCR model reduces the redundancy of corridors in comparison to other network construction methods. It is frequently used in conjunction with morphological security patterns, landscape connectivity indices, and gravity models. Based on its simple data structure and fast arithmetic method, the MSPA method is able to identify the essential heat island sources in the study area that play an important role in the landscape connectivity, thereby enhancing the MCR model’s rationale when constructing the heat island network. The approach enables the precise scientific determination of heat island origins and the establishment of potential heat island corridors for the purpose of quantifying the configuration of urban heat islands. The important heat island sources and important heat island corridors in the heat island network are destroyed and blocked in urban planning and design. Consequently, it has a significant practical applicability and aids in a reduction in the heat island effect [26].
5.2. LCZ-Based Resistance Surface Construction Method
Unlike previous studies, this study does not use land cover data to determine the magnitude of resistance values when constructing resistance surfaces but instead introduces the LCZ system, which is based on the proposed range of values for 10 urban canopy parameters as a basis for classification into 17 LCZs. The LCZs, as opposed to the previous land cover classification, can better explain the form and function of urban and rural areas. The inversion surface temperature data show that different LCZs have varying effects on ground temperature. Based on this, the study proposes calculating the warming rate of each classification to determine the magnitude of the resistance value, resulting in a more scientific and precise resistance value. The heat island network constructed by this method is primarily concentrated in the area of dense construction land in the central plain of Tiantai County. The overall network displays a trend of steady reduction from the center to the surrounding area.
The resistance values for construction zones as a whole are lower, while the resistance values for compact high-rise buildings are lower than the resistance values for compact low-rise buildings. Open high-rise buildings have lower resistance values than open low- and mid-rise buildings. Heat islands are effectively blocked by both woodlands and bodies of water. The strongest blocking effect is provided by dense trees, followed by water bodies, and then by scattered trees. Therefore, increasing dense trees, water bodies, and scattered trees can be used as a means of destroying heat island corridors. In urban planning and construction, green spaces of various scales should be added at important heat island corridors to expand the area and increase the amount of green in the original green space. At the same time, urban infrastructure should avoid the layout of important heat island corridors as much as is feasible.
5.3. Limitations and Prospects for the Future
Firstly, this study is based on the inversion of surface temperature from remote sensing images. However, remote sensing data gathered from a specific angle of observation cannot fully and objectively reveal the external appearance or the internal mechanism of the urban thermal environment. Furthermore, thermal radiation received by remote sensing may be polarized. The slope of complex terrain, particularly in hilly places, may cause mistakes in surface temperature measurements. Secondly, the LCZ system can increase the accuracy of the resistance surface to some extent throughout the construction process. However, other significant elements such as slope and height are still ignored. Subsequent studies may investigate incorporating surface-temperature-related parameters such as the normalized difference vegetative index (NDVI), modified normalized difference water index (MNDWI), normalized difference build-up index (NDBI), and sky view factor (SVF). In mountainous areas, we can also contemplate adding the city surface elevation (CSE), slope, slope direction, and other elevation-related parameters. By correlating and ranking various parameters with surface temperature, a finer heat island resistance surface and a more scientific heat island network can be constructed.
6. Conclusions
Based on the theory of spatial morphology, the method of constructing an overall heat island network was used to study the heat islands in the county. The locations of important heat island patches and important heat island corridors were determined by calculating the connectivity of heat island patches and the MCR model, and the main conclusions are as follows.
- (1)
- The final constructed heat island network consists of 20 important heat island sources, 60 important heat island corridors, and 130 general heat island corridors. The important heat island sources are primarily found in Tiantai County’s central, western, and southeastern plains and certain mountainous locations in the county’s east and north. The important heat island corridors are concentrated in the Central Plains region. Because of the low surface temperature, there are almost no heat island sources or heat island corridors in thickly forested areas. The whole heat island network has a decreasing trend from the center outward.
- (2)
- The matrix of important heat island sources primarily consists of impermeable surfaces and bare sandy areas. The primary important heat island source locations in the study area are in Pingqiao Town, Shifeng Street, Chicheng Street, and Fuxi Street, as well as in the northern mountainous areas (Lingkou Village, Guantian Shang Village, and Geshan Wang Village). The important heat island corridors are centered in the study area’s central, western, and southeastern regions. The sources of heat islands located in the central part of Tiantai County have the largest area and high connectivity. The closer the sources are to each other, the lower the resistance to flow paths is, the greater the circulation of the thermal landscape is, and the easier it is to develop a heat island.
- (3)
- The resistance rating of 100 for dense trees is determined to provide the greatest heat-island-blocking effect. Water bodies and scattered trees have resistance values of 10 and 5, respectively, and act as heat island blockers. Priority can be given to blocking the important heat island sources and between the closer heat island sources when adopting mitigation measures. Where conditions allow, dense trees or open water bodies might be planted in areas of important heat island corridors to prevent heat island sources from connecting. Where increasing the area of green space is not practicable, it is possible to maximize the benefits of green space while keeping the existing land-use pattern. To boost the amount of vegetation in high-density building clusters, for example, pocket parks, street green spaces, and small gardens can be created. Or, to improve the environment and effectively mitigate the heat island effect, the size of existing green belts can be expanded and the vegetation hierarchy can be enriched.
Author Contributions
Conceptualization, F.Q.; data curation, S.C.; formal analysis, S.C.; funding acquisition, F.Q.; investigation, S.C. and F.Q.; methodology, F.Q.; project administration, F.Q.; resources, S.C.; software, S.C.; supervision, F.Q.; validation, S.C., S.L. and F.Q.; visualization, S.C.; writing—original draft, S.C.; writing—review and editing, S.C. and F.Q. All authors have read and agreed to the published version of the manuscript.
Funding
This research was funded by the National Natural Science Foundation of China, grant number 51978627.
Institutional Review Board Statement
Not applicable.
Informed Consent Statement
Not applicable.
Data Availability Statement
All relevant important data and their analysis results are presented in the paper. If editors or reviewers require us to provide more detailed process data, please let us know at any time, and we will carefully cooperate and share the relevant data.
Conflicts of Interest
The authors declare no conflict of interest.
References
- Zhao, L.; Lee, X.; Smith, R.B.; Oleson, K. Strong contributions of local background climate to urban heat islands. Nature 2014, 511, 216–219. [Google Scholar] [CrossRef]
- Hoegh-Guldberg, O.; Jacob, D.; Taylor, M.; Bolanos, T.G.; Bindi, M.; Brown, S.; Camilloni, I.A.; Diedhiou, A.; Djalante, R.; Ebi, K.; et al. The human imperative of stabilizing global climate change at 1.5 degrees C. Science 2019, 365, 6459. [Google Scholar] [CrossRef] [PubMed]
- Santamouris, M. Recent progress on urban overheating and heat island research. Integrated assessment of the energy, environmental, vulnerability and health impact. Synergies with the global climate change. Energy Build. 2020, 207, 109482. [Google Scholar] [CrossRef]
- Fu, X.; Yao, L.; Sun, S. Accessing the Heat Exposure Risk in Beijing-Tianjin-Hebei Region Based on Heat Island Footprint Analysis. Atmosphere 2022, 13, 739. [Google Scholar] [CrossRef]
- Chapman, S.; Watson, J.E.M.; Salazar, A.; Thatcher, M.; McAlpine, C.A. The impact of urbanization and climate change on urban temperatures: A systematic review. Landsc. Ecol. 2017, 32, 1921–1935. [Google Scholar] [CrossRef]
- Li, X.; Zhou, Y.; Yu, S.; Jia, G.; Li, H.; Li, W. Urban heat island impacts on building energy consumption: A review of approaches and findings. Energy 2019, 174, 407–419. [Google Scholar] [CrossRef]
- Can Trong, N.; Diep Thi Hong, N.; Diem Kieu, P. Factors affecting urban electricity consumption: A case study in the Bangkok Metropolitan Area using an integrated approach of earth observation data and data analysis. Environ. Sci. Pollut. Res. 2021, 28, 12056–12066. [Google Scholar] [CrossRef]
- Oke, T.R.; Mills, G.; Christen, A.; Voogt, J.A. Urban Climates; Cambridge University Press: Cambridge, UK, 2017. [Google Scholar]
- Hu, Y.; Hou, M.; Jia, G.; Zhao, C.; Zhen, X.; Xu, Y. Comparison of surface and canopy urban heat islands within megacities of eastern China. Isprs J. Photogramm. Remote Sens. 2019, 156, 160–168. [Google Scholar] [CrossRef]
- Rao, P.K. Remote Sensing of Urban Heat Islands from an Environmental Satellite; AMER Meteorological: Boston, MA, USA, 1972. [Google Scholar]
- Lv, Z.-Q.; Zhou, Q.-G. Utility of Landsat image in the study of land cover and land surface temperature change. Procedia Environ. Sci. 2011, 10, 1287–1292. [Google Scholar] [CrossRef]
- Zhou, D.; Xiao, J.; Bonafoni, S.; Berger, C.; Deilami, K.; Zhou, Y.; Frolking, S.; Yao, R.; Qiao, Z.; Sobrino, J.A. Satellite Remote Sensing of Surface Urban Heat Islands: Progress, Challenges, and Perspectives. Remote Sens. 2019, 11, 48. [Google Scholar] [CrossRef]
- Azevedo, J.A.; Chapman, L.; Muller, C.L. Quantifying the Daytime and Night-Time Urban Heat Island in Birmingham, UK: A Comparison of Satellite Derived Land Surface Temperature and High Resolution Air Temperature Observations. Remote Sens. 2016, 8, 153. [Google Scholar] [CrossRef]
- Chetia, S.; Saikia, A.; Basumatary, M.; Sahariah, D. When the heat is on: Urbanization and land surface temperature in Guwahati, India. Acta Geophys. 2020, 68, 891–901. [Google Scholar] [CrossRef]
- Hu, C.; Li, H. Reverse Thinking: The Logical System Research Method of Urban Thermal Safety Pattern Construction, Evaluation, and Optimization. Remote Sens. 2022, 14, 6036. [Google Scholar] [CrossRef]
- Vermote, E.; Justice, C.; Claverie, M.; Franch, B. Preliminary analysis of the performance of the Landsat 8/OLI land surface reflectance product. Remote Sens. Environ. 2016, 185, 46–56. [Google Scholar] [CrossRef] [PubMed]
- Barbieri, T.; Despini, F.; Teggi, S. A Multi-Temporal Analyses of Land Surface Temperature Using Landsat-8 Data and Open Source Software: The Case Study of Modena, Italy. Sustainability 2018, 10, 1678. [Google Scholar] [CrossRef]
- Sultana, S.; Satyanarayana, A.N.V. Urban heat island intensity during winter over metropolitan cities of India using remote-sensing techniques: Impact of urbanization. Int. J. Remote Sens. 2018, 39, 6692–6730. [Google Scholar] [CrossRef]
- Nie, W.; Shi, Y.; Siaw, M.J.; Yang, F.; Wu, R.; Wu, X.; Zheng, X.; Bao, Z. Constructing and optimizing ecological network at county and town Scale: The case of Anji County, China. Ecol. Indic. 2021, 132, 108294. [Google Scholar] [CrossRef]
- Liu, L.; Shen, G.; Wu, Y.; Zhangzhou, Y.; Lu, S. Characteristics of Land Use Transfer and Its Influence on Thermal Environment in County-level Urbanization. Bull. Soil Water Conserv. 2019, 39, 260–266. [Google Scholar] [CrossRef]
- Connors, J.P.; Galletti, C.S.; Chow, W.T.L. Landscape configuration and urban heat island effects: Assessing the relationship between landscape characteristics and land surface temperature in Phoenix, Arizona. Landsc. Ecol. 2013, 28, 271–283. [Google Scholar] [CrossRef]
- Li, X.; Zhou, W.; Ouyang, Z.; Xu, W.; Zheng, H. Spatial pattern of greenspace affects land surface temperature: Evidence from the heavily urbanized Beijing metropolitan area, China. Landsc. Ecol. 2012, 27, 887–898. [Google Scholar] [CrossRef]
- Koc, A.; Caf, A.; Koc, C.; Kejanli, D.T. Examining the temporal and spatial distribution of potential urban heat island formations. Environ. Sci. Pollut. Res. 2022, 29, 11455–11468. [Google Scholar] [CrossRef] [PubMed]
- Qian, W.; Li, X. A cold island connectivity and network perspective to mitigate the urban heat island effect. Sustain. Cities Soc. 2023, 94, 104525. [Google Scholar] [CrossRef]
- Yu, Z.; Zhang, J.; Yang, G.; Schlaberg, J. Reverse Thinking: A New Method from the Graph Perspective for Evaluating and Mitigating Regional Surface Heat Islands. Remote Sens. 2021, 13, 1127. [Google Scholar] [CrossRef]
- Liu, T.; Ouyang, S.; Gou, M.; Xiang, W.; Lei, P.; Li, Y. Analysis connectivity of urban heat island in a new-type urbanization based on MSPA model. Acta Ecol. Sin. 2023, 43, 615–624. [Google Scholar]
- Nguyen, T.T.; Eslick, H.; Barber, P.; Harper, R.; Dell, B. Cooling Effects of Urban Vegetation: The Role of Golf Courses. Remote Sens. 2022, 14, 4351. [Google Scholar] [CrossRef]
- Yu, Z.; Zhang, J.; Yang, G. How to build a heat network to alleviate surface heat island effect? Sustain. Cities Soc. 2021, 74, 103135. [Google Scholar] [CrossRef]
- Wu, D.; Sun, H.; Xu, H.; Zhang, T.; Xu, Z.; Wu, L. How Can Ecological Land Be Deployed to Cool the Surface Thermal Environment? A Case Study from the Perspectives of Patch and Network. Remote Sens. 2023, 15, 1061. [Google Scholar] [CrossRef]
- Li, S.; Xiao, W.; Zhao, Y.; Lv, X. Incorporating ecological risk index in the multi-process MCRE model to optimize the ecological security pattern in a semi-arid area with intensive coal mining: A case study in northern China. J. Clean. Prod. 2020, 247, 119143. [Google Scholar] [CrossRef]
- Lin, J.; Yang, W.; Yu, K.; Geng, J.; Liu, J. Identification and Construction of Ecological Nodes in the Fuzhou Ecological Corridors. Forests 2022, 13, 1837. [Google Scholar] [CrossRef]
- Liu, Q.; Sun, Y.; Mei, Y.; Jian, Z.; Pan, F.; Zhang, L. Construction and Analysis of Ecological Security Pattern of Qingdao Based on MSPA and MCR Models. Pol. J. Environ. Stud. 2023, 32, 155–169. [Google Scholar] [CrossRef] [PubMed]
- Wang, S.; Wu, M.; Hu, M.; Fan, C.; Wang, T.; Xia, B. Promoting landscape connectivity of highly urbanized area: An ecological network approach. Ecol. Indic. 2021, 125, 107487. [Google Scholar] [CrossRef]
- Lookingbill, T.R.; Elmore, A.J.; Engelhardt, K.A.; Churchill, J.B.; Gates, J.E.; Johnson, J.B. Influence of wetland networks on bat activity in mixed-use landscapes. Biol. Conserv. 2010, 143, 974–983. [Google Scholar] [CrossRef]
- Ye, H.; Yang, Z.; Xu, X. Ecological Corridors Analysis Based on MSPA and MCR Model-A Case Study of the Tomur World Natural Heritage Region. Sustainability 2020, 12, 959. [Google Scholar] [CrossRef]
- Qiao, Z.; Chen, J.; Wang, N.; Lu, Y.; He, T.; Sun, Z.; Xu, X.; Yang, H.; Li, Y.; Wang, F. Spatial Network of Urban Thermal Environment in Beijing-Tianjin-Hebei Urban Agglomeration Based on MSPA and Circuit Theory. Environ. Sci. 2023, 44, 3034–3042. [Google Scholar] [CrossRef]
- Stewart, I.D.; Oke, T.R. Local climate zones for urban temperature studies. Bull. Am. Meteorol. Soc. 2012, 93, 1879–1900. [Google Scholar] [CrossRef]
- Yang, J.; Ren, J.; Sun, D.; Xiao, X.; Xia, J.; Jin, C.; Li, X. Understanding land surface temperature impact factors based on local climate zones. Sustain. Cities Soc. 2021, 69, 102818. [Google Scholar] [CrossRef]
- Zhang, W.; Huo, H.; Geng, X.; Zhou, P.; Guo, L.; Li, Z.-L. Simulation of canopy urban heat island at a block scale based on local climate zones and urban weather generator: A case study of Beijing. Int. J. Remote Sens. 2023, 1–25. [Google Scholar] [CrossRef]
- Alexander, P.J.; Mills, G. Local Climate Classification and Dublin’s Urban Heat Island. Atmosphere 2014, 5, 755–774. [Google Scholar] [CrossRef]
- Du, C.; Jia, L.; Lin, L. In-site Landscape Study in MOuntainOus Cities: Origin, ProgresS, and Opportunities. Chin. Landsc. Archit. 2020, 36, 6–12. [Google Scholar] [CrossRef]
- Yue, H.; Liu, Y. Comparison and analysis of land surface temperature retrieval algorithms based on Landsat 8 TIRS. Sci. Technol. Eng. 2018, 18, 200–205. [Google Scholar]
- Yu, X.; Guo, X.; Wu, Z. Land Surface Temperature Retrieval from Landsat 8 TIRS-Comparison between Radiative Transfer Equation-Based Method, Split Window Algorithm and Single Channel Method. Remote Sens. 2014, 6, 9829–9852. [Google Scholar] [CrossRef]
- Lu, Y.; He, T.; Xu, X.; Qiao, Z. Investigation the Robustness of Standard Classification Methods for Defining Urban Heat Islands. IEEE J. Sel. Top. Appl. Earth Obs. Remote Sens. 2021, 14, 11386–11394. [Google Scholar] [CrossRef]
- Bechtel, B.; Alexander, P.J.; Boehner, J.; Ching, J.; Conrad, O.; Feddema, J.; Mills, G.; See, L.; Stewart, I. Mapping Local Climate Zones for a Worldwide Database of the Form and Function of Cities. ISPRS Int. J. Geo-Inf. 2015, 4, 199–219. [Google Scholar] [CrossRef]


Disclaimer/Publisher’s Note: The statements, opinions and data contained in all publications are solely those of the individual author(s) and contributor(s) and not of MDPI and/or the editor(s). MDPI and/or the editor(s) disclaim responsibility for any injury to people or property resulting from any ideas, methods, instructions or products referred to in the content. |
© 2023 by the authors. Licensee MDPI, Basel, Switzerland. This article is an open access article distributed under the terms and conditions of the Creative Commons Attribution (CC BY) license (https://creativecommons.org/licenses/by/4.0/).