Article

A Study of the Influence of Environmental Factors on Water–Heat Exchange Process in Alpine Wetlands

1
International Faculty of Applied Technology, Yibin University, Yibin 644000, China
2
College of Atmospheric Sciences, Chengdu University of Information Technology, Chengdu 610225, China
3
State Key Laboratory of Cryospheric Science, Northwest Institute of Eco—Environment and Resources, Chinese Academy of Sciences, Lanzhou 730000, China
*
Authors to whom correspondence should be addressed.
Atmosphere 2023, 14(12), 1802; https://doi.org/10.3390/atmos14121802
Submission received: 27 October 2023 / Revised: 27 November 2023 / Accepted: 6 December 2023 / Published: 8 December 2023
(This article belongs to the Special Issue Land-Atmosphere Interactions over the Tibetan Plateau)

Abstract

:
Wetlands, which are composed of soil, vegetation and water, have sufficient water supply and are sensitive to climate change. This study analyzes the coupling degree between wetlands and atmosphere and discusses the influence of environmental factors (solar radiation and water vapor pressure deficit) on latent heat flux by using the experimental data from the Maduo Observatory of Climate and Environment of the Northwest Institute of Eco-Environment and Resource, CAS and WRF models. The results showed that, during the vegetation growing season, the average value of Ω (decoupling factor) is 0.38 in alpine wetlands, indicating that the coupling between wetlands and atmosphere is poor. Solar radiation is the main factor influencing the latent heat flux in the results of both observation data analysis and model simulation, and solar radiation and water vapor pressure deficit still have the opposite reaction to latent heat flux; when solar radiation increased by 30%, the average daily amount of latent heat flux increased from 5.57 MJ·m−2 to 7.50 MJ·m−2; when water vapor pressure deficit increased by 30%, the average daily amount of latent heat flux decreased to 5.17 MJ·m−2. This study provides a new research approach for the study of the parameterization of latent heat flux and evapotranspiration in the context of global climate change

1. Introduction

Solar radiation is the source of energy for all movements. As far as the land surface process is concerned, the surface energy balance guarantees the coordination of interactions between land and atmosphere strongly. Energy and material exchanges between land and atmosphere, especially heat and moisture exchanges, have important influences on climate change, which is the core of land surface process studies. Given different climatic backgrounds and underlying surfaces, there are considerable differences in energy exchange processes between the land and atmosphere [1,2,3,4,5]. The surface energy can change the structure of the boundary layer, as well as its changing rules, and by changing the energy and material exchange between the land and atmosphere, the surface energy, especially the latent heat flux, affects regional and global climates [6,7,8]. In addition, climate change is sensitive to changes in the latent heat flux, which affects the changes in the latent heat flux in turn [9,10].
Mainly affected by aerodynamic resistance and surface resistance, the degree of coupling between surface vegetation and the surrounding atmosphere can indicate the exchange capacity of matter and energy between land and atmosphere [11,12,13,14]. Latent heat flux is considered to be an important parameter of water–heat balance near the ground, and is mainly affected by the interactions between environmental and surface factors, with heat (radiation and temperature) and water (soil moisture and atmospheric water vapor pressure deficit) factors being keys in controlling latent heat fluxes between the land and atmosphere [14,15,16,17]. To study the spatial and temporal changes in the latent heat flux against the background of global climate change, researching the degree of coupling between the land and atmosphere and analyzing the influence of the environmental factors (mainly considering solar radiation and water vapor pressure deficit) on the latent heat flux are very important.
Known as the kidneys of the earth, the alpine wetlands are the main ecological barrier of the Tibetan plateau and one of the most important water conservation areas in the upper reaches of the Yellow River, which are combinations of water, soil and vegetation and are also the area of the most fragile ecological environment, being sensitive to climate change [18,19,20,21]. Therefore, the study of latent heat flux in alpine wetlands is particularly important. In summary, researching the degree of coupling between the land and atmosphere and exploring the influence of solar radiation and water vapor pressure deficit on the latent heat flux in alpine wetlands of the Yellow River source area play important roles in understanding the hydrological processes of the Yellow River source area, climate change and the regional ecological environment.
At present, the latent heat flux and their environmental control mechanism have been studied intensively. It has been found that the main environmental impact factors of latent heat flux are the net radiation, and other environmental impact factors, like water vapor pressure deficit, the soil temperature and moisture, the relative humidity and the difference between the ground temperature and air temperature can be relatively ignored on a variety of different underlying surfaces such as forest, Phragmites communis, maize fieldx and semi-arid meadows [22,23,24,25]. Furthermore, the influence degree of the net radiation on the latent heat flux recedes with an increasing time scale and the influence degree of the water vapor pressure deficit and soil water content increases [26]. Current research shows that both WRF mode and MODIS satellite data can better describe the latent heat flux of the underlying meadows and that the model simulation results are greatly affected by soil moisture, vegetation coverage and topography [27,28,29]. WRF (weather research and forecasting), as a new generation of mesoscale numerical weather prediction systems, is used not only for numerical weather prediction but also for regional climate modelling [30,31]. A large number of scholars have tried to study the interaction between land and atmosphere through the model coupling technique between land surface models and mesoscale models and have obtained relatively accurate surface heat flux values [32,33]. These studies, which focus on the forest, grassland and farmland ecosystems, lack research on the alpine wetlands, relatively. In addition, research on the effects of these environmental factors on the latent heat flux is still qualitative for the most part and lacks quantitative evaluations and calculations. Furthermore, the study of latent heat flux and its environmental factors mainly focuses on observation data analysis and satellite remote sensing, but there is a lack of study of simulating the influence of environmental factors on latent heat flux in alpine wetlands.
Therefore, this study, taking the alpine wetlands over the Yellow River source region of the Tibetan Plateau as an example and using eddy-related systems field observation data, analyzed the coupling degree between alpine wetlands and atmosphere and quantitatively calculated the impact of environmental factors (solar radiation and water vapor pressure deficit) on the latent heat flux. Then, the WRF model was used to simulate the water and heat exchange process between land and atmosphere on alpine wetlands, and the sensitivity experiment on the environmental factors affecting the latent heat flux was carried out. In this way, we can verify the results of the observations and further explore the physical mechanism of environmental factors influencing the latent heat flux. In this study, the improved WRF model is used for the first time to quantify the influence of external atmospheric environmental factors on the latent heat flux to characterize the regional distribution of the influence of external atmospheric environmental factors on the latent heat flux in the alpine wetlands over the Yellow River source region. This has the potential to provide reference information for exploring the influences of environmental factors on the latent heat flux over the alpine wetlands of the Yellow River source region and the research on climate change in the Yellow River source region and even the world in the future.

2. Materials

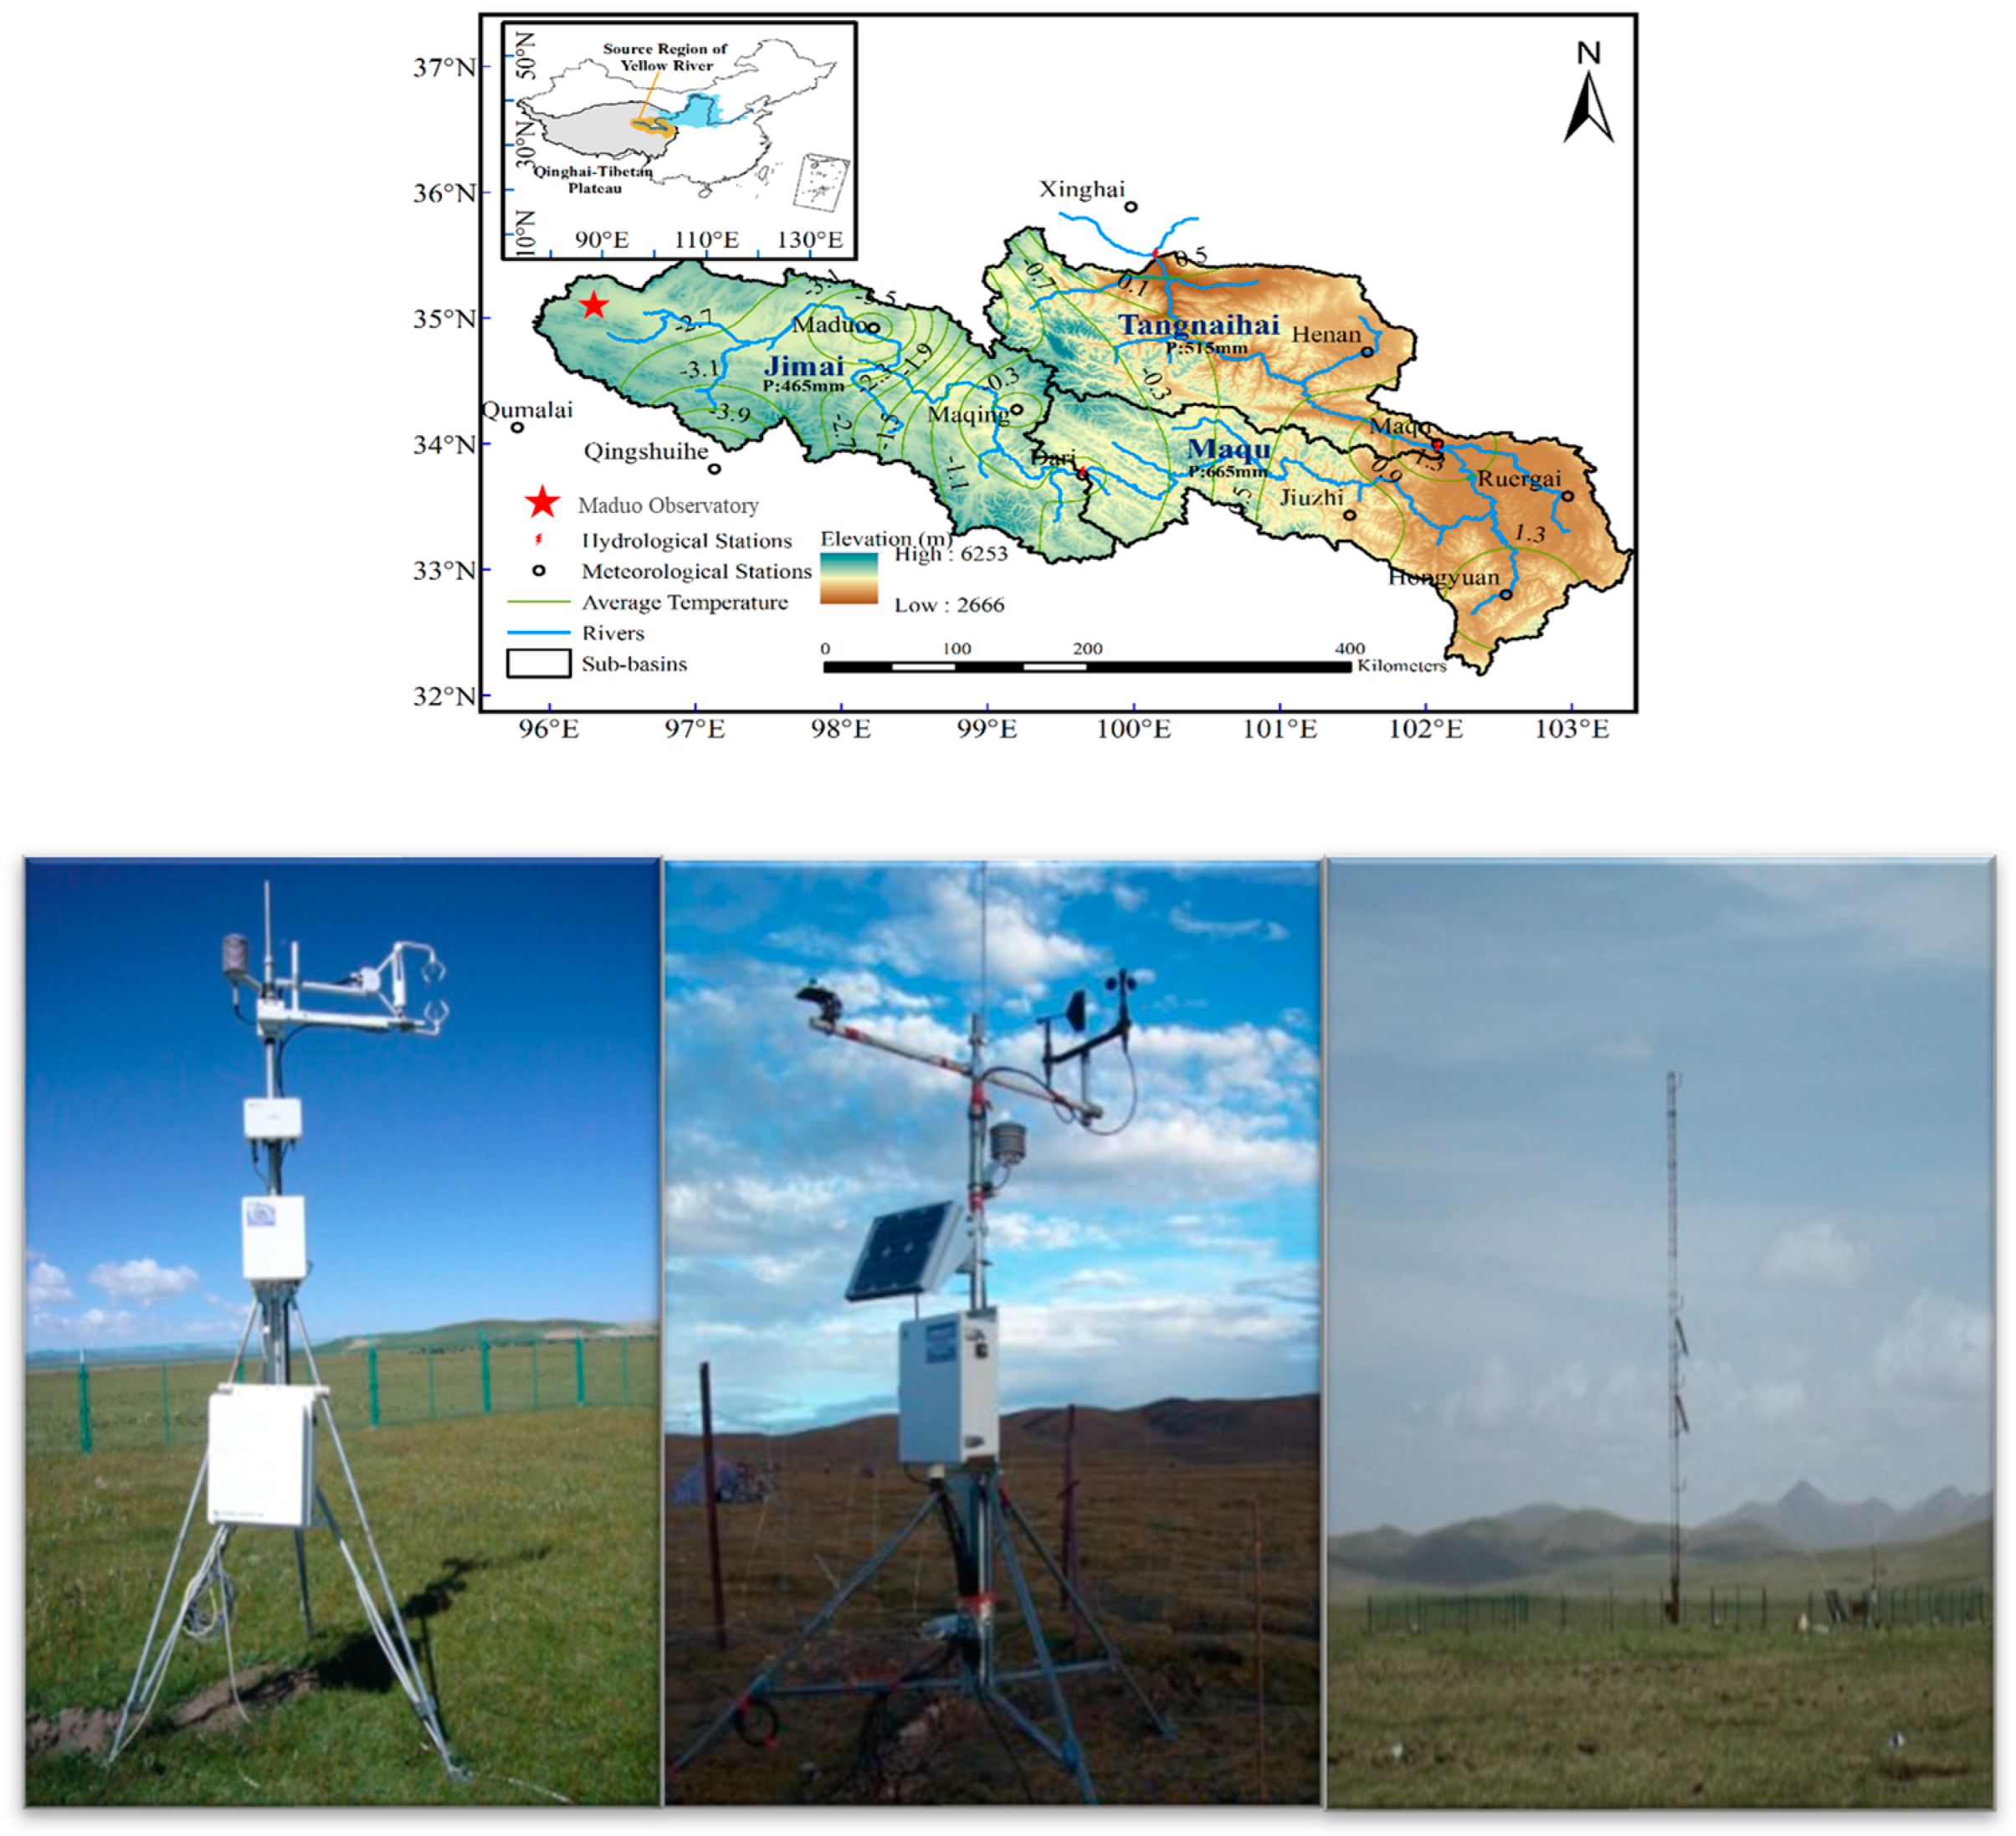
2.1. Site Description

The Yellow River source region is located in the northeastern part of the Qinghai–Tibetan Plateau and is characterized by many landscape types, such as basins, meadows, valleys, glaciers, lakes and permafrost. The Maduo Observatory of Climate and Environment of the Northwest Institute of Eco-Environment and Resource, CAS (Lat: 96.38°, Lon: 35.03°, altitude above the sea: 4313.0 m, seen in Figure 1) is located in the southwest of the Yellow River source region. The surface around the observatory is a uniform surface of alpine meadows or seasonal wetlands, both of which are flat and open terrains, and there are no buildings around to block the observatory, which ensures the representativeness of the observation data [34]. The observatory is under the care of people all year round, and professional personnel maintain the observatory twice a year in late May and late September. In addition, the studied region experiences cold air and a lack of oxygen, with long periods of sunshine and strong ultraviolet rays. Here, the cold season lasts seven to eight months and the warm season lasts four to five months. Influenced by the Qinghai–Tibetan Plateau’s sub-frigid, semi-arid climate, the annual averaged temperature is −3.3 °C, while the annual averaged precipitation amount is 376.6 mm [35].

2.2. Datasets

In this study, we use observations from the Maduo Observatory of Climate and Environment of the Northwest Institute of Eco-Environment and Resource, CAS. The data used in this study date from 1 June to 31 August 2014, and include the sun shortwave radiation, the ground shortwave upward radiation, the ground longwave upward radiation, atmospheric longwave downward radiation, sensible heat flux, latent heat flux and conventional meteorological elements, to calculate and compare with simulation results. Observations are continuous and stable throughout the observation period, with no apparent interruptions or anomalies.
The flux data used in this study are obtained from the observations of the open vorticity correlation flux observing system. This system consists of a CR5000 data acquisition device, a CSAT3 ultrasonic anemometer (Campbell), Li-7500 CO2/H2O analyzer (Li-Cor Company) and a 1 G PC card. The system calculates the online flux using the vorticity correlation principle and stores the time series of the average CO2 flux, latent heat flux and sensible heat flux for 30 min, automatically adjusting the in-line flux with changes in the revised air density to ensure the credibility and accuracy of observation data. The radiation observation system instrument is NR01 four component/net radiation sensors produced by the Netherlands Hukse flux company. This instrument has independent sunlight (short wavelength range, 305~2800 nm) and far-infrared (long wavelength range, 4500~50,000 nm) radiation measurements, which can be used to measure near the ground four independent components of radiation balance. The observation times have a range within Beijing time of 00:00–23:30, recording every 0.5 h, and the record is the average of the value measured ten minutes before and after the time (e.g., the record at 2:00 is the average of the actual measurements from 1:50 to 2:10). To measure the temperature of the air and the surface, a Pt100 temperature sensor was installed in the ground radiation intensity meter. For the measurement of conventional meteorological elements, the PBL tower is equipped with meteorological instruments to obtain conventional meteorological elements such as 2 m, 4 m and 8 m wind speeds, air temperatures, etc., and the time interval of the observation data is also recorded once every 30 min.
Due to weather-related factors, terrain conditions and the physical limitations of the instrument, quality control of the observed data is needed in order to carry out the physical process analysis. This was carried out based on the universal standard of rejecting flux data [36,37,38], and the specific methods used in this study are as follows:
(1)
Due to precipitation, the latent heat flux at noon is negative, and the radiation data are not stable; thus, only data from clear days are used.
(2)
When turbulence is weak, the uncertainty of the flux data is large. The friction wind speed (u*) is the measure of the turbulence intensity. All flux data where u* > 0.1 m·s−1 are selected.
(3)
As turbulence is weak at night, the sensor probe is easily covered by dew condensation or frost, and the night-time latent heat flux is small. Therefore, the data can only be used when the downward shortwave radiation is greater than zero.

3. Methods

3.1. Calculation of Control

According to the Penman–Monteith equation [39], the latent heat flux density ( λ E ) depends on the available energy ( F A ), the water vapour pressure deficit ( D ), the aerodynamic resistance ( r a ), the surface resistance ( r c ), the thermodynamic psychrometric constant ( γ ), the density of the air ( ρ ) and the rate of change of the saturated vapour pressure with temperature ( ):
λ E = F A + ρ c p D / r a + γ ( 1 + r c / r a )
Previous studies have shown that the available energy ( F A ) is proportional to the solar radiation ( R s ), as is β R s [22]. Through linear fitting, the energy closure of the alpine wetlands over the Yellow River source region is 68.0%. β was proved to be 0.554. Surface resistance ( r c ) can be composed of the response functions of minimum surface resistance, solar radiation, water vapor pressure deficit, atmospheric temperature and soil water capacity [39,40]. The response functions of solar radiation and water vapor pressure deficit can be defined as hyperbolic function and inverse proportional function, respectively [22,41].
In order to quantify the effect of environmental factors on the latent heat flux, we introduced control [9], so the relative control ( I x R ) exercised by an environmental controlling factor (x) over the latent heat flux ( λ E ) is defined as
I x R = ( λ E ) x x λ E
The superscript R in the above equation denotes the relative control. Mainly considering the influence of external atmospheric environmental factors (solar radiation and water vapor pressure deficit) on the latent heat flux, and assuming R s , D , r a , γ and are mutually independent variables, we add Equation (1) into Equation (2), which results in the expression of the relative control exercised by solar radiation and water vapor pressure deficit over the latent heat flux:
I R s R = 1 1 + m R s f 1 ( R s ) f 1 ( R s ) ω
and
I D R = m 1 + m R s f 2 ( D ) f 2 ( D ) ω
f 1 ( R s ) and f 2 ( D ) represent the response functions of solar radiation and water vapor pressure deficit, respectively. The parameter m is
m = ρ c p D / r a β R s

3.2. Coupling between Alpine Wetlands and Atmosphere

The starting point of calculating the coupled water vapor flux between the alpine wetlands and atmosphere is the Penman–Monteith equation. Let the aerodynamic resistance ( r a ) tend to infinity or zero, then, the latent heat flux ( λ E ) can be expressed in the following two formulas:
lim r a λ E = β R s + γ
and
lim r a 0 λ E = ρ c p D γ r c
when r a , the extremum of λ E is called the equilibrium latent heat flux ( λ E e q ) , and when r a 0 , the extremum of λ E is called the imposed latent heat flux ( λ E i m p ).
Introducing the decoupling coefficient (Ω) as the evaluation index of the coupling of the water vapor flux between alpine wetlands and atmosphere, the decoupling coefficient can be expressed as
Ω = [ 1 + r c r a ( γ + γ ) ] 1 = 1 ω
The coupling factor ( ω ) represents the degree of coupling between the solar radiation (or water vapor pressure deficit) and the latent heat flux density.
ω = γ ( r c / r a ) + γ ( 1 + r c / r a )
when lim r a Ω = 1 , lim r a 0 Ω = 0 . This reflects the relative importances of aerodynamic resistance and surface resistance. Combining Equations (6)–(8) and substituting the results into Equation (1) yields
λ E = Ω λ E e q + 1 Ω λ E i m p
The real latent heat flux is decided by λ E e q , λ E i m p and Ω . The values of Ω range between 0 and 1. When deciding the value of λ E , Ω reflects the relative importance of λ E e q and λ E i m p [42]. When Ω = 0 , the two systems are completely coupled, and the latent heat flux is mainly affected by the water vapour pressure deficit and the surface resistance. When Ω = 1 , the two systems are completely unable to couple, and the latent heat flux is mainly influenced by solar radiation (or available energy).

4. Model Scheme Design

4.1. Introduction of WRF Model

The WRF (weather research and forecasting) model is a new generation of mesoscale numerical model, which is a fully compressible and non-static equilibrium model. It was jointly developed by organizations such as NCEP/NCAR. The first edition of it was released in October 2000. This study uses the WRF 3.8.1 version released in August 2016. The model uses Arakawa C-grid staggering in the horizontal direction and terrain-following coordinates in the vertical direction and has higher resolution in the horizontal and vertical directions as well as time-split integration using a second- or third-order Runge–Kutta scheme. Four map projections are supported for real-data simulation: Lambert conformal, polar stereographic, Mercator and latitude–longitude allowing rotated pole. WRF provides a number of available physical parameterization options, which have detailed descriptions of the radiation process and the land surface dynamic process, etc., and can accurately simulate the complex interactions between different physical processes and can be used for the simulation of atmospheric processes at various spatial and temporal scales [43,44,45,46,47]. It can be used not only for the simulation of real weather but also as a theoretical basis for the research of basic physical processes by exploring the module groups it contains. Its main advantage is that it can couple the atmosphere to the land surface and explore the physical mechanism of environmental factors affecting the latent heat flux.

4.2. Modification of the Noah LSM

Developed on the basis of the OSU (Oregon State University) model, Noah LSM is a refined regional land surface scheme, and is suitable for weather and climate applications [48]. Its framework is as follows: the potential evaporation of the land surface is calculated using the Penman formula during the day, which is similar to the formula proposed by Mahrt and Ek [49]. The multi-layer soil model [50], the original vegetation model [51] and suitably complex vegetation resistance [30] are also used in this scheme. The land surface scheme has a vegetation layer and the temperature and humidity of each soil layer, the water storage capacity of the vegetation canopy and the amount of snow on the land surface as prediction constants. The scheme has four layers of soil; the soil thickness from the surface layer to the bottom layer is 0.1, 0.3, 0.6 and 1.0 m, respectively; and the soil thickness is 2 m in total. Due to the limited research data in the Tibetan Plateau, there are many problems in the application of the above land surface scheme to the special underlying surface of the plateau. Referring to Chen et al. [52,53], correcting the soil hydrothermal parameterization scheme in the Tibetan Plateau region through soil test data, our study uses it in Noah LSM to improve the simulation effect of soil water and heat parameters in the Tibetan Plateau region.
The temperature of the land surface in the Noah LSM uses a simple and linear land surface energy balance formula proposed by [49]. The ground and vegetation are seen as an integral part of the land surface. The heat flux of the ground is calculated by the common soil temperature diffusion formula:
C ( Θ ) T t = z λ ( Θ ) T t
Among it, the volumetric heat capacity C (J·m−3·K−1) and the thermal conductivity λ (W·m−1·K−1) are functions of soil volumetric water content Θ. In the soil composition, the part of solid does not change much, and the value of the soil heat capacity mainly depends on the proportion of water and air, which is
C = Θ C water + ( 1 Θ sat ) C soil + ( Θ sat Θ ) C air
In the above formula, Cwater = 4.2 × 10⁶ J·m−3·K−1, Csoil = 1.26 × 10⁶ J·m−3·K−1, and Cair = 1004 J·m−3·K−1. Θsat is saturated soil volumetric water content, numerically equaling to soil porosity, and determined by soil type [54]. Since the soil is a porous, finely divided medium, its heat exchange involves three mechanisms, which are radiation, convection and conduction. When the diameter of the pore is less than 5 × 10⁻⁴ m, consider only the last item [55]. As the source of energy for all movements, solar radiation is reflected by the surface, and the absorbed net radiation drives the entire surface hydrothermal process, including the ground-to-air transport of sensible heat flux, latent heat flux, etc. It can be seen from Equation (11) that the correction of the parameterization scheme of thermal conductivity will affect the surface temperature and the simulation of the sensible heat flux and latent heat flux further.
This study focuses on the summer simulation, which mainly considers the water–heat exchange of the surface in the non-freezing state, ignoring the influence of the solid ice. The actual thermal conductivity (λ) of the soil containing a certain amount of water is calculated from the thermal conductivity in the saturated state (λsat) and the dry state (λdry), with the Kersten number (Ke) being its weight coefficient. Its expression is
λ = K e λ sat + ( 1 K e ) λ dry
Because of the heat conductivity (λsat) in the saturated state being determined by the soil type, in order to modify the parameterization scheme of soil thermal conductivity, we modify the rest item of the expression. According to the research of Chen et al. [52,53], the calculation schemes of dry soil density (ρdry), dry soil thermal conductivity (λdry) and Kersten number (Ke) are corrected as
ρ dry = 3260 Θ sat + 2853
λ dry = 1065 0.6996 ρ dry 2726 1.685 ρ dry
K e = 1.061 log ( S ) + 1.586
S is the soil saturation, which is the ratio of the actual water content (Θ) to the saturated water content (Θsat) of the soil.

4.3. Simulation Scheme

This study uses two-grid nesting. The simulation period is from 0:00 on 31 May 2014 (Beijing time, the same below) to 23:00 on 31 August 2014 and total 93 days, and the simulation results are output every 60 min. The underlying surface data uses the USGS-based land use and vegetation type data with a resolution of 1 km. The NCEP/NCAR 1° × 1° reanalysis data recorded four times every day are used for pretreatments as the initial field and boundary conditions of the WRF. The vertical direction of the model is divided into 27 layers, and the top pressure of the model is 50 hpa. Through pre-experimentation and related research [32,33], the parameterization schemes of physical process adopted include the Rapid Radiative Transfer Model (RRTM) longwave, MM5 (Dudhia) shortwave, WRF single-moment 3-class (WSM3) scheme, similarity theory (MM5), Yonsei University (YSU) PBL and no cumulus parameterization scheme for both grids. The land surface parameterization scheme used by the model is the original and modified Noah LSM scheme. The grid parameter settings of the simulation area are shown in Table 1. The model physical parameterization scheme configuration is shown in Table 2.
In order to analyze the process of water–heat exchange between land and atmosphere in alpine wetlands and to explore the environmental factors affecting the process of water-heat exchange, we designed three sets of experiments, which are Ocase, Rscase and Dcase. In the experiments, the environmental factors affecting the latent heat flux mainly included solar radiation and the water vapor pressure deficit. In order to test the simulation performance of the model, the simulation of the surface energy budget was focused on.
Ocase is an experiment with each environmental factor keeping its current state, truly simulating the characteristics of water–heat exchange between land and atmosphere and radiation budget in alpine wetlands, to test the ability of model simulating them. The original and modified Noah LSM scheme are, respectively, used for the experiment, verifying the adaptability of the modified land surface scheme in alpine wetlands and improving the simulation ability of the model in alpine wetlands.
Rscase is an experiment increasing solar radiation by 30% on the basis of the original without changing water vapor pressure deficit, to simulate the effect of solar radiation on latent heat flux. The modified Noah LSM scheme is used for the experiment.
Dcase is an experiment increasing water vapor pressure deficit by 30% on the basis of the original without changing solar radiation, to simulate the effect of water vapor pressure deficit on latent heat flux. The modified Noah LSM scheme is used for the experiment.

5. Results and Discussion

5.1. Relative Control Exercised by Environmental Factors over Latent Heat Flux

Using the observation data, through the above calculation of the control, the range of relative control exercised by solar radiation over latent heat flux is 1.01 to 1.25, with an average of 1.10, and the variation is affected by the same degree of solar radiation and resistance ratio. As shown in Figure 2a, as solar radiation increases, the relative control exercised by solar radiation over latent heat flux gradually decreases. Since the values are all greater than 1, it indicates that the small increase in solar radiation can cause a large increase in latent heat flux. The range of relative control exercised by water vapor pressure deficit over latent heat flux is −0.04 to −0.72, with an average of −0.29. As shown in Figure 2b, the absolute value of the relative control exercised by water vapor pressure deficit over latent heat flux increases with the increase in the vapor pressure deficit. And its value is less than 0, indicating that the water vapor pressure deficit always plays a role in reducing the surface latent heat flux in the alpine wetlands over the Yellow River source region, and with the increase in water vapor pressure deficit, this effect is also more intense.
As shown in Figure 3, solar radiation and water vapor pressure deficit play an opposite role in affecting latent heat flux in alpine wetlands over the Yellow River source region. Solar radiation always plays a role in increasing the latent heat flux, and the water vapor pressure deficit always plays a role in reducing the latent heat flux, but the opposite effect of solar radiation and water vapor pressure deficit on the latent heat flux is not corresponding. In general, with the increase in the relative control exercised by the solar radiation over the latent heat flux, the absolute value of relative control exercised by water vapor pressure decreases. During the vegetation growing season in alpine wetlands, the relative control exercised by solar radiation over latent heat flux is always greater than the relative control exercised by water vapor pressure deficit. This conclusion is in line with the Ω theory. The values of Ω range between 0 and 1. When Ω = 0, the two systems are completely coupled. As the values of Ω increases, the coupling of the water vapor flux between alpine wetlands and atmosphere becomes progressively worse. During the vegetation growing season, the average value of Ω is 0.38 in alpine wetlands. This value is a relatively large one [14], with the coupling between the wetland and the atmosphere being poor, and the latent heat flux is mainly affected by solar radiation. The actual situation is consistent with these results. The latent heat flux is mainly affected by solar radiation in alpine wetlands surface with sufficient water supply and low aerodynamic resistance. Ω can be used to quantify the effect of surface resistance on latent heat flux but does not quantify the effects of solar radiation and water vapor pressure deficit on latent heat flux. The equations for the relative control exercised by solar radiation and water vapor pressure deficit over the latent heat flux show that the relationship between the relative control exercised by solar radiation (or the water vapor pressure deficit) and Ω is non-linear and depends not only on the Ω factor but also on other factors, such as the solar radiation, the water vapor pressure deficit and their response functions. Consequently, a close correlation between latent heat flux density and a given environmental factor does not necessarily imply that this factor greatly affects the flux density, while even a low correlation may imply powerful control [22].

5.2. Adaptability of Model in Alpine Wetlands Surface

Above, through the observation data, the degree of influence of environmental factors (solar radiation and water vapor pressure deficit) on latent heat flux has been calculated. Next, the numerical model is used to verify the results of observation data, and further explore the physical mechanism of environmental factors affecting latent heat flux. First of all, we must test the adaptability of the model in the alpine wetlands surface. In the Ocase experiment, the two groups of simulation results (WRF: original Noah scheme; WRF+: modified Noah scheme) were selected for comparison with observation data in the grid point where the Maduo Observatory is located from 1 June 2014 to 31 August 2014. Figure 4 shows the diurnal comparison between the simulation results and observation data of energy flux and radiation budget for two consecutive days (from 00:00 on 17 August 2014 to 23:00 on 18 August 2014). It can be seen that both schemes of the model can simulate the diurnal variation of energy flux and net radiation. The difference between the simulation results and the observed data is mainly reflected in the variation of daytime flux. The original Noah scheme overestimates the sensible heat flux but underestimates the latent heat flux. Compared with WRF, WRF+ effectively increases the latent heat flux and decreases the sensible heat flux during the day, narrowing the difference between the simulated value and the observed value. Due to the influence of precipitation, soil moisture and other complex water–atmosphere processes, the observed latent heat flux oscillates significantly. In general, the simulated results of WRF+ do not show this characteristic well. The oscillation amplitude of the simulated value of latent heat flux is much smaller than the observed value, and the oscillation amplitude of the simulated value of sensible heat flux is much larger than the observed value.
The WRF and WRF+ model statistics compared with the observation data are shown in Table 3, which exhibit an increase in R2 (simple correlation coefficients) and a decrease in MAE (mean absolute error) of the latent heat fluxes simulated by WRF+ with the observations, compared with WRF. The same applies to sensible heat flux and net radiation. Because RMSD (root–mean–square deviation) is very sensitive to small deviations, RMSD of flux are generally large. WRF+ effectively increases the oscillation amplitude of latent heat flux and reduces the oscillation amplitude of sensible heat flux. By using WRF+ instead of WRF, the RMSD of latent heat flux decreased from 58.06 to 49.94, and the RMSD of sensible heat flux is decreased from 79.41 to 62.20. WRF+ improves the modeling of the net radiation to a lesser extent. According to the research of Chen et al. [52,53], we modify the calculation schemes of dry soil density, dry soil thermal conductivity and Kersten number. Laboratory tests and observations are used to modify the soil thermal schemes to better apply to the plateau. Consequently, the simulation of latent heat flux improved in the source region of the Yellow River.
And there are also instrument errors and other errors in observation data, such as causing negative latent heat flux. In order to eliminate this error based on latent heat flux, average diurnal processing is carried out, as shown in Figure 5. The average diurnal variation peak of the simulated latent heat flux by WRF is 115.54 W·m−2, while that of the observed data reach up to 184.58 W·m−2, which WRF+ increases to 168.72 W·m−2. From the above, we can see that the latent heat flux of WRF+ simulation has significantly increased, which is close to the observed value. It can be seen from the figure, WRF+ mainly improves the simulation effect during the day and slightly effects it at night.
Figure 6 shows the regional distribution of energy flux in alpine wetlands over the source region of the Yellow River. It can be found that the high-value regions of latent heat flux are mainly distributed on both sides of the river, and the alpine wetlands in the source area of the Yellow River are the main source of latent heat flux on the Tibetan plateau. The regional distribution of sensible heat flux tends to be high in the north and low in the south. The Zaling lake and Eling lake are the low value regions of sensible heat flux, and the sensible heat flux is obviously lower than that in the surrounding areas. In general, the regional distribution of latent heat flux and sensible heat flux in alpine wetlands over the source region of the Yellow River present opposing trends.
Due to the limitation of resolution, the simulated values are the average state of the grid region where the observation points are located, which is still different from the actual value. WRF+ can better simulate the spatiotemporal variation characteristics of energy flux in alpine wetlands over the source region of the Yellow River. Next, we will study the influence of environmental factors on the latent heat flux, mainly considering the expression of the model on the latent heat flux. Therefore, it is feasible to use WRF+ to simulate the latent heat flux under the change of environmental factors, due to the simulated value of latent heat flux being very close to the observed value.

5.3. WRF+ Simulating the Influence of Environmental Factors on Latent Heat Flux

Rscase and Dcase compared with Ocase, using the modified Noah scheme, we explore the effect of increasing solar radiation and water vapor pressure deficit on latent heat flux, respectively. Figure 7 shows the average diurnal variation of latent heat flux in the three groups of experiments. It can be seen that when solar radiation increases by 30%, the latent heat flux also increases, and the diurnal peak value of latent heat flux increases from 189.64 W·m−2 to 247.60 W·m−2. It can also be seen that when water vapor pressure deficit increases by 30%, the latent heat flux decreases, and the daily peak value of latent heat flux decreases to 169.19 W·m−2. According to the analysis of WRF+ simulation results, the relative control exercised by solar radiation and water vapor pressure deficit over latent heat flux on clear day in alpine wetlands is 1.23 and −0.28, respectively. The former is slightly larger than that calculated previously (1.10), and the absolute value of the latter is slightly smaller than that calculated previously (−0.29). With the change in environmental factors, the average daily amount of latent heat flux increases from 5.57 MJ·m−2 to 7.50 MJ·m−2 and decreases to 5.17 MJ·m−2, respectively. The change in solar radiation to the average daily amount of latent heat flux is 4.83 times as many as the change of water vapor pressure deficit to the average daily amount of latent heat flux. It can be seen from the simulation results that solar radiation plays a role in increasing latent heat flux, while water vapor pressure deficit always plays a role in reducing latent heat flux, and solar radiation has a greater influence on latent heat flux. The results are consistent with Ω theory and calculation. In addition, solar radiation and water vapor pressure deficit only change the latent heat flux during the day and have little influence on the change in the latent heat flux at night. Moreover, environmental factors have a great influence on the latent heat flux at noon and a small influence in the morning and evening.
Figure 8 shows the regional distribution characteristics of the difference of latent heat flux based on three cases of different alpine wetland underlying surfaces. It can be seen that the difference of latent heat flux based on Rscase and subtracting Ocase is always greater than 0 in alpine wetlands over the Yellow River source region, indicating that solar radiation always plays a role in increasing latent heat flux, which is consistent with the previous calculation results. Moreover, the difference of latent heat flux based on Rscase subtracting Ocase shows an increasing trend from northwest to southeast, which indicates that the coupling degree decreases gradually from northwest to southeast. The difference of latent heat flux based on Dcase and subtracting Ocase is always less than 0 in alpine wetlands over the Yellow River source region, indicating that water vapor pressure deficit always plays a role in decreasing latent heat flux, which is also consistent with the previous calculation results. The maximum value is located in the northwest of the source area of the Yellow River. But the water vapor pressure deficit plays a role in increasing the latent heat flux along the northwest to southeast, gradually. As the results calculated before, the effect of solar radiation and water vapor pressure deficit on latent heat flux do not correspond, which can be confirmed from this figure. It shows that in the region where the difference in latent heat flux between Rscase and Ocase appears to be the maximum, the difference in latent heat flux between the Dcase and Ocase latent heat flux is not the maximum value.
Above, through physical process analysis based on observation data and model calculation, we find that solar radiation is the main environmental factor that affects latent heat flux, and water vapor pressure deficit has a small impact on latent heat flux on the underlying surface of alpine wetlands in the source region of the Yellow River. Solar radiation always increases the latent heat flux on the underlying surface of the alpine wetlands in the source area of the Yellow River, while the vapor pressure deficit is just the opposite. However, the contrary effect on the latent heat flux does not correspond. These findings are consistent with those of Jarvis et al. [56], Baldocchi et al. [57] and Wang et al. [22] in pine forests. In addition, the influence of solar radiation on latent heat flux is about five times that of the influence of water vapor pressure deficit.

6. Summary and Conclusions

Taking the alpine wetlands in the source region of Yellow River in the northeast of the Qinghai–Tibet Plateau as an example, using the field observation data based on the vortex-related turbulent flux system, through the advanced WRF model, this study analyzes the degree of coupling between alpine wetlands and atmosphere and quantified the influence of external atmospheric environment factors (solar radiation and water vapor pressure deficit) on latent heat flux. The following conclusions have been drawn.
(1)
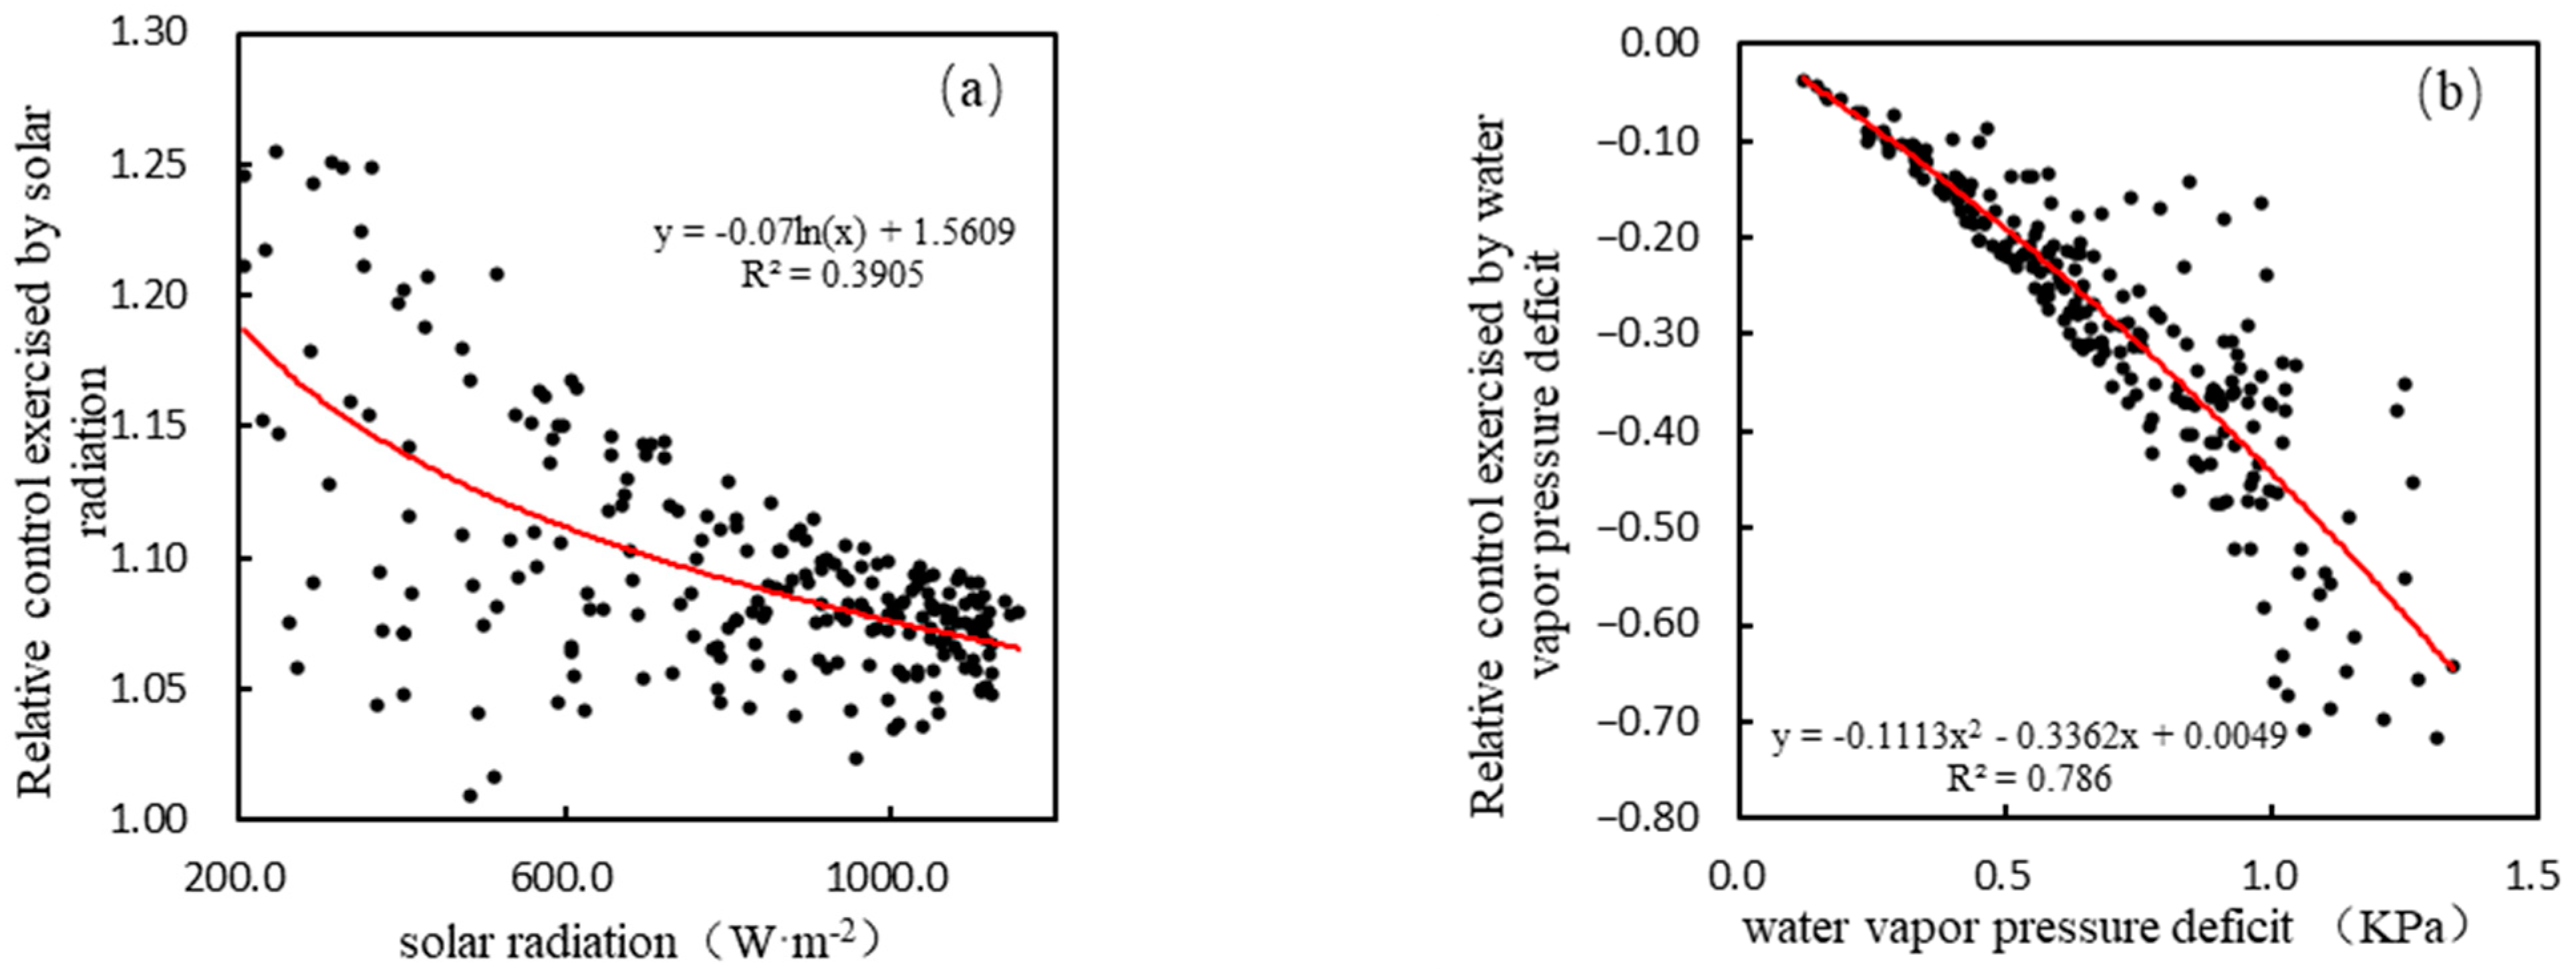
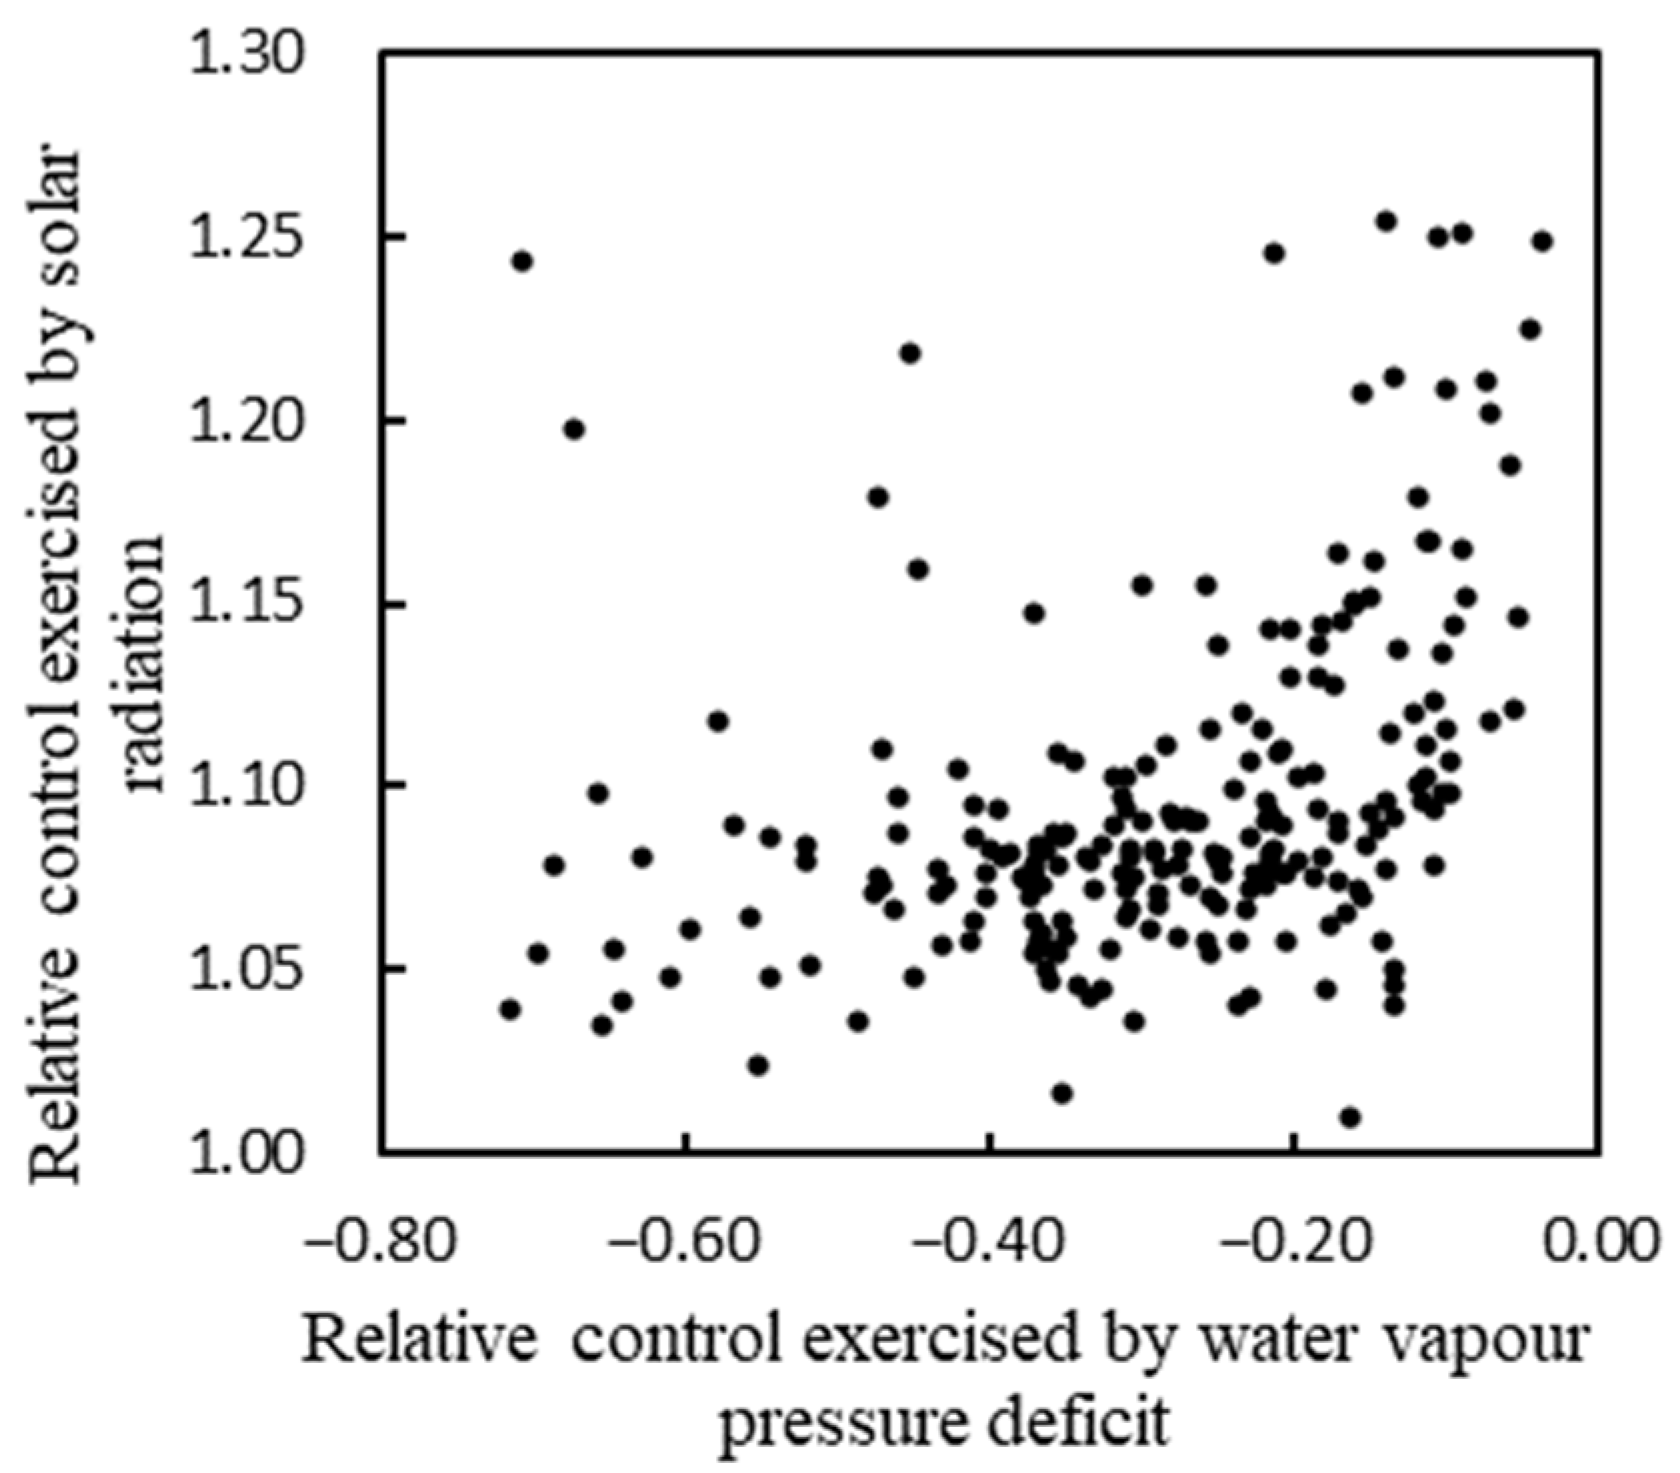
The relative control exercised by solar radiation over latent heat flux gradually decreases with the increase in the solar radiation, and the absolute value of the relative control exercised by water vapor pressure deficit over latent heat flux increases with the increase in vapor pressure deficit. The water vapor pressure deficit always plays a role in reducing the surface latent heat flux in the alpine wetlands over the Yellow River source region; however, solar radiation plays the opposite role. In addition, the opposite effect of solar radiation and water vapor pressure deficit on the latent heat flux is not corresponding. The relative control exercised by solar radiation and water vapor pressure deficit over latent heat flux are calculated to be 1.10 and −0.29, and solar radiation is the main factor affecting the latent heat flux in alpine wetlands.
(2)
During the vegetation growing season, the average value of Ω is 0.38 in alpine wetlands. The relatively large value indicates that the coupling between the wetland and the atmosphere is poor in this period, and the latent heat flux is mainly affected by solar radiation. The actual situation is consistent with this. The latent heat flux is mainly affected by solar radiation in alpine wetlands surface with sufficient water supply and low aerodynamic resistance.
(3)
Referring to the results of previous scholars’ improvement of the parameterization scheme for land–surface processes in alpine wetlands and applying them to land–atmosphere coupling, which enables WRF+ to increase the amplitude of oscillations in the latent heat fluxes and narrow the root–mean–square deviation of turbulent fluxes, effectively. In aggregate, WRF+ can better simulate the spatiotemporal variation characteristics of energy flux in alpine wetlands over the source region of the Yellow River. Therefore, it is feasible to use WRF+ to simulate the latent heat flux with changing environmental factors.
(4)
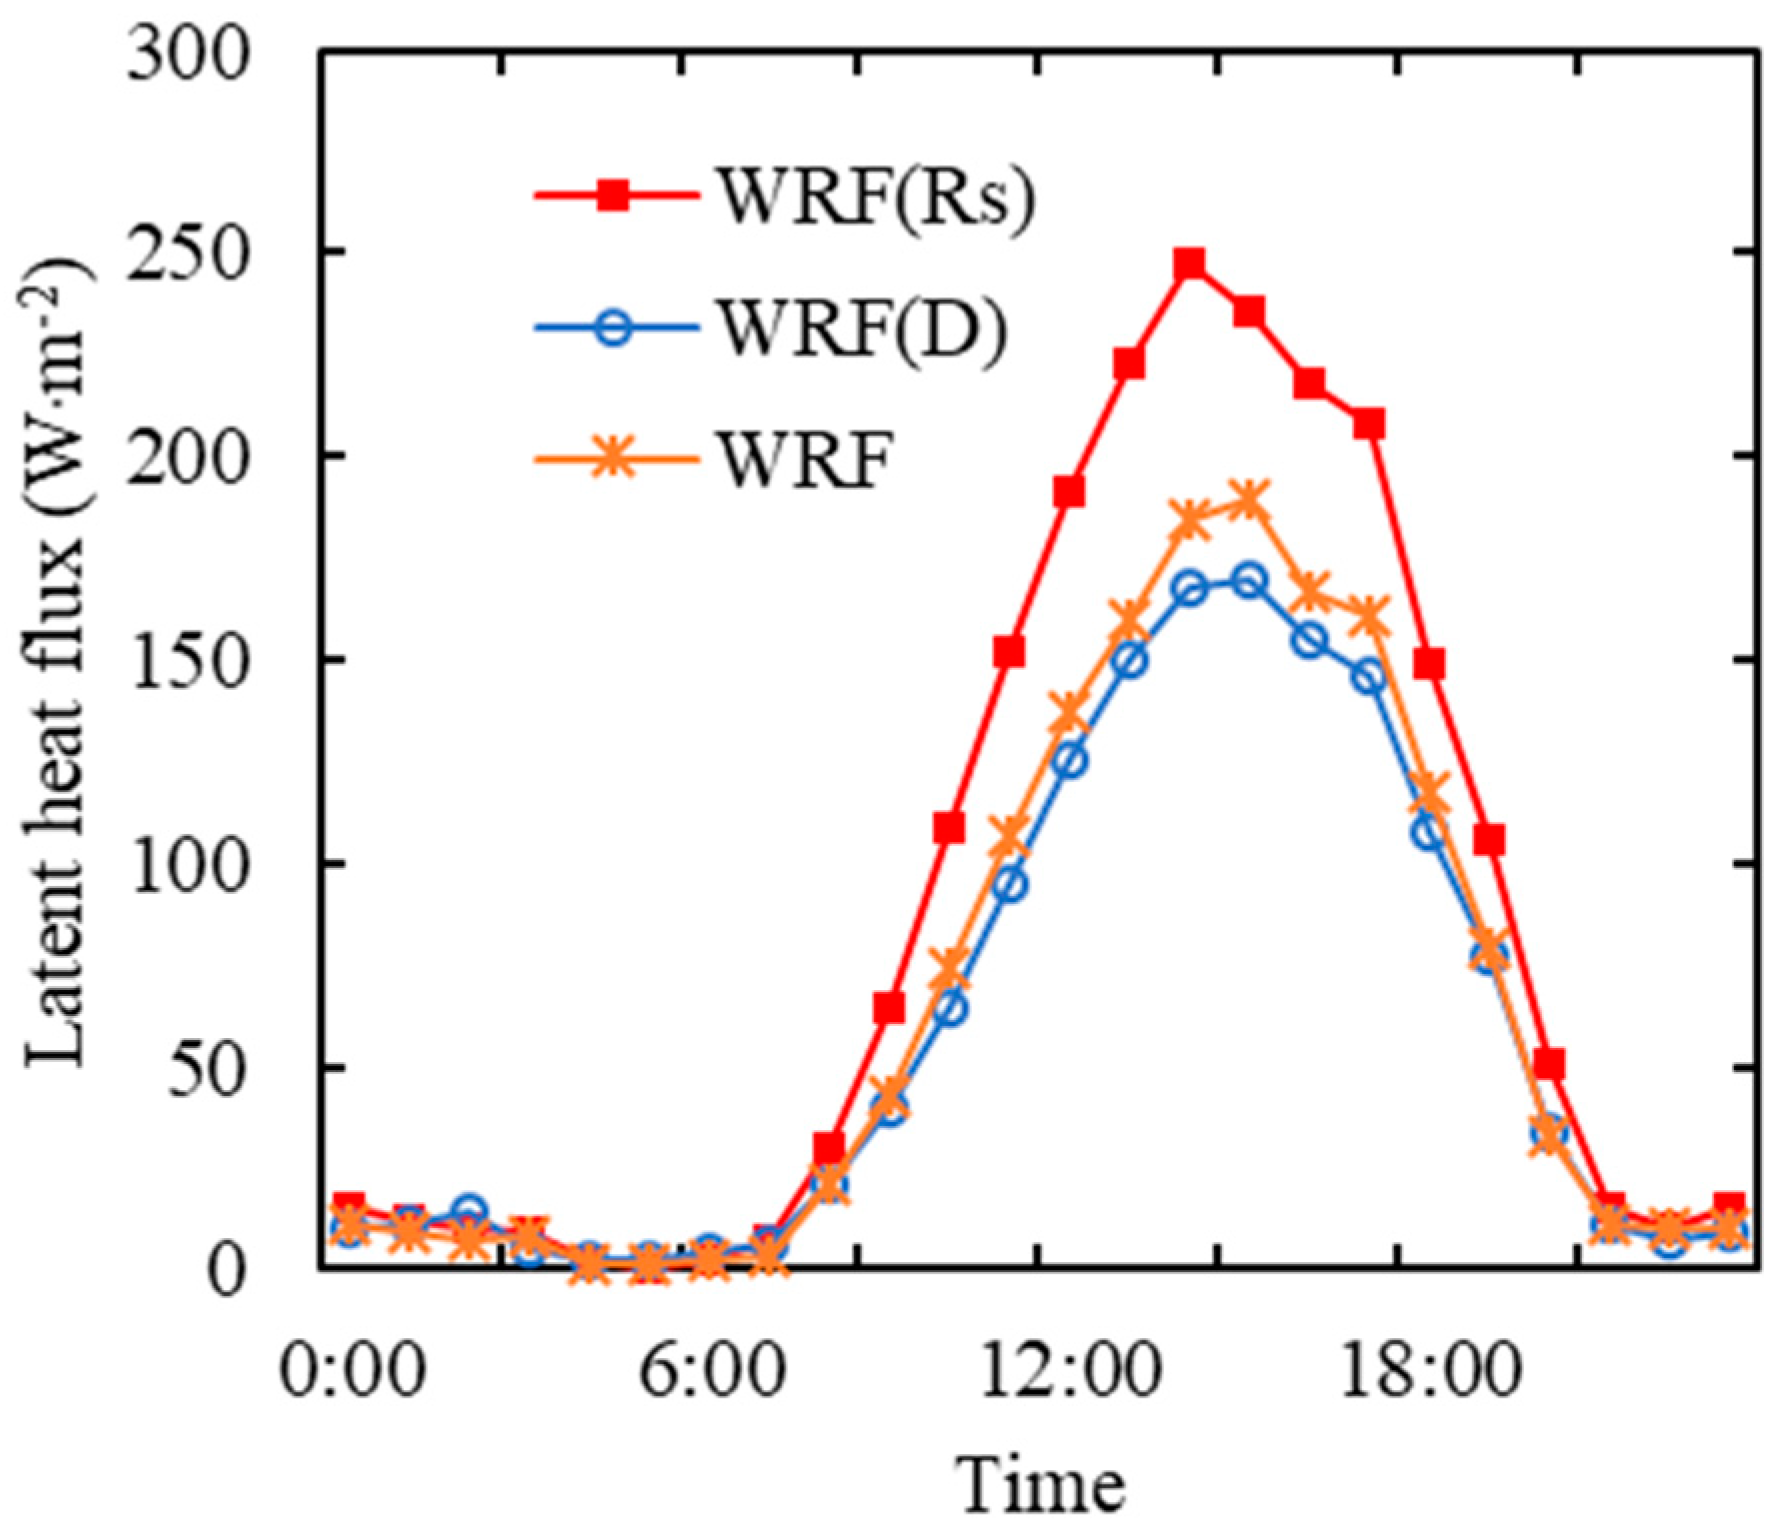
Using WRF+ to simulate the latent heat fluxes under changing environmental factors, it was found that for the underlying surfaces of alpine wetlands, solar radiation is still the main environmental factor affecting latent heat flux, and the influence degree is five times that of water vapor pressure deficit. When solar radiation increases by 30%, the diurnal peak value of latent heat flux increases from 189.64 W·m−2 to 247.60 W·m−2, and the average daily amount of latent heat flux increases from 5.57 MJ·m−2 to 7.50 MJ·m−2. When water vapor pressure deficit increases by 30%, the diurnal peak value of latent heat flux decreases to 169.19 W·m−2, and the average daily amount of latent heat flux decreases to 5.17 MJ·m−2.
In this study, based on the field observation data and WRF model, the environmental factors affecting latent heat flux of alpine wetlands underlying surface are discussed, and the degree of influence is quantitatively evaluated for the first time. The land surface parameterization scheme of alpine wetland underlying surfaces based on previous research is transplanted into the land–atmosphere coupling WRF model to simulate the water–heat exchange process between alpine wetland underlying surfaces and the atmosphere, which can effectively improve the adaptability of WRF model to the special underlying surfaces of alpine wetlands in the source region of the Yellow River. Raising the scale of research from point to surface, WRF+ is used to quantify the influence of the external atmospheric environmental factors on the latent heat fluxes, and compared with the actual observation data, the regional distribution of the influence of external atmospheric factors on the latent heat flux is characterized. The results can provide a new research approach for the study of the parameterization of latent heat flux and evapotranspiration in the context of global climate change.

Author Contributions

Conceptualization, J.W. and X.Y.; methodology, Y.X. and J.C.; simulation, Y.X.; data analysis, Y.Z.; writing—original draft preparation, Y.X. All authors have read and agreed to the published version of the manuscript.

Funding

This work was funded by the National Natural Science Foundation of China (Grant No. 41975130); the Project PAEKL-2023-K02 was supported by Open Research Fund Program of Plateau Atmosphere and Environment Key Laboratory of Sichuan Province; the Project of Yibin University (2019QD21) and the National Natural Science Foundation of China (Grant No. 42005075).

Institutional Review Board Statement

Not applicable.

Informed Consent Statement

Not applicable.

Data Availability Statement

The data presented in this study are available on request from the corresponding author. The data are not publicly available due to the ownership of this data belonging to the corresponding author.

Conflicts of Interest

The authors declare no conflict of interest.

References

  1. Hu, Y.Q. Research advance about the energy budget and transportation of water vapour in the HEIFE area. Adv. Earth Sci. 1994, 9, 30–34. [Google Scholar]
  2. Li, Y.N.; Shi, S.B.; Cao, G.M.; Yang, Y.G.; Shen, Z.X. The observational studies on characteristics of microclimate in Haibei alpine meadow regions of Qi-Lian mountain. Plateau Meteorol. 2000, 19, 512–519. [Google Scholar]
  3. Zhang, Q.; Cao, X.Y. The influence of synoptic conditions on the averaged surface heat and radiation budget energy over desert or gobi. Chin. J. Atmos. Sci. 2003, 27, 245–254. [Google Scholar]
  4. Bao, Y.; Zuo, H.C.; Lv, S.H. The effect of improved land surface process parameters in arid area on climatic simulation in GCM. Plateau Meteorol. 2004, 23, 220–227. [Google Scholar]
  5. Ling, Z.; Shi, Z.T.; Gu, S.X.; Peng, H.Y.; Feng, G.J.; Huo, H. Energy balance and evapotranspiration characteristics of rubber tree (Hevea brasiliensis) plantations in Xishuangbanna, Southwest of China. Appl. Ecol. Environ. Res. 2022, 20, 103–117. [Google Scholar] [CrossRef]
  6. Trenberth, K.E.; Caron, J.M.; Stepaniak, D.P. The atmospheric energy budget and implications for surface fluxes and ocean heat transports. Clim. Dyn. 2001, 17, 259–276. [Google Scholar] [CrossRef]
  7. Mahrt, L.; Vickers, D. Boundary-Layer adjustment over small scale changes of surface heat flux. Bound.-Layer Meteorol. 2005, 116, 313–330. [Google Scholar] [CrossRef]
  8. Zhu, C.M.; Lettenmaier, D.P. Long-term climate and derived surface hydrology and energy flux data for Mexico: 1925–2004. J. Clim. 2007, 20, 1936–1946. [Google Scholar] [CrossRef]
  9. Jacobs, C.M.J.; De Bruin, H.A.R. The Sensitivity of Regional Transpiration to Land Surface Characteristics: Significance of Feedback. J. Clim. 1992, 5, 683–698. [Google Scholar] [CrossRef]
  10. Sun, J.Q.; Li, H.Y.; Wang, X.J.; Shamsuddin, S. Water resources response and prediction under climate change in Tao’er River Basin, Northeast China. J. Mt. Sci. 2021, 18, 2635–2645. [Google Scholar] [CrossRef]
  11. Penman, H.L.; Schofield, R.K. Some physical aspects of assimilation and transpiration: Carbon dioxide fixation and photosynthesis. Symposia. Soc. Exptl. Biol. 1951, 5, 115–129. [Google Scholar]
  12. Bange, G.G.J. On the quantitative explanation of stomatal transpiration. Acta Bot. Neerl. 1953, 2, 255–297. [Google Scholar] [CrossRef]
  13. McNaughton, K.G.; Jarvis, P.G. Predicting effects of vegetation changes on transpiration and evaporation. In Water Deficits and Plant Growth, 1st ed.; Kozlowski, T.T., Ed.; Academic Press: Cambridge, MA, USA, 1983; Volume 7, pp. 1–47. [Google Scholar]
  14. Jarvis, P.G.; McNaughton, K.G. Stomatal Control of Transpiration: Scaling Up from Leaf to Region. Adv. Ecol. Res. 1986, 15, 1–49. [Google Scholar]
  15. Kellner, E. Surface Energy Fluxes and Control of Evapotranspiration from a Swedish Sphagnum Mire. Agric. For. Meteorol. 2001, 110, 101–123. [Google Scholar] [CrossRef]
  16. Wever, L.A.; Flanagan, L.B.; Carlson, P.J. Seasonal and interannual variation in evapotranspiration, energy balance and surface conductance in a northern temperate grassland. Agric. For. Meteorol. 2002, 112, 31–49. [Google Scholar] [CrossRef]
  17. Al-Shibli, F.M.; Ottom, M.A.; Saoub, H.; Al-weshah, R. Comparative analysis of potential evapotranspiration calculation methods with ERA-reanalysis climate models’ projections in Western Asia, Jordan. Appl. Ecol. Environ. Res. 2021, 19, 4849–4879. [Google Scholar] [CrossRef]
  18. Li, F.X.; Chang, G.G.; Xiao, J.S.; Zhou, B.R.; Fu, Y. Relationship between wetlands changes and climate change in the Yellow River source region. J. Nat. Resour. 2009, 24, 683–690. [Google Scholar]
  19. Li, Z.G.; Lu, S.H.; Ao, Y.H.; Wen, X. Numerical Simulation of Impact of Ecological Environment Change on Lake Effect in the Source Region of the Yellow River. Plateau Meteorol. 2012, 31, 1591–1600. [Google Scholar]
  20. Tan, P. Discuss the importance of wetland protection and reverting cultivated land to wetland. Resour. Econ. Environ. Prot. 2014, 3, 142–143. [Google Scholar]
  21. Lin, Z.Y.; Xiao, Y.; Ouyang, Z.Y. Assessment of ecological importance of the Qinghai-Tibet Plateau based on ecosystem service flows. J. Mt. Sci. 2021, 18, 1725–1736. [Google Scholar] [CrossRef]
  22. Wang, Q.G.; Kellomäki, S. Role of solar radiation and water vapour pressure deficit in controlling latent heat flux density in a cots pine forest. Bound.-Layer Meteorol. 2005, 115, 131–149. [Google Scholar] [CrossRef]
  23. Yu, W.Y.; Zhou, G.S.; Chi, D.C.; He, Q.J.; Zhou, L. Evapotranspiration of phragmites communis community in Panjin wetland and its controlling factors. Acta Ecol. Sin. 2008, 28, 4594–4601. [Google Scholar]
  24. Wang, X.X.; Liu, X.; Chen, S.H.; Zhu, Q.J.; Hu, Y.M. Correlation analysis of water and heat fluxes with environmental variables over lawn in semi-arid area. J. Basic Sci. Eng. 2008, 16, 770–777. [Google Scholar]
  25. Ding, R.S.; Kang, S.Z.; Zhang, Y.Q.; Tong, L.; Li, S.E. Characteristics of water vapor and heat fluxes and the controlling factors over a maize field in the arid inland region. J. Hydraul. Eng. 2014, 45, 312–319. [Google Scholar]
  26. Li, Y.J. Environmental controls on water and heat exchanges over rainfed maize cropland in northeast China. Clim. Environ. Res. 2015, 20, 71–79. [Google Scholar]
  27. Wu, X.M.; Ma, W.Q.; Ma, Y.M. Observation and simulation analyses on characteristics of land surface heat flux in northern Qinghai-Xizang Plateau in summer. Plateau Meteorol. 2013, 32, 1246–1252. [Google Scholar]
  28. Ye, J.; Peng, L.C.; Liao, Q.; Li, Z.M. Estimation of latent heat flux over semiarid areas for clear sky days using modis data. Acta Sci. Nat. Univ. Pekin. 2014, 50, 835–842. [Google Scholar]
  29. Vladimirov, E.; Dimitrova, R.; Danchovski, V. Sensitivity of wrf model results to topography and land cover: Study for the sofia region. Annu. Sofia 2018, 111, 87–101. [Google Scholar]
  30. Chen, F.; Janjić, Z.; Mitchell, K. Impact of atmospheric surface-layer parameterizations in the new land-surface scheme of the NCEP Mesoscale Eta Model. Bound.-Layer Meteorol. 1997, 85, 391–421. [Google Scholar] [CrossRef]
  31. Pielke, R.A.; Lee, T.J.; Copeland, J.H.; Eastman, J.L.; Ziegler, C.L.; Finley, C.A. Use of USGS-provided data to improve weather and climate simulations. Ecol. Appl. 1997, 7, 3–21. [Google Scholar]
  32. Chen, F.; Dudhia, J. Coupling an advanced land surface-hydrology model with the Penn State-NCAR MM5 modeling system. Part II: Preliminary model validation. Mon. Weather Rev. 2001, 129, 587–604. [Google Scholar] [CrossRef]
  33. Zeng, X.B.; Shaikh, M.; Dai, Y.; Dickinson, R.E.; Myneni, R. Coupling of the common land model to the NCAR community climate model. J. Clim. 2002, 15, 1832–1854. [Google Scholar] [CrossRef]
  34. Chen, J.L.; Wen, J.; Tian, H. Up-Scaling Research for Soil Moisture in Yellow River Source Region. Plateau Meteorol. 2016, 35, 1212–1213. [Google Scholar]
  35. Li, L.G.; Luo, S.D.W. Dictionary of Political Regions of the People’s Republic of China: Qinghai Province, 1st ed.; China Society Press: Beijing, China, 2016; p. 460. [Google Scholar]
  36. Guo, J.X.; Mei, X.R.; Lu, Z.G.; Zhao, Q.S. Field evapotranspiration measurement based on eddy covariance technology. Sci. Agric. Sin. 2004, 8, 1172–1176. [Google Scholar]
  37. Li, Y.J.; Xu, Z.Z.; Wang, Y.L.; Zhou, L.; Zhou, G.S. Latent and sensible heat fluxes and energy balance in a maize agroecosystem. Chin. J. Plant Ecol. 2007, 31, 1132–1144. [Google Scholar]
  38. He, J.J. Characteristic of latent heat flux in typical steppe. Chin. Agric. Sci. Bull. 2014, 30, 195–199. [Google Scholar]
  39. Monteith, J.L. Principles of Environmental Physics, 3rd ed.; Elsevier: Amsterdam, The Netherlands; Boston, MA, USA, 2008; pp. 1–366. [Google Scholar]
  40. Stewart, J.B. Modelling Surface Conductance of Pine Forest. Agric. For. Meteorol. 1988, 43, 19–35. [Google Scholar] [CrossRef]
  41. Cienciala, E.; Kučera, J.; Lindroth, A.; Čermák, J. Canopy transpiration from a boreal forest in Sweden during a dry year. Agric. For. Meteorol. 1997, 86, 157–167. [Google Scholar] [CrossRef]
  42. Steduto, P.; Hsiao, T.C. Maize canopies under two soil water regimes: Ⅲ. Variation in coupling with the atmosphere and the role of leaf area index. Agric. For. Meteorol. 1998, 89, 201–213. [Google Scholar] [CrossRef]
  43. Li, H.M.; Li, L.; Zhang, J.X.; Shi, X.H.; Shen, H.Y.; Wang, Z.Y. Change in extreme climatic events over the sources of the three rivers in the prometaphase 21st century. J. Glaciol. Geocryol. 2012, 34, 1403–1408. [Google Scholar]
  44. Wang, C.H.; Sun, C. Design and preliminary test of the regional climate model (WRFC) based on coupling WRF3.2 and CLM4.0. Plateau Meteorol. 2013, 32, 1626–1637. [Google Scholar]
  45. Xin, Y.; Wang, C.H.; Shen, Y.F.; Chen, H.W. Forecast examination of surface global horizontal irradiance over middle of xinjiang using WRF model. Plateau Meteorol. 2013, 32, 1368–1381. [Google Scholar]
  46. Wang, T.J.; Zhang, L.; Hu, X.J.; Zhao, S.Q.; Wang, J. Numerical simulation of summer boundary layer structure over undulating topography of loess plateau simulated by WRF model. Plateau Meteorol. 2013, 32, 1261–1271. [Google Scholar]
  47. Wen, X.H.; Dong, W.J.; Liao, X.H. Numerical simulations of radiation budget and energy balance using WRF model in summer over semi-arid northeastern China. Acta Energiae Solaris Sin. 2015, 36, 2196–2203. [Google Scholar]
  48. EK, M.B.; Mitchell, K.E.; Lin, Y.; Rogers, E.; Grunmann, P.; Koren, V.; Gayno, G.; Tarpley, J.D. Implementation of Noah land surface model advances in the National Centers for Environmental Prediction operational mesoscale Eta Model. J. Geophys. Res. Atmos. 2003, 108, 8851. [Google Scholar] [CrossRef]
  49. Mahrt, L.; Ek, M. The influence of atmosphere stability on potential evaporation. J. Appl. Meteorol. Climatol. 1984, 23, 222–234. [Google Scholar] [CrossRef]
  50. Mahrt, L.; Pan, H. A two-layer model of soil hydrology. Bound.-Layer Meteorol. 1984, 29, 1–20. [Google Scholar] [CrossRef]
  51. Pan, H.L.; Mahrt, L. Interaction between soil hydrology and boundary-layer development. Bound. -Layer Meteorol. 1987, 38, 185–202. [Google Scholar] [CrossRef]
  52. Chen, J.L.; Wen, J.; Wang, X.; Zhang, T.T.; Jia, D.Y.; Zhou, J.; Wang, Z.L. Characteristics of water and heat exchanges and their crucial influencing factors on the alpine wetland during the warm season in the source region of the Yellow River. Chin. J. Atmos. Sci. 2017, 41, 302–312. (In Chinese) [Google Scholar]
  53. Chen, J.L.; Wen, J.; Tian, H.; Zhang, T.T.; Yang, X.Y.; Jia, D.Y.; Lai, X. A Study of Soil Thermal and Hydraulic Properties and Parameterizations for CLM in the SRYR. J. Geophys. Res. Atmos. 2018, 123, 8487–8499. [Google Scholar] [CrossRef]
  54. Cosby, B.J.; Hornberger, G.M.; Clapp, R.B.; Ginn, T.R. A statistical exploration of the relationships of soil moisture characteristics to the physical properties of soils. Water Resour. Res. 1984, 20, 682–690. [Google Scholar] [CrossRef]
  55. Xu, X.Z.; Wang, J.C.; Zhang, L.X. Physics of Frozen Soil, 2nd ed.; Science Press: Beijing, China, 2010; pp. 1–367. [Google Scholar]
  56. Jarvis, P.G.; Massheder, J.M.; Hale, S.E.; Moncrieff, J.B.; Rayment, M.; Scott, S.L. Seasonal variation of carbon dioxide, water vapor and energy exchanges of a boreal black spruce forest. J. Geophys. Res. Atmos. 1997, 102, 28953–28966. [Google Scholar] [CrossRef]
  57. Baldocchi, D.; Kelliher, F.M.; Black, T.A.; Jarvis, P. Climate and vegetation controls on boreal zone energy exchange. Glob. Change Biol. 2000, 6, 69–83. [Google Scholar] [CrossRef] [PubMed]
Figure 1. The geographic location and the Maduo Observatory of Climate and Environment of the North-west Institute of Eco-Environment and Resource, CAS.
Atmosphere 14 01802 g001
Figure 2. Variations of the relative control exercised by the solar radiation (a) and water vapor pressure deficit (b) over the latent heat flux with the solar radiation and water vapor pressure deficit from June to August 2014 in alpine wetlands (The black dots indicate the relative control over the latent heat flux and the red line indicates the trend line).
Atmosphere 14 01802 g002
Figure 3. Relationships of the relative control exercised by solar radiation and water vapor pressure deficit in the alpine wetlands from June to August 2014 (The black dots indicate the relative control over the latent heat flux).
Atmosphere 14 01802 g003
Figure 4. Two consecutive days of diurnal comparison between simulation results and observation data of sensible heat flux, latent heat flux and net radiation in alpine wetlands over the Yellow River source region from 17–18 August 2014.
Atmosphere 14 01802 g004
Figure 5. Comparison of the average diurnal variation between simulation results and observation data of latent heat flux in alpine wetlands over the source region of the Yellow River in summer 2014.
Atmosphere 14 01802 g005
Figure 6. Regional distribution of energy flux in alpine wetlands over the source region of the Yellow River (above: latent heat flux; below: sensible heat flux; unit: W·m−2).
Atmosphere 14 01802 g006
Figure 7. The average diurnal variation of latent heat flux in Ocase, Rscase and Dcase.
Atmosphere 14 01802 g007
Figure 8. Regional distribution characteristics of the difference values of latent heat fluxes based on the 3 cases in the underlying surface of alpine wetlands (above: Rscase–Ocase; below: Dcase–Ocase; unit: W·m−2).
Atmosphere 14 01802 g008
Table 1. The grid parameter settings of the simulation area.
DomainCenter Coordinates/(°E, °N)Grid PointsHorizontal Spacing/KmTime Step/s
135.0, 99.041 × 2527162
235.0, 99.0280 × 136318
Table 2. Model physical parameterization scheme configuration.
Physical Parameterization SchemeWRFWRF+
Longwave RadiationRRTMRRTM
Shortwave RadiationMM5 MM5
MicrophysicsWSM3WSM3
Surface LayeMM5MM5
Planetary Boundary LayerYSUYSU
Land SurfaceNoah Modified Noah
Table 3. The WRF and WRF+ model statistics against the observation data.
WRFWRF+
R2RMSD
(W·m−2)
MAE
(W·m−2)
R2RMSD
(W·m−2)
MAE
(W·m−2)
Latent heat flux0.69 58.0635.580.75 49.94 30.65
Sensible heat flux0.8079.4150.120.8162.2039.27
Net radiation0.88122.1078.180.89115.8474.07
Disclaimer/Publisher’s Note: The statements, opinions and data contained in all publications are solely those of the individual author(s) and contributor(s) and not of MDPI and/or the editor(s). MDPI and/or the editor(s) disclaim responsibility for any injury to people or property resulting from any ideas, methods, instructions or products referred to in the content.

