Abstract
The Photovoltaic Geographical Information System (PVGIS) is a web application that provides free access to solar radiation and temperature data, typical meteorological year (TMY) data, and to photovoltaic performance assessment tools for any place in most parts of the world. The PVGIS was originally developed over 20 years ago, and since then, it has been under continuous development. At present, there are two versions of the PVGIS online—the older version 5.1 and the newest version 5.2. PVGIS 5.2 includes substantial improvements compared to the previous version, e.g., the update of the underlying data sets both in terms of quality, resolution, and geographical coverage and the extension of the time period used. This paper focuses on comparing the TMYs (and more specifically the TMY time series of air temperature), coming from both PVGIS 5.1 and 5.2, with the TMY produced on the basis of ground station meteorological data and with the ground station data itself. The results show that whereas overall the errors and biases for most locations are within the expected range (mean stationRMSE 4.27), these differences increase in places with complicated topography, e.g., in the Alps (maximum stationRMSE 9.50).
1. Introduction
Meteorological data are essential for calculating the energy performance of buildings [1,2,3] or for estimating the photovoltaic system energy production [4,5,6]. Some of the necessary elements (e.g., temperature, air pressure, or wind speed) are measured at a large number of stations, but the others are not (e.g., solar radiation). There are also large areas of the world where data coverage is very sparse.
In order to deal with the lack of data, a typical meteorological year (TMY) is often used. A TMY is a collation of weather data (temperature; air humidity; wind speed and direction; global, direct, and diffuse radiation), most frequently presented as hourly values, describing the characteristics of the yearly weather pattern of a given location [7]. Among many statistical methods that allow for the calculation of the values of meteorological elements for the TMY, the most known in the American literature is the TMY method [8] and its last modified version—the TMY3 method [9]. This method is one of the most commonly adopted approaches when developing TMY weather files [4,7,10,11]. Another American method is the WYEC (Weather Year for Energy Calculation) [12]. In Europe, the TRY (Test Reference Year), also known as the Danish method, is sometimes used [13]. But the most commonly used TMY in Europe is the one established by the International Organization for Standardization (ISO). It was approved by the CEN (Comité européen de normalisation, European Committee for Standardization) as the EN ISO 15927-4 standard. It specifies a method for constructing a reference year of appropriate meteorological data suitable for assessing the average annual energy for buildings’ heating and cooling [14]. The TMY prepared on the basis of the EN ISO 15927-4 standard is widely used in research in Europe and worldwide [2,15,16,17,18].
The Photovoltaic Geographical Information System (PVGIS) is a web application that provides free and open web access to solar radiation and temperature data and to photovoltaic performance assessment tools for any place in most parts of the world (https://joint-research-centre.ec.europa.eu/pvgis-online-tool_en, accessed on 1 March 2023). Developed by the Joint Research Centre of the European Commission, the PVGIS allows citizens to obtain data on solar radiation and photovoltaic system energy production generated for most locations worldwide (except the poles). One of the products provided by the PVGIS is a tool to generate typical meteorological year (TMY) data of solar radiation, temperature, and other meteorological elements, used in many fields, for instance in the calculation of the energy performance of buildings. The TMY is prepared on the basis of the EN ISO 15927-4 standard.
The PVGIS was originally developed over 20 years ago, and since then, it has been under continuous development. At present, there are two versions of the PVGIS online—the older version 5.1 and the newest version 5.2. PVGIS 5.1 has already been described in detail by Huld et al. [19]. In turn, PVGIS 5.2 includes substantial improvements compared to the previous version 5.1: firstly, the update of the underlying data sets in terms of quality, resolution, and geographical coverage and, secondly, the extension of the time period used. While PVGIS 5.1 covers the time period from 2005 to 2016, the updated PVGIS 5.2 data set includes data from 2005 to 2020. Table 1 provides further details.

Table 1.
Data sources in PVGIS 5.1 and PVGIS 5.2.
All this causes the need to compare the two versions of the PVGIS, in order to assess the differences in the results obtained with PVGIS 5.2 and the previous version 5.1. This paper focuses on comparing the TMYs and, more specifically, the TMY time series of air temperature. Therefore, the TMYs coming from PVGIS 5.2 and 5.1 were compared with the TMY produced on the basis of ground station meteorological data and with the ground station data itself.
2. Materials and Methods
2.1. Data Sources and Preparation
2.1.1. Ground Station Meteorological Data
The ground station data used for this study were downloaded from the NOAA Integrated Surface Database (ISD-Lite) archive [20,21]. This database contains hourly values of 8 observational elements, which come from the SYNOP reports from all the available stations around the world. For the purpose of this study, all the European stations’ data in the time period 2005–2020 were downloaded. The ISD-Lite data contain the following quantities: air temperature at 2 m above ground (T), dewpoint temperature at 2 m above ground (Td), wind speed at 10 m (WS), wind direction (WD), and sea level pressure (SLP).
The ISD-Lite database contains a very large number of meteorological stations, but many of them have large gaps in the time series, making them unsuitable for further analyses. So, the first step in the selection of ground stations was to require no more than 4% of data gaps in the time series of T, Td, WS, and WD in the time period 2005–2020. SLP, being a variable with limited influence on the energy efficiency of buildings, was allowed to have more data gaps (even up to 100% of gaps, i.e., no data). Following these selection criteria, 433 stations were initially retained.
In the next step, the gap filling procedure was performed. In order to produce a complete data set, periods with missing data were filled by linear interpolation between the last hour before the gap to the first hour after the gap.
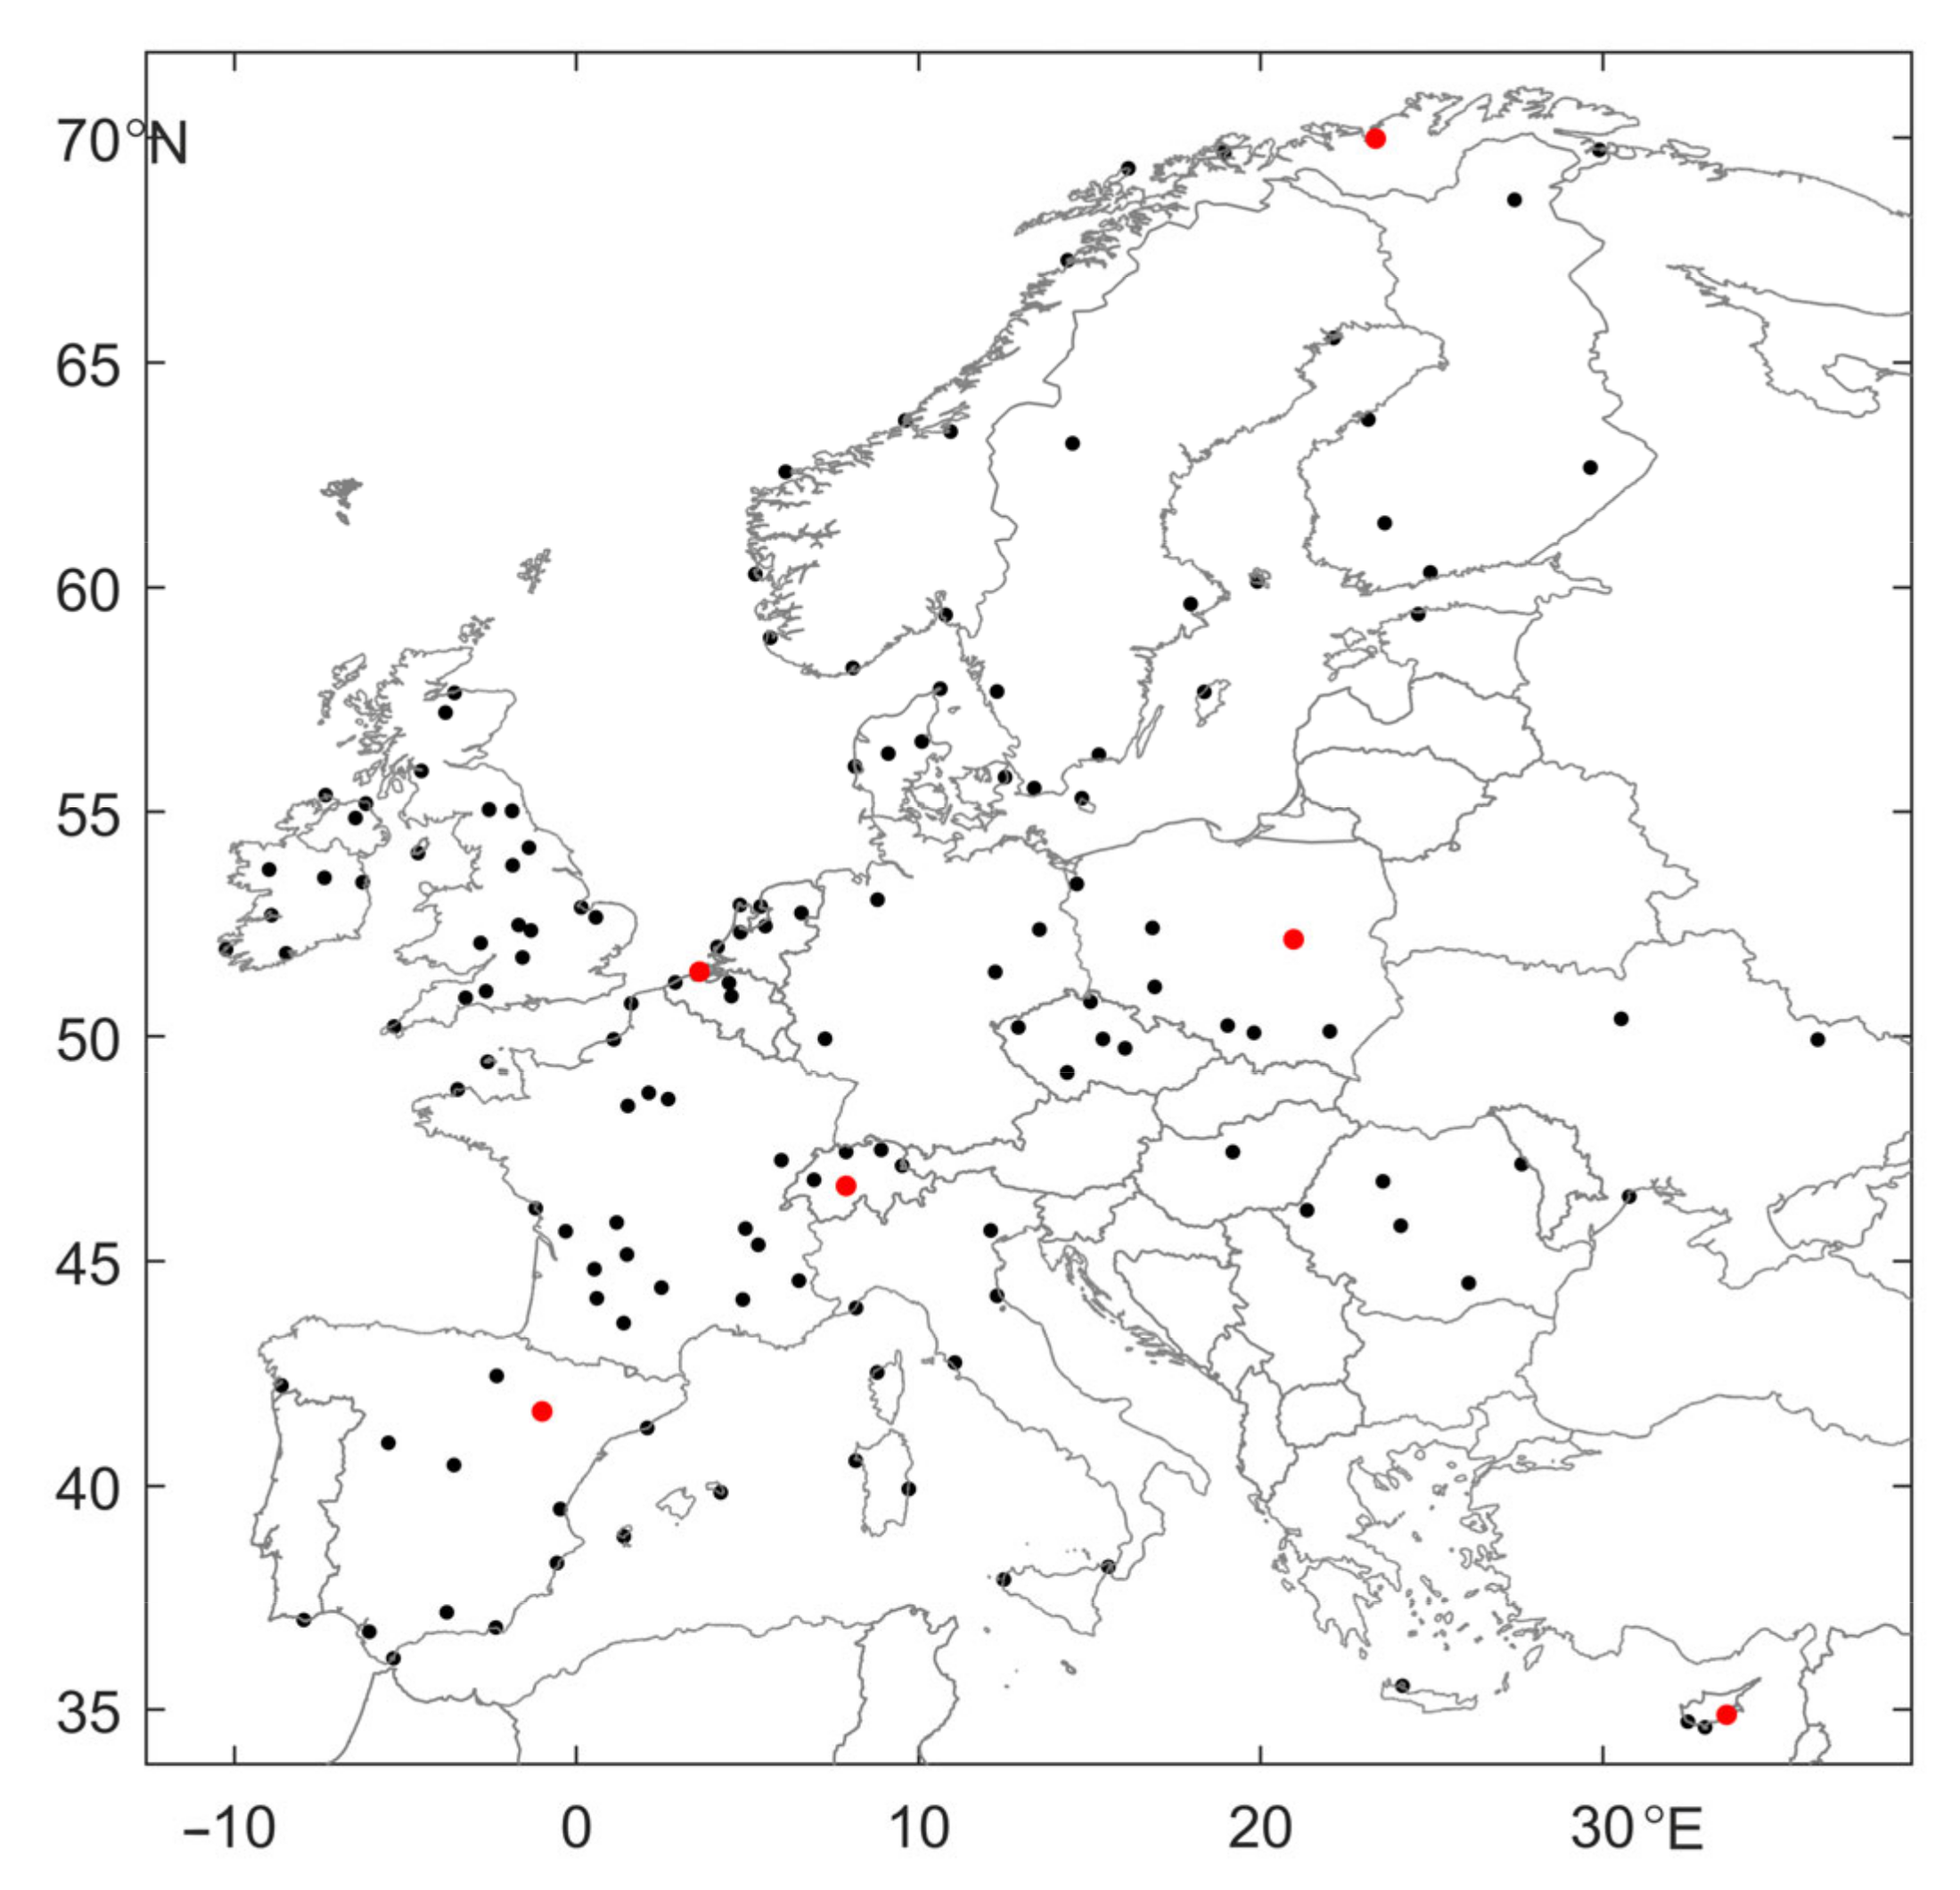
The 433 stations, initially retained from the ISD-Lite database, were not evenly distributed in space. Some countries in Europe were highly represented (e.g., 115 stations in the United Kingdom, 63 stations in Switzerland), while others had only a few stations (e.g., 8 stations in Italy, 9 stations in Sweden). So, in the last step, a subset of 147 stations out of the initial 433 stations was selected. The aim of this subsetting was to provide a balance in the spatial distribution of the ground stations in Europe. The location of the stations used in this study is shown in Figure 1.
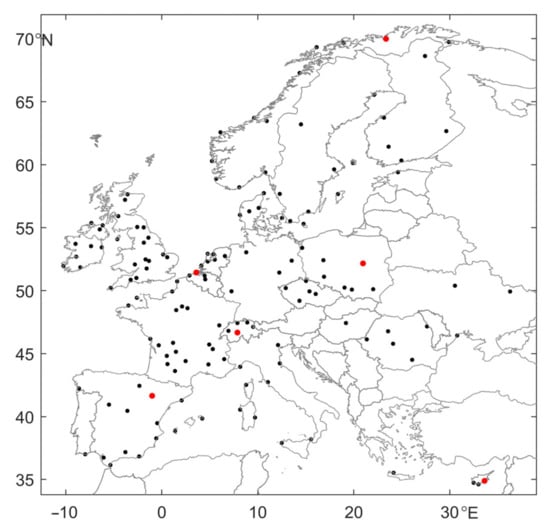
Figure 1.
Location of the stations used in this study. Red circles indicate individual stations showcased in detail in this study: Alta (Norway), Vlissingen (Netherlands), Warsaw (Poland), Interlaken (Switzerland), Zaragoza (Spain), and Larnaca (Cyprus).
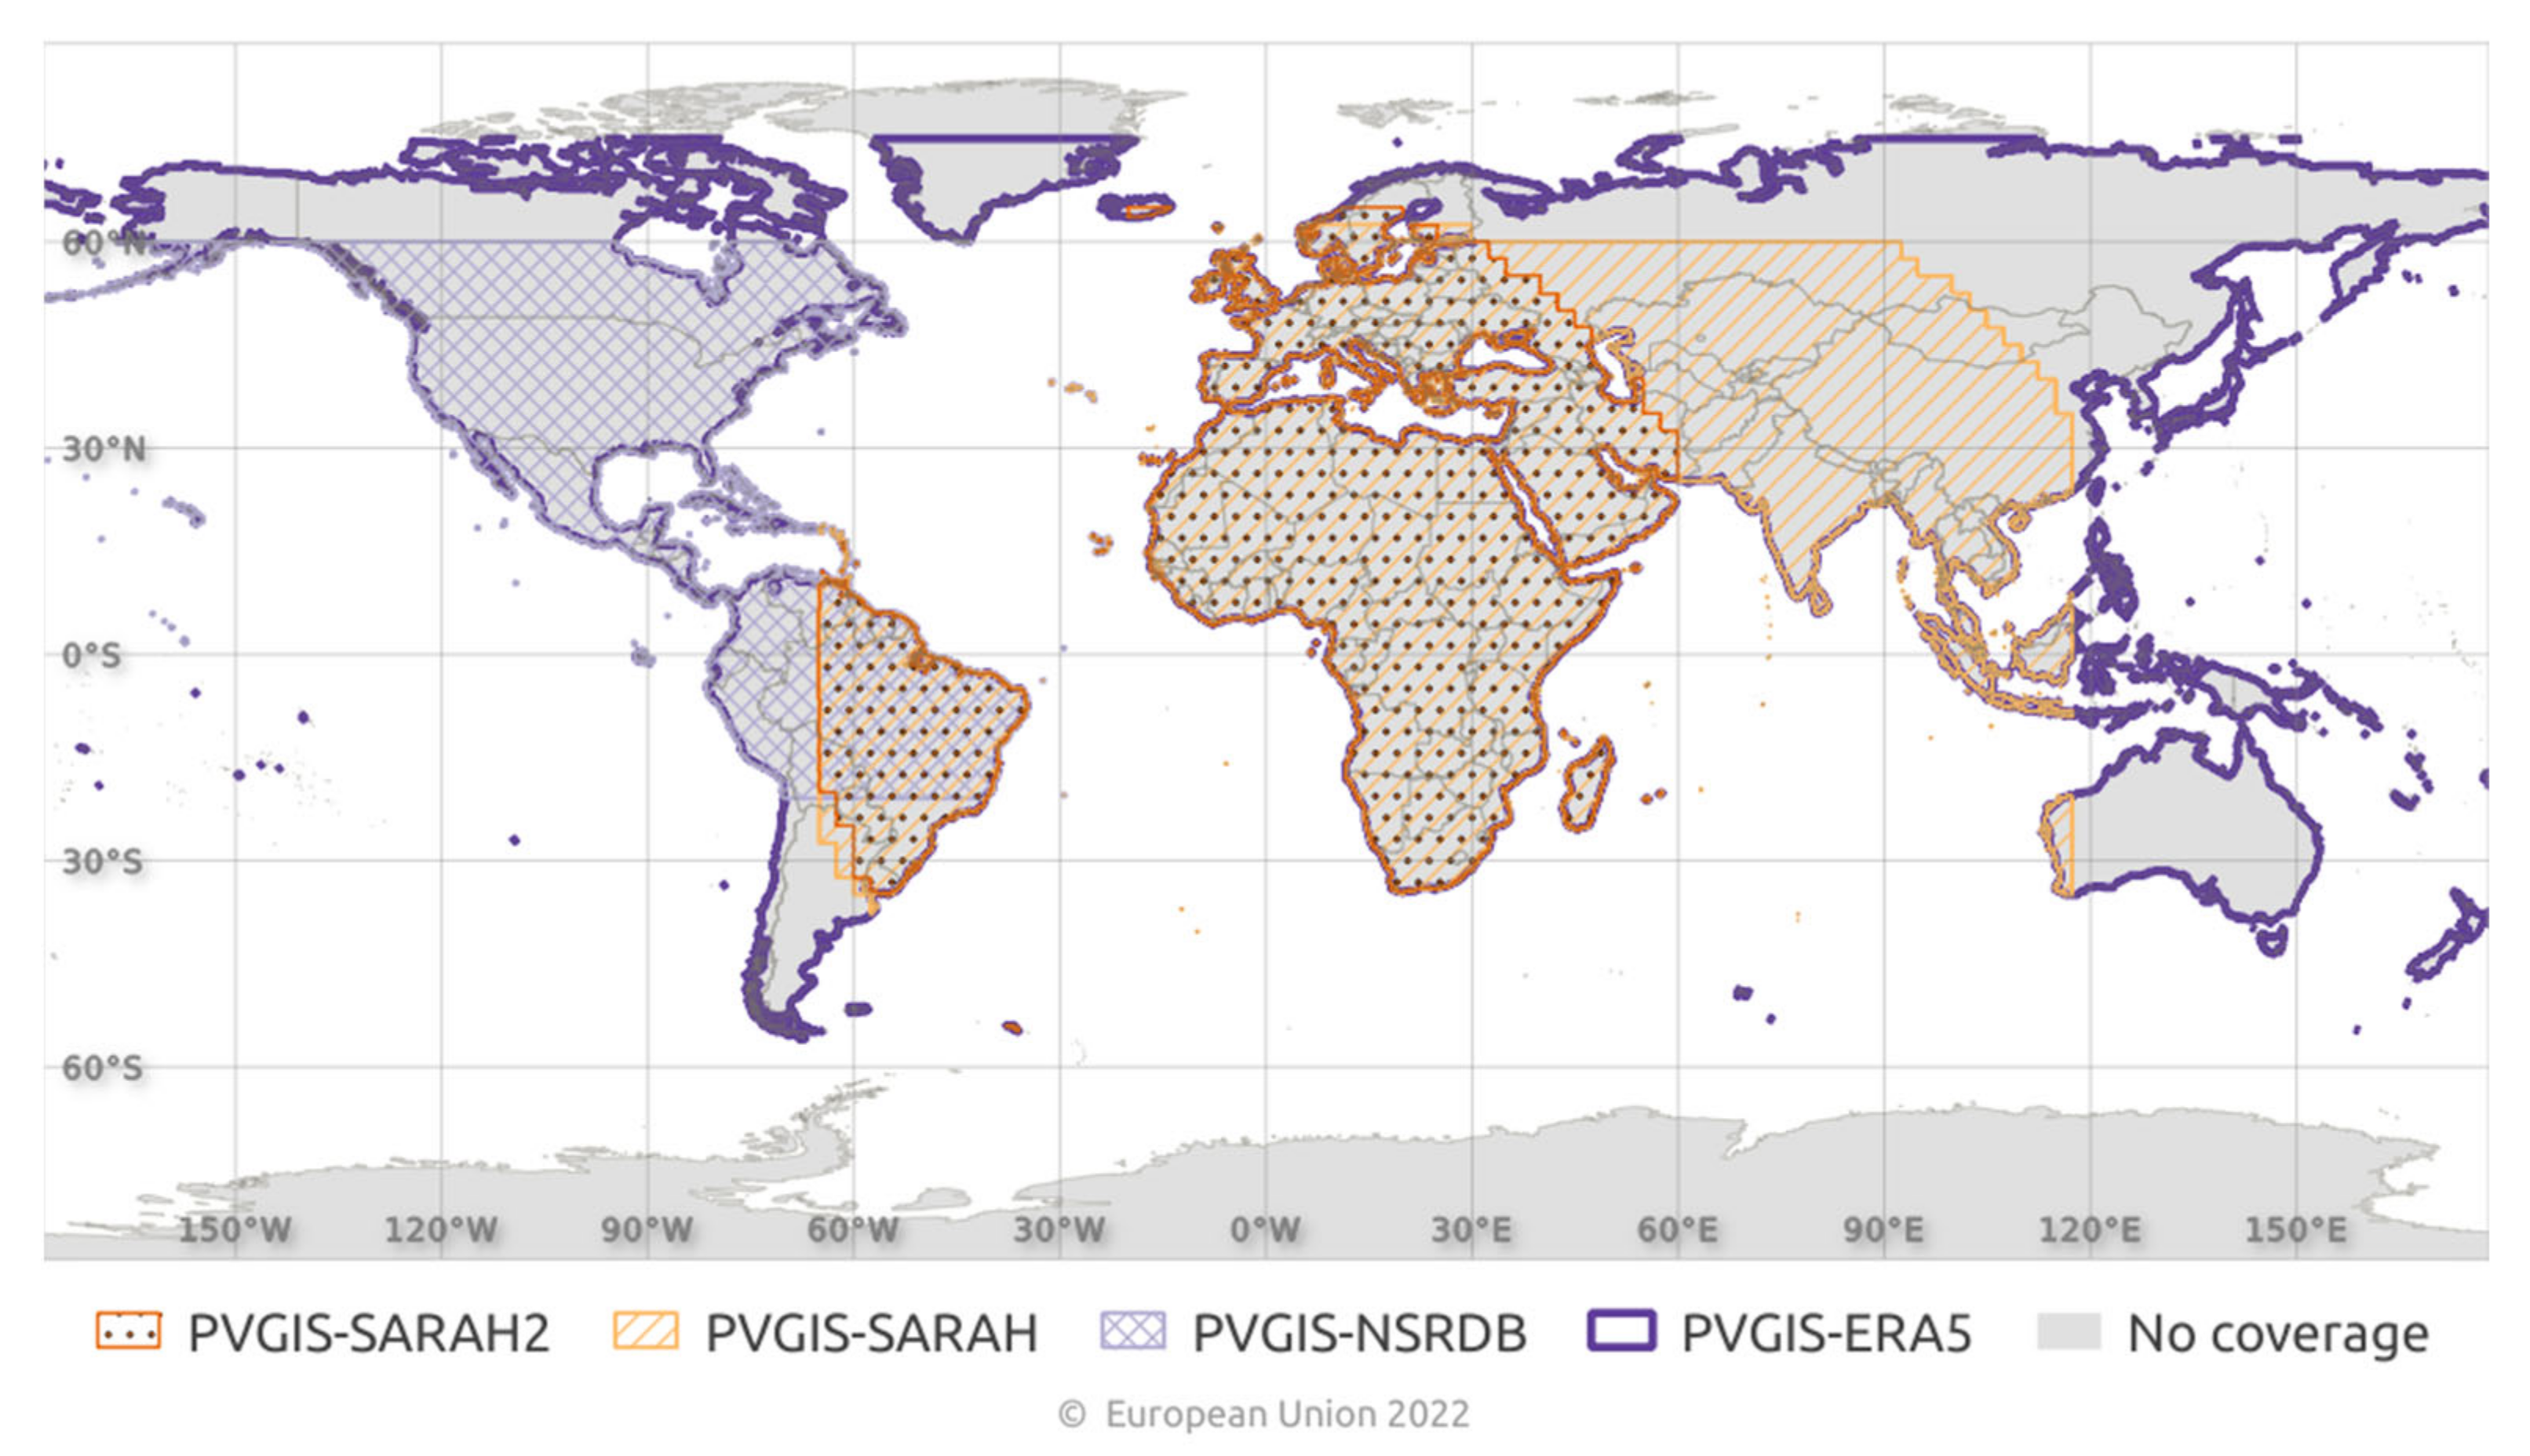
Solar radiation is recorded at a limited number of ground stations. Thus, instead of using global horizontal irradiance (GHI) measured at the ground stations, the time series of GHI for all 147 stations were derived from reanalysis or satellite products. Hourly values of GHI for most station locations were derived from the Surface Incoming Shortwave (SIS) radiation product from the Surface Solar Radiation Data Set—Heliosat, Edition 2 (SARAH-2) [22,23]. The data series was originally published by EUMETSAT’s Satellite Application Facility for Climate Modelling (CM SAF) and processed by Deutscher Wetterdienst (DWD). SARAH-2 was validated against ground station data by Gracia et al. [24]. In places where SARAH-2 has no coverage (mostly areas above the 65° N latitude), the GHI from ERA5 reanalysis [25] was used as a replacement. The coverage of solar radiation databases in PVGIS is shown in Figure 2. As the SARAH-2 and ERA5 databases are available through the PVGIS Online Tool (https://joint-research-centre.ec.europa.eu/pvgis-online-tool_en, accessed on 1 March 2023), the GHI data were downloaded directly from the PVGIS API service.

Figure 2.
Coverage of solar radiation databases (source: own elaboration for the release of PVGIS 5.2).
2.1.2. PVGIS 5.1 TMY
In the PVGIS version 5.1, the time period, based on which the TMY is produced, is 2005–2016 (12 years), and the following data sources are used:
- For the meteorological elements T, Td, and WS: ERA-Interim reanalysis with a spatial resolution of 81 × 81 km [26,27]. Temperature data here are downscaled to a resolution of 90 m based on elevation and operational forecast data [28]. The temporal resolution of the time series coming from ERA-Interim is 3 h. PVGIS further interpolates this to a temporal frequency of 1 h;
- For the GHI: SARAH-1 [29]. In places where SARAH-1 has no coverage (mostly areas above the 65° N latitude), the GHI from ERA5 reanalysis is used as a replacement.
The PVGIS 5.1 TMY was derived directly from the PVGIS API service for 147 station locations.
2.1.3. PVGIS 5.2 TMY
In the PVGIS version 5.2, the default time period, based on which the TMY is produced, is 2005–2020 (16 years), but it can be changed according to the user’s choice. Thus, to keep consistency with the PVGIS 5.1 TMY, the PVGIS 5.2 TMY was produced based on the same 12-year time period, 2005–2016. In version 5.2, the following data sources are used:
- For the meteorological elements T, Td, and WS: ERA5-Land reanalysis with a spatial resolution of 9 × 9 km [30]. In places where ERA5-Land has no coverage (some coastal areas where pixels have a high percentage of sea area), ERA5 reanalysis data (interpolated to the same resolution as ERA5-Land) is used as a replacement (Description of known issue regarding temperature data on the coastlines of PVGIS 5.2: https://joint-research-centre.ec.europa.eu/photovoltaic-geographical-information-system-pvgis/pvgis-releases/pvgis-52_en (accessed on 30 October 2023)). Both time series coming from ERA5 and ERA5-Land have a temporal resolution of 1 h;
- For the GHI: SARAH-2. In places where SARAH-2 has no coverage (mostly areas above the 65° N latitude), the GHI from ERA5 reanalysis is used as a replacement.
The PVGIS 5.2 TMY was also derived directly from the PVGIS API service for 147 station locations.
2.1.4. TMY on the Basis of Ground Station Data
For the purpose of this study, the TMY on the basis of ground station data and following the ISO 15927-4 procedure was prepared for each of the 147 station locations. The TMY was produced based on the same 12-year time period, 2005–2016, and the following data sources were used:
- For the meteorological elements T, Td, and WS: ground station meteorological data, derived from the ISD-Lite database;
- For the GHI: SARAH-2. In places where SARAH-2 has no coverage (mostly areas above the 65° N latitude), the GHI from ERA5 reanalysis was used as a replacement.
2.2. Comparative Data Sets
The purpose of this study is to compare the reanalysis-based TMYs (coming from PVGIS 5.1 and PVGIS 5.2) with the TMY generated with the ground station data, by following the ISO 15927-4 procedure. However, the generation of the TMY may itself cause a deviation from the results one would obtain when using the full multi-annual data set. For this reason, the comparison is made between four different data sets:
- GS: Ground station data (hourly values) from the 12-year time period (2005–2016). The meteorological elements—T, Td, and WS—come from ground station meteorological data, while GHI comes from SARAH-2 or ERA5 (in areas above the 65° N latitude);
- TMY-GS: TMY (hourly values) generated on the basis of ground station data from the 12-year time period (2005–2016), following the ISO 15927-4 procedure;
- TMY-51: TMY (hourly values) from PVGIS 5.1, generated from the 12-year time period (2005–2016);
- TMY-52: TMY (hourly values) from PVGIS 5.2, generated from the 12-year time period (2005–2016).
It is important to remember that the GHI input data are very similar in all of the data sets—originating either from the SARAH-1 (TMY-51) or SARAH-2 (GS, TMY-GS, and TMY-52) database. The full multi-annual ground station data set (the first data set in the list above) was taken as a reference, and the results using the other data sets were compared to this. Additionally, the TMY-52 was compared to the TMY-51. Eventually, the comparisons were performed for the following pairs of data sets:
- TMY-GS (tested data) against GS (reference data);
- TMY-51 (tested data) against GS (reference data);
- TMY-52 (tested data) against GS (reference data);
- TMY-52 (tested data) against TMY-51 (reference data).
2.3. Methods
In order to compare the above-mentioned pairs of data sets, several tests were adopted. Since the TMY is designed to provide data for calculations on the energy efficiency of buildings, it was assumed that temperature is the most important variable and should be compared in the first place. Moreover, temperature is the variable which experienced the biggest change in PVGIS 5.2 compared to the way it was provided in PVGIS 5.1. Therefore, some tests are based on Mean Bias and Root Mean Square Error, while others are based on heating degree days and cooling degree days.
2.3.1. Comparisons Based on Mean Bias and Root Mean Square Error
In order to compare the time series of T, originating either from hourly ground station measurements or individual TMYs, four data sets of the same length were prepared. To this end, a 12-year time series of TMYs was produced (by replicating each TMY data set 12 times) to match the 12-year time series of ground station data (2005–2016). Since 29th February is not included in the TMY data set, it was also excluded from the ground station data. In the next step, the daily average values of T were calculated. Finally, for each station, a Mean Bias (MB) and a Root Mean Square Error (RMSE) were calculated from a pair of tested and reference data sets of average daily values, according to the following formulas (Equations (1) and (2)):
where Ttest,i is the average value of T on the i-th day from the tested data set, Tref,i is the average value of T on the i-th day from the reference data set, and n is the number of days in the period 2005–2016 (4380 days in total).
To obtain the aggregated quantitative information about the performance of the tested data set, a mean value of stationRMSE was calculated as follows (Equation (3)):
where stationRMSEs is the stationRMSE at s-th station, and Ns is the number of stations (147 stations in total).
The statistical distributions of daily average T values coming from tested and reference data sets can be statistically tested to see if they come from the same population. In other words, it can be checked whether the differences between the two distributions are statistically significant. The distributions of values in the two (tested and reference) data sets were tested with a nonparametric Kolmogorov–Smirnov test, with the significance level α = 0.05. The test checks the null hypothesis that the tested and reference data sets are from the same continuous distribution. In such a case, the differences between data sets are statistically insignificant, meaning that these data sets can be used interchangeably. Otherwise, the differences are too big to conclude that the tested data can replace the reference data well.
2.3.2. Comparisons Based on Heating Degree Days and Cooling Degree Days
Heating degree days (HDDs) and cooling degree days (CDDs) are the measures of how much heating or cooling will be necessary over a time period consisting of many days. In this study, the following definitions of HDDs and CDDs, used by EUROSTAT [31], were adopted:
HDDd are calculated for a given day with daily average T as (Equation (4)):
The total HDDs for a given period are then calculated by summing HDDd of the individual days (Equation (5)):
where N is the number of days.
CDDd are calculated for a given day with daily average T as (Equation (6)):
The total CDDs for a given period are then calculated.
In this study, the HDDs and CDDs were calculated per year (an average of yearly values for the full multi-annual ground station data set and a single value for the TMY).
The following variables for HDDs (and CDDs, respectively) were adopted:
- HDDGS,i is the HDD for the i-th station using the full multi-annual ground station data set (GS);
- HDDTMY-GS,i is the HDD for the i-th station using TMY generated on the basis of the ground station data set (TMY-GS);
- HDDTMY-51,i is the HDD for the i-th station using the PVGIS 5.1 TMY data set (TMY-51);
- HDDTMY-52,i is the HDD for the i-th station using the PVGIS 5.2 TMY data set (TMY-52).
Finally, the Mean Bias (MB) and the Root Mean Square Error (RMSE) of the HDDs and CDDs were calculated using the following formulas (Equations (7) and (8)):
where HDDtest,i is the tested data set, HDDref,i is the reference data set, and Ns is the number of stations (147 stations in total). The comparisons using MB and RMSE were performed for the same pairs of data sets (described above).
3. Results
3.1. Comparisons Based on MB and RMSE for Daily Average T
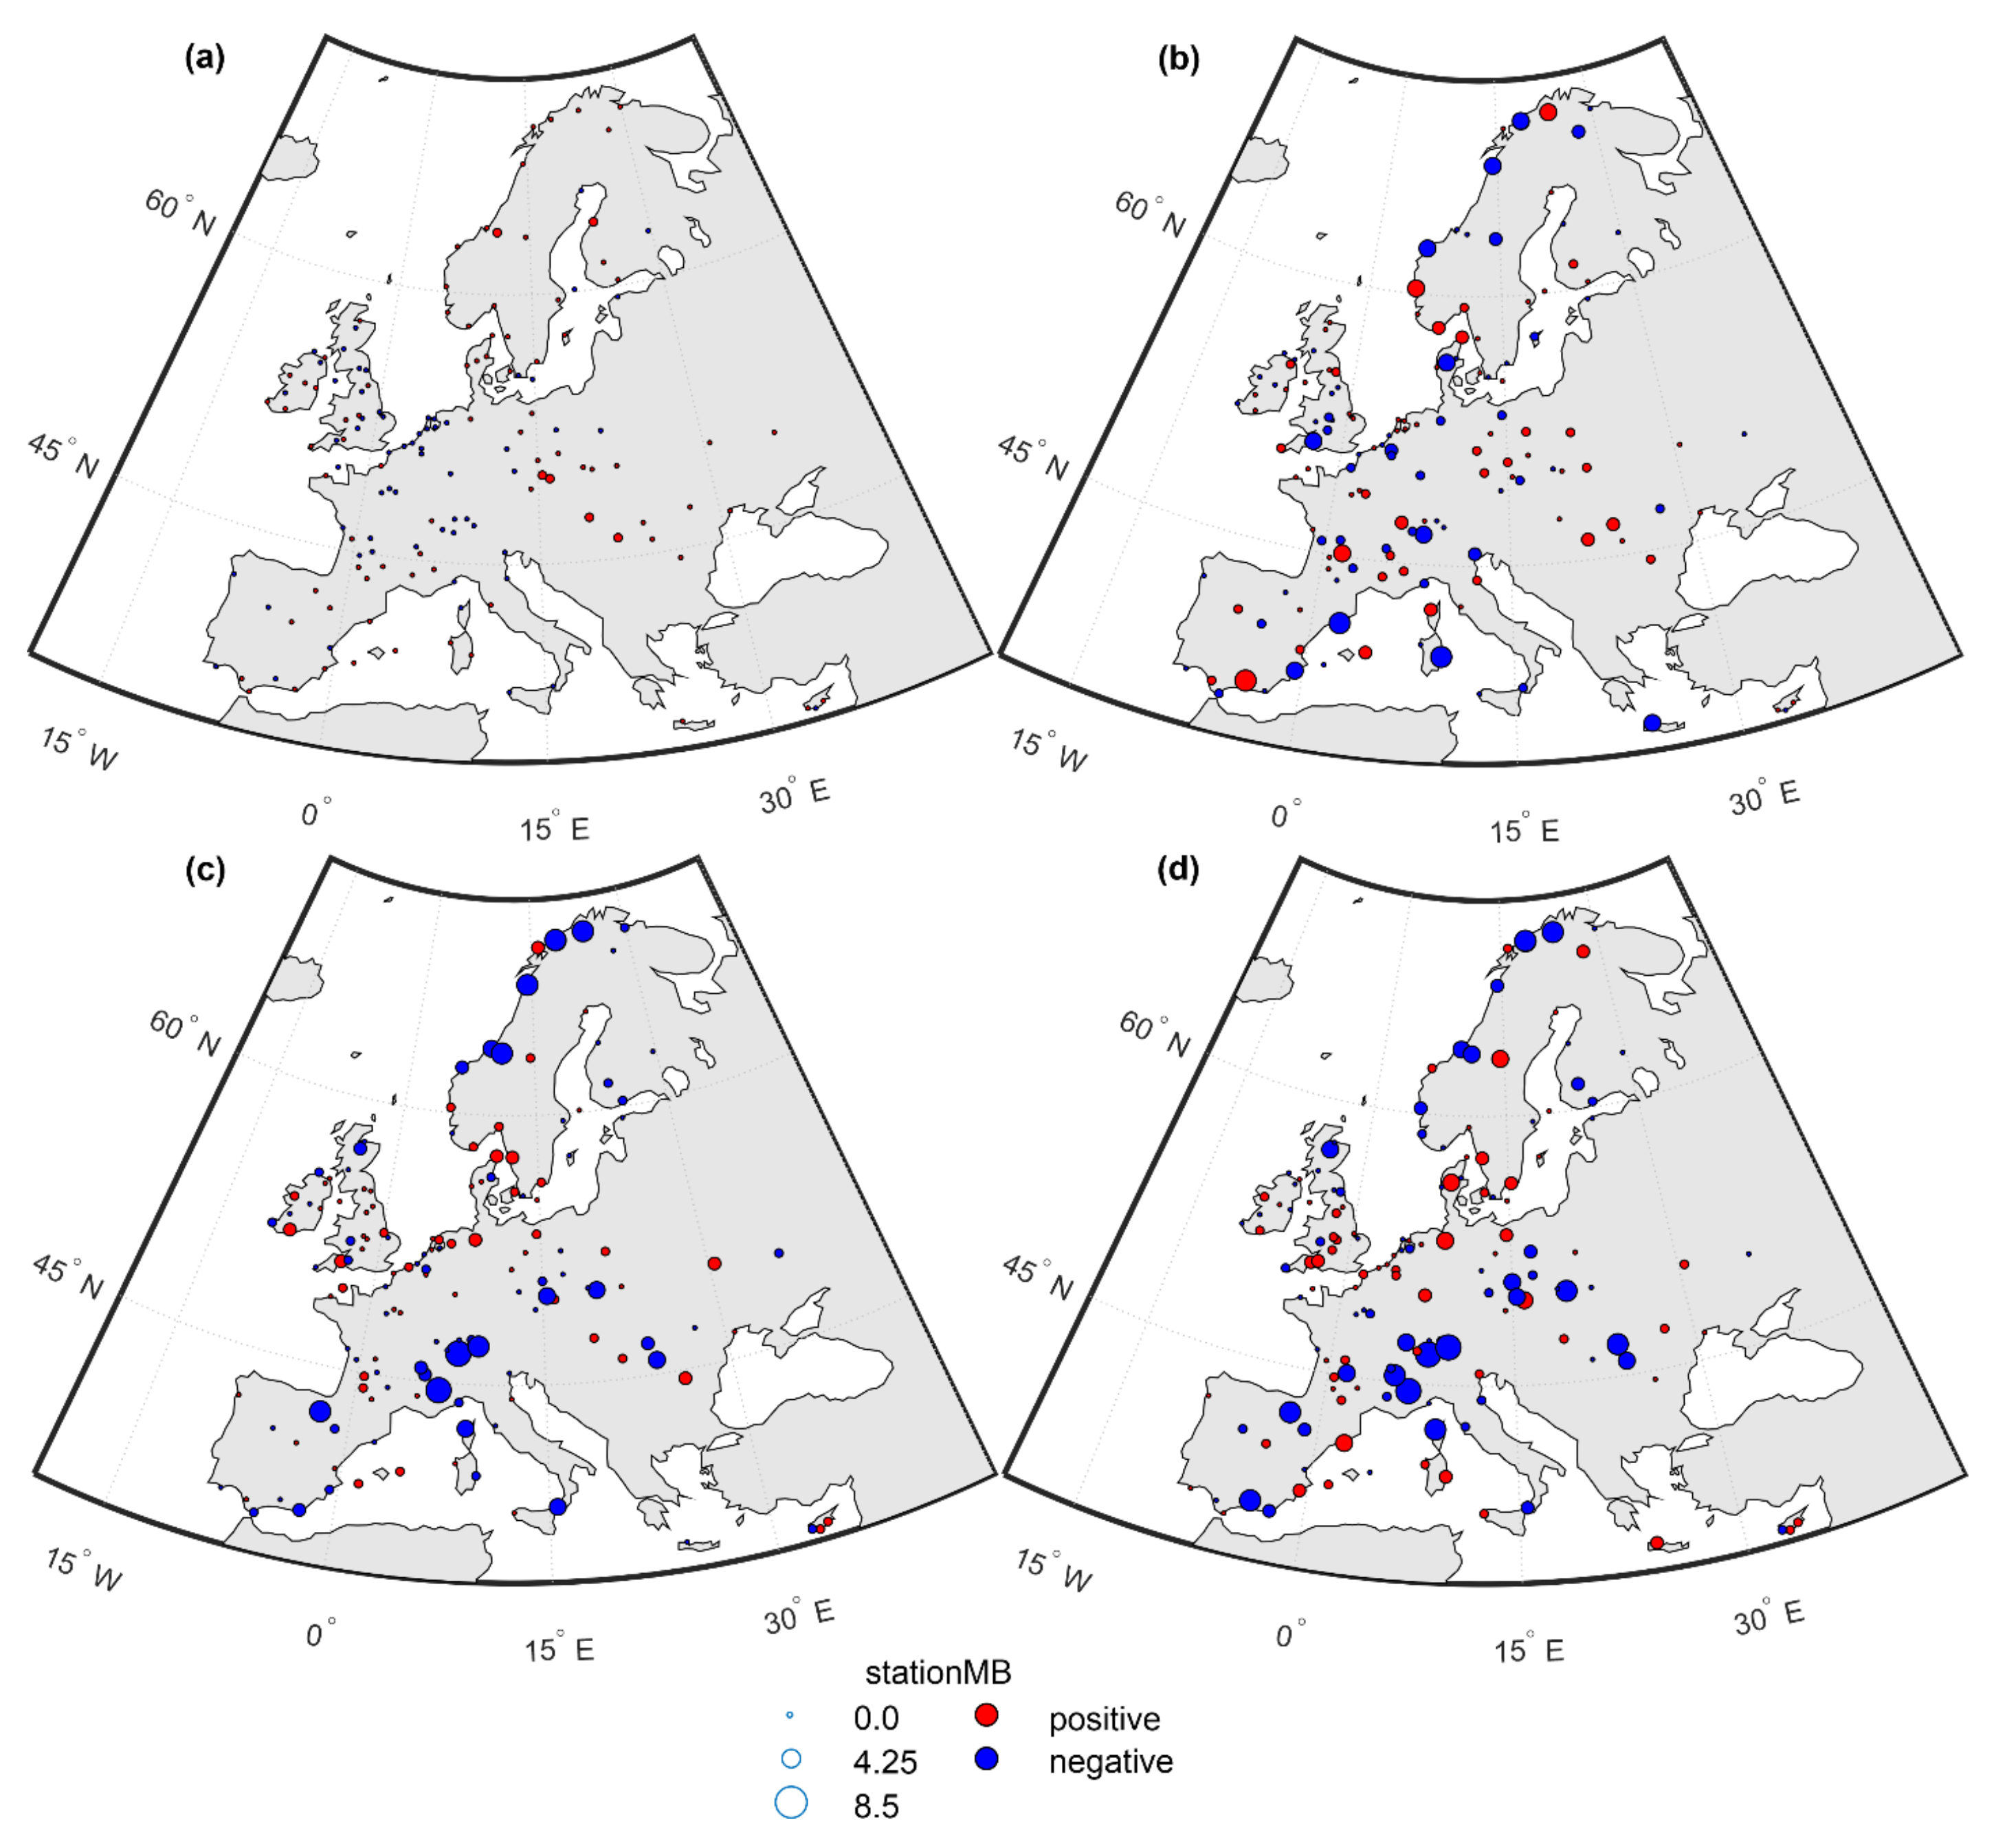
Comparisons based on the time series of daily average T give small values of stationMB and stationRMSE in absolute terms but substantial values in relative terms. The deviations between the tested and reference data sets expressed by the stationMB differ according to the pair of data sets being compared but generally vary between 0 and 8.5 °C (while the average temperature at the latitude 52° N is ca. 8.5 °C). The smallest deviations were observed for the TMY-GS vs. GS pair of data sets (Figure 3a). TMY-51 and TMY-52 show a similar number of positive and negative values of stationMB. Comparing the TMY-52 vs. GS pair of data sets to TMY-51 vs. GS pair of data sets, one can see that there are many locations where the stationMB decreased, e.g., in the coast of the Mediterranean Sea (Figure 3b,c). However, at the same time, there are many stations where the stationMB increased—these are mostly the stations located in the Alps or in other mountains and on the sea coast in Norway. The stationMB at these locations is mostly negative, meaning that TMY-52 tends to underestimate temperature values, that is, the output in PVGIS 5.2 assumes temperatures are colder than those registered in the ground stations at nearby locations.
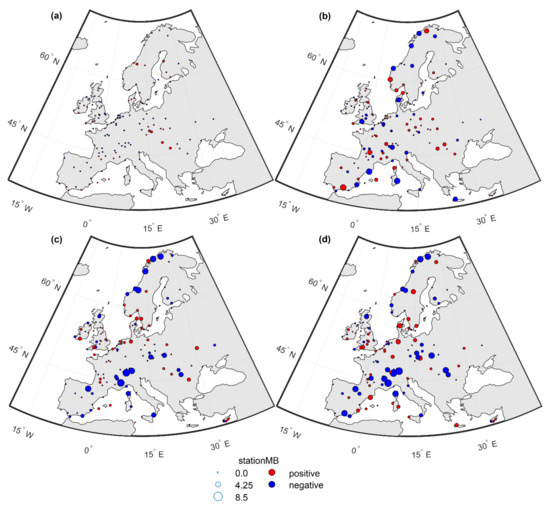
Figure 3.
StationMB for daily average values of T, on the basis of four comparisons: TMY-GS vs. GS (a), TMY-51 vs. GS (b), TMY-52 vs. GS (c), and TMY-52 vs. TMY-51 (d).
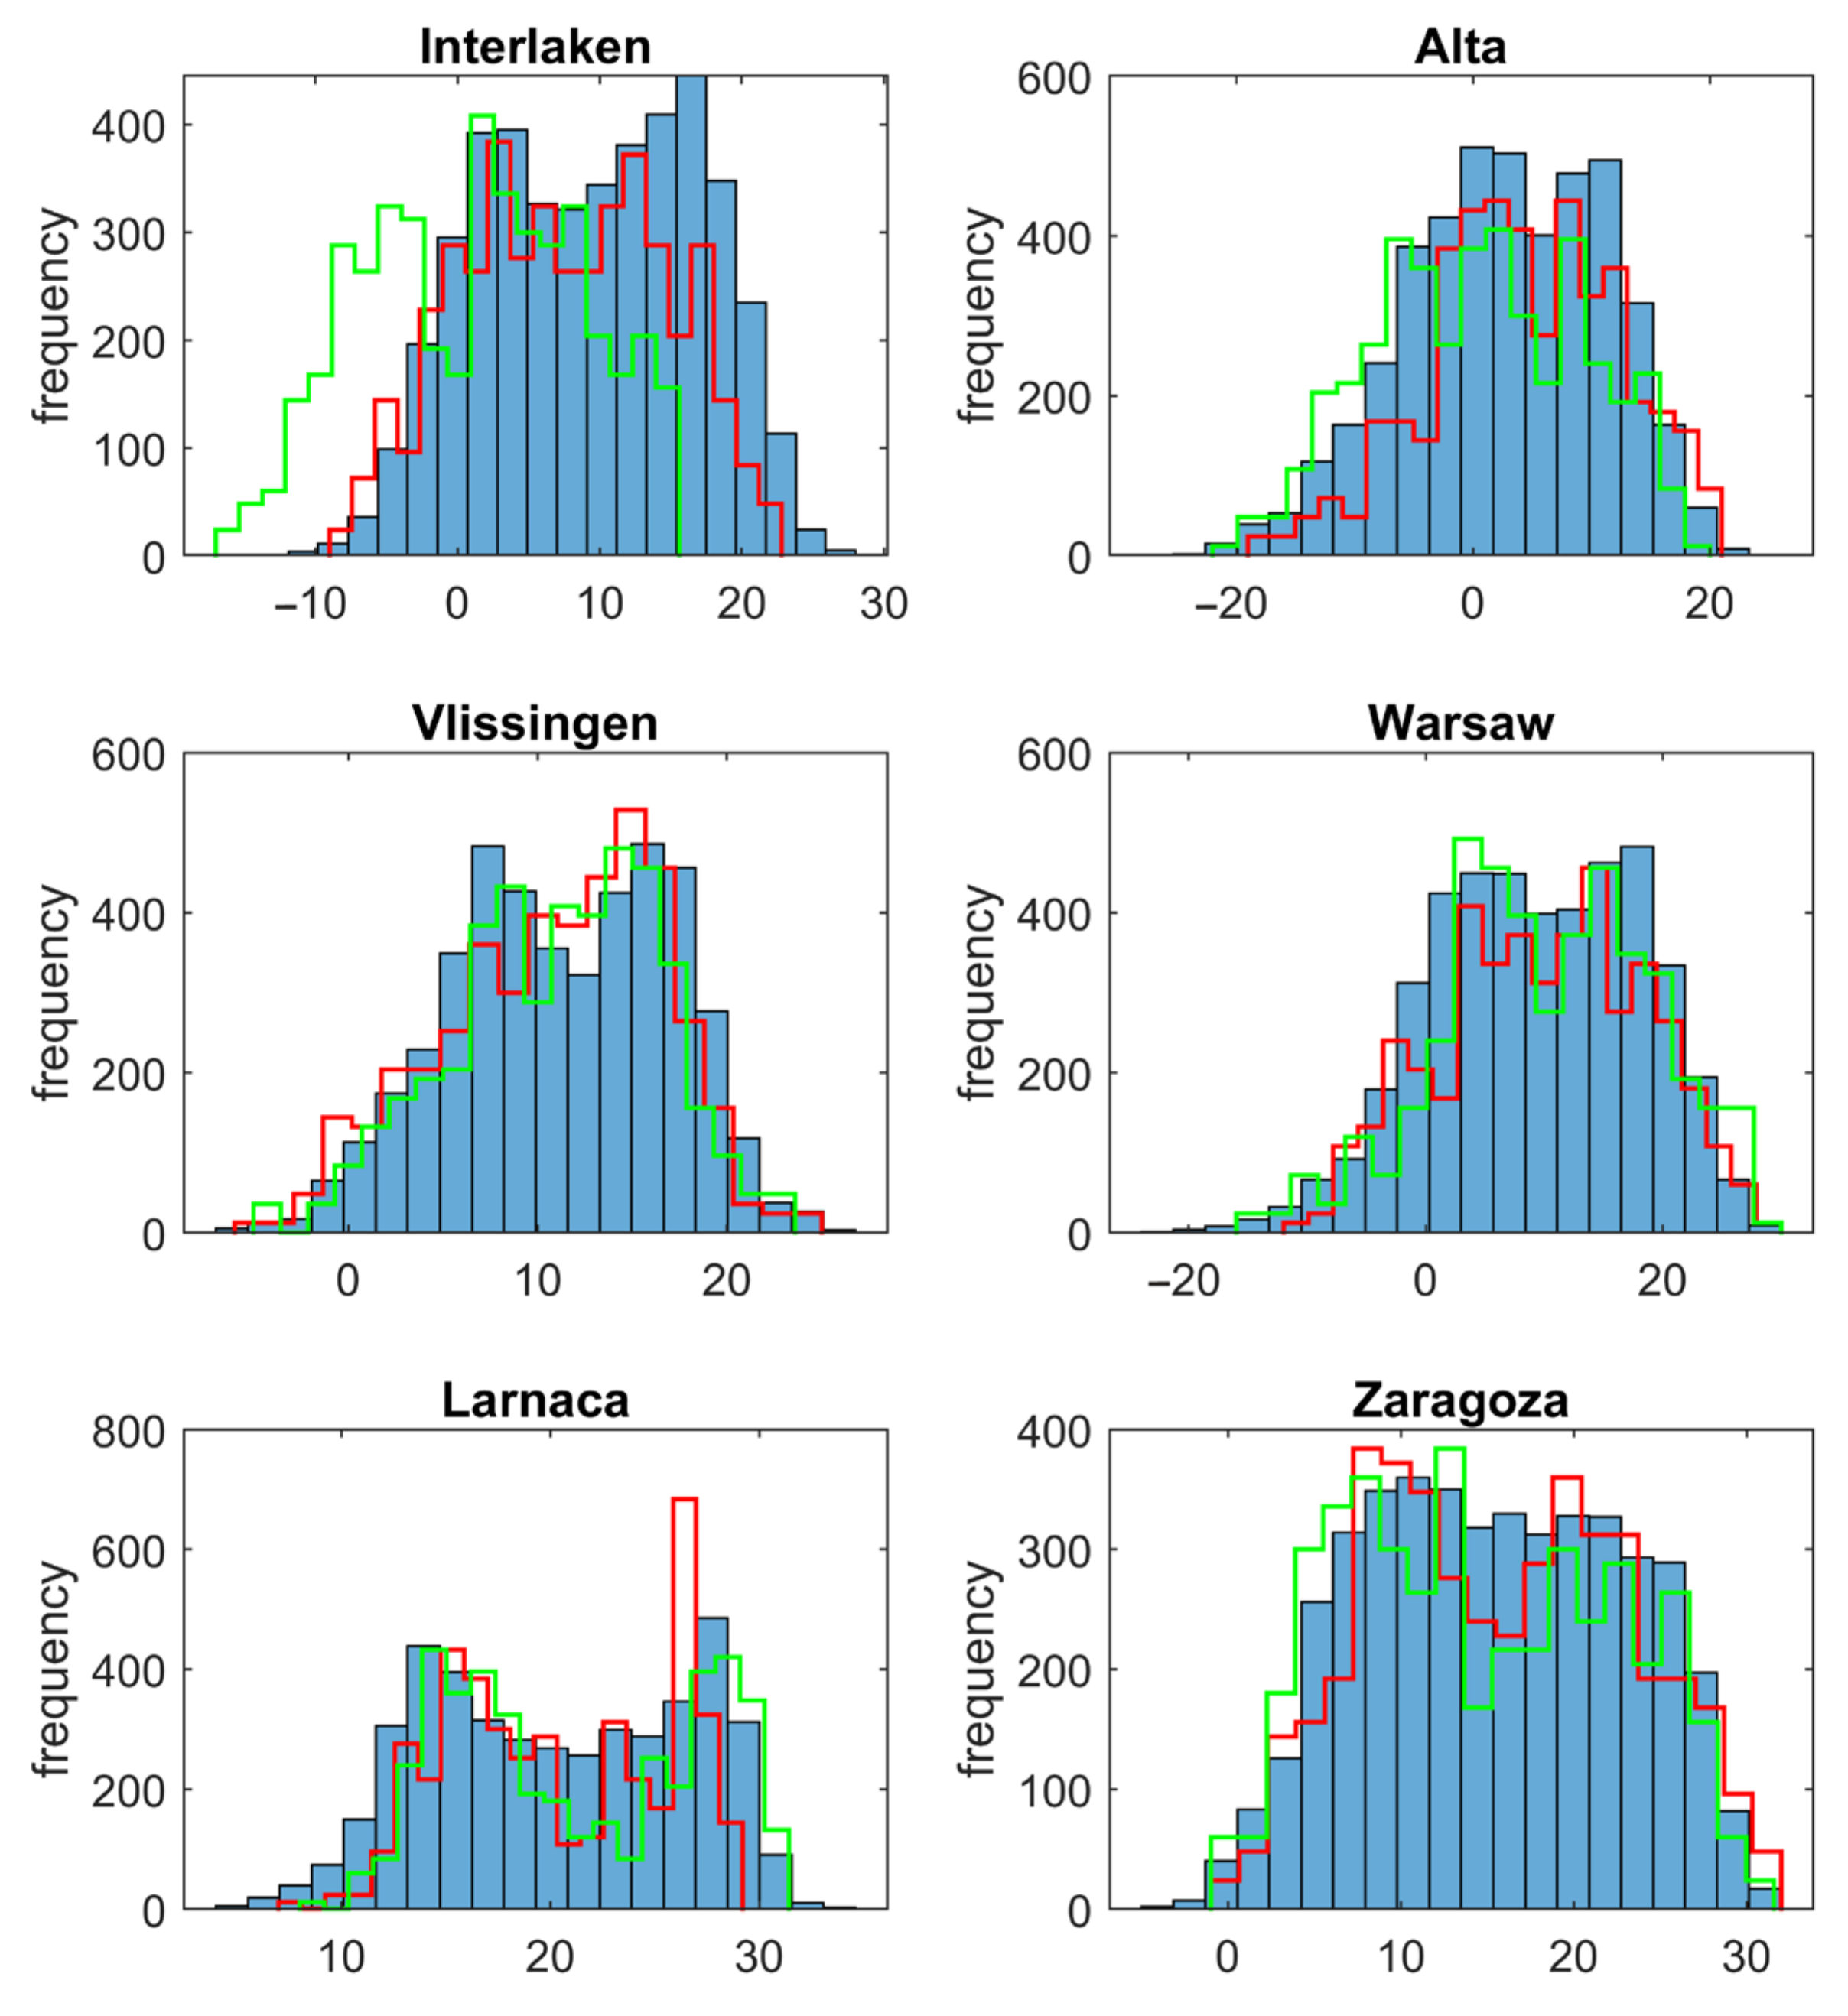
The underestimation of the temperature values in the TMY-52 (compared to GS) is also visible in Figure 4. Here, the low temperature values are overrepresented on the TMY-52 histogram (in comparison to the histograms of TMY-51 and GS). This is mostly visible in places with complicated topography—in Interlaken in Switzerland and (to some extent) in Alta in Norway (Figure 4).
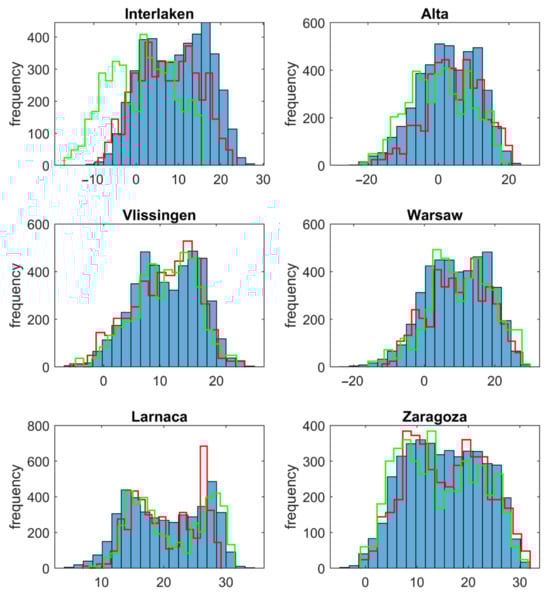
Figure 4.
Histograms of daily average values of T (°C) on the basis of three data sets: GS (blue bars), TMY-51 (red lines), and TMY-52 (green lines), at individual stations.
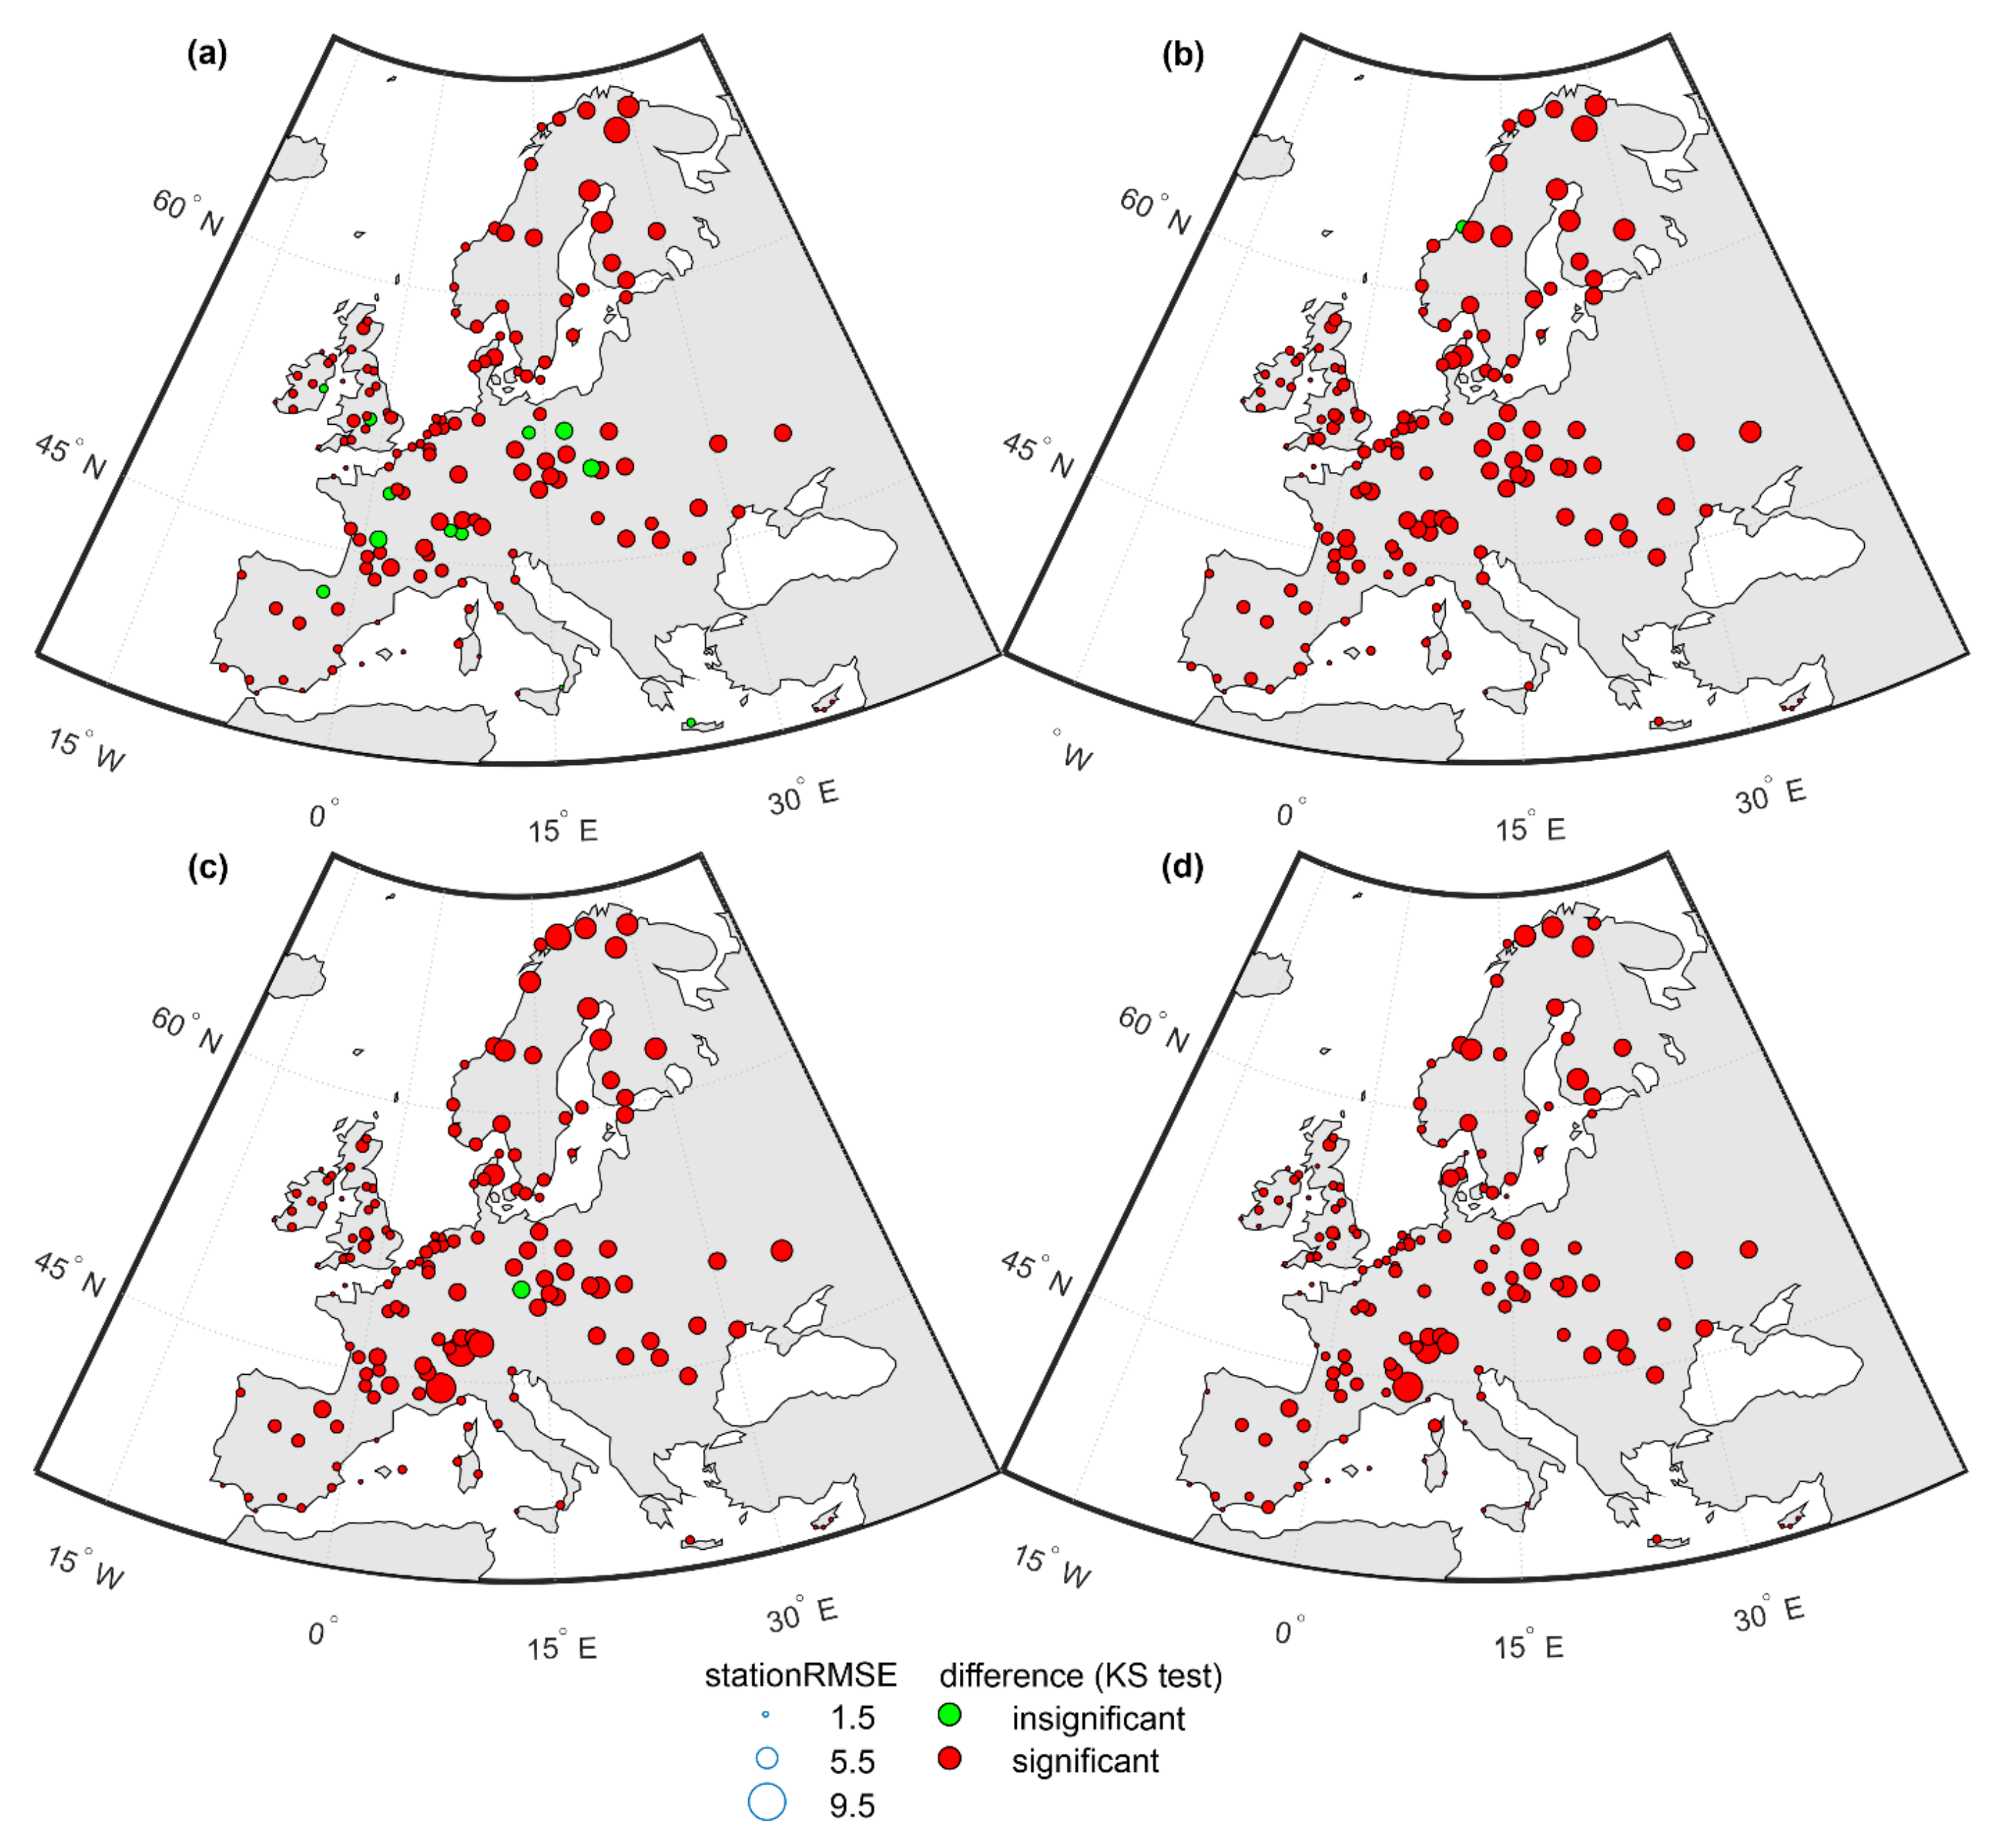
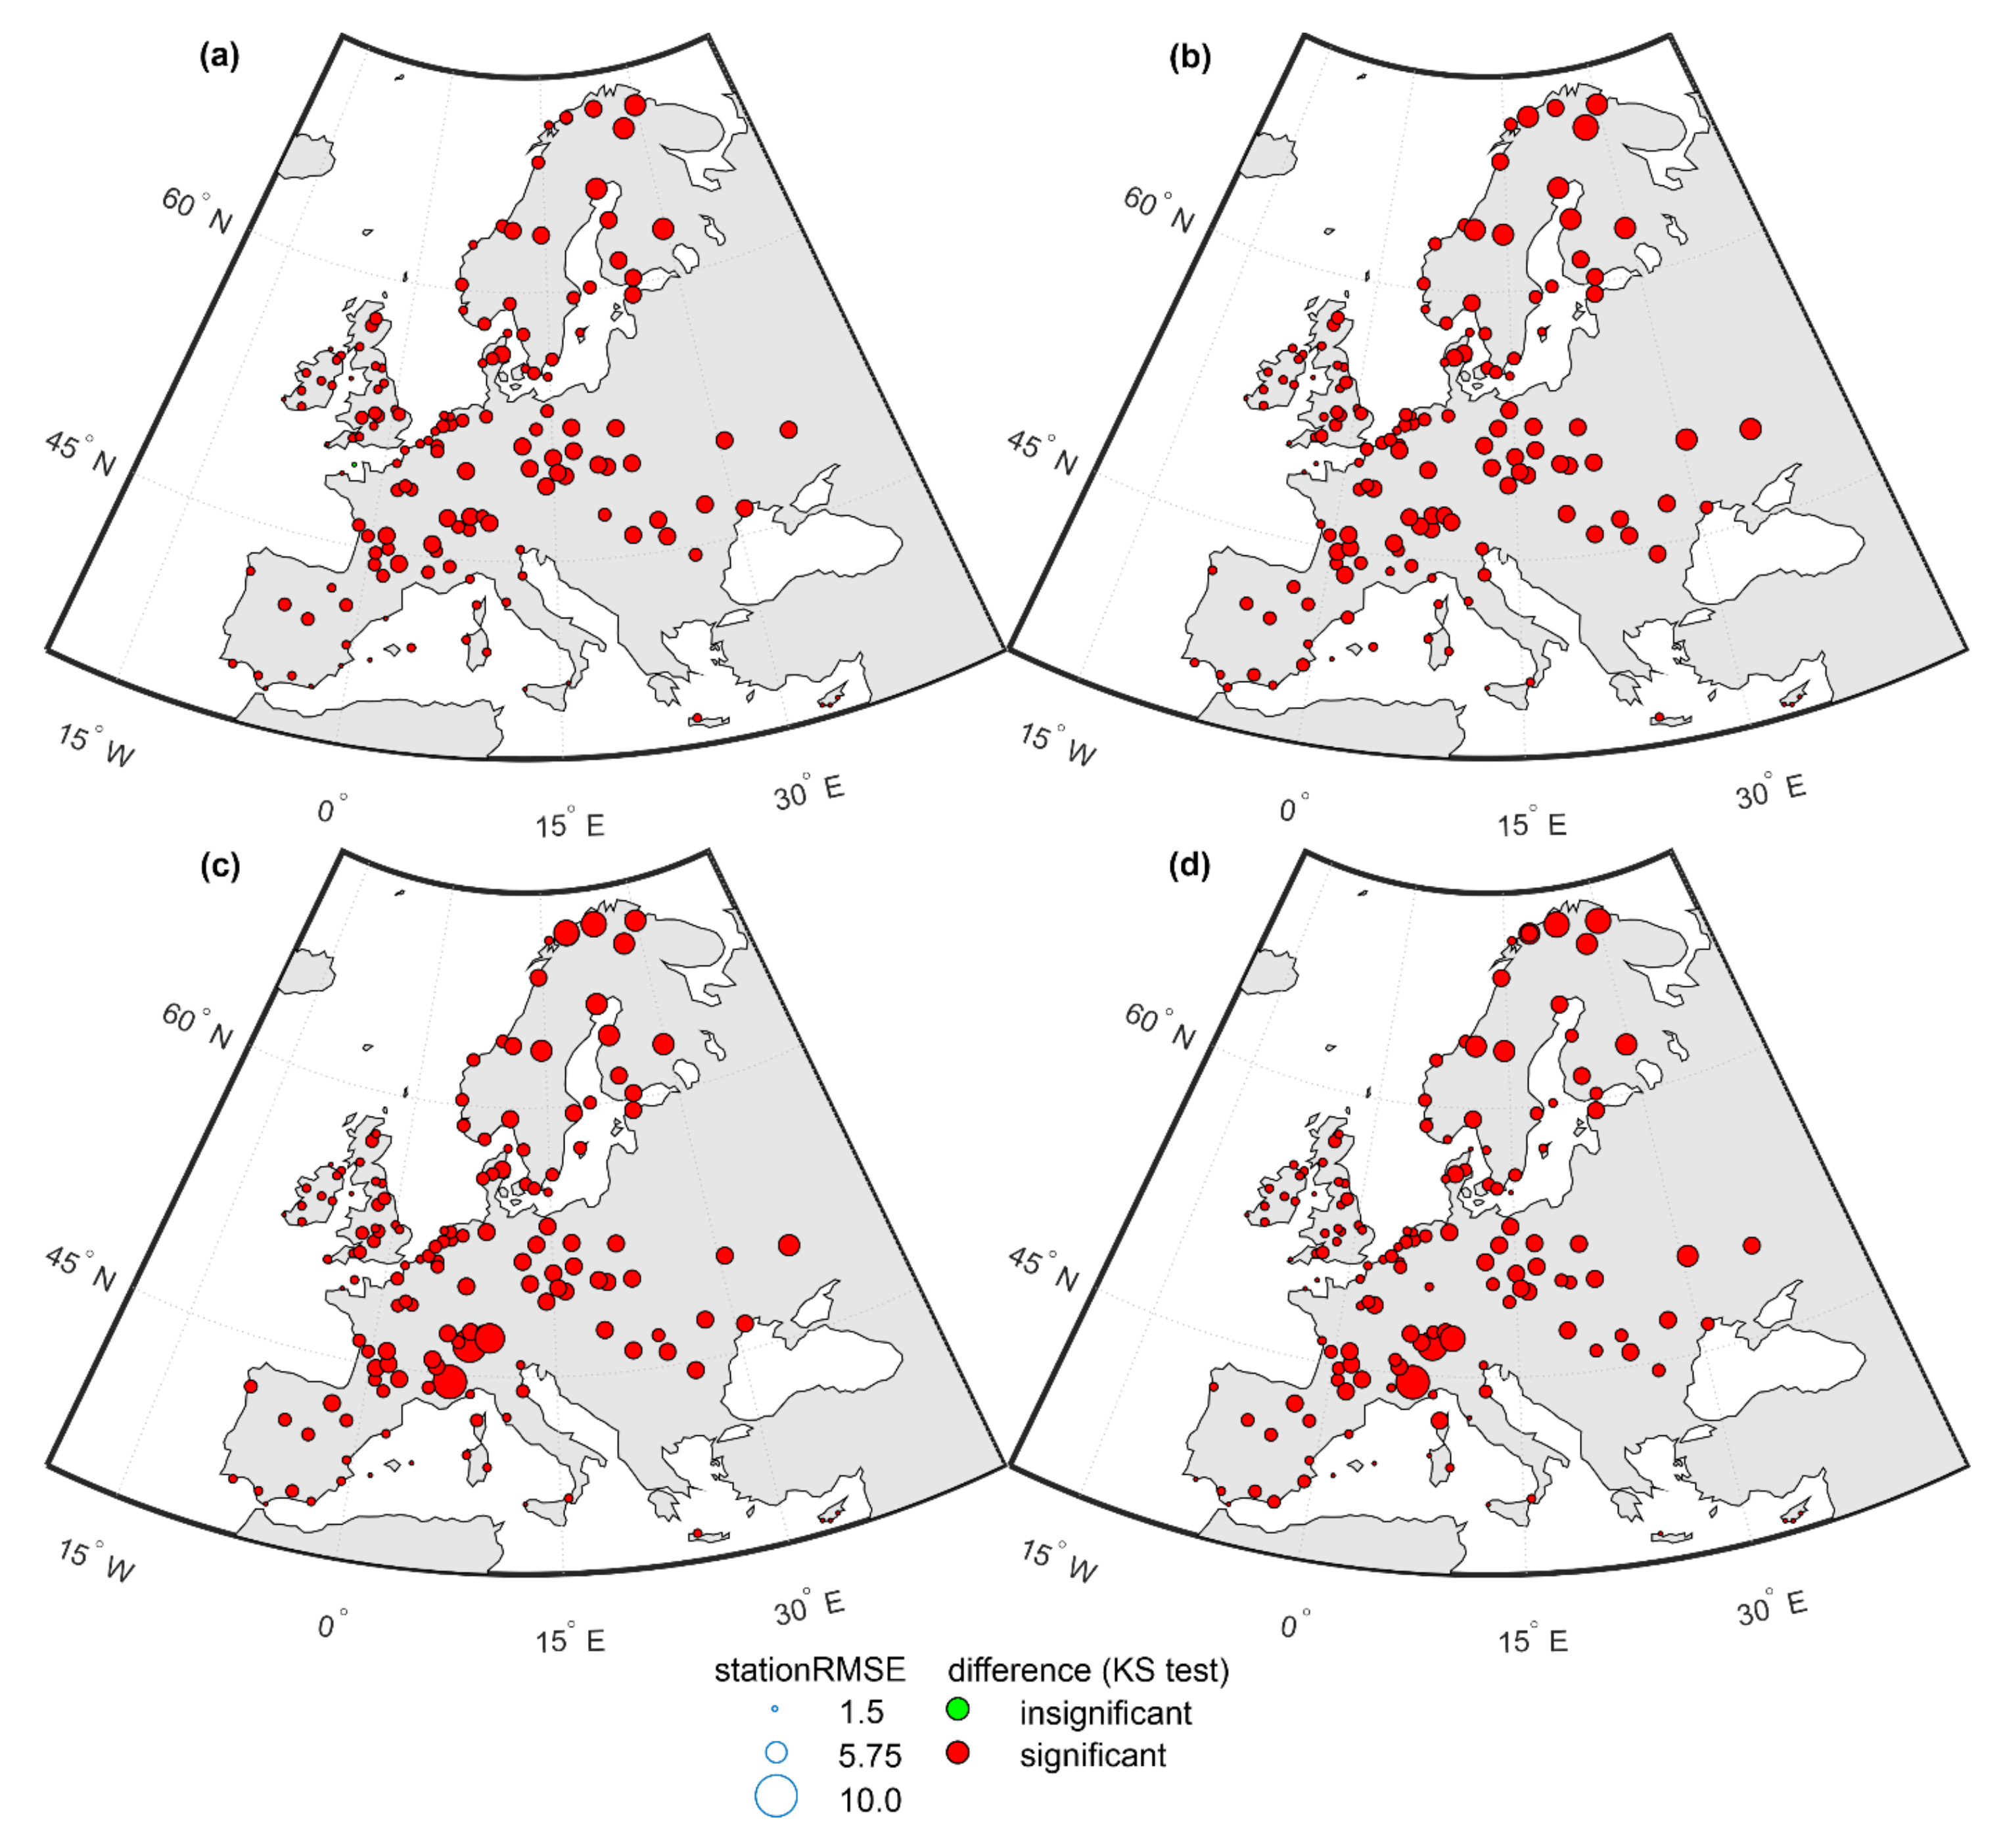
The values of stationRMSE are slightly bigger than stationMB and vary between 1.73 and 9.5 °C, as stationRMSE is more sensitive to outliers. The spatial distribution of stationRMSE shows a general pattern that applies to all pairs of data sets being compared: the more to the north, the bigger the values of stationRMSE (Figure 5). Additionally, the TMY-52 vs. GS pair of data sets produces substantial stationRMSE values in the Alps (Figure 5c). In general, the smallest mRMSE value—3.85—was observed for the TMY-52 vs. TMY-51 pair of data sets, but the dispersion of the stationRMSE values is big (Table 2). A slightly bigger value of mRMSE—3.98—was observed for the TMY-GS vs. GS pair of data sets (Table 2).
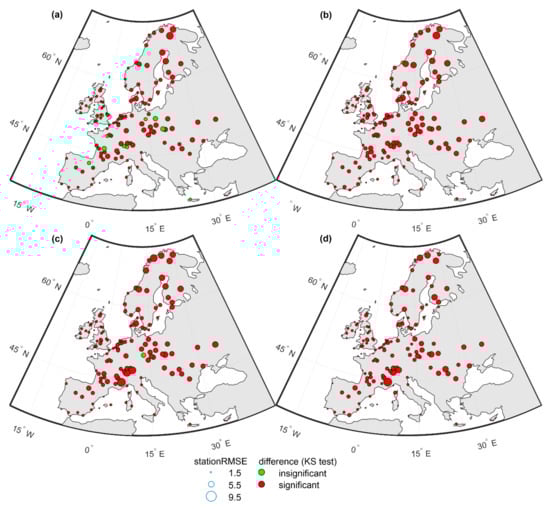
Figure 5.
StationRMSE for daily average values of T, on the basis of four comparisons: TMY-GS vs. GS (a), TMY-51 vs. GS (b), TMY-52 vs. GS (c), and TMY-52 vs. TMY-51 (d). Green circles indicate that the differences between tested and reference data sets are insignificant (and thus these data sets can be used interchangeably), while red circles indicate significant differences.
Table 2.
mRMSE, maximum stationRMSE, minimum stationRMSE, and the number of stations with insignificant (α = 0.05) differences between tested and reference data sets (a) for daily average values of T, on the basis of four comparisons: TMY-GS vs. GS, TMY-51 vs. GS, TMY-52 vs. GS, and TMY-52 vs. TMY-51.
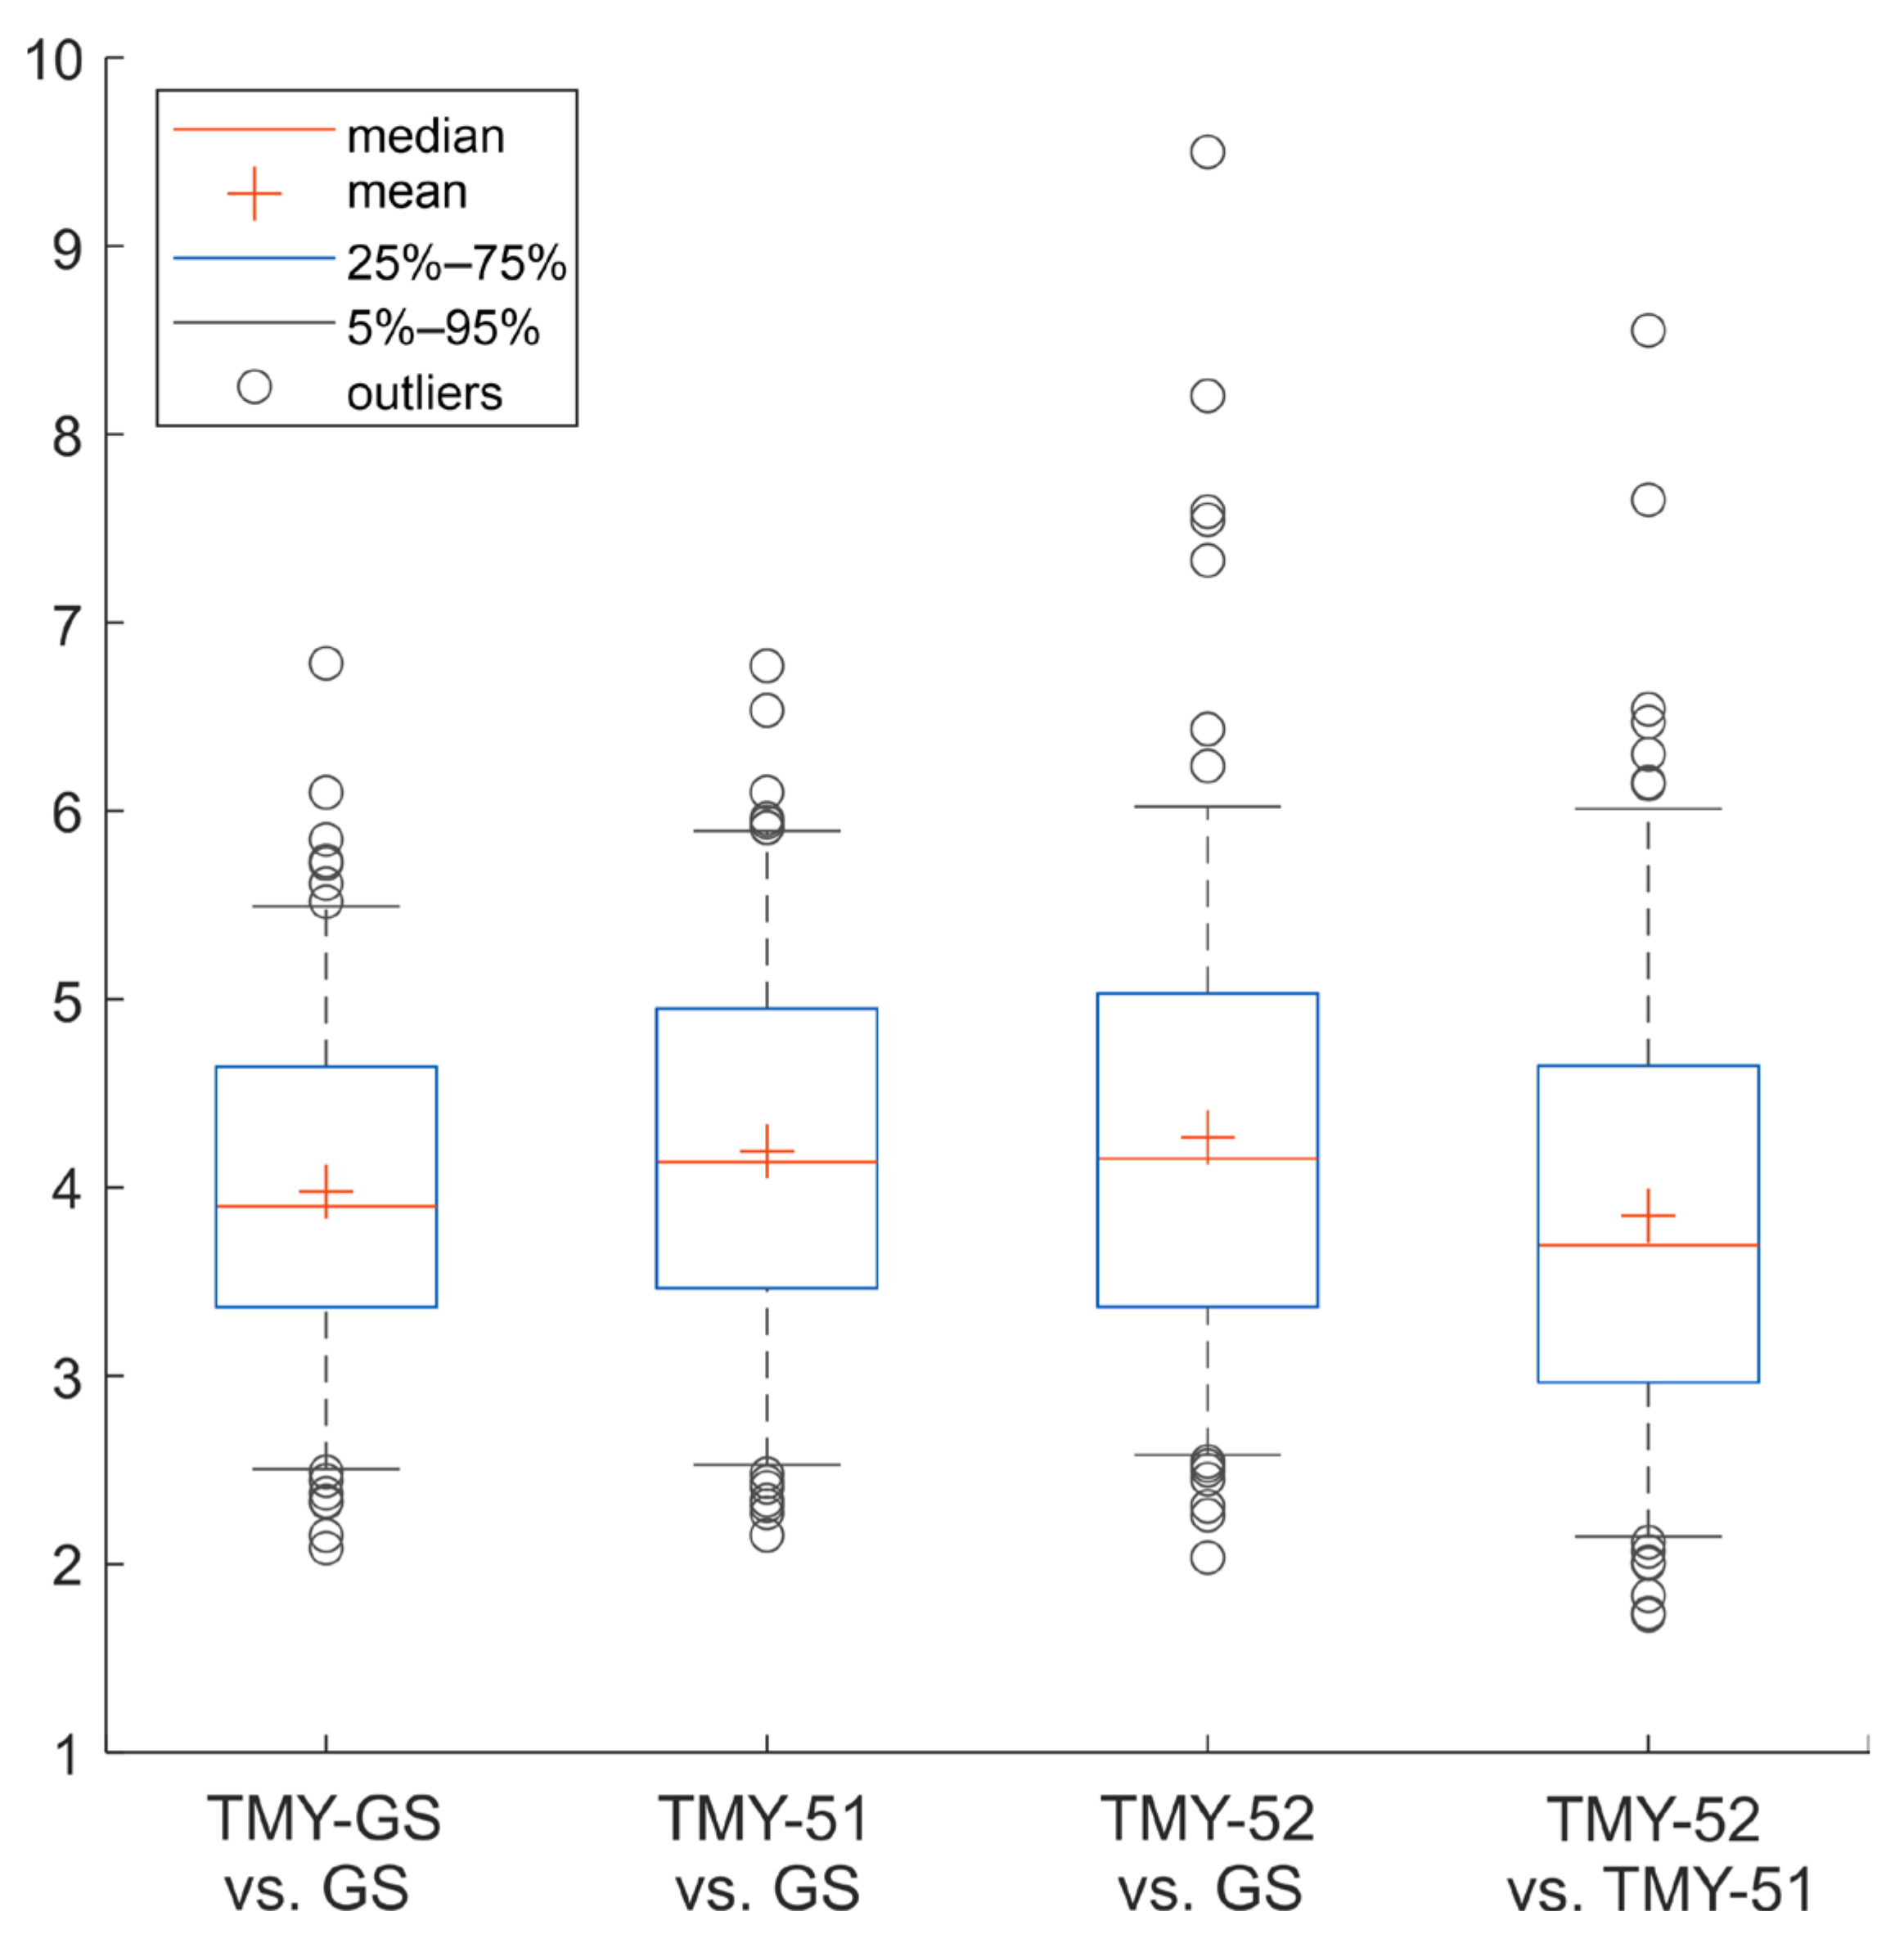
Overall, TMY-52 performs slightly worse than TMY-51 and produces an mRMSE value of 4.27 (for TMY-52 vs. GS), while TMY-51 produces an mRMSE value of 4.19 (for TMY-51 vs. GS) (Table 2). This seems to be strongly influenced by a small number of stations with very big values of stationRMSE (Figure 6). On the other hand, the minimum stationRMSE was the smallest for the TMY-52 vs. GS pair of data sets (compared to TMY-GS vs. GS and TMY-51 vs. GS).
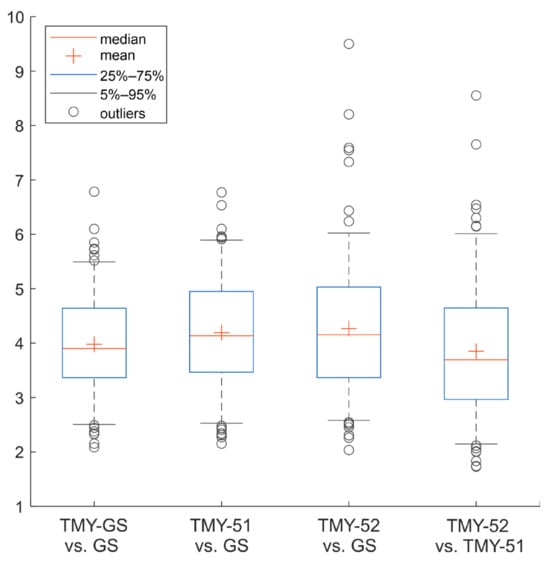
Figure 6.
Statistical distributions of stationRMSE for daily average values of T, on the basis of four comparisons: TMY-GS vs. GS, TMY-51 vs. GS, TMY-52 vs. GS, and TMY-52 vs. TMY-51.
According to the Kolmogorov–Smirnov test, when TMY-GS is considered, only data from 12 stations can be used interchangeably with GS. For TMY-51 and TMY-52, this number decreases to one station only (Table 2). At the remaining stations, statistically significant values of the Kolmogorov–Smirnov test statistic suggest that the tested data and reference ground-based data cannot be used interchangeably. However, it should be remembered that the Kolmogorov–Smirnov test is very sensitive not only to differences in the position of two distributions but also to the shapes of the examined distributions. Therefore, even a single outlier may turn the result into being statistically significant, and thus it will be necessary to reject the null hypothesis that the two data sets can be used interchangeably. In addition, having very large sample sizes (and such is the case of daily data resolution—in a 12-year time period, there are 4380 daily values per station), the null hypothesis about the possibility of the interchangeable use of data will almost always be rejected, even with the smallest random differences between the distributions of two samples. For this reason, averaged series are often used (e.g., monthly values instead of daily or hourly values) because they blur some inhomogeneities and errors in the measurement data, which are the reason for the differences between the two data series [32,33].
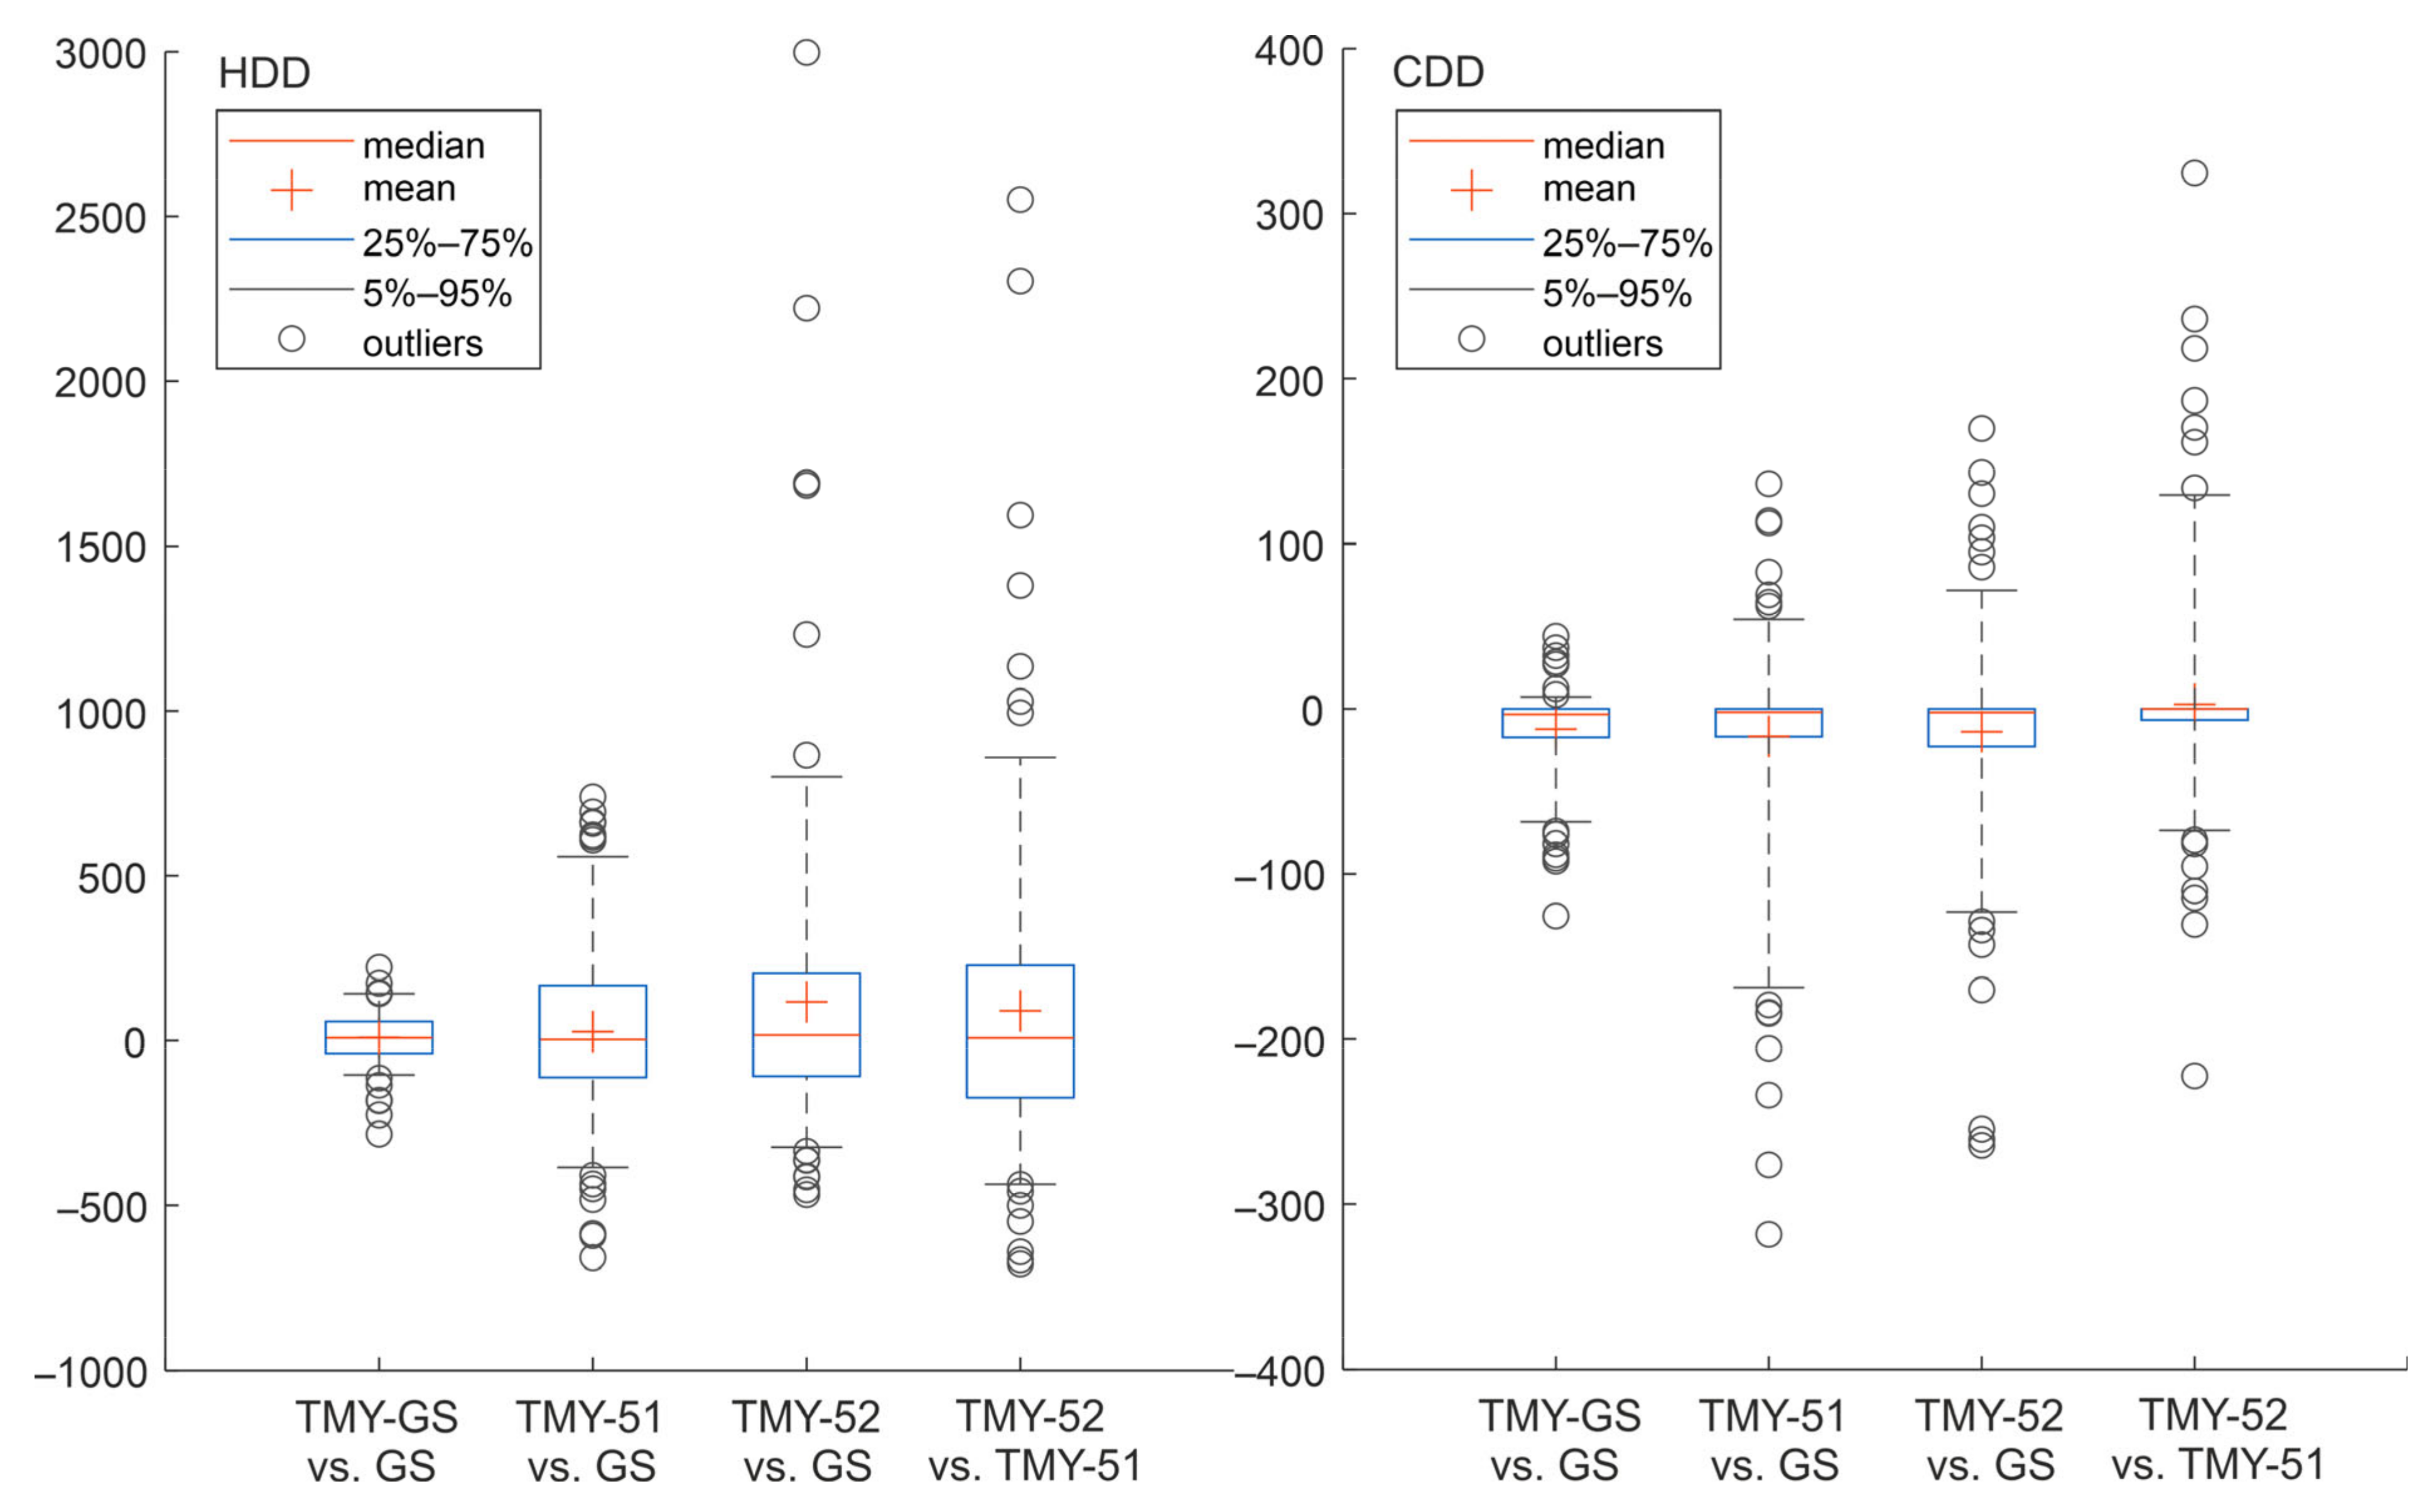
3.2. Comparisons Based on HDDs and CDDs
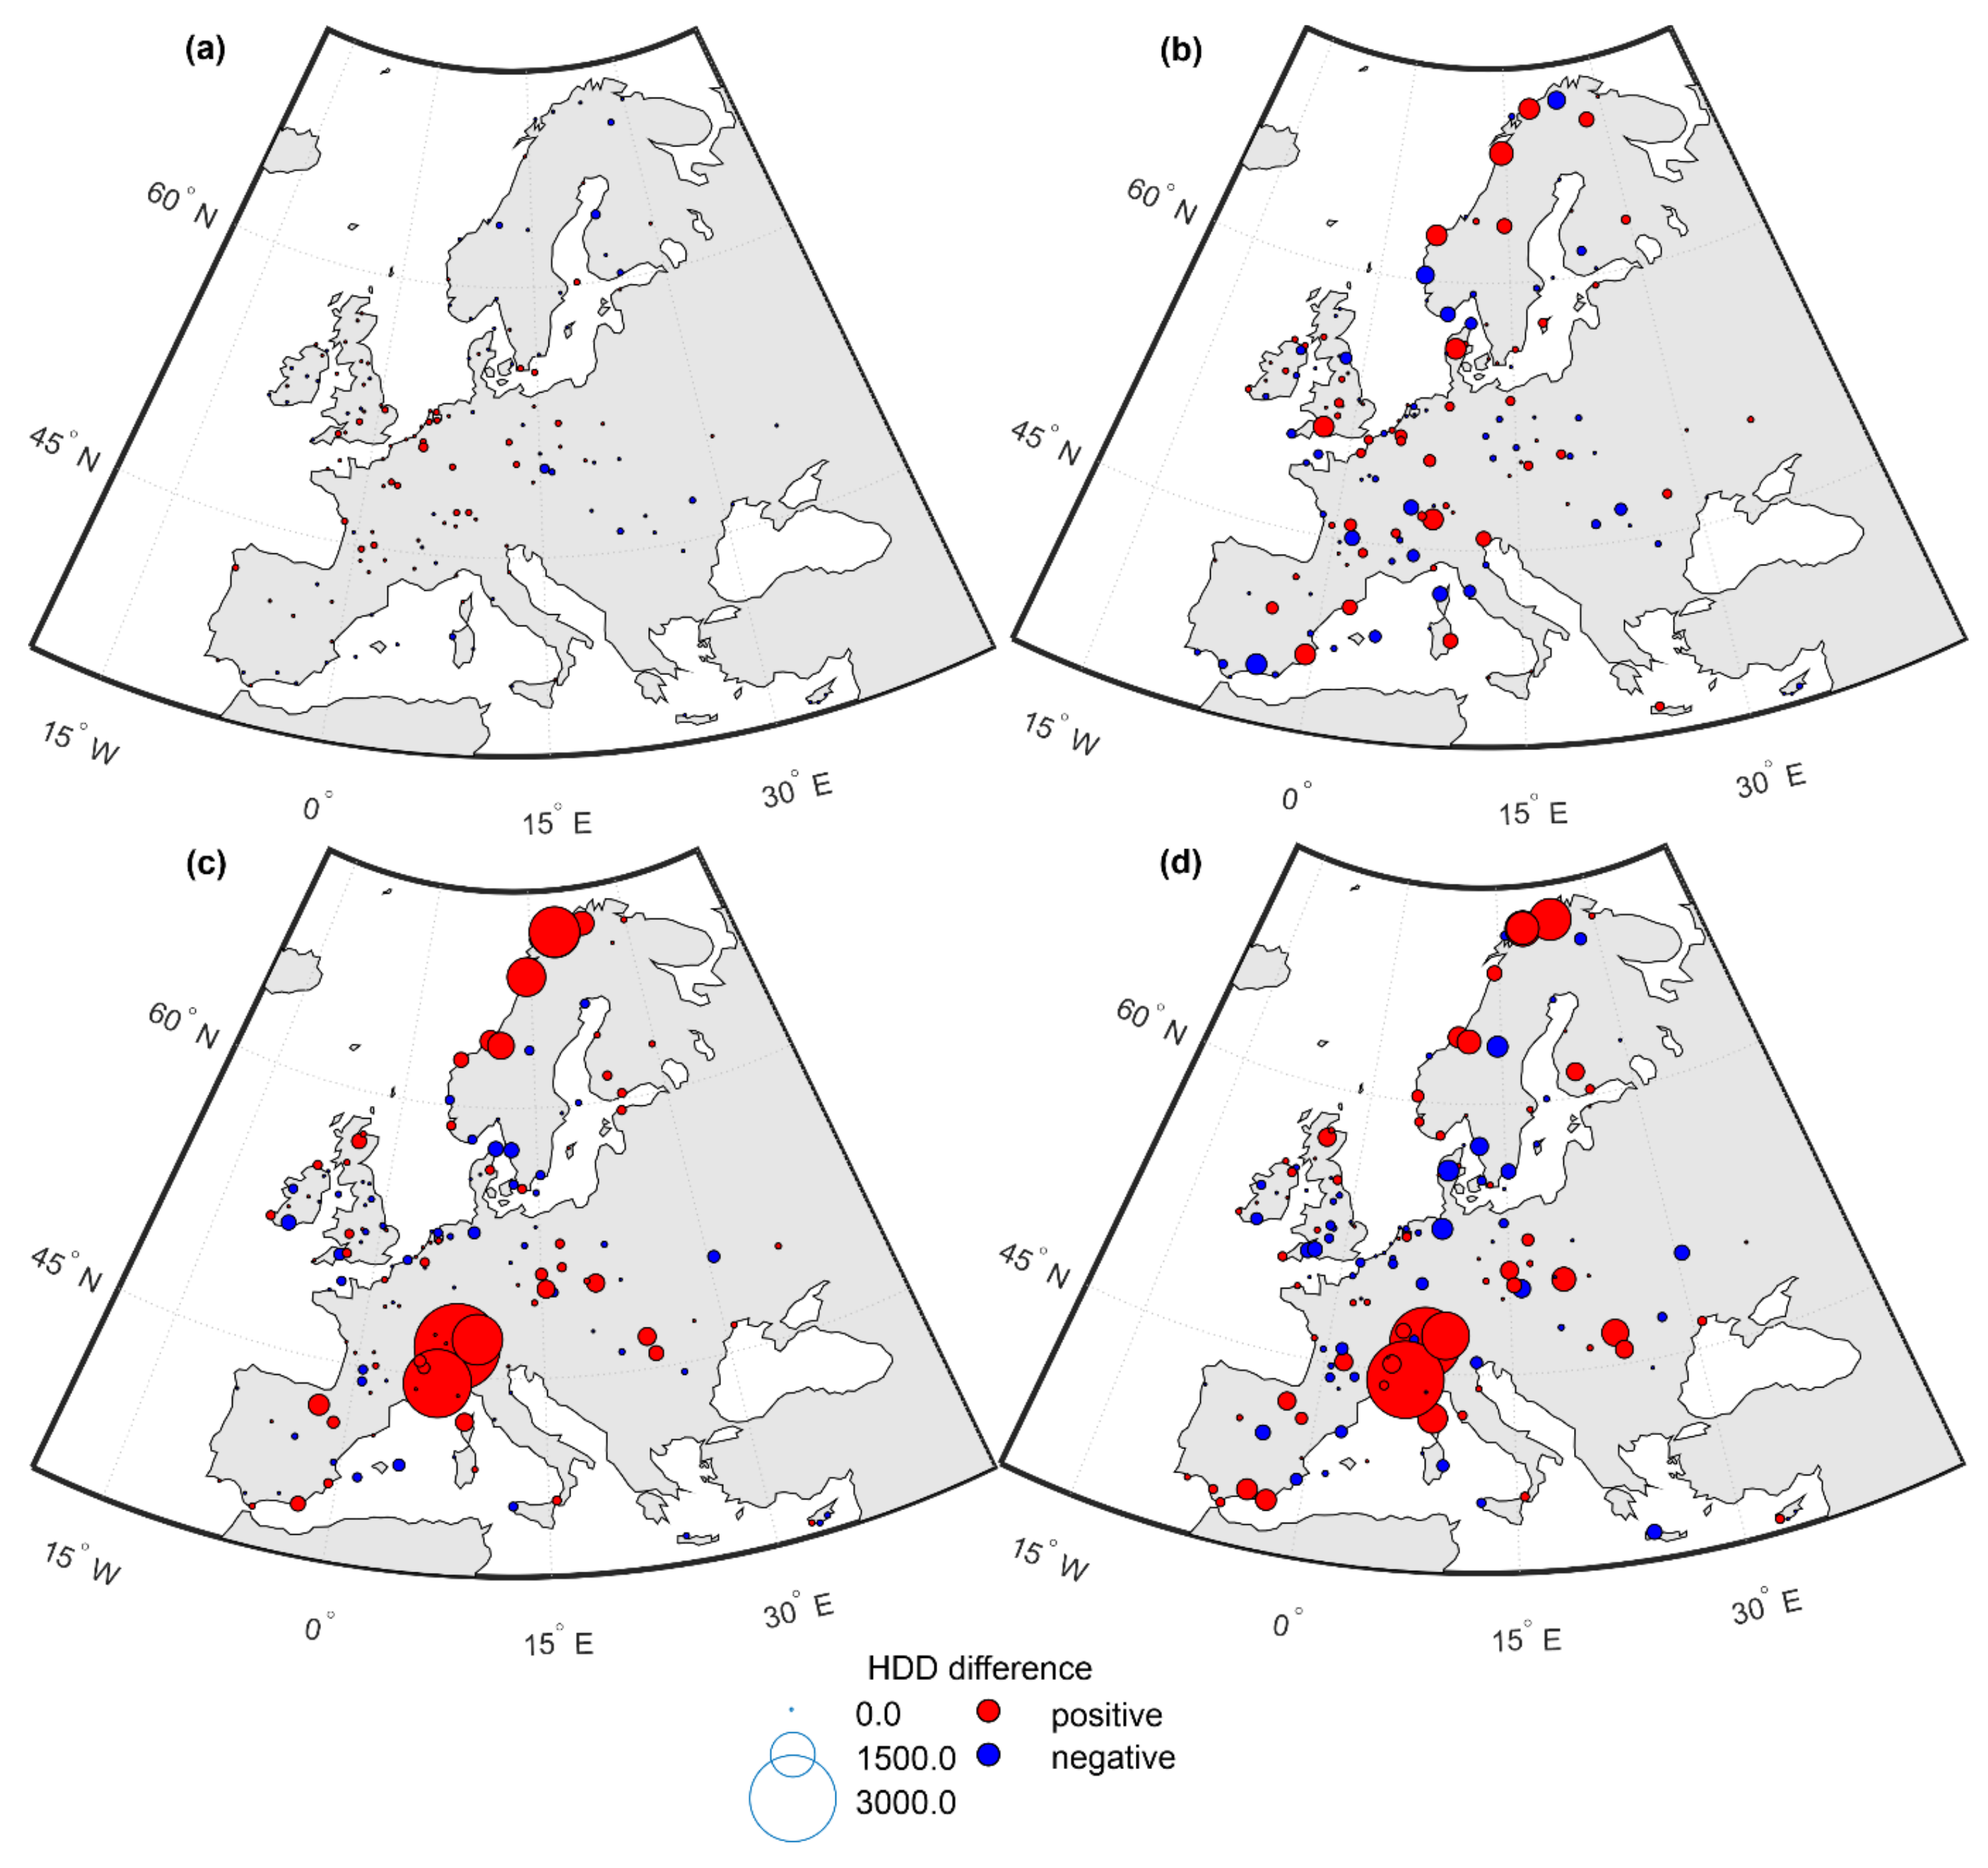
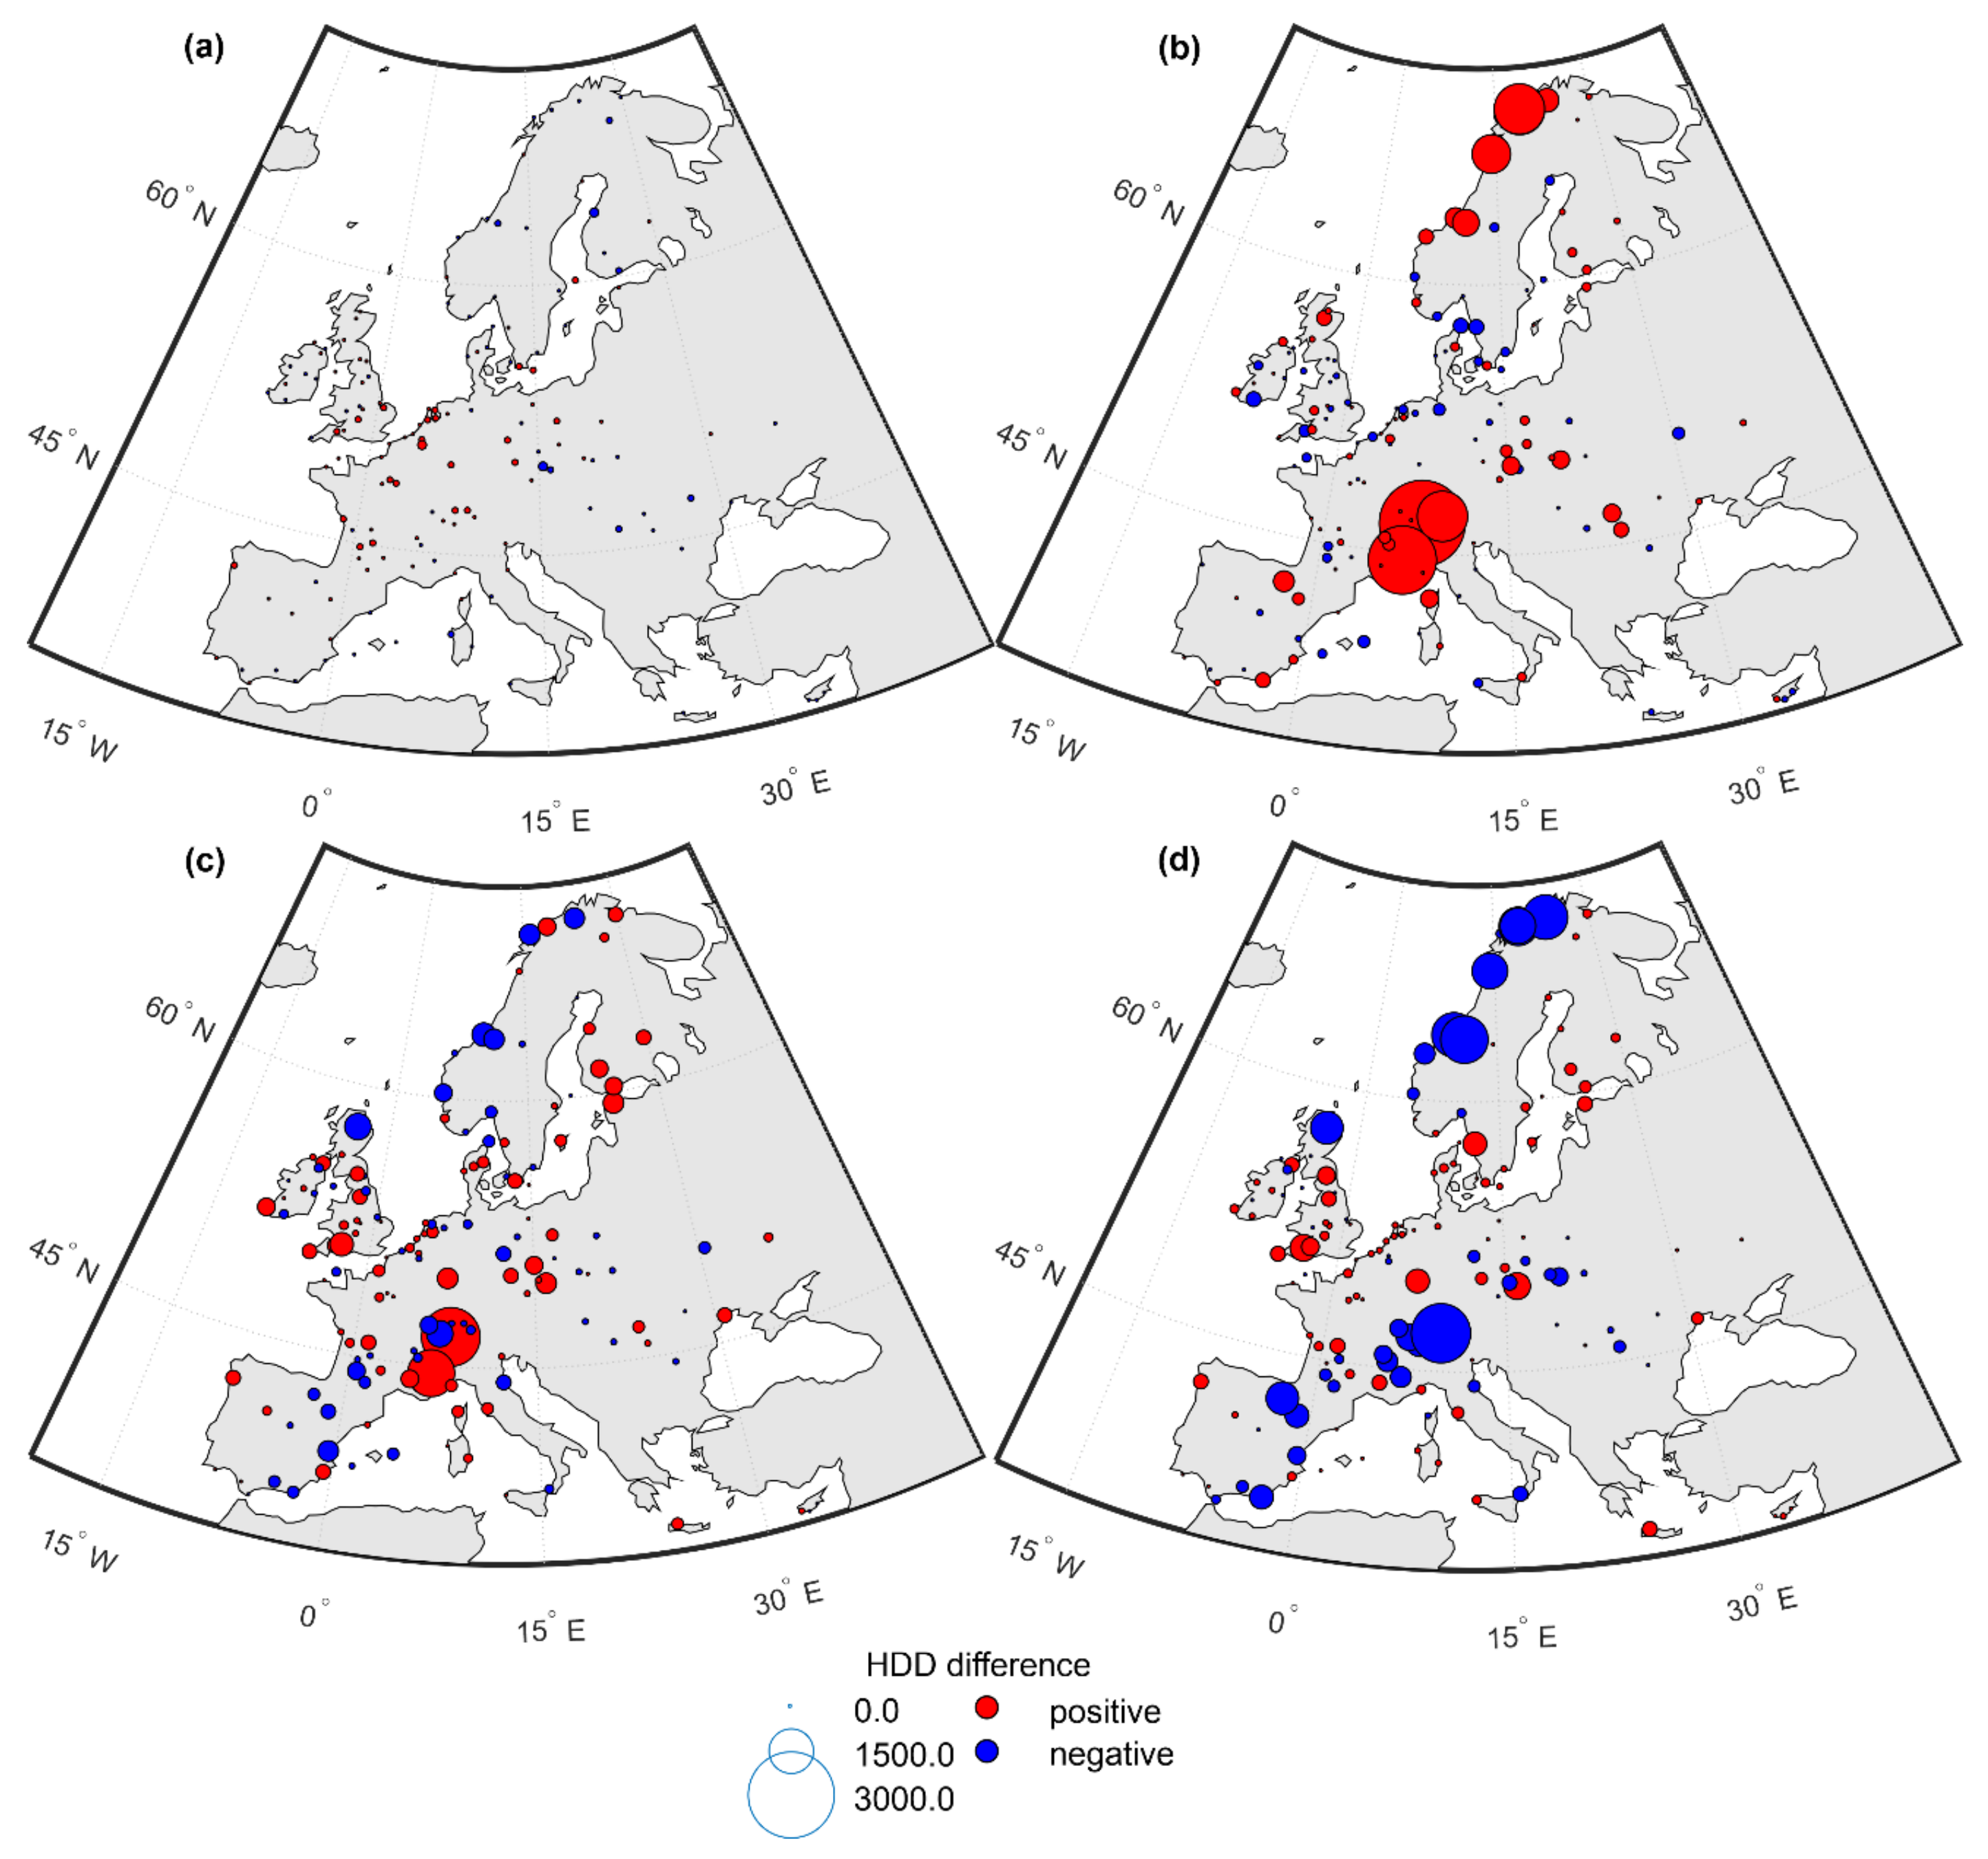
The yearly mean HDD value calculated on the basis of GS data is, e.g., 5581 in Alta, 3256 in Warsaw, and 1590 in Zaragoza. The differences in HDD values between the TMY-GS and GS vary between −283 and 222 (Figure 7a). TMY-51 produces slightly bigger differences but with no clear spatial pattern: there is a similar number of positive and negative values across Europe (Figure 7b). In turn, comparing TMY-52 to GS presents a completely different picture. In this case, the number of positive HDD differences prevails over the number of negative ones. A positive HDD difference means that TMY-52 reports more HDDs than GS, in other words, that TMY-52 underestimates the temperature compared to ground station data. The exceptionally big positive HDD differences between TMY-52 and GS occur in the Alps and in the northwestern part of Norway (Figure 7c).
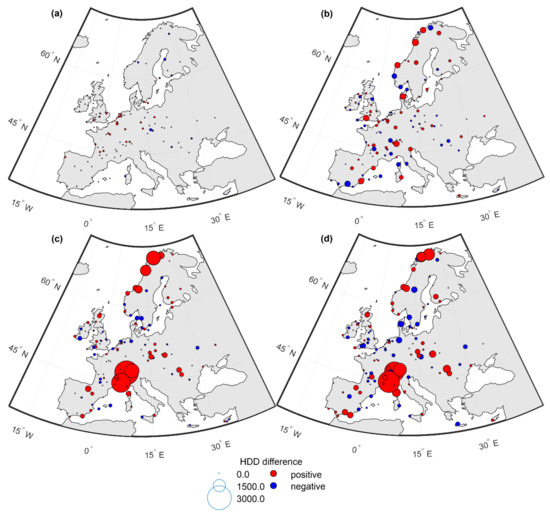
Figure 7.
HDD differences calculated on the basis of: TMY-GS vs. GS (a), TMY-51 vs. GS (b), TMY-52 vs. GS (c), and TMY-52 vs. TMY-51 (d).
In general, the smallest RMSE value for HDDs—81.42—was observed for the TMY-GS vs. GS pair of data sets (Table 3). Interestingly, it is important to note that TMY-52 performs much worse than TMY-51 and produces an RMSE value of 471.93 (for TMY-52 vs. GS), while TMY-51 produces an RMSE value of 257.97 (for TMY-51 vs. GS) (Table 3). This seems to be strongly influenced by a small number of stations with very big HDD differences (Figure 8).
Table 3.
Mean Bias (MB) and Root Mean Square Error (RMSE) calculated on the basis of tested HDD (CDD) data set and reference HDD (CDD) data set, for four comparisons: TMY-GS vs. GS, TMY-51 vs. GS, TMY-52 vs. GS, and TMY-52 vs. TMY-51.
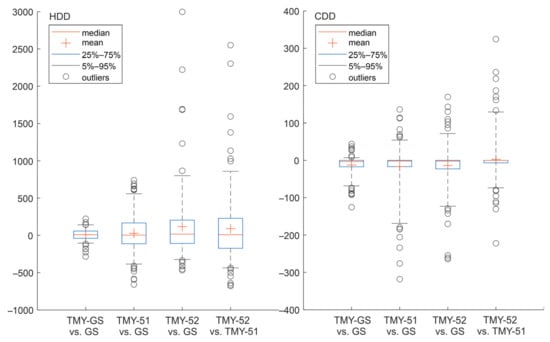
Figure 8.
Statistical distributions of HDD (left) and CDD (right) differences calculated on the basis of: TMY-GS vs. GS, TMY-51 vs. GS, TMY-52 vs. GS, and TMY-52 vs. TMY-51.
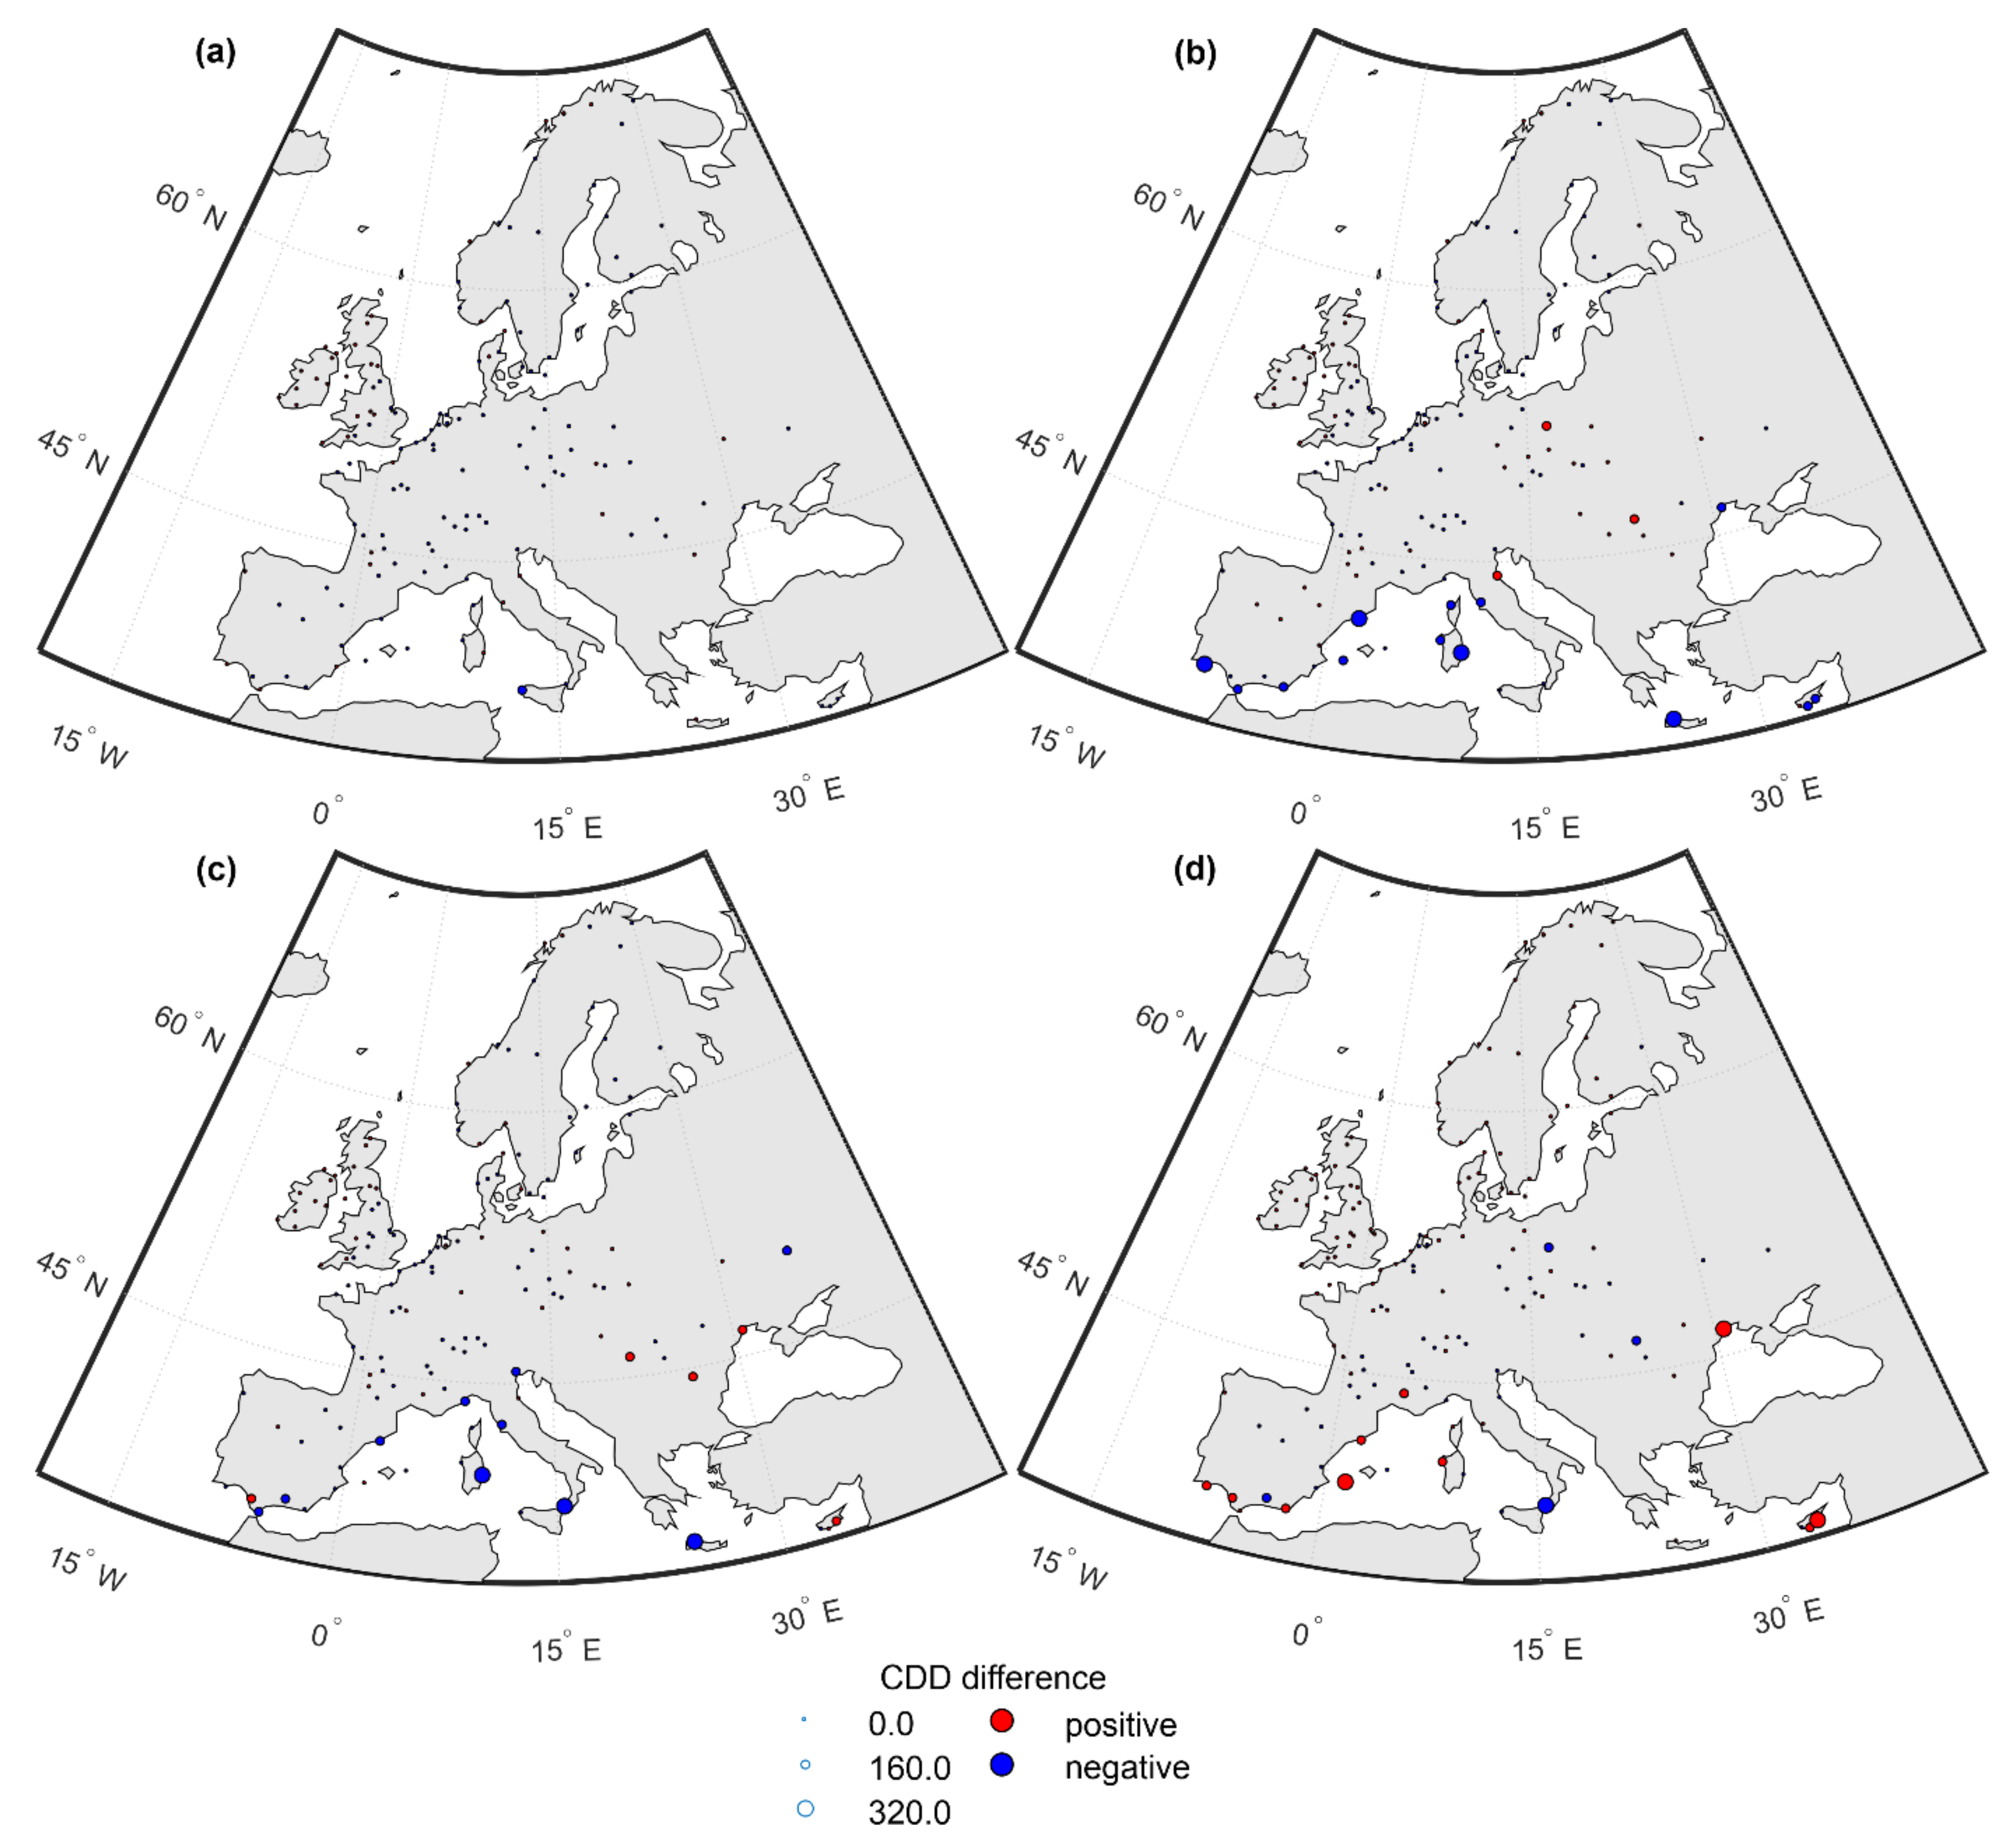
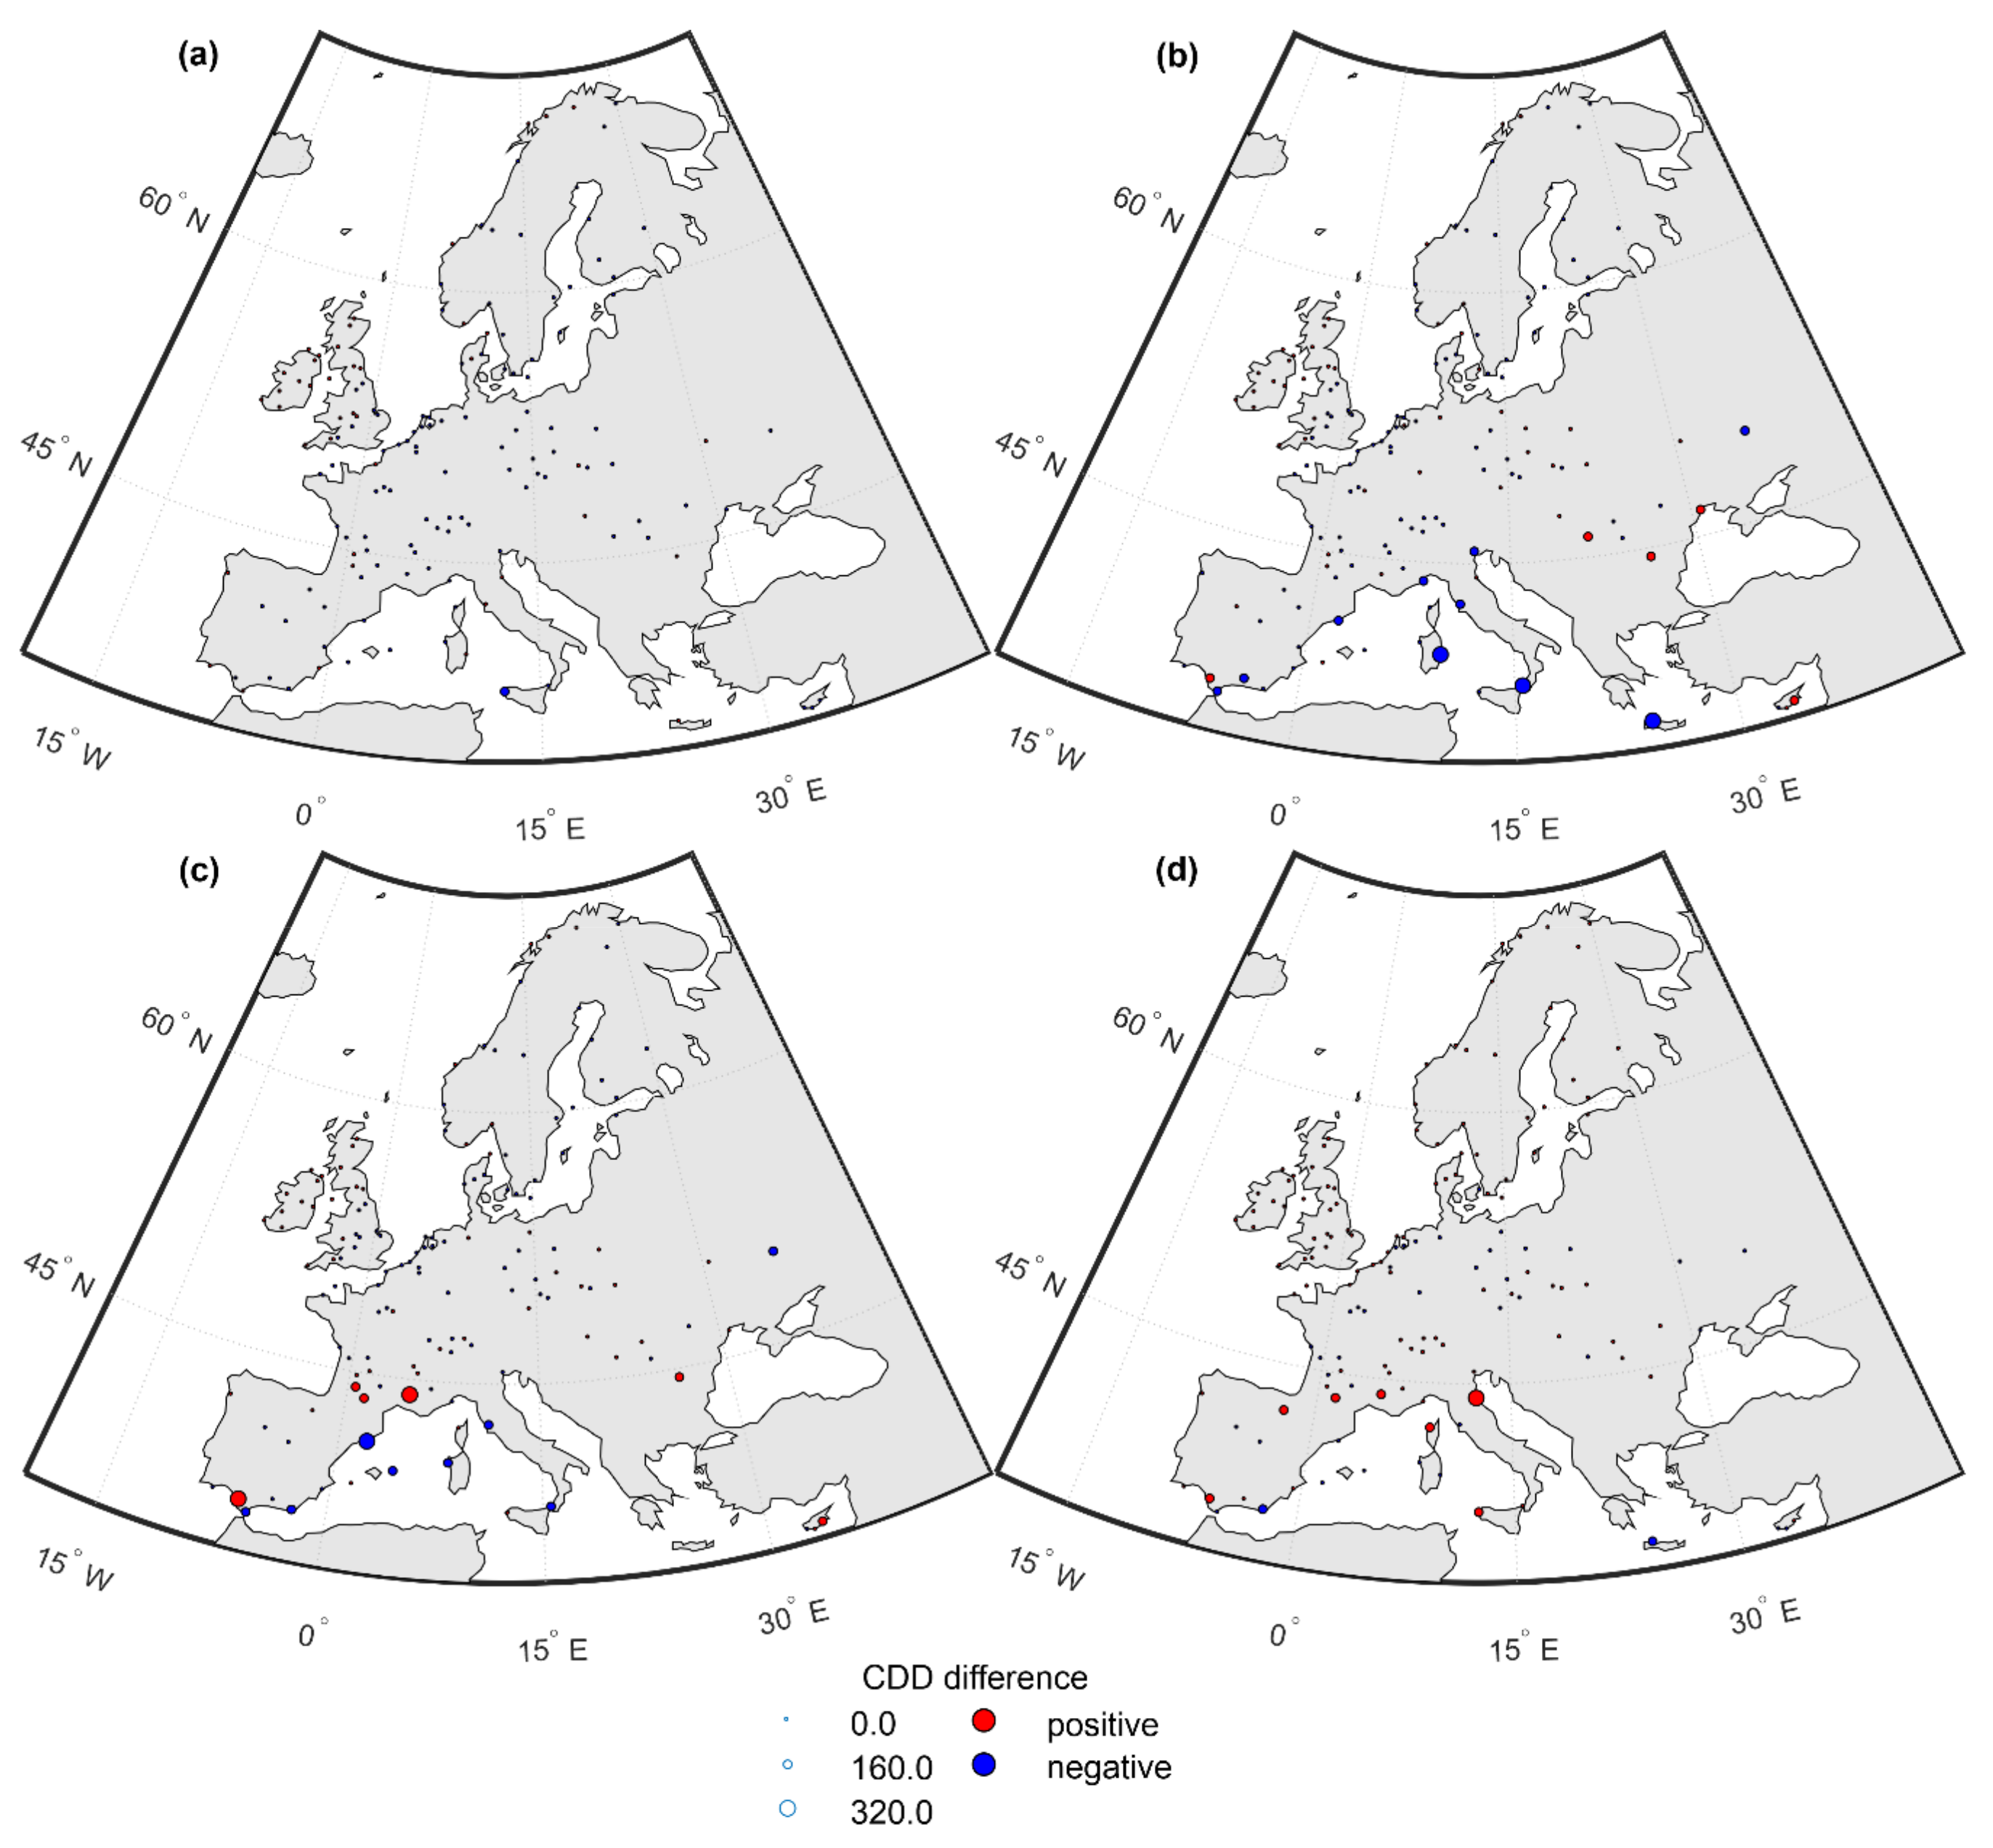
On the other hand, the differences in CDD values between the TMY-GS and GS vary between −92 and 44 (Figure 9a), while the yearly mean CDDs calculated on the basis of GS data are, e.g., 837 in Larnaca, 41 in Warsaw, and 1 in Alta. In this case, TMY-52 performs better than TMY-51 and produces an RMSE value of 60.57 (for TMY-52 vs. GS), while TMY-51 produces an RMSE value of 65.06 (for TMY-51 vs. GS) (Table 3).
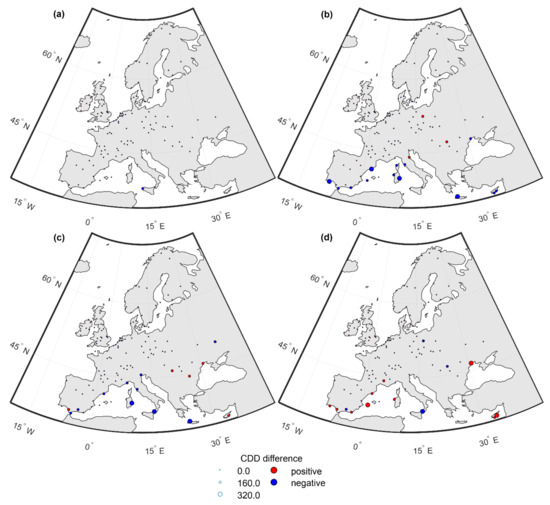
Figure 9.
CDD differences calculated on the basis of: TMY-GS vs. GS (a), TMY-51 vs. GS (b), TMY-52 vs. GS (c), and TMY-52 vs. TMY-51 (d).
A first, the general observation might be that TMY-52, which is based on ERA5-Land reanalysis without downscaling, significantly underestimates the temperature values. It seems that this problem is especially visible in places with complicated topography (mountains). Moreover, as TMY-52 performs worse than TMY-51 regarding HDDs, while better than TMY-51 regarding CDDs (Figure 9), it seems that the problem concerns mostly low temperatures. A similar pattern was observed with regard to MB and RMSE comparisons for the whole time series of T. However, HDD boosts this problem, because of using in calculations only the days when heating is necessary.
3.3. Applying an Extended Time Period 2005–2020
In the PVGIS 5.2, the default time period, based on which the TMY is produced, is 2005–2020 (16 years), but it can be changed according to the user’s choice. In previous sections, a shorter 12-year time period, 2005–2016, was used to keep the consistency between TMY-52 and TMY-51. In this section, some additional comparisons are made based on the full 16-year time period. Hence, the following data sets were adopted:
- GSL: Ground station data from the 16-year time period (2005–2020). The meteorological elements—T, Td, and WS—come from ground station meteorological data, while GHI comes from SARAH-2 or ERA5 (in areas above the 65° N latitude);
- TMY-GSL: TMY generated on the basis of ground station data from the 16-year time period (2005–2020), following the ISO 15927-4 procedure;
- TMY-51: TMY from PVGIS 5.1, generated from the 12-year time period (2005–2016);
- TMY-52L: TMY from PVGIS 5.2, generated from the 16-year time period (2005–2020).
The comparisons were performed for the following pairs of data sets:
- TMY-GSL (tested data) against GSL (reference data);
- TMY-51 (tested data) against GSL (reference data);
- TMY-52L (tested data) against GSL (reference data);
- TMY-52L (tested data) against TMY-51 (reference data).
In order to compare the above-mentioned pairs of data sets, the tests based on the RMSE for time series of daily average values of T were adopted.
Similarly, as in the case of the basic 12-year time period, the spatial distribution of the stationRMSE for daily average T in a long 16-year time period shows a general pattern that applies to all pairs of data sets being compared: the more to the north, the bigger the values of the stationRMSE (Figure 10). Additionally, the TMY-52L vs. GSL pair of data sets produces substantial stationRMSE values in the Alps (Figure 10c), similarly to what was reported in the previous section. In general, the smallest mRMSE value—3.98—was observed for the TMY-GSL vs. GSL pair of data sets (Table 4). Similarly, as before (in the case of the basic 12-year time period), TMY-52L performs slightly worse than TMY-51 and produces an mRMSE value of 4.31 (for TMY-52L vs. GSL), while TMY-51 produces an mRMSE value of 4.20 (for TMY-51 vs. GSL) (Table 4). What is very important to remember is that this time TMY-51 is prepared on the basis of a different time period (12 years, 2005–2016)! Yet, similarly as before, the mRMSE value for TMY-52L seems to be strongly influenced by a small number of stations with very big stationRMSE. Apart from these outliers, the statistical distributions of TMY-52L vs. GSL and TMY-51 vs. GSL are very similar (Figure 11).
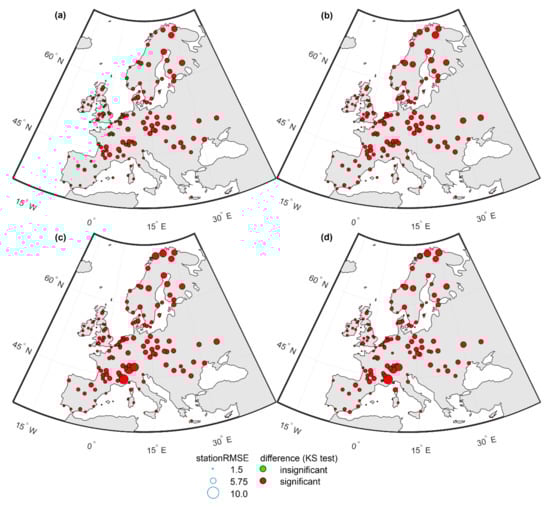
Figure 10.
StationRMSE for daily average values of T, on the basis of four comparisons: TMY-GSL vs. GSL (a), TMY-51 vs. GSL (b), TMY-52L vs. GSL (c), and TMY-52L vs. TMY-51 (d). Green circles indicate that the differences between tested and reference data sets are insignificant (and thus these data sets can be used interchangeably), while red circles indicate significant differences.
Table 4.
mRMSE, maximum stationRMSE, minimum stationRMSE, and number of stations with insignificant (α = 0.05) differences between tested and reference data sets (a) for daily average values of T, on the basis of four comparisons: TMY-GSL vs. GSL, TMY-51 vs. GSL, TMY-52L vs. GSL, and TMY-52L vs. TMY-51.
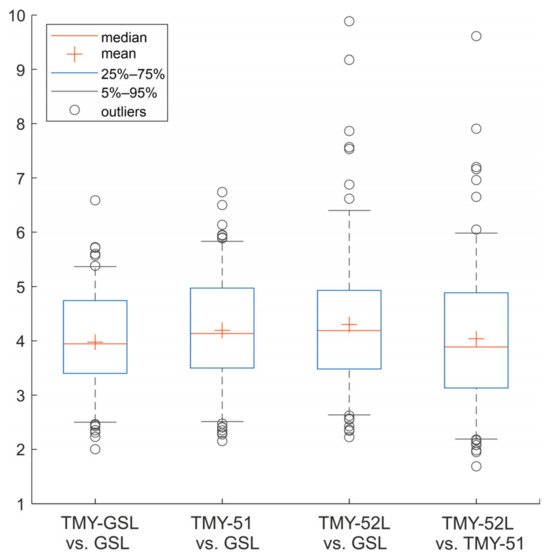
Figure 11.
Statistical distributions of stationRMSE for daily average values of T, on the basis of four comparisons: TMY-GSL vs. GSL, TMY-51 vs. GSL, TMY-52L vs. GSL, and TMY-52L vs. TMY-51.
In general, almost all the mRMSE values are slightly bigger than the ones obtained for the basic 12-year time period (cf. Table 2). Regarding T, it seems that applying an extended time period, 2005–2020, does not seem to greatly improve the quality of the final TMY data sets. However, the variability in the values between the percentiles 25 and 75 for TMY-52L vs. GSL is smaller when the 16-year time period is considered (Figure 6 and Figure 11). In any case, TMY-51 seems to produce data of better quality (more similar to GS data) than TMY-52/TMY-52L, no matter what time period is being considered.
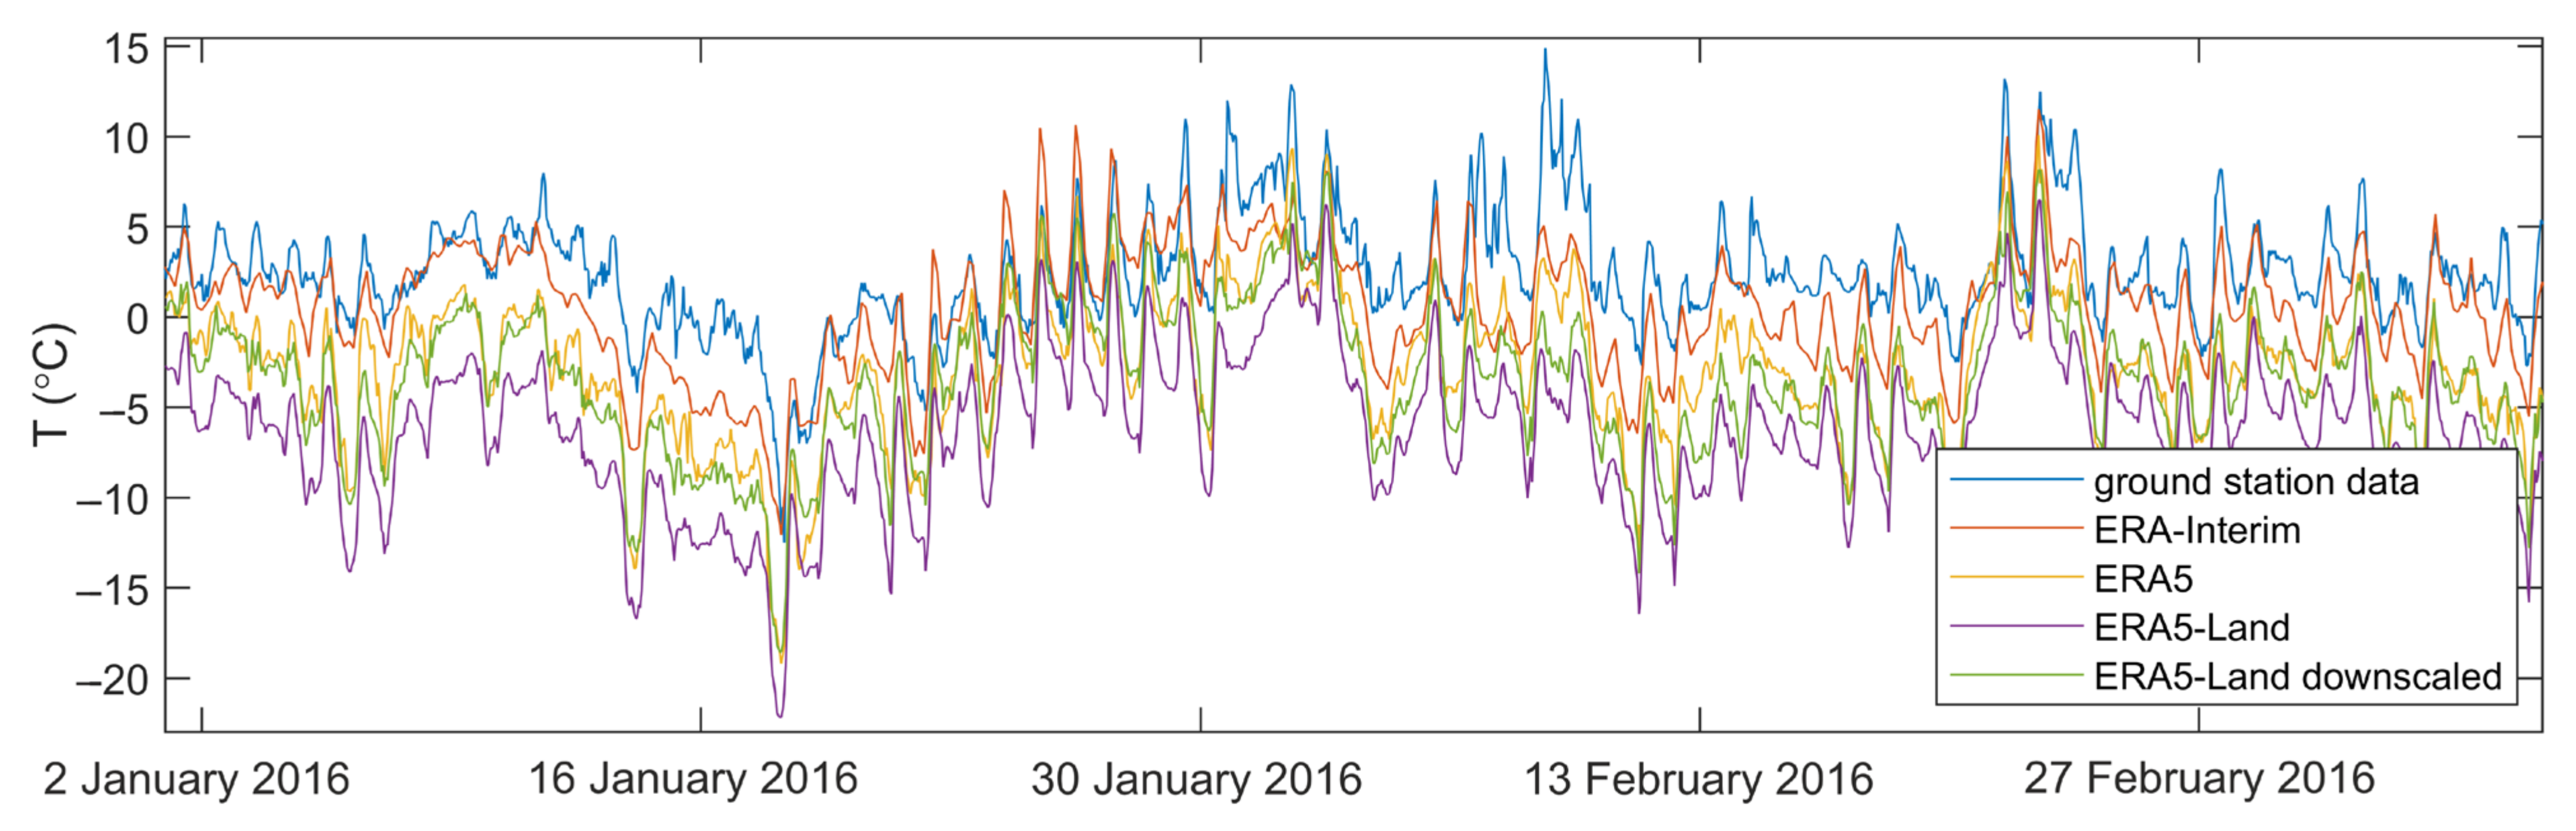
3.4. Applying the Temperature Downscaling
As described before, TMY-52 tends to underestimate the low temperature values reported in the ground station data sets. In fact, an example of the course of temperature in Interlaken shows that ERA5-Land, based on which TMY-52 is produced, gives substantially lower values of temperature than ERA-Interim or the values recorded at the ground station (Figure 12). That is why a procedure of temperature downscaling has been applied, similar to the one applied to the ERA-Interim data in PVGIS 5.1, which was described by Huld and Pinedo Pascua [28]. Since the original correction coefficients were only computed for the 3-hourly values per month (provided by ERA-Interim) in PVGIS 5.1, in PVGIS 5.2, these correction coefficients were applied to the three closest hours in the time series. That is, the correction coefficient for 00:00 was applied to 23:00, 00:00, and 01:00, the correction coefficient for 03:00 was applied to 02:00, 03:00, and 04:00, and so on and so forth. TMY-52 with the temperature downscaled was then compared with the ground station and original TMY-52 data sets.
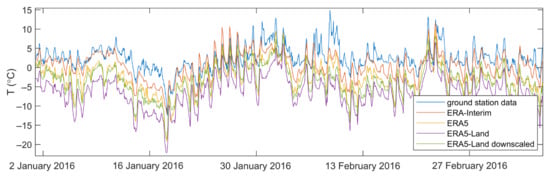
Figure 12.
The course of hourly values of T (°C), derived from five data sources, ground station data, ERA-Interim downscaled in PVGIS 5.1, ERA5, ERA5-Land, and ERA5-Land with the temperature downscaling procedure applied, in Interlaken (Switzerland) in January and February 2016.
Hence, the following data sets were adopted:
- GS: Ground station data from the 12-year time period (2005–2016). The meteorological elements—T, Td and WS—come from ground station meteorological data, while GHI comes from SARAH-2 or ERA5 (in areas above the 65° N latitude);
- TMY-GS: TMY generated on the basis of ground station data from the 12-year time period (2005–2016), following the ISO 15927-4 procedure;
- TMY-52: TMY from PVGIS 5.2, generated from the 12-year time period (2005–2016);
- TMY-52ds: TMY from PVGIS 5.2, generated from the 12-year time period (2005–2016), with the temperature downscaling procedure applied.
The comparisons were performed for the following pairs of data sets:
- TMY-GS (tested data) against GS (reference data);
- TMY-52 (tested data) against GS (reference data);
- TMY-52ds (tested data) against GS (reference data);
- TMY-52ds (tested data) against TMY-52 (reference data).
In order to compare the above-mentioned pairs of data sets, the tests based on the MB and RMSE for time series of daily average values of T and tests based on HDDs and CDDs were adopted.
3.4.1. Comparisons Based on MB and RMSE for Daily Average T—Data Sets with Downscaled Temperature
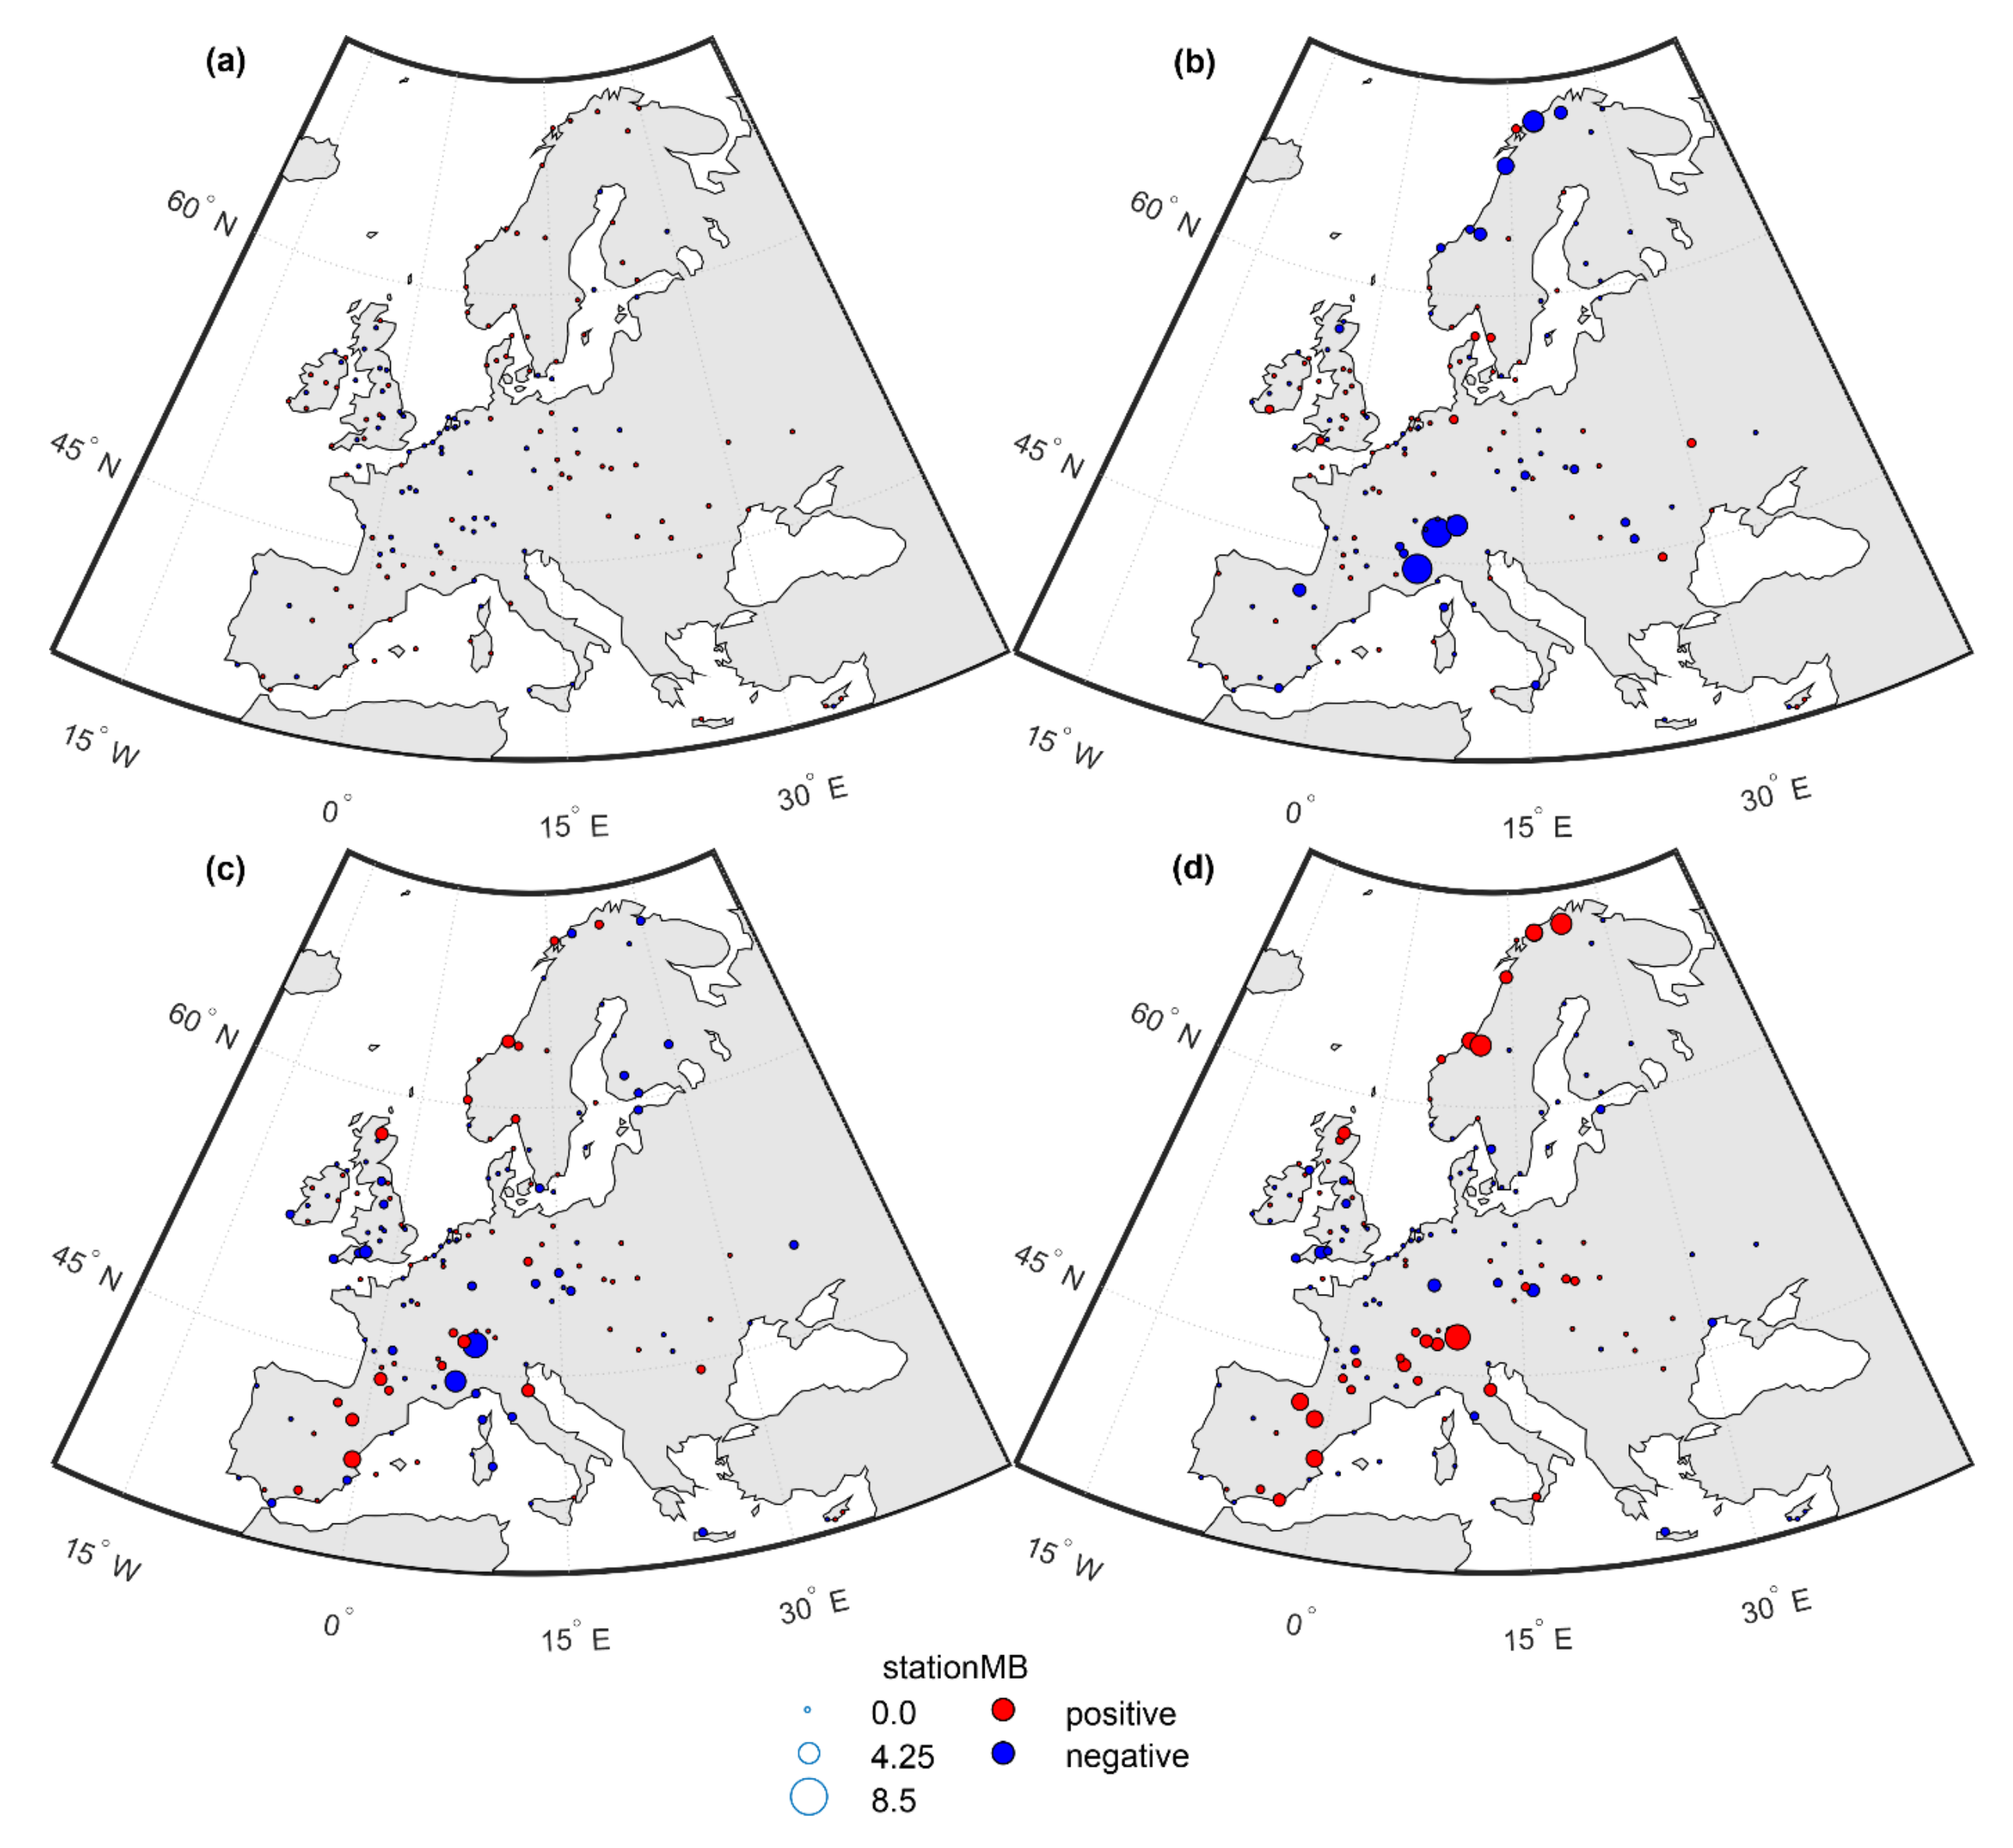
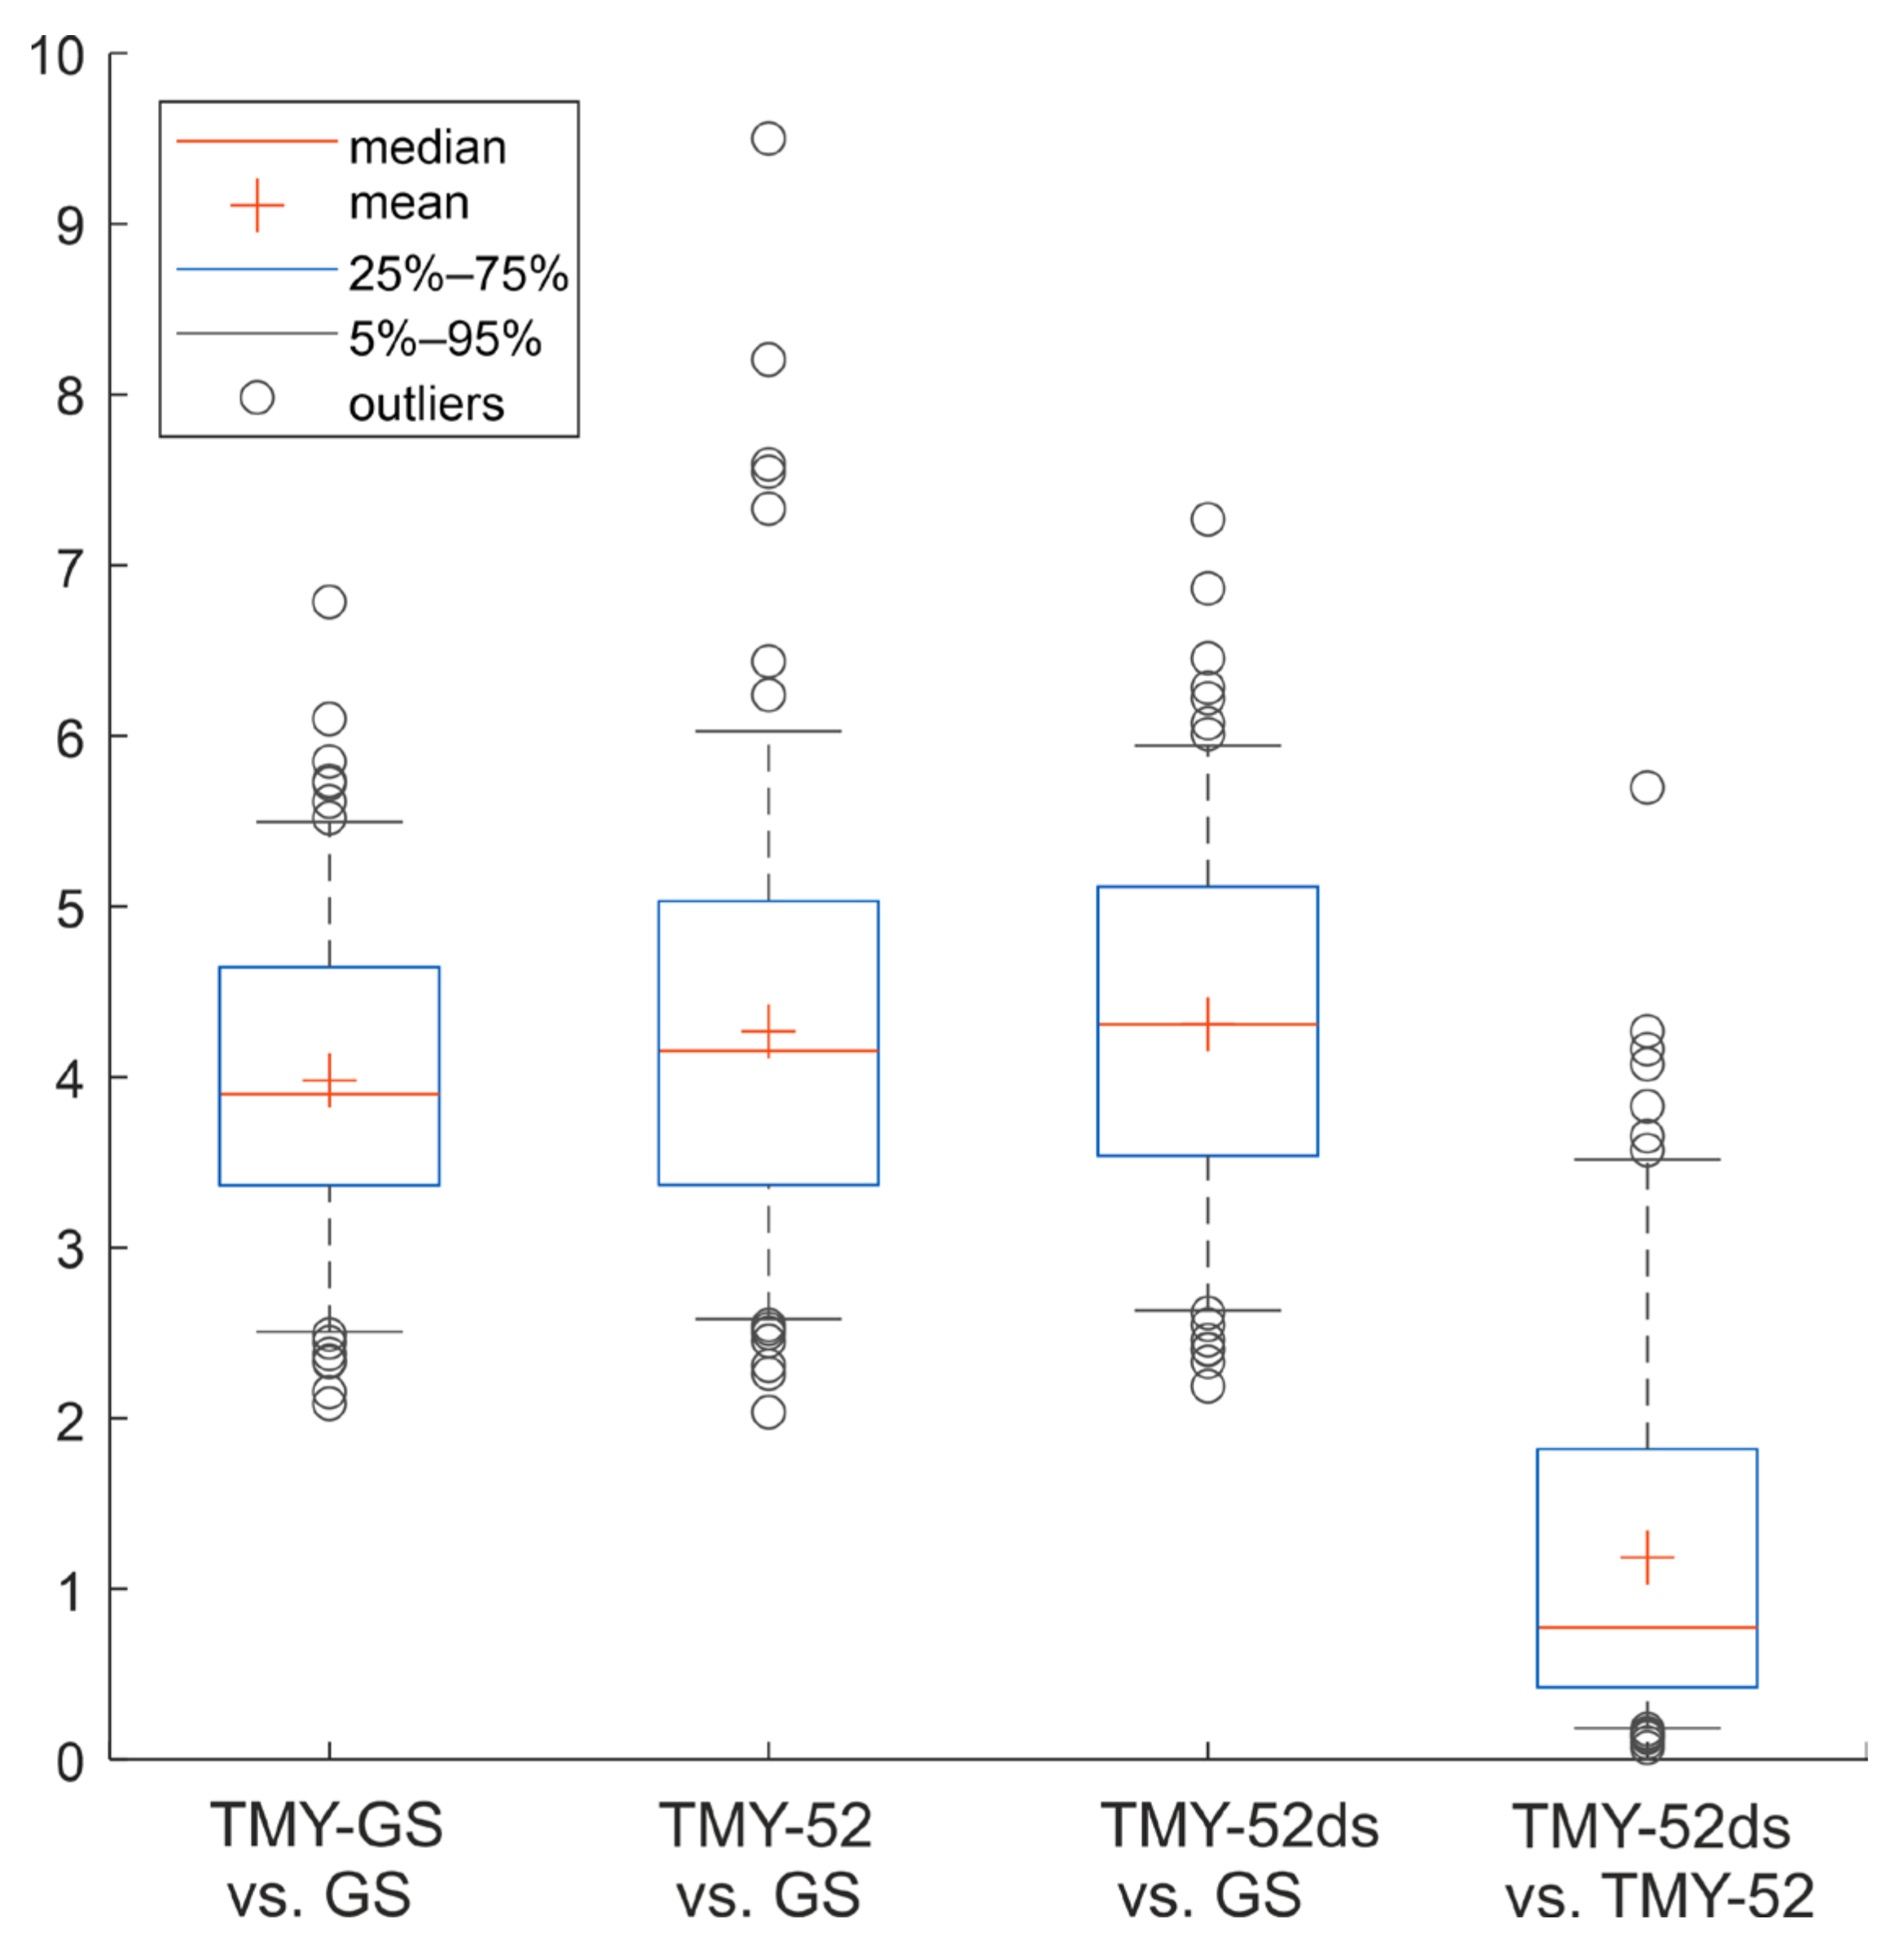
The spatial distribution of the stationMB values observed for the TMY-52ds vs. GS pair of data sets shows many locations where the stationMB decreases (compared to the TMY-52 vs. GS pair of data sets). This is especially visible in the north of Norway and in the Alps—i.e., the places where substantial differences between TMY-52 and GS were detected. However, comparing the TMY-52ds vs. GS pair of data sets to the TMY-52 vs. GS pair of data sets, one can see that there are many locations where the stationMB slightly increases, e.g., in Spain and the United Kingdom, in Central Europe (Poland and Germany), and on the coast of the Mediterranean Sea (Figure 13b,c). Surprisingly, TMY-52ds performs generally worse than TMY-52, but the difference is very small: TMY-52ds produces an mRMSE value of 4.31 (for TMY-52ds vs. GS), while TMY-52 produces an mRMSE value of 4.27 (for TMY-52 vs. GS) (Table 5). On the other hand, in the TMY-52ds vs. GS pair of data sets, the dispersion of the stationRMSE values is smaller (than in the TMY-52 vs. GS) (Figure 14). Figure 15 shows that TMY-52ds reduces the size of the stationRMSE in places with large elevation differences, but simultaneously, it slightly increases the stationRMSE values across Europe.
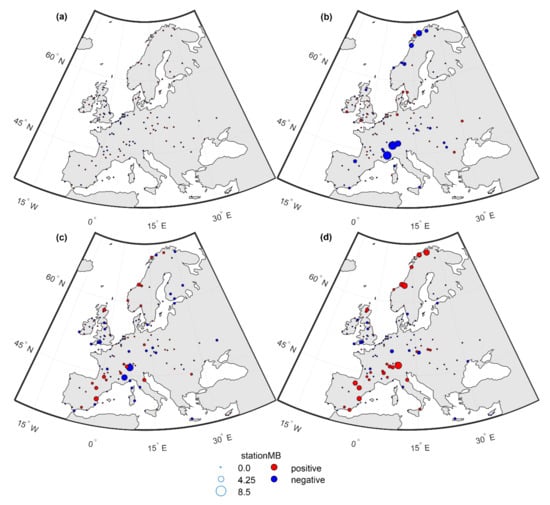
Figure 13.
StationMB for daily average values of T, on the basis of four comparisons: TMY-GS vs. GS (a), TMY-52 vs. GS (b), TMY-52ds vs. GS (c), and TMY-52ds vs. TMY-52 (d).
Table 5.
mRMSE, maximum stationRMSE, minimum stationRMSE, and the number of stations with insignificant (α = 0.05) differences between tested and reference data sets (a) for daily average values of T, on the basis of four comparisons: TMY-GS vs. GS, TMY-52 vs. GS, TMY-52ds vs. GS, and TMY-52ds vs. TMY-52.
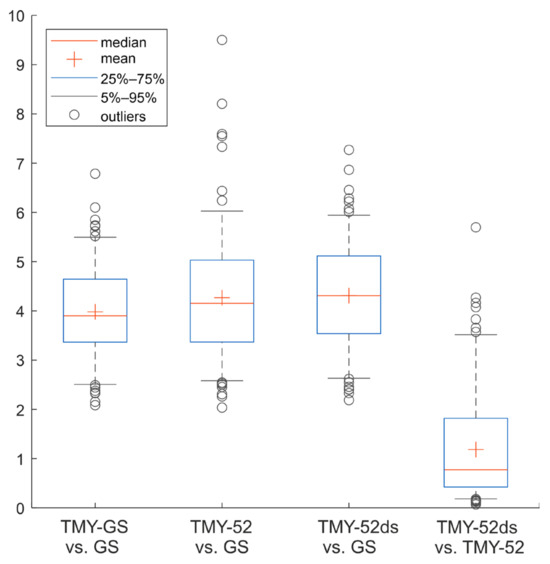
Figure 14.
Statistical distributions of stationRMSE for daily average values of T, on the basis of four comparisons: TMY-GS vs. GS, TMY-52 vs. GS, TMY-52ds vs. GS, and TMY-52ds vs. TMY-52.
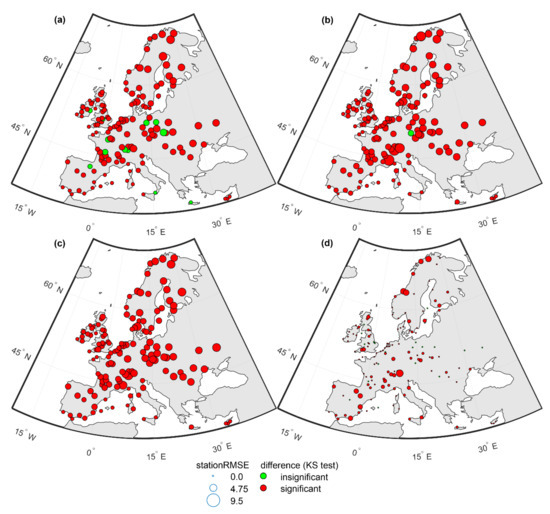
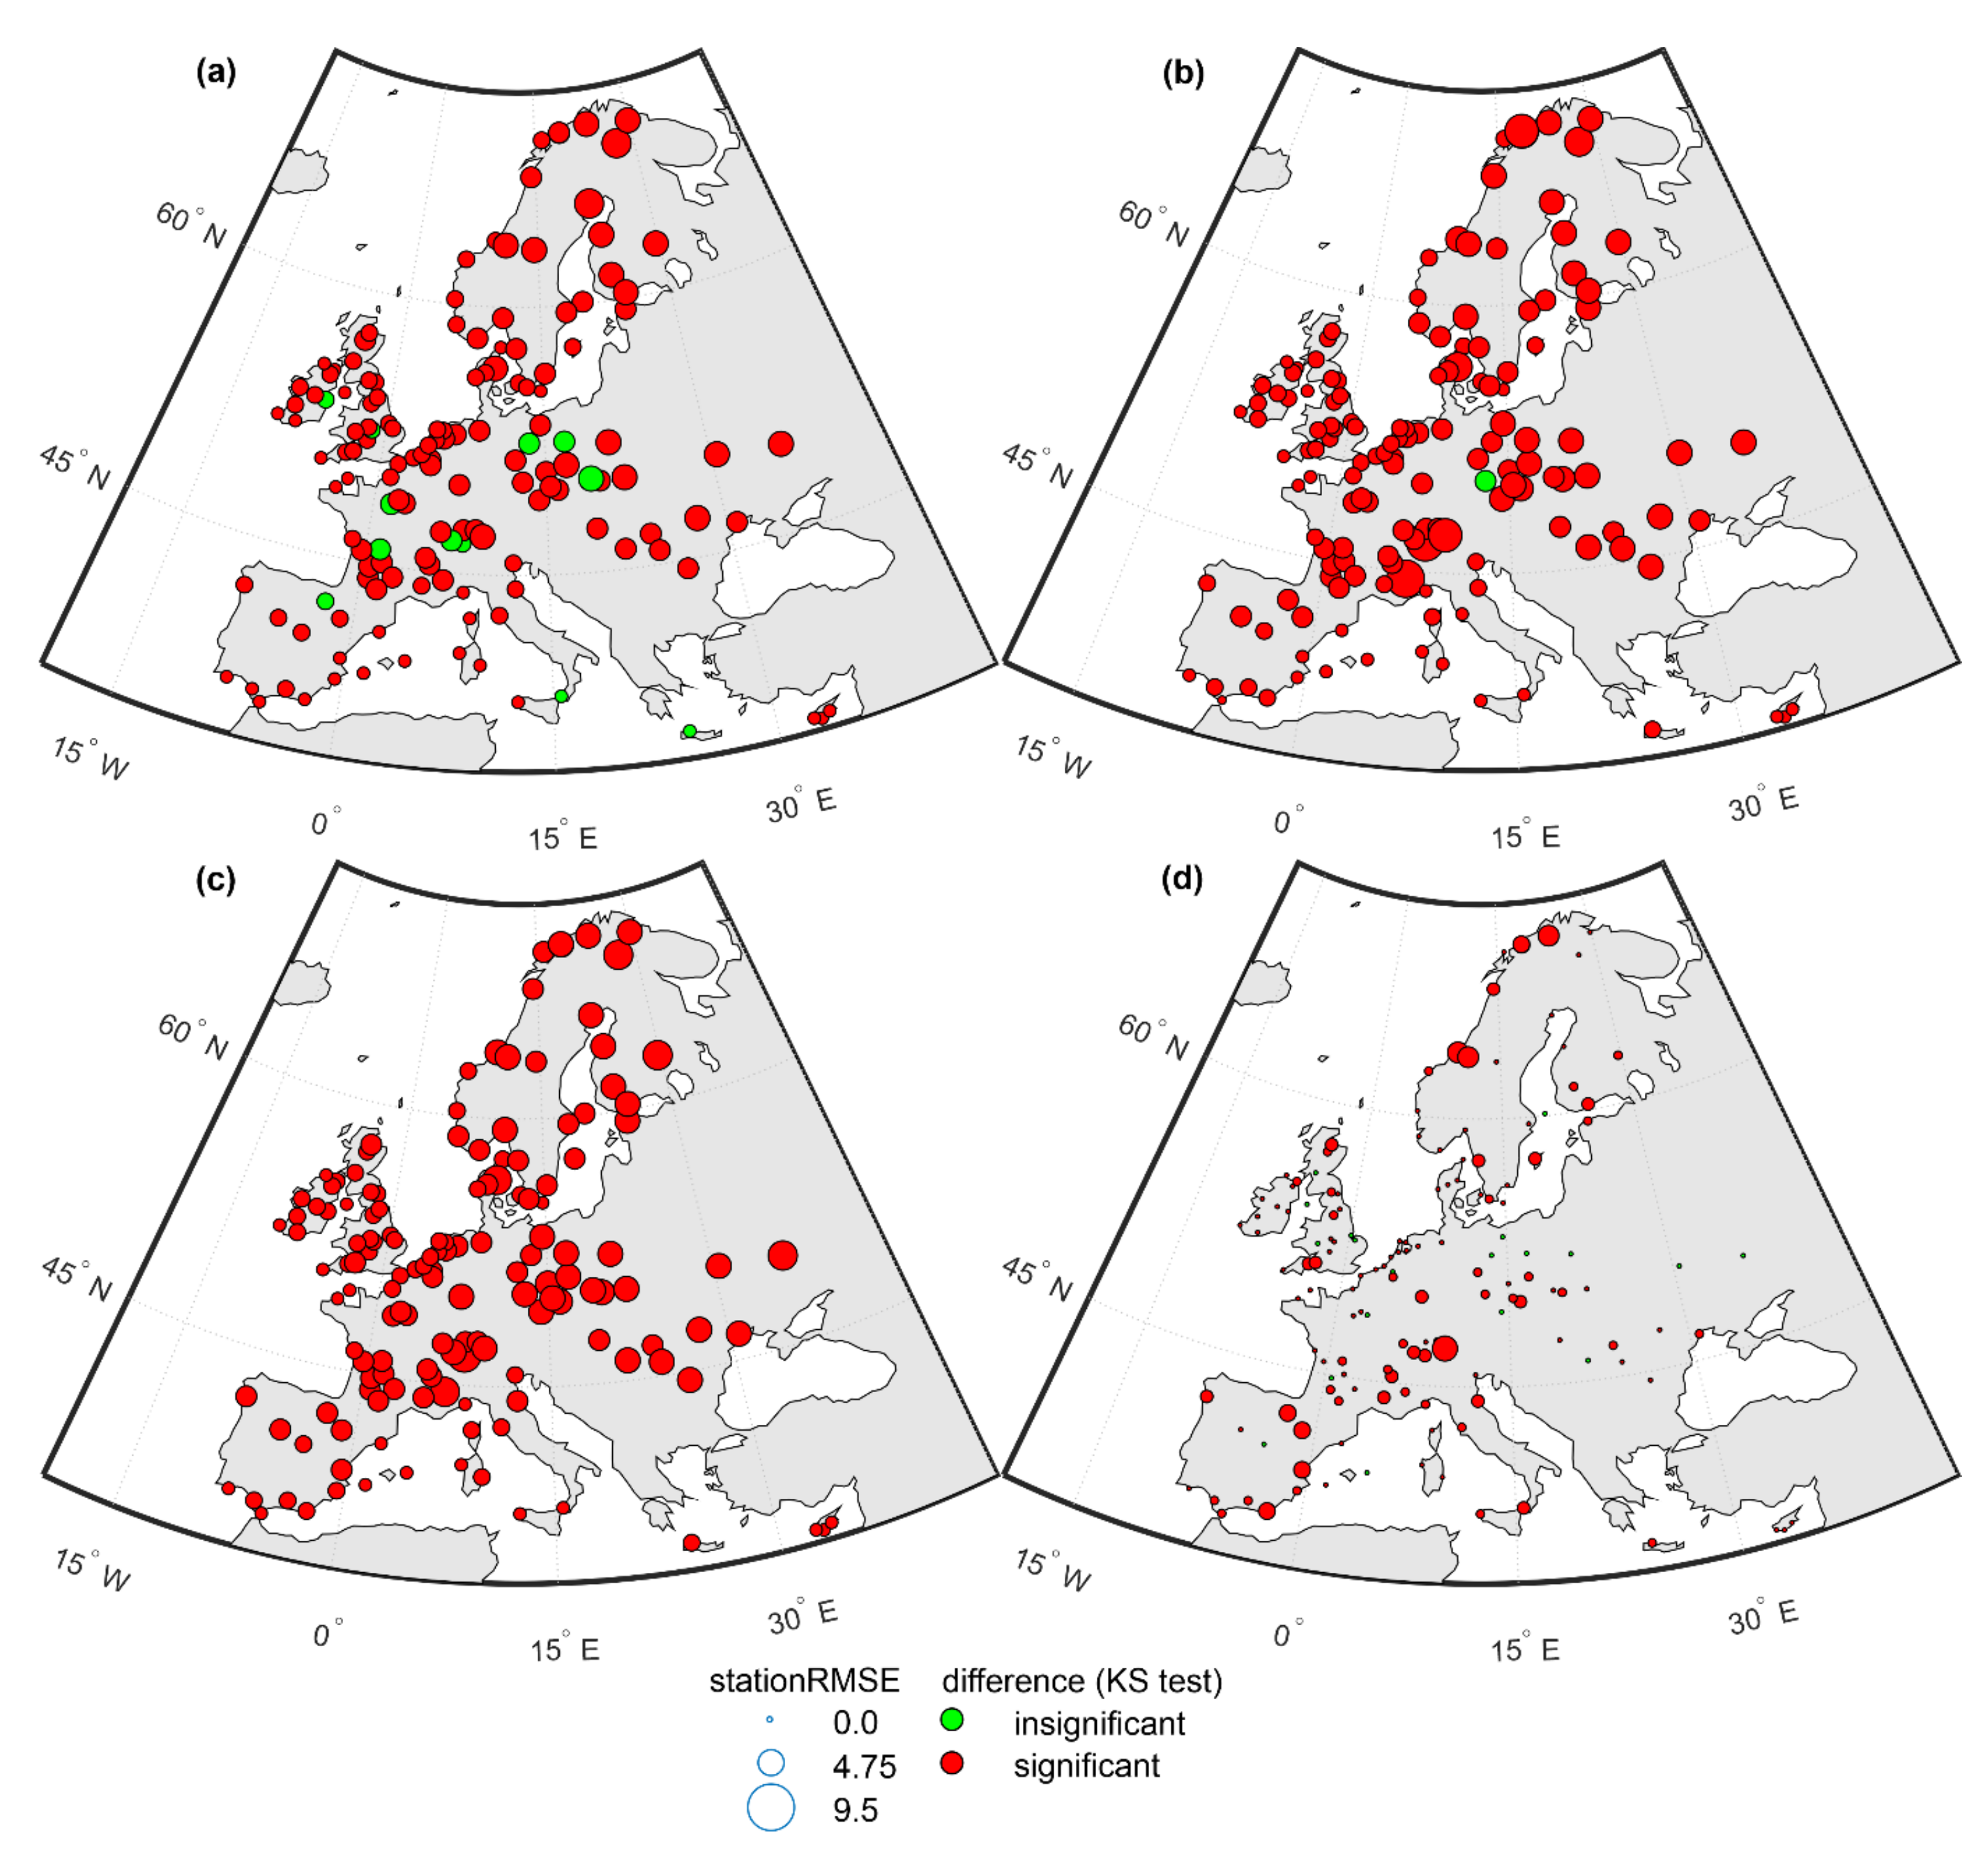
Figure 15.
StationRMSE for daily average values of T, on the basis of four comparisons: TMY-GS vs. GS (a), TMY-52 vs. GS (b), TMY-52ds vs. GS (c), and TMY-52ds vs. TMY-52 (d).
3.4.2. Comparisons Based on HDDs and CDDs—Data Sets with Downscaled Temperature
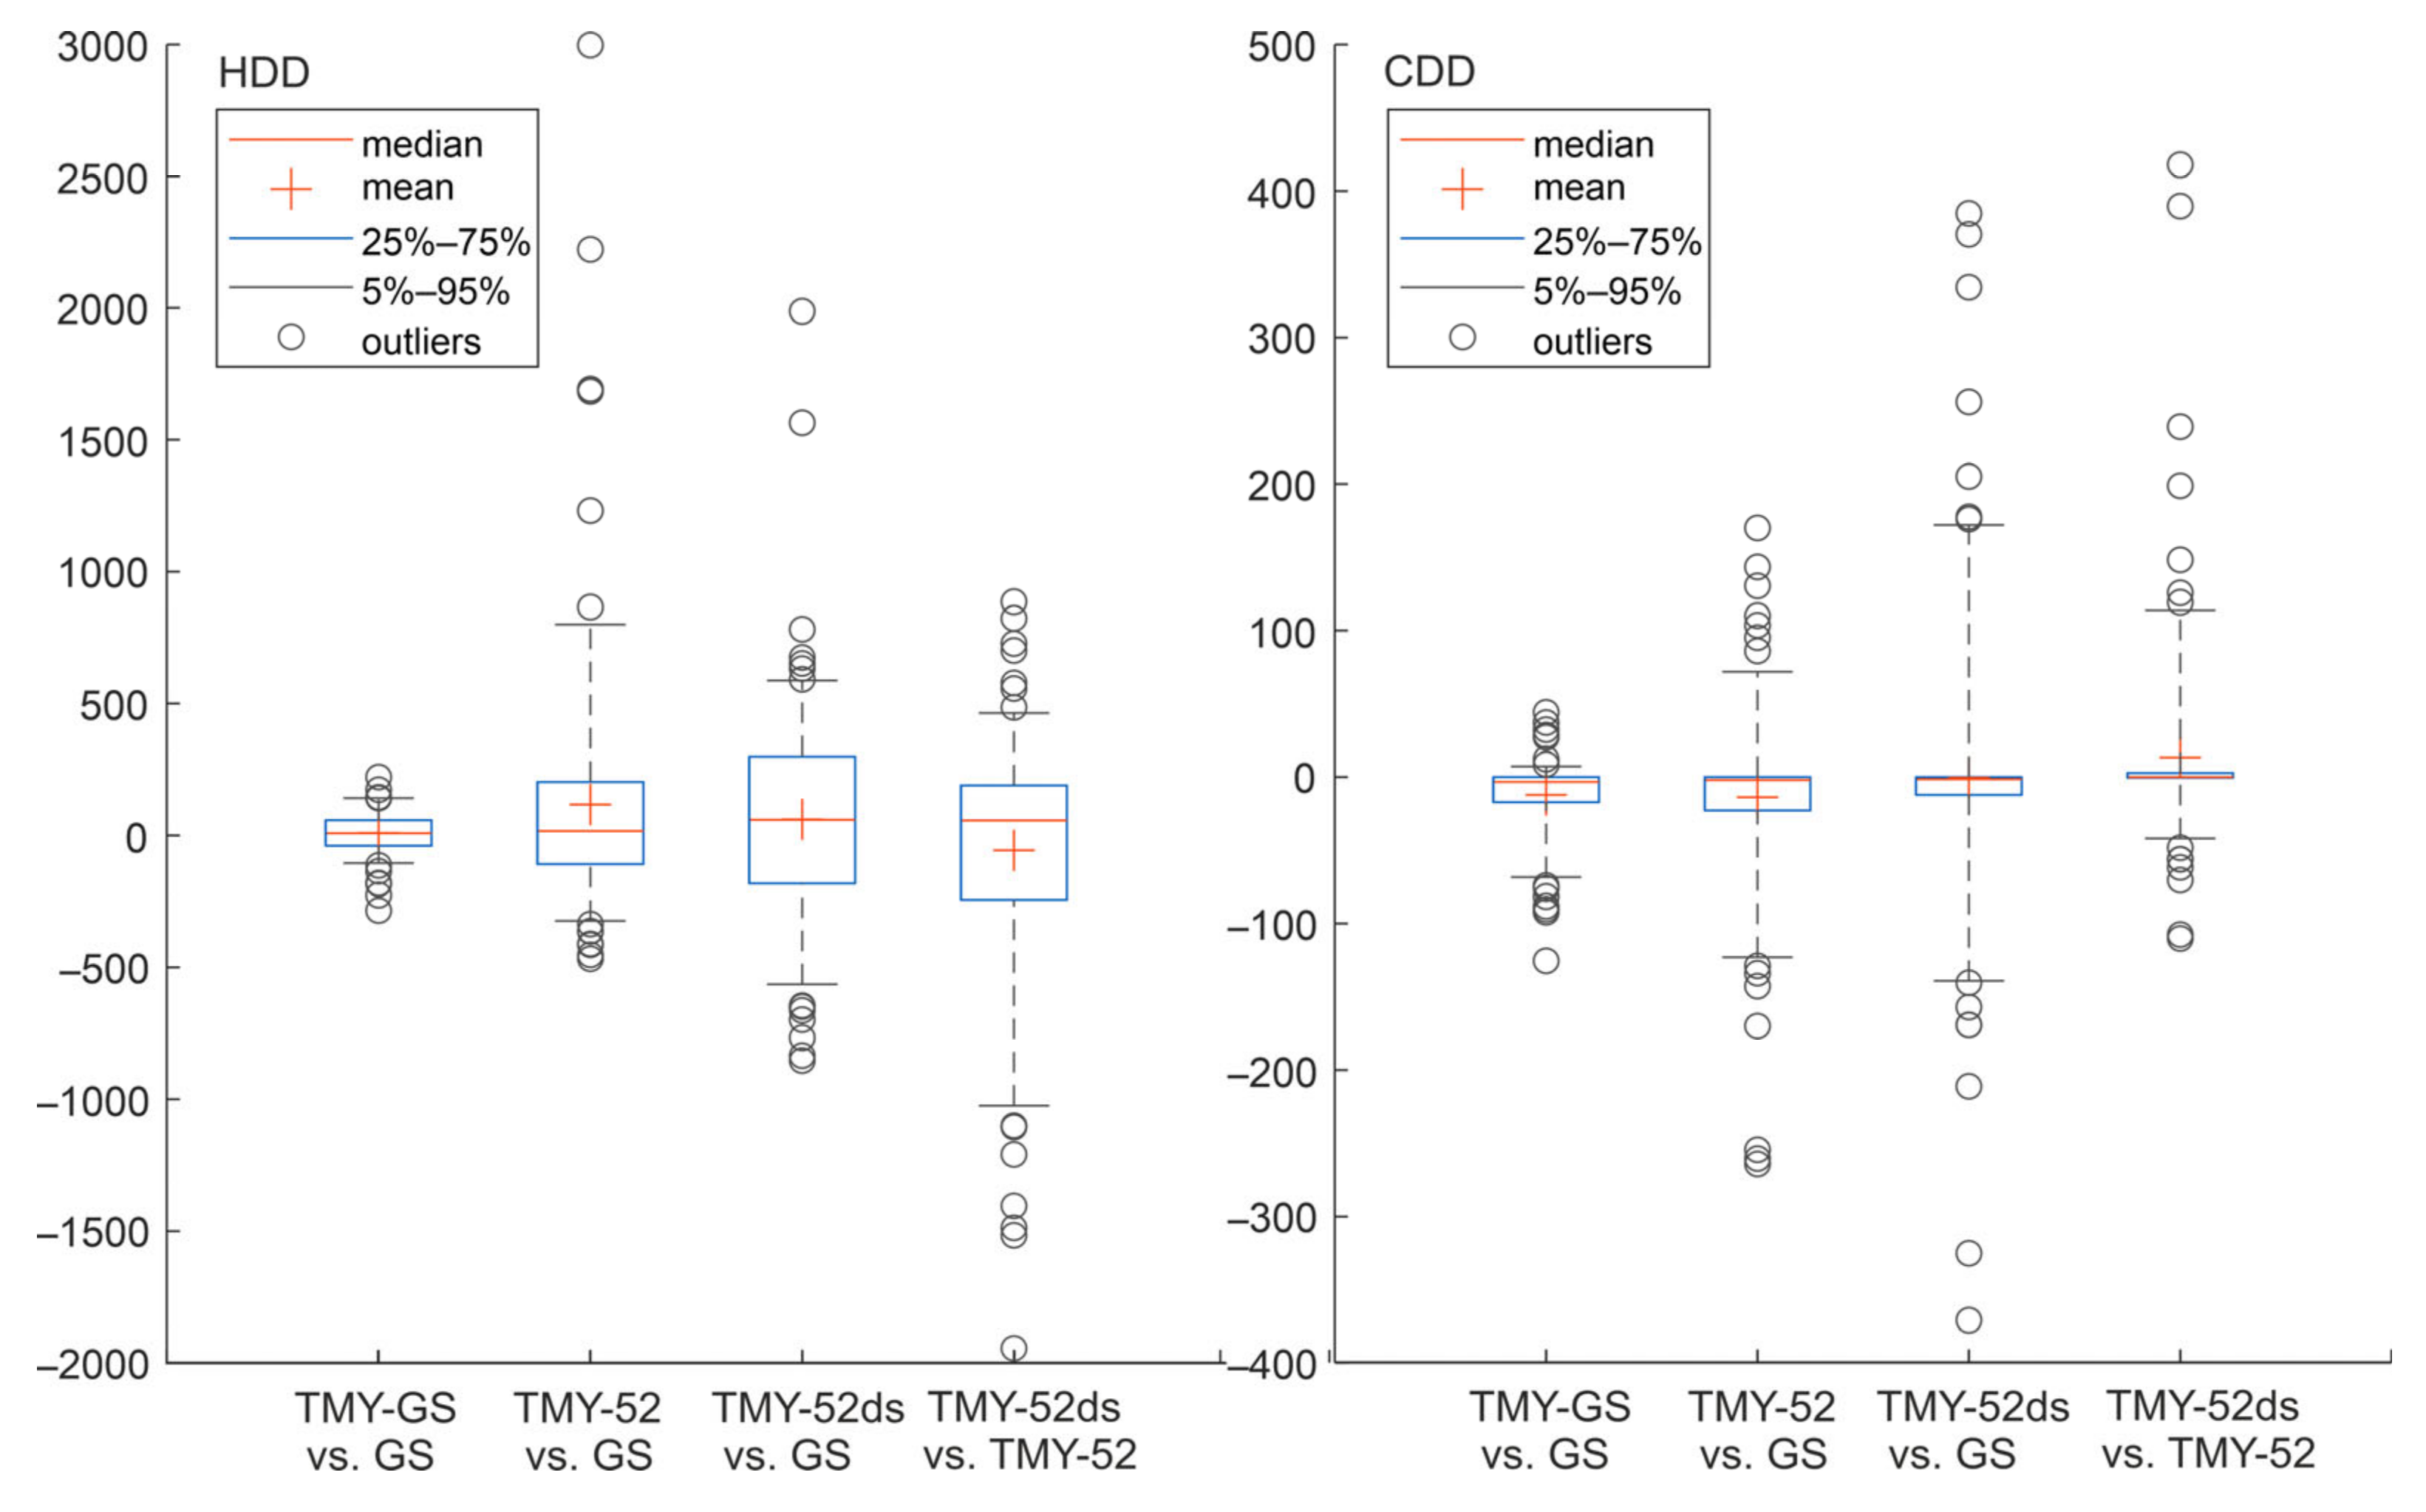
The temperature-downscaled TMY-52ds produces an RMSE value of the HDD differences of 394.73 (for TMY-52ds vs. GS), while the non-downscaled version, TMY-52, produces an RMSE value of 471.93 (for TMY-52 vs. GS) (Table 6). However, the reduction in the RMSE value in TMY-52ds seems to be strongly influenced by a significant reduction in HDD differences at a small number of stations. Apart from these outliers, the dispersion of the HDD differences in TMY-52ds is bigger than the dispersion of HDD differences in TMY-52 (Figure 16). Thanks to the temperature downscaling, the exceptionally big positive HDD differences between TMY-52 and GS that occurred in the Alps and in northern Norway are significantly reduced in the TMY-52ds vs. GS pair of data sets (Figure 17b,c). However, apart from the locations where the HDD differences decreased, there are places where the differences in HDDs slightly increased—these are mostly in Central Europe and the United Kingdom (Figure 17d).
Table 6.
Mean Bias (MB) and Root Mean Square Error (RMSE) calculated on the basis of tested HDD (CDD) data set and reference HDD (CDD) data set for TMY-GS vs. GS, TMY-52 vs. GS, TMY-52ds vs. GS, and TMY-52ds vs. TMY-52.
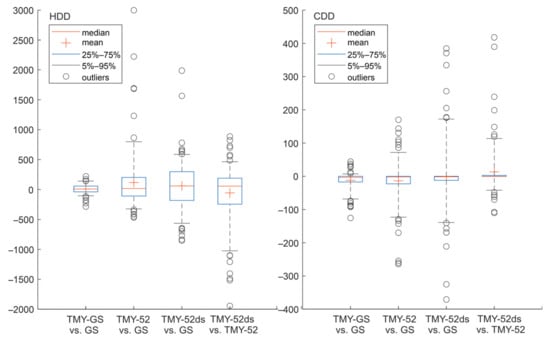
Figure 16.
Statistical distributions of HDD (left) and CDD (right) differences calculated on the basis of TMY-GS vs. GS, TMY-52 vs. GS, TMY-52ds vs. GS, and TMY-52ds vs. TMY-52.
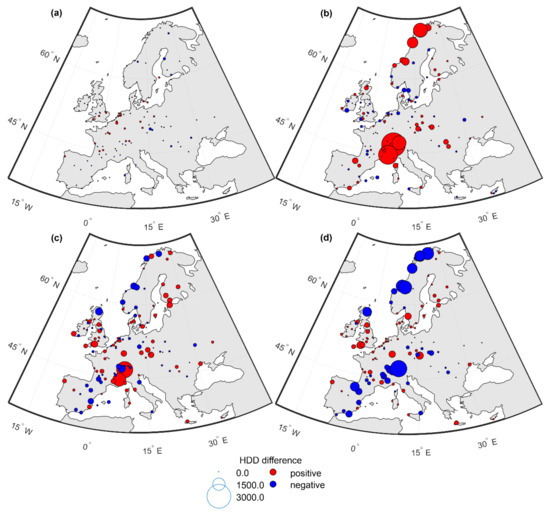
Figure 17.
HDD differences calculated on the basis of TMY-GS vs. GS (a), TMY-52 vs. GS (b), TMY-52ds vs. GS (c), and TMY-52ds vs. TMY-52 (d).
On the other hand, the differences in CDD values show a different picture. In general, the MB value for the TMY-52 vs. GS pair of data sets was −13.85, meaning that TMY-52 tends to underestimate the CDD value. This in turn means that TMY-52 generally underestimates the high temperatures. On the contrary, the MB value for the TMY-52ds vs. GS pair of data sets is very low (−0.50). However, the RMSE value for the TMY-52ds vs. GS pair of data sets was 88.16, while it was lower (60.57) for the TMY-52 vs. GS pair of data sets (Table 6). Comparing TMY-52ds to TMY-52, one can see that TMY-52ds produces bigger CDD differences (Figure 18d), which results in a positive overall MB value of 13.35 (Table 6).
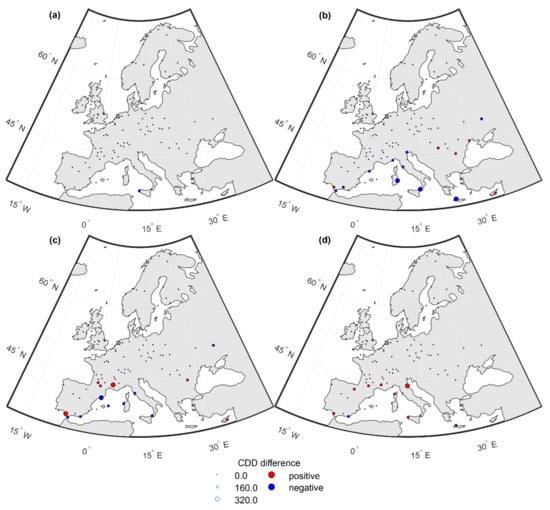
Figure 18.
CDD differences calculated on the basis of TMY-GS vs. GS (a), TMY-52 vs. GS (b), TMY-52ds vs. GS (c), and TMY-52ds vs. TMY-52 (d).
4. Discussion and Conclusions
PVGIS 5.2, the newest release of the PVGIS Online Tool provided by the Joint Research Centre, includes substantial improvements compared to the previous version 5.1: the update of the underlying data sets both in terms of quality and resolution and the extension of the time period used. This paper focused on comparing the TMYs coming from PVGIS 5.2 and 5.1 with the TMY produced on the basis of ground station meteorological data and with the ground station data itself.
To this end, the comparative time series of 147 ground stations’ data and TMY data were prepared. In order to compare the data sets, a number of statistical methods were used. For each of the 147 stations, the Mean Bias and Root Mean Square Error of the average daily temperature values were calculated. Their spatial distribution was presented, as well as their statistical measures of central tendency and dispersion. All this was investigated for air temperature, i.e., the meteorological element essential for calculating the energy performance of buildings. Additionally, the heating and cooling degree days (HDDs and CDDs) were investigated in detail. However, other meteorological elements—dew point temperature (Td) and wind speed and direction (WS and WD)—are also important and should be investigated further in the future. Analyses performed for GHI can be found in Gracia et al. [24]. It would be also helpful to prepare additional analyses on the basis of averaged series of monthly values instead of daily or hourly values. Such averaged time series blur some inhomogeneities and errors in the data sets, which are often the reason for the poor results of individual tests. This refers particularly to the results of the nonparametric Kolmogorov–Smirnov test for the equality of distributions, which was performed on a daily basis. Because of the very big sample sizes, it gave relatively poor results. Such statistical testing should be additionally performed on a monthly basis.
Generally, in almost all of the comparisons—regarding the T, HDDs, and CDDs—the ground-based TMY performs better than TMY-51 or TMY-52, as to be expected. Regarding T, this study shows that TMY-52 performs generally slightly worse than TMY-51. Although there are many locations where the stations’ biases decreased (e.g., the Mediterranean Sea coastal stations), there are also some stations where the biases increased. This is especially visible in places with complicated topography (e.g., in the Alps) and the northwestern parts of Norway. In general, TMY-52, which is based on ERA5-Land reanalysis, tends to underestimate the temperature values registered by the ground station data sets in nearby locations. As TMY-52 performs worse than TMY-51 regarding HDDs, while better than TMY-51 regarding CDDs, it seems that the problem concerns mostly low temperatures. It should be noted, however, that the worse performance of TMY-52 (as compared to TMY-51) is mainly induced by the few outlying stations. At a vast majority of the remaining stations, the TMY-52 performs similarly to TMY-51.
Thanks to the temperature downscaling, the biggest outliers in HDD differences (e.g., the outlying stations in the Alps and in the north of Norway) were significantly reduced in size. However, at the same time, the smallest HDD differences slightly increased. Thus, the dispersion of the HDD differences in temperature-downscaled TMY-52ds is smaller than in the original TMY-52, but the overall performance of TMY-52ds is slightly worse than the original TMY-52. In other words, applying the temperature downscaling procedure helps to reduce the biggest outliers in T but introduces small biases to the rest of the T values. This is not surprising, as the procedure of temperature downscaling itself is an additional manipulation of source data, which constitutes a certain source of uncertainty. Therefore, it should be applied only to selected locations, where the initial biases in the values of T (or HDDs) are big. In the future, additional analyses should be conducted to indicate the characteristics of locations benefitting from the temperature downscaling procedure and the locations that do not take advantage of this.
Since ERA5-Land, based on which the TMY-52 is prepared, seems to significantly underestimate low temperature values, as compared to ground station, ERA-Interim, and ERA5 values, it is also essential to research further its implications on PVGIS TMY 5.2 performance. The differences between ERA-Interim, ERA5, and ERA5-Land could be partly explained by the fact that the ground stations in mountainous areas used in this study could be located at lower altitudes than the exact location of the points from the reanalysis sources, as ground stations tend to be located at a lower altitude than the average terrain height in their vicinity. In fact, there are recent analyses indicating a warm bias in ERA5 when it is taken into consideration that observations are located at lower elevations than the background elevation (see slides 20–22 in https://ecmwfevents.com/assets/presentations/as2023-simmons1694099093.pdf, accessed on 20 October 2023). Additionally, it is also known that ERA-Interim has larger local positive and negative biases, which tend to cancel each other out; so, ERA-Interim rather fortuitously appears better in global averages (see Section 3.1.4 of ECMWF’s Technical Memo 881, https://www.ecmwf.int/sites/default/files/elibrary/2021/19911-low-frequency-variability-and-trends-surface-air-temperature-and-humidity-era5-and-other.pdf, accessed on 20 October 2023). One should not forget the downscaling performed in PVGIS 5.1 on the temperature data extracted from ERA-Interim. In future analyses, allowances for the differences between ground station altitude and the height of the ERA5 model orography should be performed.
When it comes to the reference time period, it seems that applying an extended time period (2005–2020) does not significantly improve the overall quality of T in the final TMY data sets. Indeed, the length of the time period, based on which TMY is prepared, constitutes a very important source of uncertainty. In this study, the TMYs were obtained on the basis of a 12-year data series (or 16-year, for the extended time period), while it takes approximately 30 years to fully characterise the climatic conditions for a given site. If appropriately long data series are available, all shorter weather variations, such as sunspot cycles or volcanic eruptions, are included, and a proper TMY can be constructed. For shorter data sets, such as 15 years or less, the percentage of total records influenced by these episodic events increases [34].
It is also essential to mention that the generation of the TMY may itself cause a deviation from the results one would obtain when using the full multi-annual data set. Indeed, the differences between the performance of individual TMYs (TMY-GS, TMY-51, and TMY-52) are many times smaller than the differences between any TMY and GS. Since the TMY purposely excludes information about anomalous or extreme weather conditions, determining, e.g., the photovoltaic system energy production on this basis can give results that are different from the actual ones. There are some recent results showing that TMY data sets should not be considered as a proper alternative to long-term measured data. Some studies show the limitations of using the TMY instead of long-term data [15,34,35,36,37]. It is an argument for the use of longer time series instead of relying on TMY data. Nowadays, when the speed of computers is no longer a barrier, increasingly often analyses such as building energy efficiency calculations can be prepared on the basis of gridded data derived from meteorological reanalyses.
It should be remembered that in this study only the points representing ground measurement stations were compared. In realistic use cases, the calculations of building performance can be conducted not only for locations that are precisely those of the measurement stations but also for places at some distance from the nearest station. The dense spatial resolution of ERA5-Land (approx. 9 km), based on which the TMY-52 is produced, is an undeniable advantage.
Although the PVGIS 5.2 has been improved substantially—both in terms of the resolution of the data and the extension of the time period used—as compared to the PVGIS 5.1, certain limitations of the newest version 5.2 are noticeable. Because calculating the energy performance of buildings requires high-quality temperature data, it is very important to know these deficiencies before running the calculations.
Author Contributions
Conceptualization, K.K., A.M. and N.T.; methodology, K.K.; software, K.K. and A.M.; formal analysis, K.K.; data curation, K.K.; writing—original draft preparation: K.K.; writing—review and editing, K.K., A.M. and N.T.; visualization, K.K.; supervision, N.T. and A.M.; interpreting results: K.K., A.M. and N.T.; funding acquisition, A.M. and N.T. All authors have read and agreed to the published version of this manuscript.
Funding
Kinga Kulesza performed part of this work under the European Commission Joint Research Centre Expert Contract CT-EX2022D698415-101. The APC was funded by the European Commission.
Institutional Review Board Statement
Not applicable.
Informed Consent Statement
Not applicable.
Data Availability Statement
The original ISD-Lite data are available at https://www.ncei.noaa.gov/pub/data/noaa/isd-lite/ (accessed on 1 March 2023). The original SARAH-2 data are available at wui.cmsaf.eu (accessed on 1 March 2023). The original TMY 5.1 and TMY 5.2 data are available at https://joint-research-centre.ec.europa.eu/pvgis-online-tool_en (accessed on 1 March 2023). The original ERA-Interim, ERA5, and ERA5-Land data are available at https://cds.climate.copernicus.eu (accessed on 1 March 2023). The data were generated using original and modified Copernicus Climate Change Service information.
Acknowledgments
The authors would like to thank the ECMWF colleagues, in particular Adrian Simmons, for their help in understanding the differences observed in temperature values between the different reanalysis products.
Conflicts of Interest
The authors declare no conflict of interest.
Abbreviations
| API | Application Programming Interface |
| CDD | Cooling degree day |
| CMSAF | Satellite Application Facility for Climate Modelling |
| DEM | Digital Elevation Model |
| ECMWF | European Centre for Medium-Range Weather Forecasts |
| ERA5 | The fifth generation of ECMWF reanalysis for the global climate and weather |
| ERA5-Land | The fifth generation of ECMWF reanalysis for the global climate and weather at an enhanced resolution compared to ERA5 |
| GHI | Global horizontal irradiance |
| GRASS | Geographic Resource Analysis Support System |
| GS | Ground stations data set |
| GSL | Ground stations data set for an extended time period (2005–2020) |
| HDD | Heating degree day |
| ISD-Lite | Integrated Surface Database |
| ISO | International Organization for Standardization |
| MB | Mean Bias |
| mRMSE | Mean value of Root Mean Square Error |
| NOAA | National Oceanic and Atmospheric Administration |
| PVGIS | Photovoltaic Geographical Information System |
| RMSE | Root Mean Square Error |
| SARAH-1 | Surface Solar Radiation Data Set—Heliosat, Edition 1 |
| SARAH-2 | Surface Solar Radiation Data Set—Heliosat, Edition 2 |
| SLP | Sea level pressure |
| SRTM | Shuttle Radar Topography Mission |
| stationMB | Mean Bias for an individual station |
| stationRMSE | Root Mean Square Error for an individual station |
| SYNOP | Surface synoptic observations |
| T | 2-metre air temperature |
| Td | 2-metre dew point temperature |
| TMY | Typical meteorological year |
| TMY-GS | Typical meteorological year on the basis of ground station data set |
| TMY-GSL | Typical meteorological year on the basis of ground station data set for an extended time period (2005–2020) |
| TMY-51 | PVGIS 5.1 typical meteorological year data set |
| TMY-52 | PVGIS 5.2 typical meteorological year data set |
| TMY-52ds | PVGIS 5.2 typical meteorological year data set with temperature downscaled |
| TMY-52L | PVGIS 5.2 typical meteorological year data set for an extended time period (2005–2020) |
| WS | Wind speed |
| WD | Wind direction |
References
- Hone, T.Z.; Chang, W.K.; Line, H.W. A Sensitivity Study of Building Performance using 30-Year Actual Weather Data. In Proceedings of the 13th International Conference of the International-Building-Performance-Simulation-Association (IBPSA), Chambery, France, 11 July 2013. [Google Scholar]
- Kim, Y.; Jang, H.K.; Yu, K.H. Study on Extension of Standard Meteorological Data for Cities in South Korea Using ISO 15927-4. Atmosphere 2017, 8, 220. [Google Scholar] [CrossRef]
- Qiao, Q.Y.; Yunusa-Kaltungo, A.; Edwards, R. Predicting Building Energy Consumption based on Meteorological Data. In Proceedings of the 7th Annual IEEE PES/IAS PowerAfrica Conference (PAC)—Sustainable and Smart Energy Revolutions for Powering Africa, Nairobi, Kenya, 25–28 August 2020. [Google Scholar]
- Üner, M.; İleri, A. Typical weather data of main Turkish cities for energy applications. Int. J. Energy Res. 2000, 24, 727–748. [Google Scholar] [CrossRef]
- Bulut, H. Typical solar radiation year for southeastern Anatolia. Renew. Energy 2004, 29, 1477–1488. [Google Scholar] [CrossRef]
- Zhou, J.; Wu, Y.; Yan, G. Generation of typical solar radiation year for China. Renew. Energy 2006, 31, 1972–1985. [Google Scholar] [CrossRef]
- Gawin, D.; Kossecka, E. (Eds.) Typowy rok Meteorologiczny do Symulacji Wymiany Ciepła i Masy w Budynkach (Typical Meteorological Year for Simulating Heat and Mass Transfer in Buildings); Drukarnia Wydawnictw Naukowych: Łódź, Poland, 2002. [Google Scholar]
- Hall, I.; Prairie, R.R.; Anderson, H.E.; Boes, E.C. Generation of a Typical Meteorological Year; Sandia Labs: Albuquerque, NM, USA, 1978. [Google Scholar]
- Wilcox, S.; Marion, W. Users Manual for TMY3 Data Sets; National Renewable Energy Laboratory: Golden, CO, USA, 2008.
- Skeiker, K. Comparison of methodologies for TMY generation using 10 years data for Damascus, Syria. Energy Convers. Manag. 2007, 48, 2090–2102. [Google Scholar] [CrossRef]
- Yang, D.; Gueymard, C.A. Producing high-quality solar resource maps by integrating high- and low-accuracy measurements using Gaussian processes. Renew. Sustain. Energy Rev. 2019, 113, 109260. [Google Scholar] [CrossRef]
- Crow, L.W. Weather year for energy calculations. ASHRAE J. 1984, 26, 42–47. [Google Scholar]
- Lund, H.; Eidorff, E. Selection Methods for Production of Test Reference Years; Technical University of Denmark, Department of Buildings and Energy: Kongens Lyngby, Denmark, 1985. [Google Scholar]
- EN ISO 15927-4; Hygrothermal Performance of Buildings—Calculation and Presentation of Climatic Data—Part 4: Data for Assessing the Annual Energy for Cooling and Heating Systems. CEN: Brussels, Belgium, 2003.
- Kulesza, K. Comparison of typical meteorological year and multi-year time series of solar conditions for Belsk, central Poland. Renew. Energy 2017, 113, 1135–1140. [Google Scholar] [CrossRef]
- Garcia, I.; Torres, J.L. Assessment of the adequacy of EN ISO 15927-4 reference years for photovoltaic systems. Prog. Photovolt. 2015, 23, 1956–1969. [Google Scholar] [CrossRef]
- Couce-Casanova, A.; Lopez-De Ullibarri, I.; Lamas-Galdo, M.; Rodríguez-García, J. Creation of a typical meteorological year in Spain. Step by step application of the method based on UNE-EN ISO-15927-4:2011. Dyna 2022, 97, 620–624. [Google Scholar] [CrossRef]
- Ruduks, M.; Lesinskis, A. Test Reference Year of Riga, Latvia. In Proceedings of the 6th International Scientific Conference on Research for Environment and Civil Engineering Development (Civil Engineering), Jelgava, Latvia, 2–3 November 2017. [Google Scholar]
- Huld, T.; Paietta, E.; Zangheri, P.; Pascua, I.P. Assembling Typical Meteorological Year Data Sets for Building Energy Performance Using Reanalysis and Satellite-Based Data. Atmosphere 2018, 9, 53. [Google Scholar] [CrossRef]
- ISD-Lite. Integrated Surface Database Archive; NOAA: Silver Spring, MD, USA, 2006.
- Smith, A.; Lott, N.; Vose, R. The Integrated Surface Database: Recent Developments and Partnerships. Bull. Am. Meteorol. Soc. 2011, 92, 704–708. [Google Scholar] [CrossRef]
- Pfeifroth, U.; Kothe, S.; Müller, R.; Trentmann, J.; Hollmann, R.; Fuchs, P.; Werscheck, M. Surface Radiation Data Set—Heliosat (SARAH)—Edition 2. Satellite Application Facility on Climate Monitoring; EUMESAT: Darmstadt, Germany, 2017. [Google Scholar]
- Posselt, R.; Müller, R.W.; Stöckli, R.; Trentmann, J. Remote sensing of solar surface radiation for climate monitoring—The CM-SAF retrieval in international comparison. Remote Sens. Environ. 2012, 118, 186–198. [Google Scholar] [CrossRef]
- Gracia Amillo, A.M.; Taylor, N.; Martinez, A.M.; Dunlop, E.D.; Mavrogiorgios, P.; Fahl, F.; Arcaro, G.; Pinedo, I. Adapting PVGIS to Trends in Climate, Technology and User Needs. In Proceedings of the 38th European Photovoltaic Solar Energy Conference and Exhibition (PVSEC), Online, 6–10 September 2021. [Google Scholar]
- Hersbach, H.; Bell, B.; Berrisford, P.; Hirahara, S.; Horanyi, A.; Muñoz-Sabater, J.; Nicolas, J.; Peubey, C.; Radu, R.; Schepers, D.; et al. The ERA5 global reanalysis. Q. J. R. Meteorol. Soc. 2020, 146, 1999–2049. [Google Scholar] [CrossRef]
- Berrisford, P.; Dee, D.P.; Poli, P.; Fielding, B.M.; Fuentes, M.; Kållberg, P.W.; Kobayashi, S.; Uppala, S.; Simmons, A. The ERA-Interim Archive Version 2.0; ECMWF: Reading, UK, 2011. [Google Scholar]
- Dee, D.P.; Uppala, S.M.; Simmons, A.J.; Berrisford, P.; Poli, P.; Kobayashi, S.; Andrae, U.; Balmaseda, M.A.; Balsamo, G.; Bauer, P.; et al. The ERA-Interim reanalysis: Configuration and performance of the data assimilation system. Q. J. R. Meteorol. Soc. 2011, 137, 553–597. [Google Scholar] [CrossRef]
- Huld, T.; Pascua, I.P. Spatial Downscaling of 2-Meter Air Temperature Using Operational Forecast Data. Energies 2015, 8, 2381–2411. [Google Scholar] [CrossRef]
- Pfeifroth, U.; Kothe, S.; Müller, R.; Trentmann, J.; Hollmann, R.; Fuchs, P.; Werscheck, M. Surface Solar Radiation Data Set—Heliosat (SARAH)—Edition 1. Satellite Application Facility on Climate Monitoring; EUMESAT: Darmstadt, Germany, 2015. [Google Scholar]
- Muñoz-Sabater, J.; Dutra, E.; Agusti-Panareda, A.; Albergel, C.; Arduini, G.; Balsamo, G.; Bousetta, S.; Choulga, M.; Harrigan, S.; Hersbach, H.; et al. ERA5-Land: A state-of-the-art global reanalysis dataset for land applications. Earth Syst. Sci. Data 2021, 13, 4349–4383. [Google Scholar] [CrossRef]
- Eurostat. Energy Statistics—Cooling and Heating Degree Days (nrg_chdd); Eurostat: Luxembourg, 2023. [Google Scholar]
- Fortuniak, K.; Kożuchowski, K.; Żmudzka, E. Trendy i okresowość zmian temperatury powietrza w Polsce w drugiej połowie XX wieku (Trends and periodicity of changes in air temperature in Poland in the second half of 20th century). Przegląd Geofiz. 2001, 46, 283–303. [Google Scholar]
- Sanchez-Lorenzo, A.; Wild, M.; Trentmann, J. Validation and stability assessment of the monthly mean CM SAF surface solar radiation dataset over Europe against a homogenized surface dataset (1983–2005). Remote Sens. Environ. 2013, 134, 355–366. [Google Scholar] [CrossRef]
- McMahan, V.A.C.; Grover, C.N. Chapter 5—Bankable Solar-Radiation Datasets. In Solar Energy Forecasting and Resource Assessment; Kleissl, J., Ed.; Academic Press: Boston, MA, USA, 2013; pp. 97–131. [Google Scholar]
- Cebecauer, T.; Suri, M. Typical Meteorological Year Data: SolarGIS Approach. Energy Procedia 2015, 69, 1958–1969. [Google Scholar] [CrossRef]
- Nelken, K.; Żmudzka, E. TMY versus multi-year time series of meteorological conditions for the characterization of central Poland’s suitability for photovoltaics. Meteorol. Z. 2017, 26, 21–31. [Google Scholar] [CrossRef]
- Vignola, F.; Grover, C.; Lemon, N. Building a bankable solar radiation dataset. Sol. Energy 2012, 86, 2218–2229. [Google Scholar] [CrossRef]

Disclaimer/Publisher’s Note: The statements, opinions and data contained in all publications are solely those of the individual author(s) and contributor(s) and not of MDPI and/or the editor(s). MDPI and/or the editor(s) disclaim responsibility for any injury to people or property resulting from any ideas, methods, instructions or products referred to in the content. |
© 2023 by the authors. Licensee MDPI, Basel, Switzerland. This article is an open access article distributed under the terms and conditions of the Creative Commons Attribution (CC BY) license (https://creativecommons.org/licenses/by/4.0/).