Assessment of Typical Meteorological Year Data in Photovoltaic Geographical Information System 5.2, Based on Reanalysis and Ground Station Data from 147 European Weather Stations
Abstract
:1. Introduction
2. Materials and Methods
2.1. Data Sources and Preparation
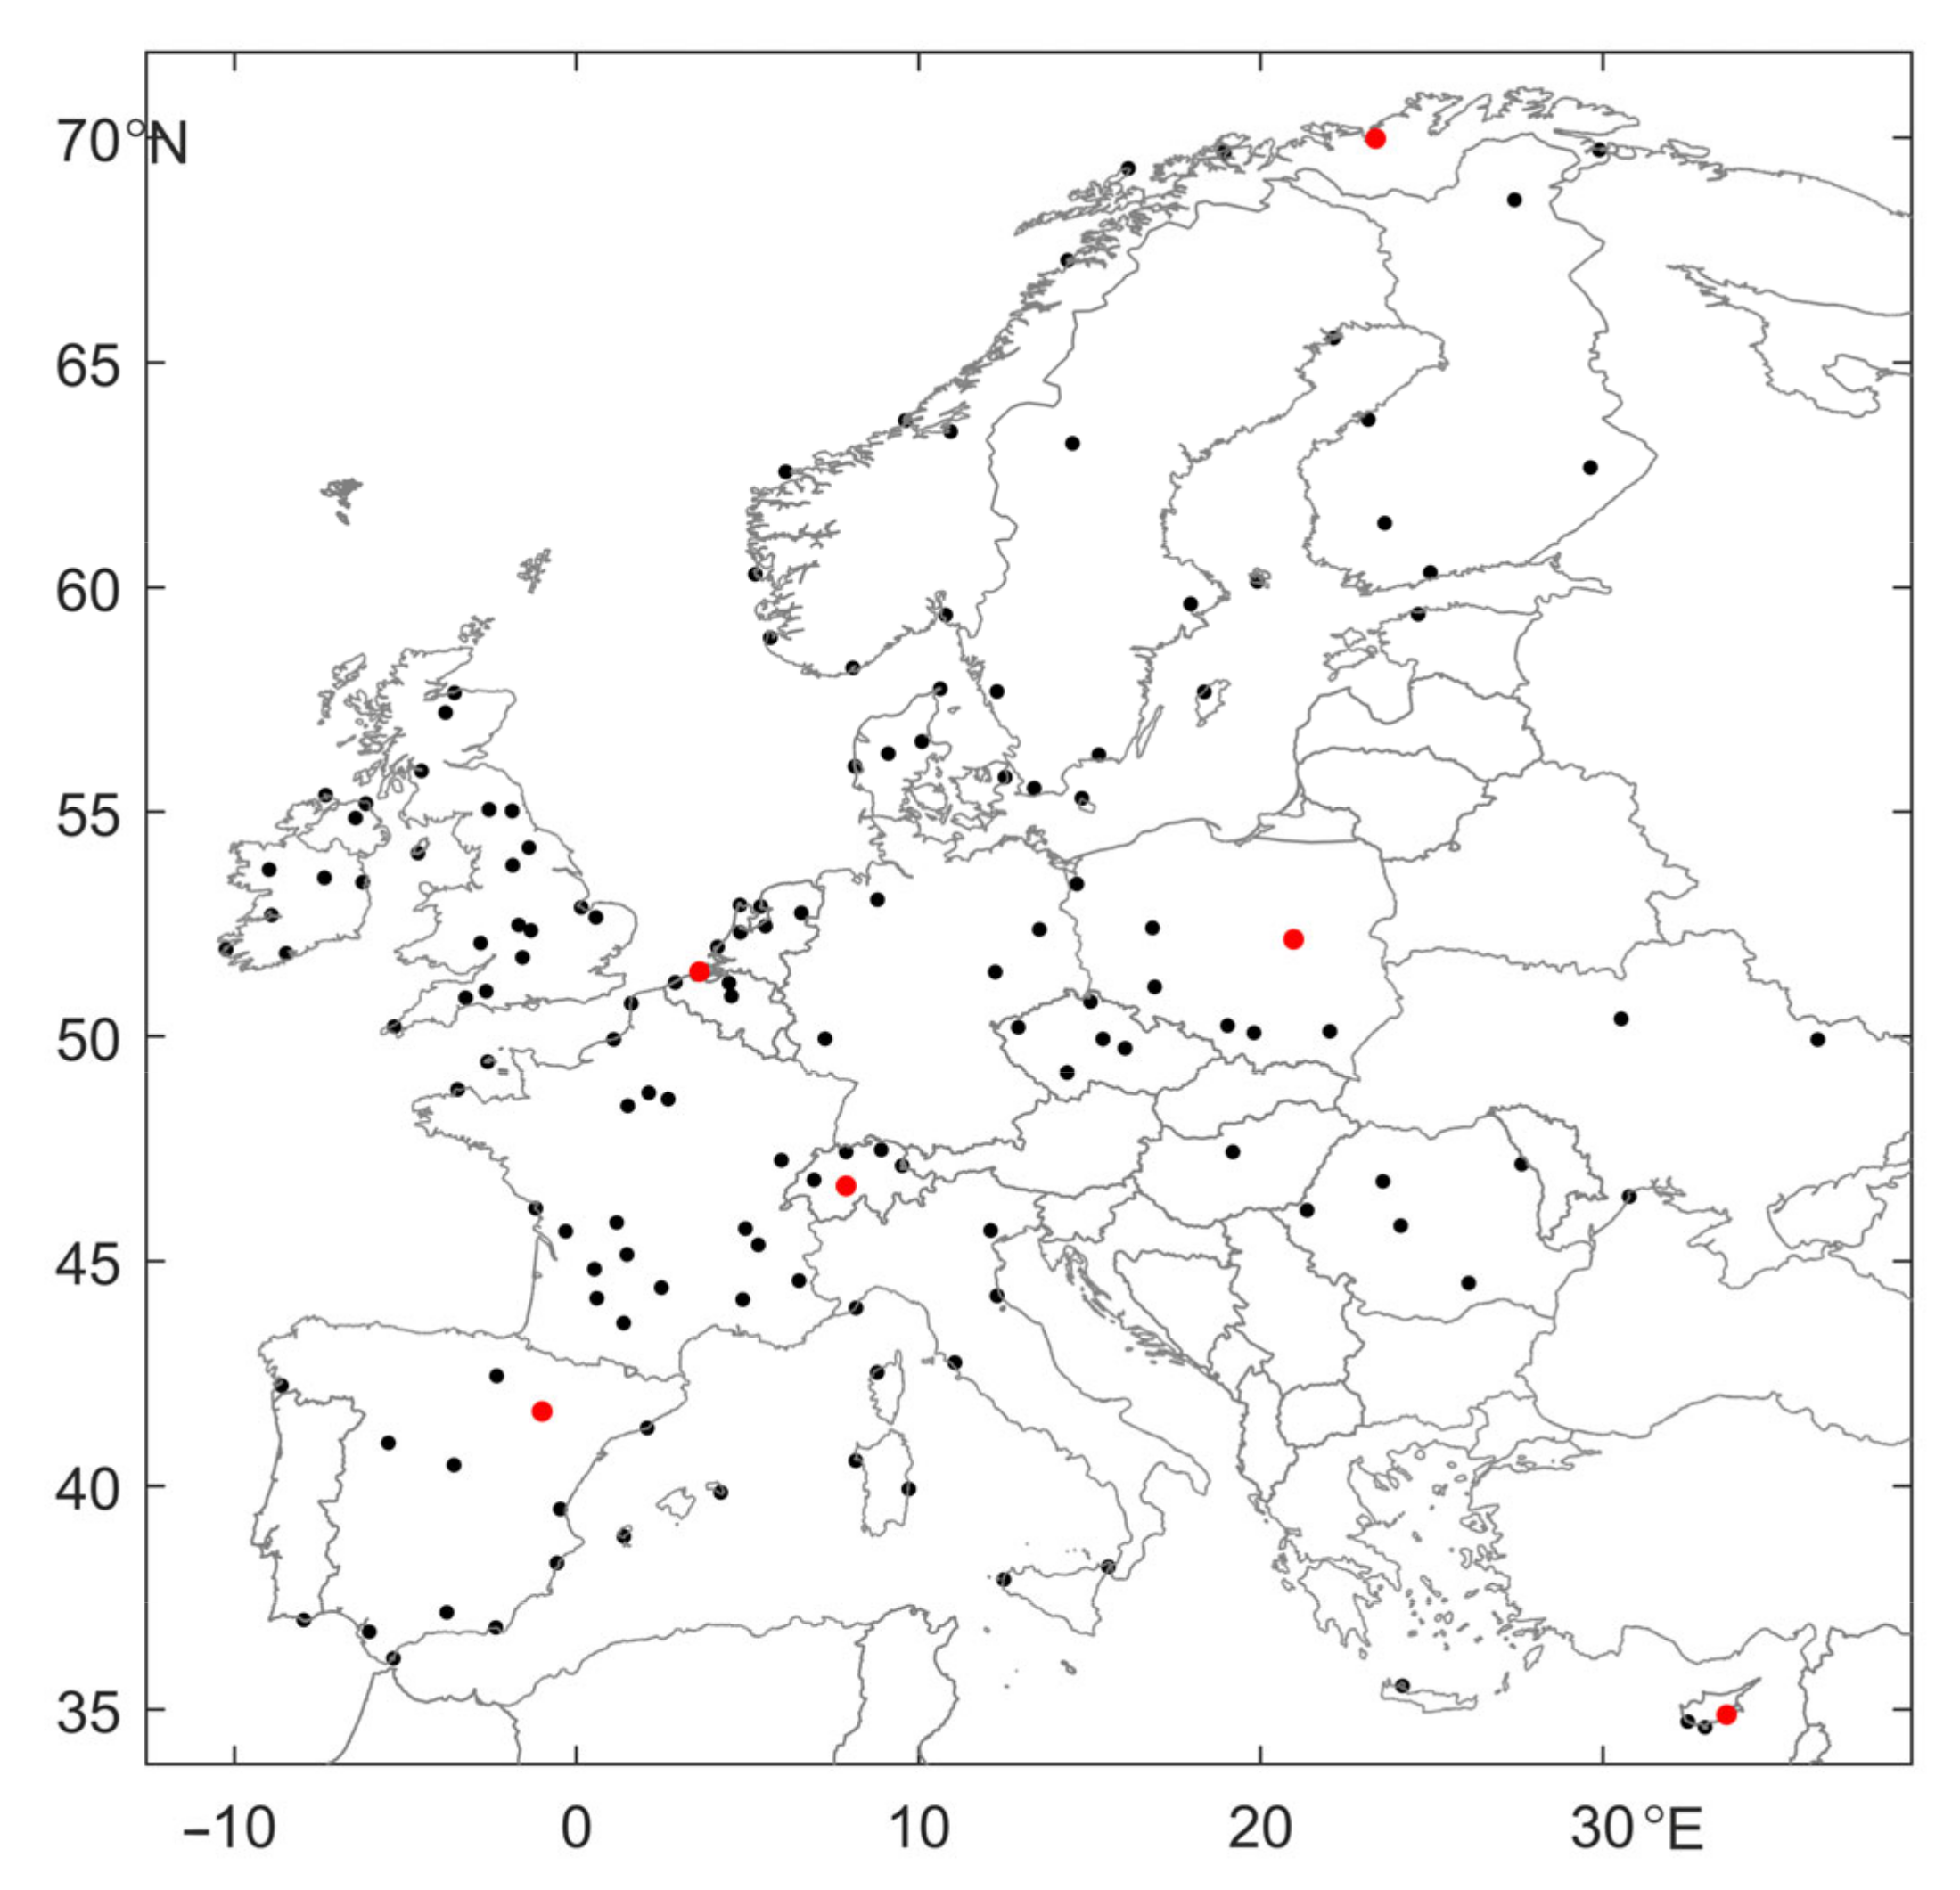
2.1.1. Ground Station Meteorological Data
2.1.2. PVGIS 5.1 TMY
- For the meteorological elements T, Td, and WS: ERA-Interim reanalysis with a spatial resolution of 81 × 81 km [26,27]. Temperature data here are downscaled to a resolution of 90 m based on elevation and operational forecast data [28]. The temporal resolution of the time series coming from ERA-Interim is 3 h. PVGIS further interpolates this to a temporal frequency of 1 h;
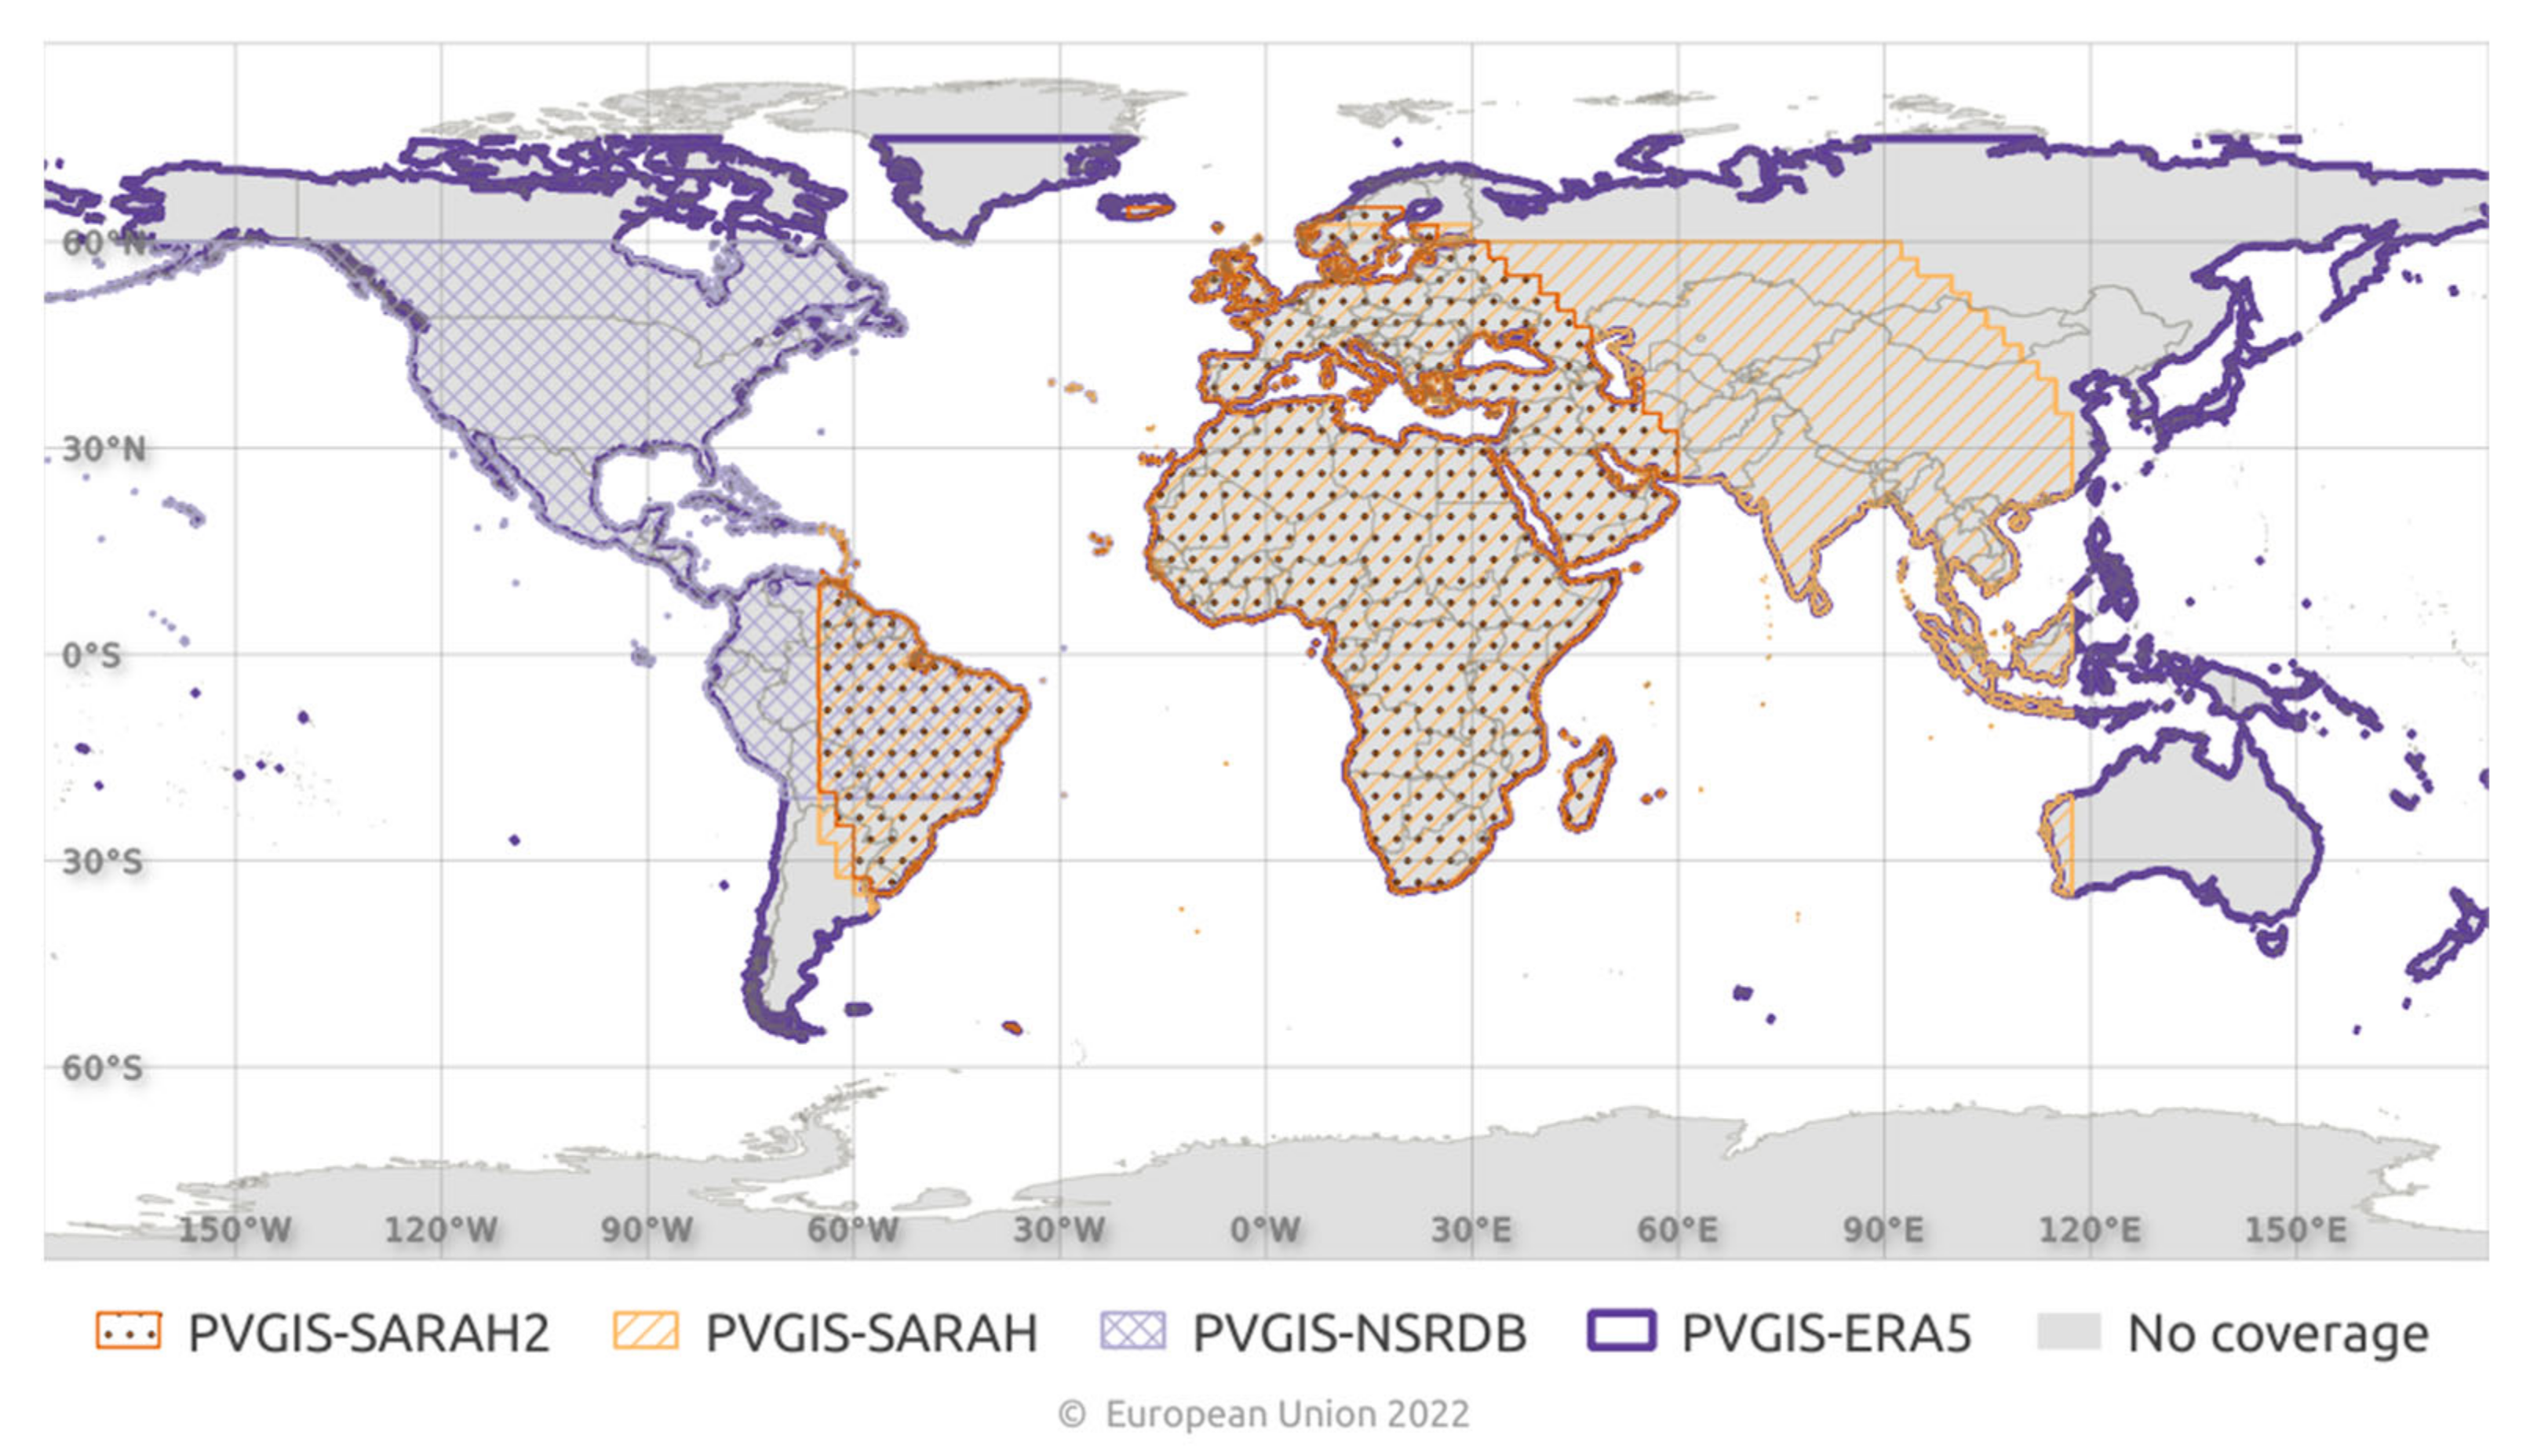
- For the GHI: SARAH-1 [29]. In places where SARAH-1 has no coverage (mostly areas above the 65° N latitude), the GHI from ERA5 reanalysis is used as a replacement.
2.1.3. PVGIS 5.2 TMY
- For the meteorological elements T, Td, and WS: ERA5-Land reanalysis with a spatial resolution of 9 × 9 km [30]. In places where ERA5-Land has no coverage (some coastal areas where pixels have a high percentage of sea area), ERA5 reanalysis data (interpolated to the same resolution as ERA5-Land) is used as a replacement (Description of known issue regarding temperature data on the coastlines of PVGIS 5.2: https://joint-research-centre.ec.europa.eu/photovoltaic-geographical-information-system-pvgis/pvgis-releases/pvgis-52_en (accessed on 30 October 2023)). Both time series coming from ERA5 and ERA5-Land have a temporal resolution of 1 h;
- For the GHI: SARAH-2. In places where SARAH-2 has no coverage (mostly areas above the 65° N latitude), the GHI from ERA5 reanalysis is used as a replacement.
2.1.4. TMY on the Basis of Ground Station Data
- For the meteorological elements T, Td, and WS: ground station meteorological data, derived from the ISD-Lite database;
- For the GHI: SARAH-2. In places where SARAH-2 has no coverage (mostly areas above the 65° N latitude), the GHI from ERA5 reanalysis was used as a replacement.
2.2. Comparative Data Sets
- GS: Ground station data (hourly values) from the 12-year time period (2005–2016). The meteorological elements—T, Td, and WS—come from ground station meteorological data, while GHI comes from SARAH-2 or ERA5 (in areas above the 65° N latitude);
- TMY-GS: TMY (hourly values) generated on the basis of ground station data from the 12-year time period (2005–2016), following the ISO 15927-4 procedure;
- TMY-51: TMY (hourly values) from PVGIS 5.1, generated from the 12-year time period (2005–2016);
- TMY-52: TMY (hourly values) from PVGIS 5.2, generated from the 12-year time period (2005–2016).
- TMY-GS (tested data) against GS (reference data);
- TMY-51 (tested data) against GS (reference data);
- TMY-52 (tested data) against GS (reference data);
- TMY-52 (tested data) against TMY-51 (reference data).
2.3. Methods
2.3.1. Comparisons Based on Mean Bias and Root Mean Square Error
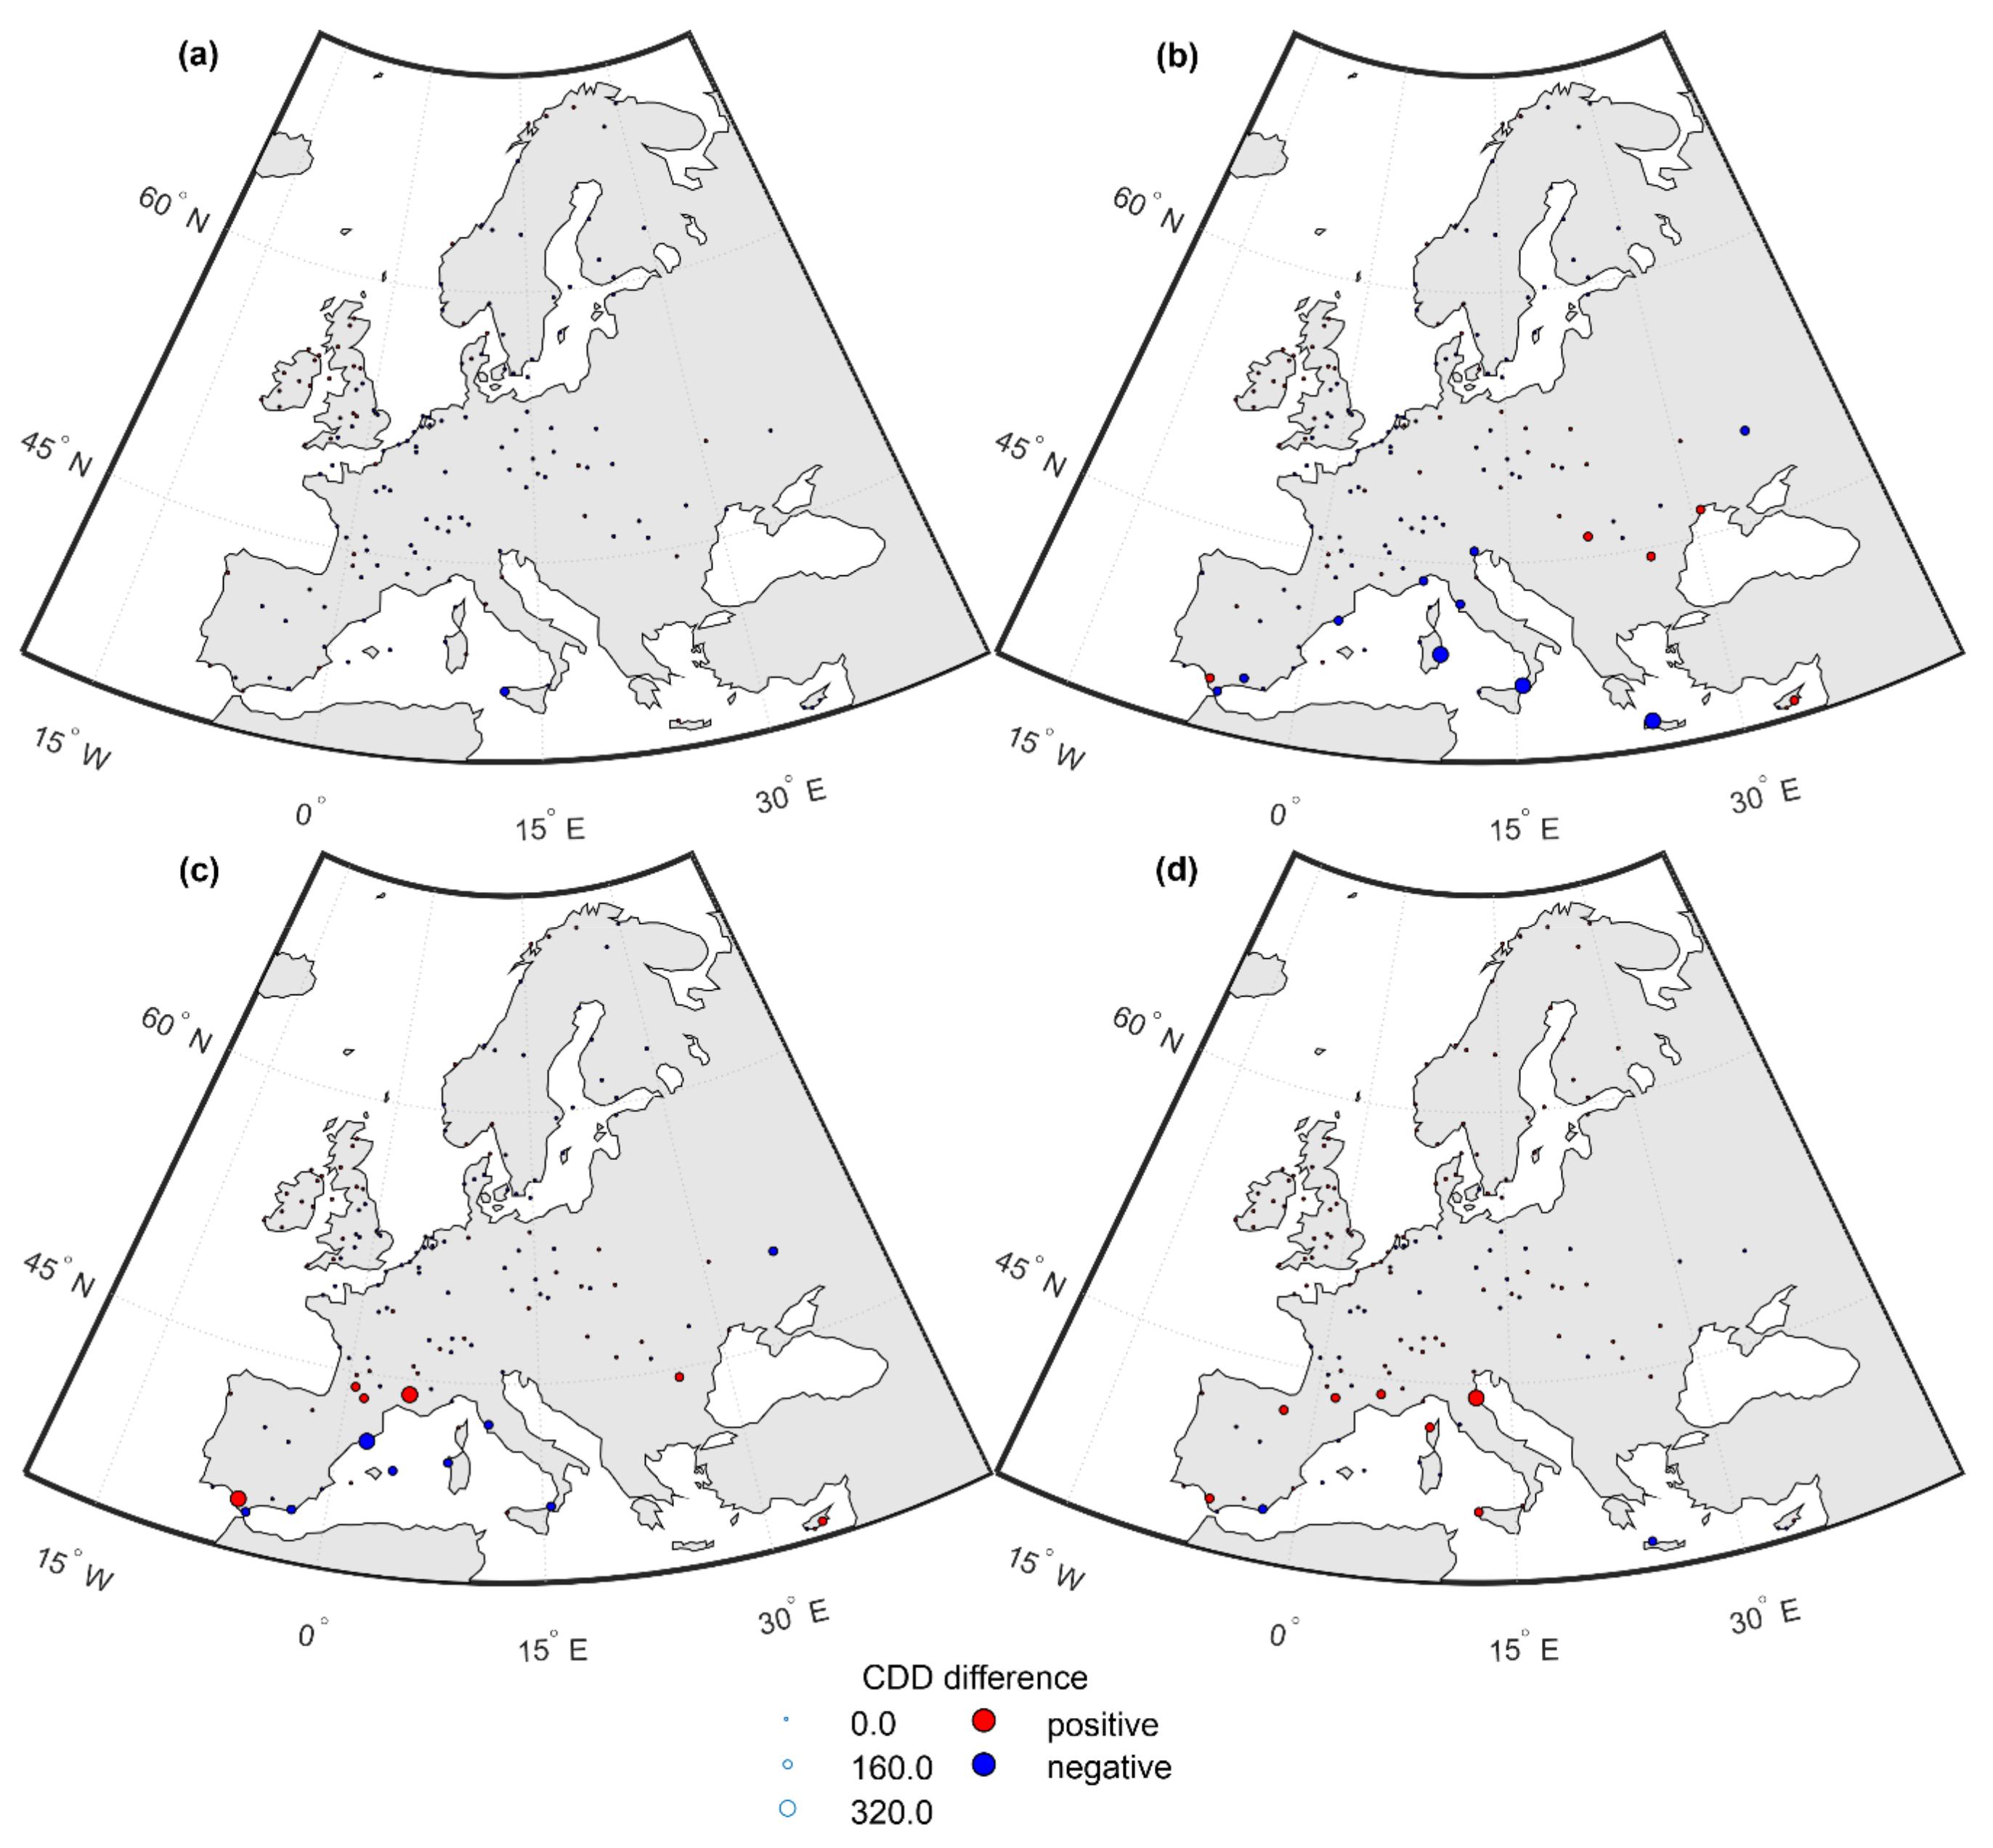
2.3.2. Comparisons Based on Heating Degree Days and Cooling Degree Days
- HDDGS,i is the HDD for the i-th station using the full multi-annual ground station data set (GS);
- HDDTMY-GS,i is the HDD for the i-th station using TMY generated on the basis of the ground station data set (TMY-GS);
- HDDTMY-51,i is the HDD for the i-th station using the PVGIS 5.1 TMY data set (TMY-51);
- HDDTMY-52,i is the HDD for the i-th station using the PVGIS 5.2 TMY data set (TMY-52).
3. Results
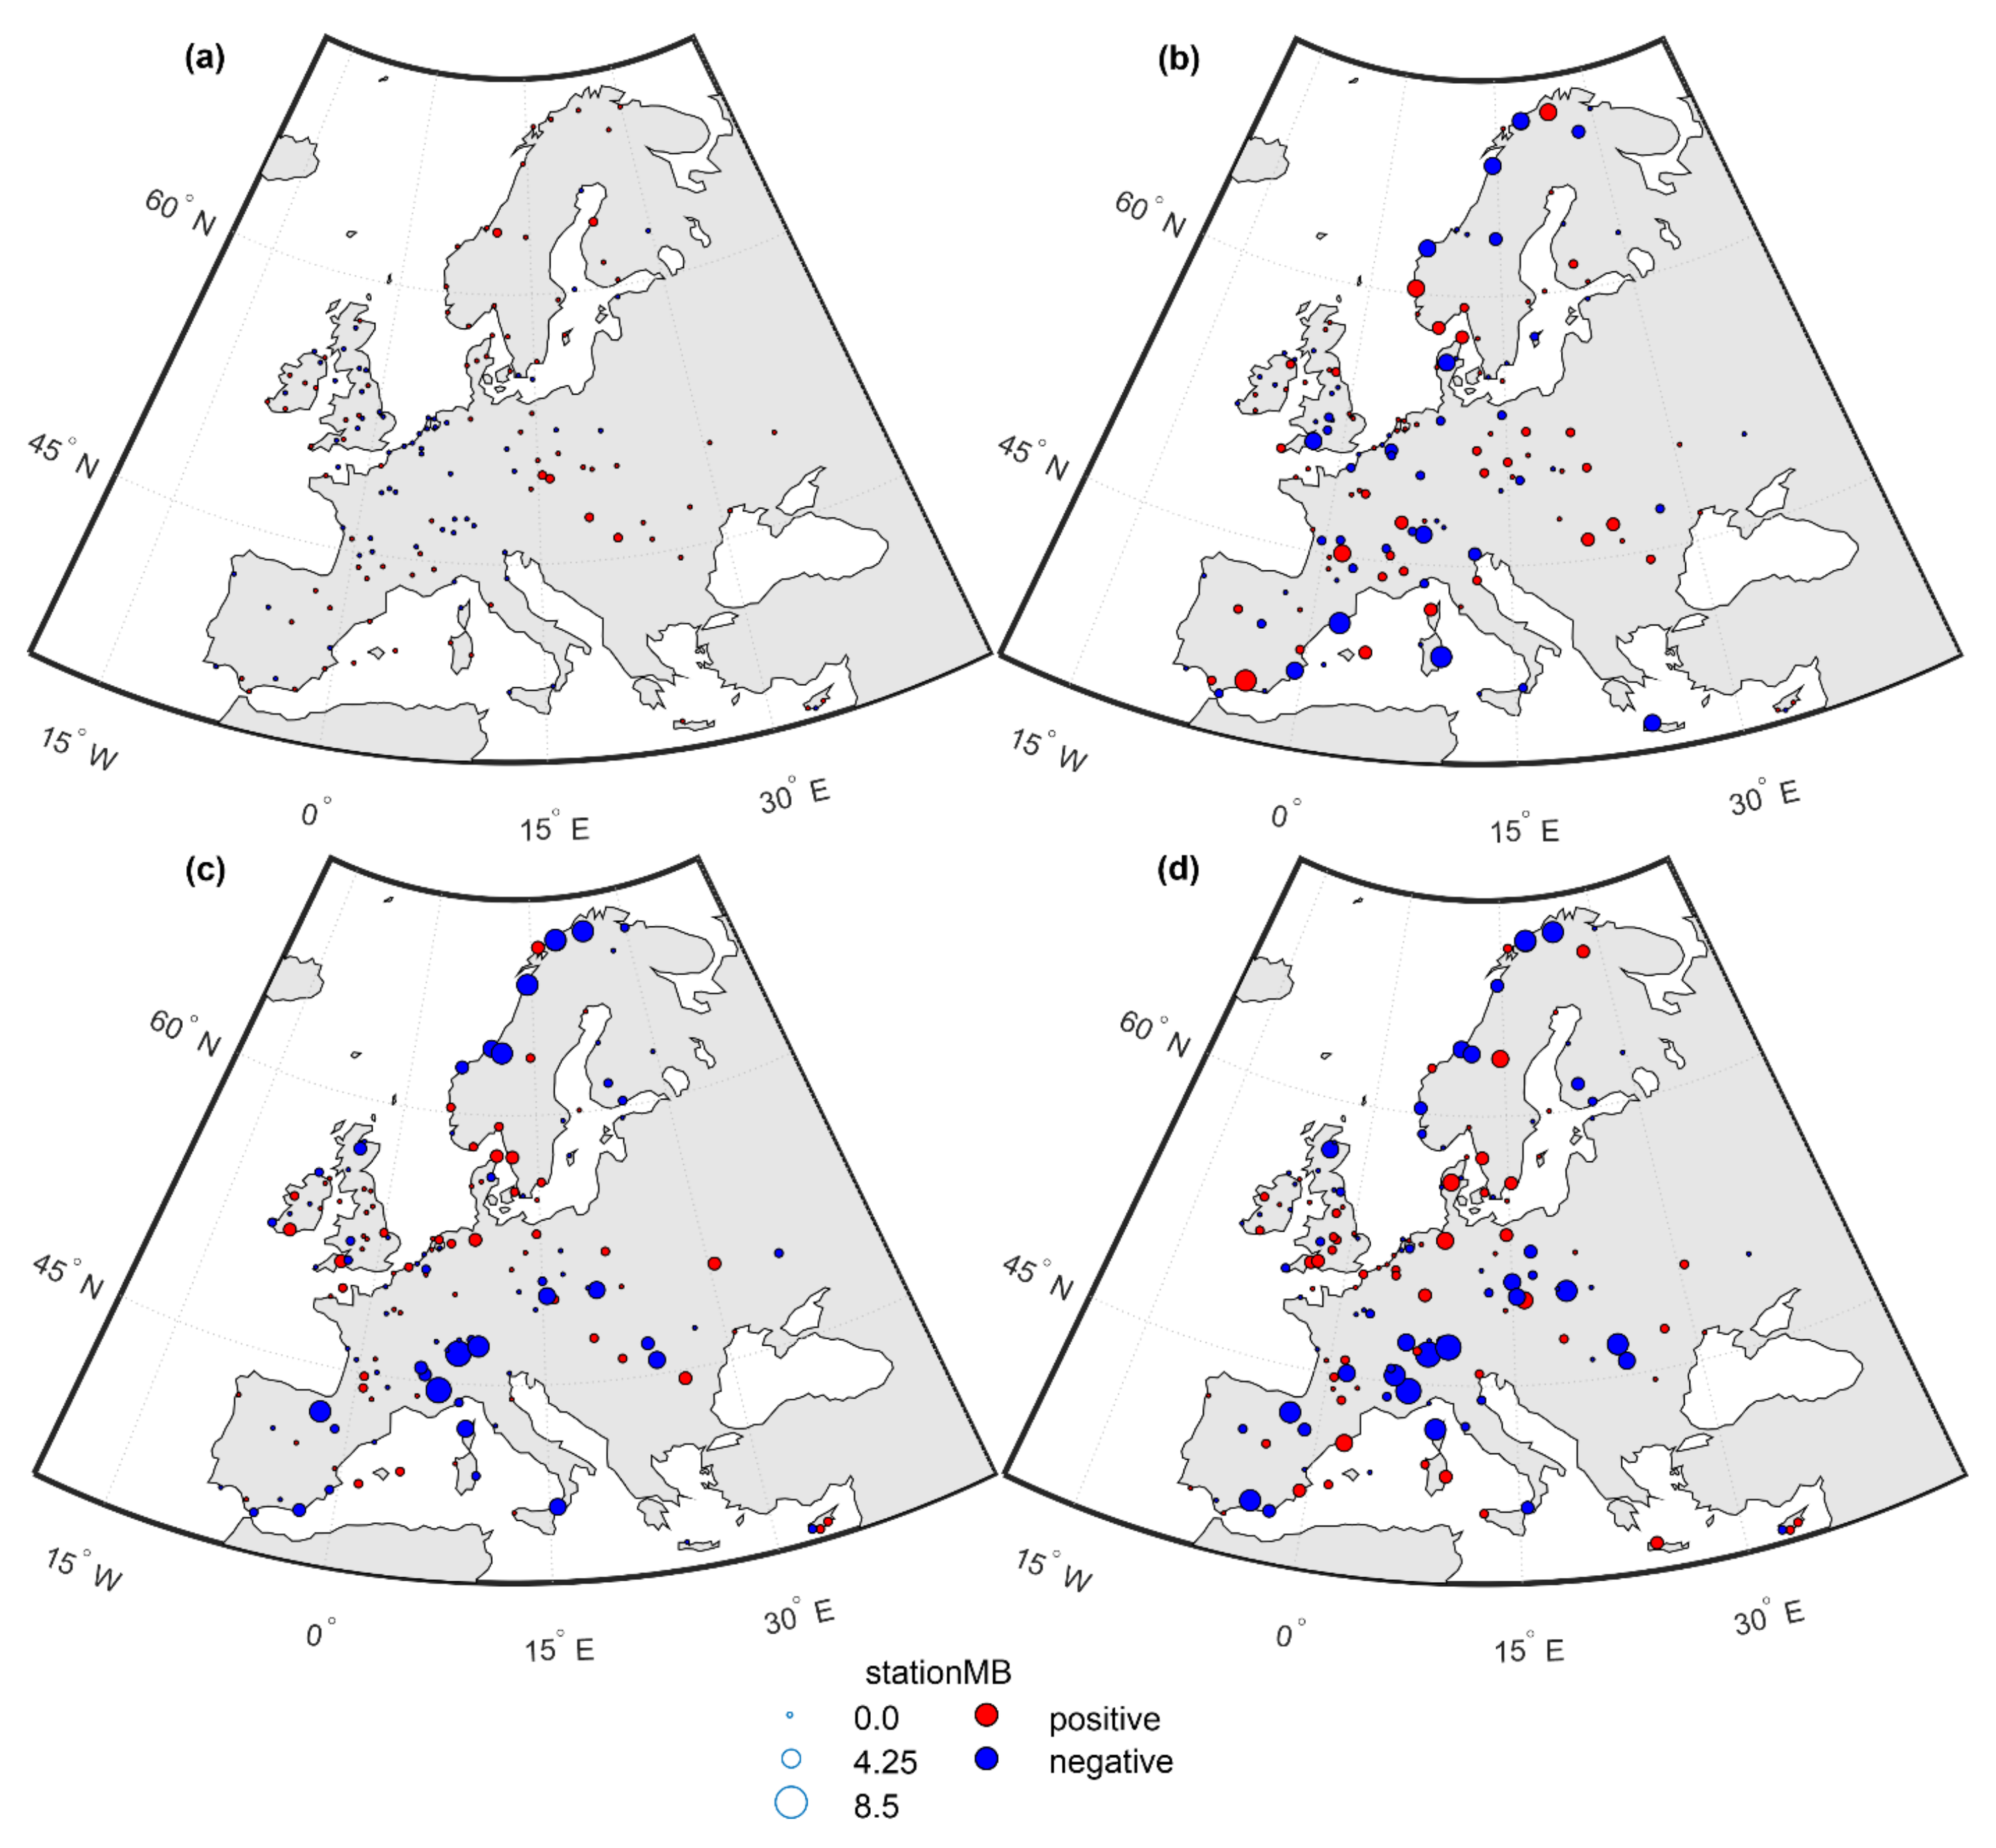
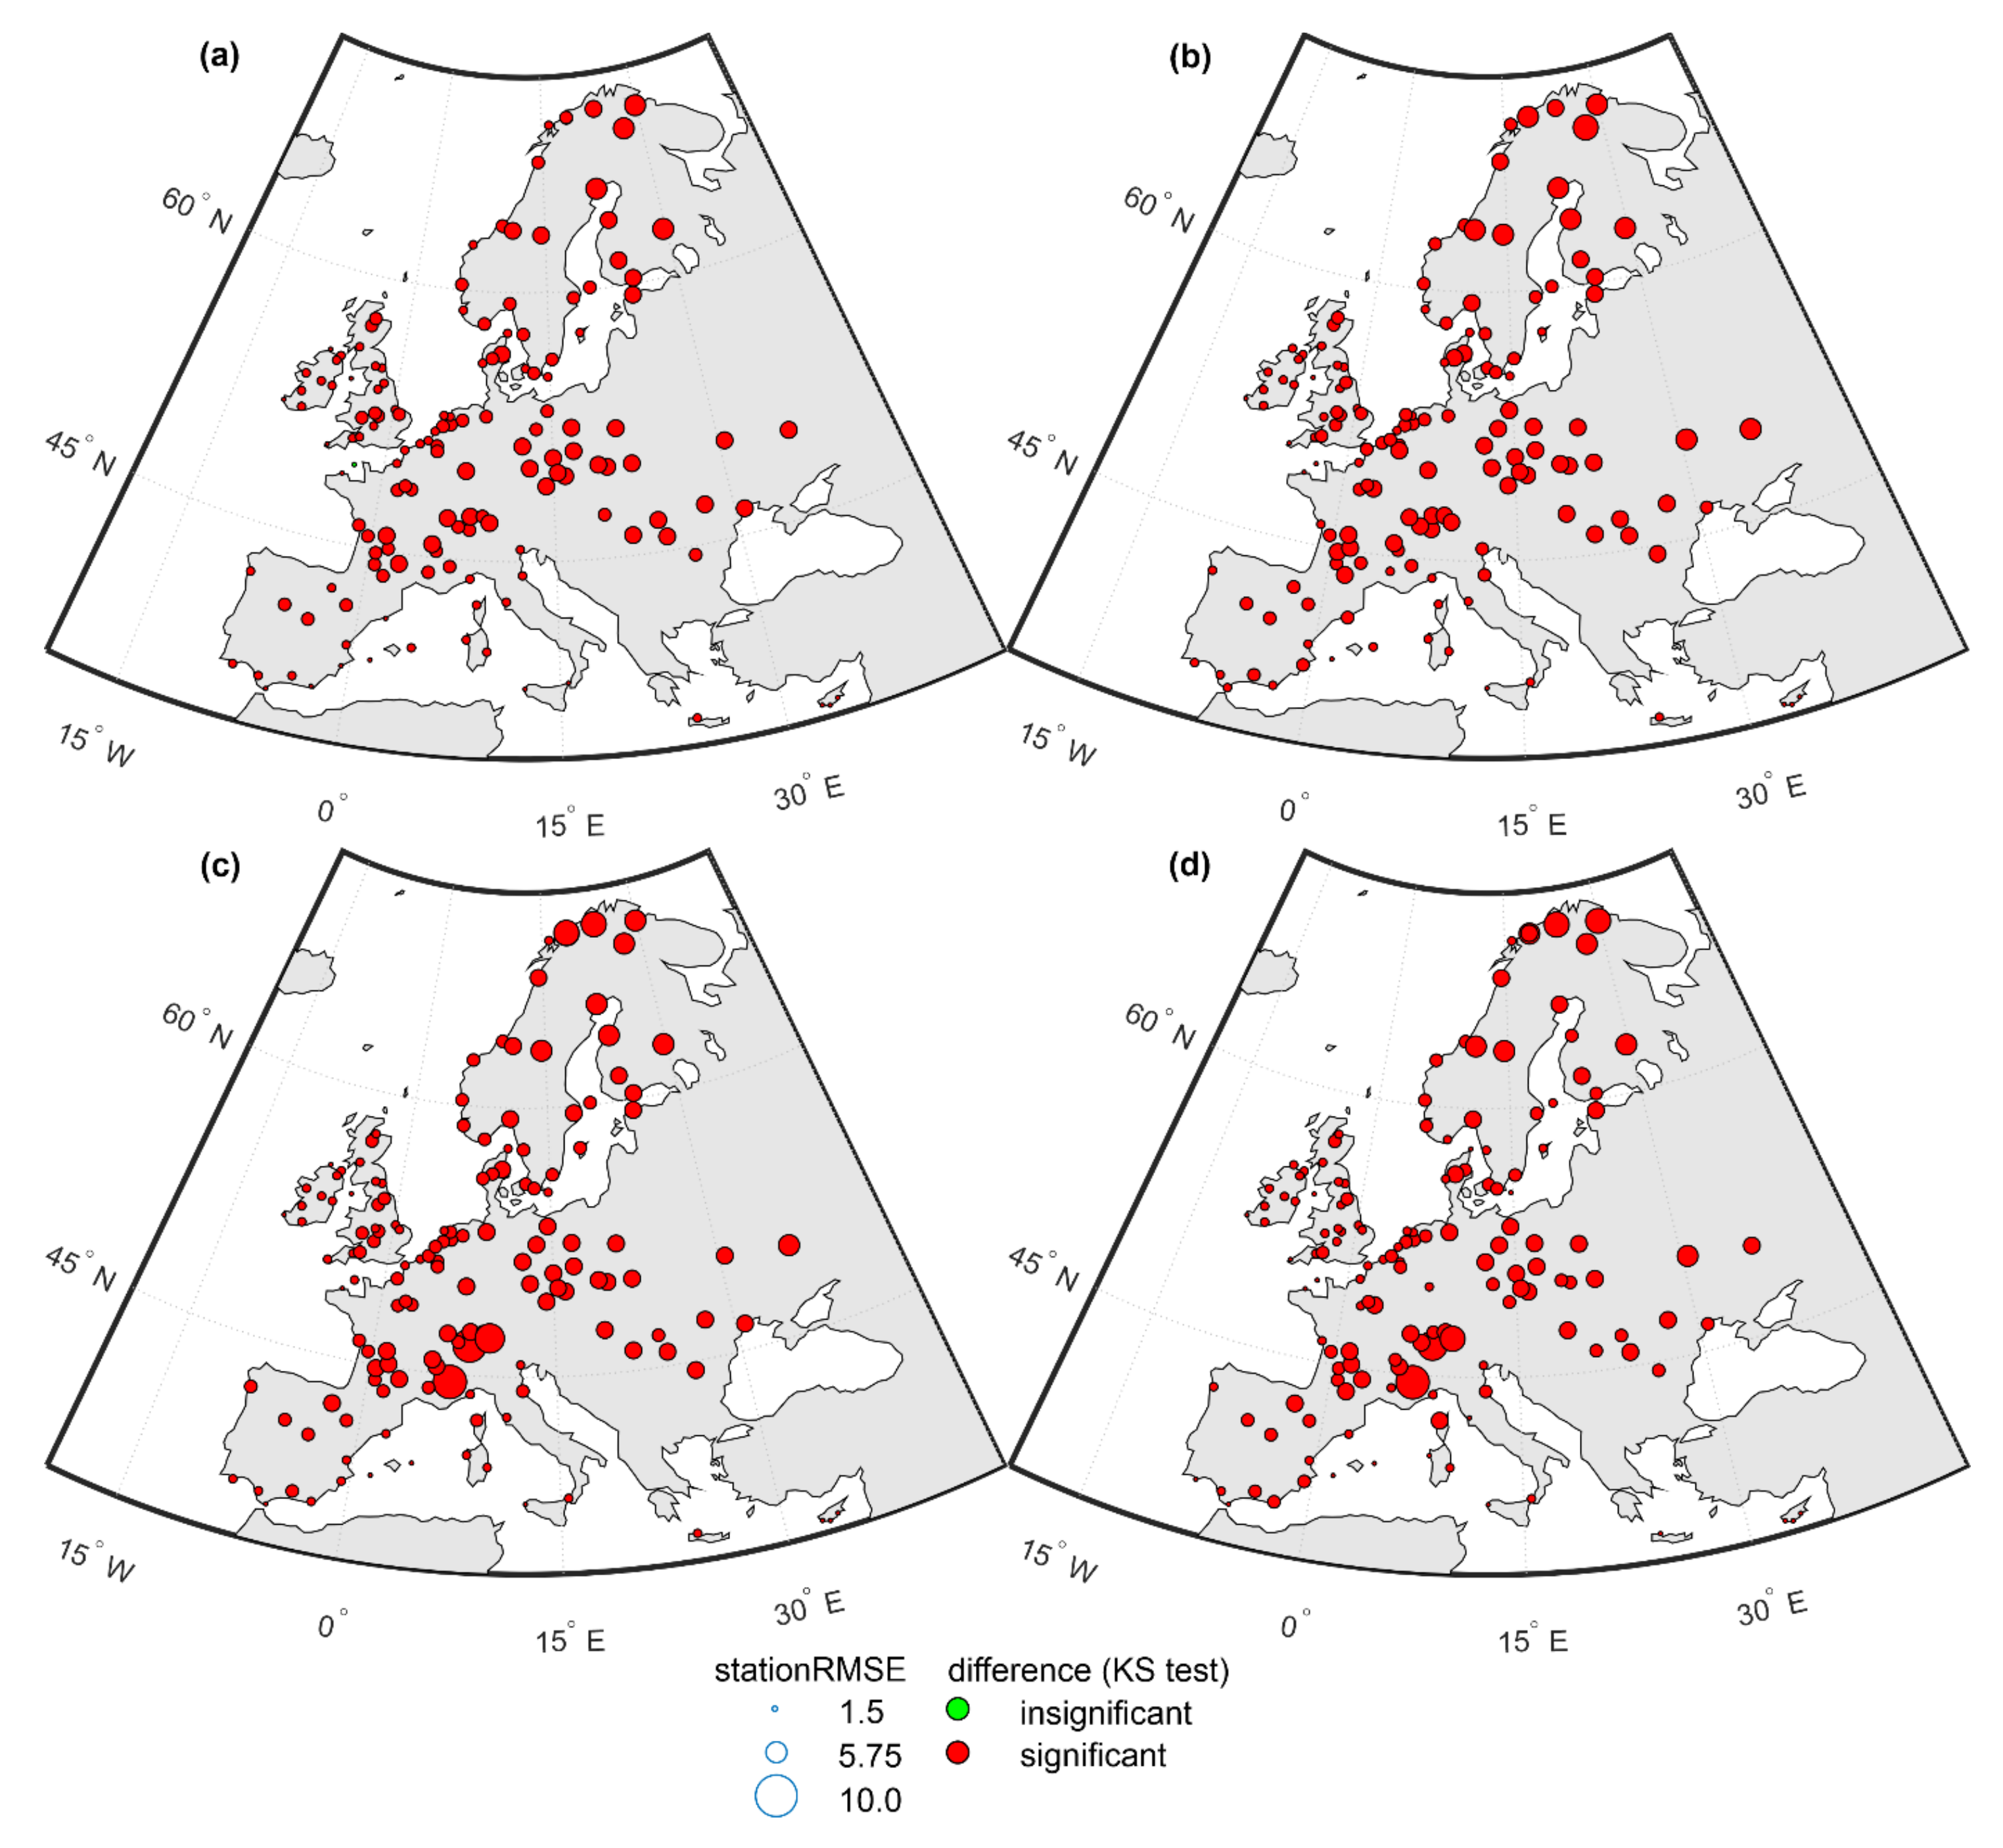
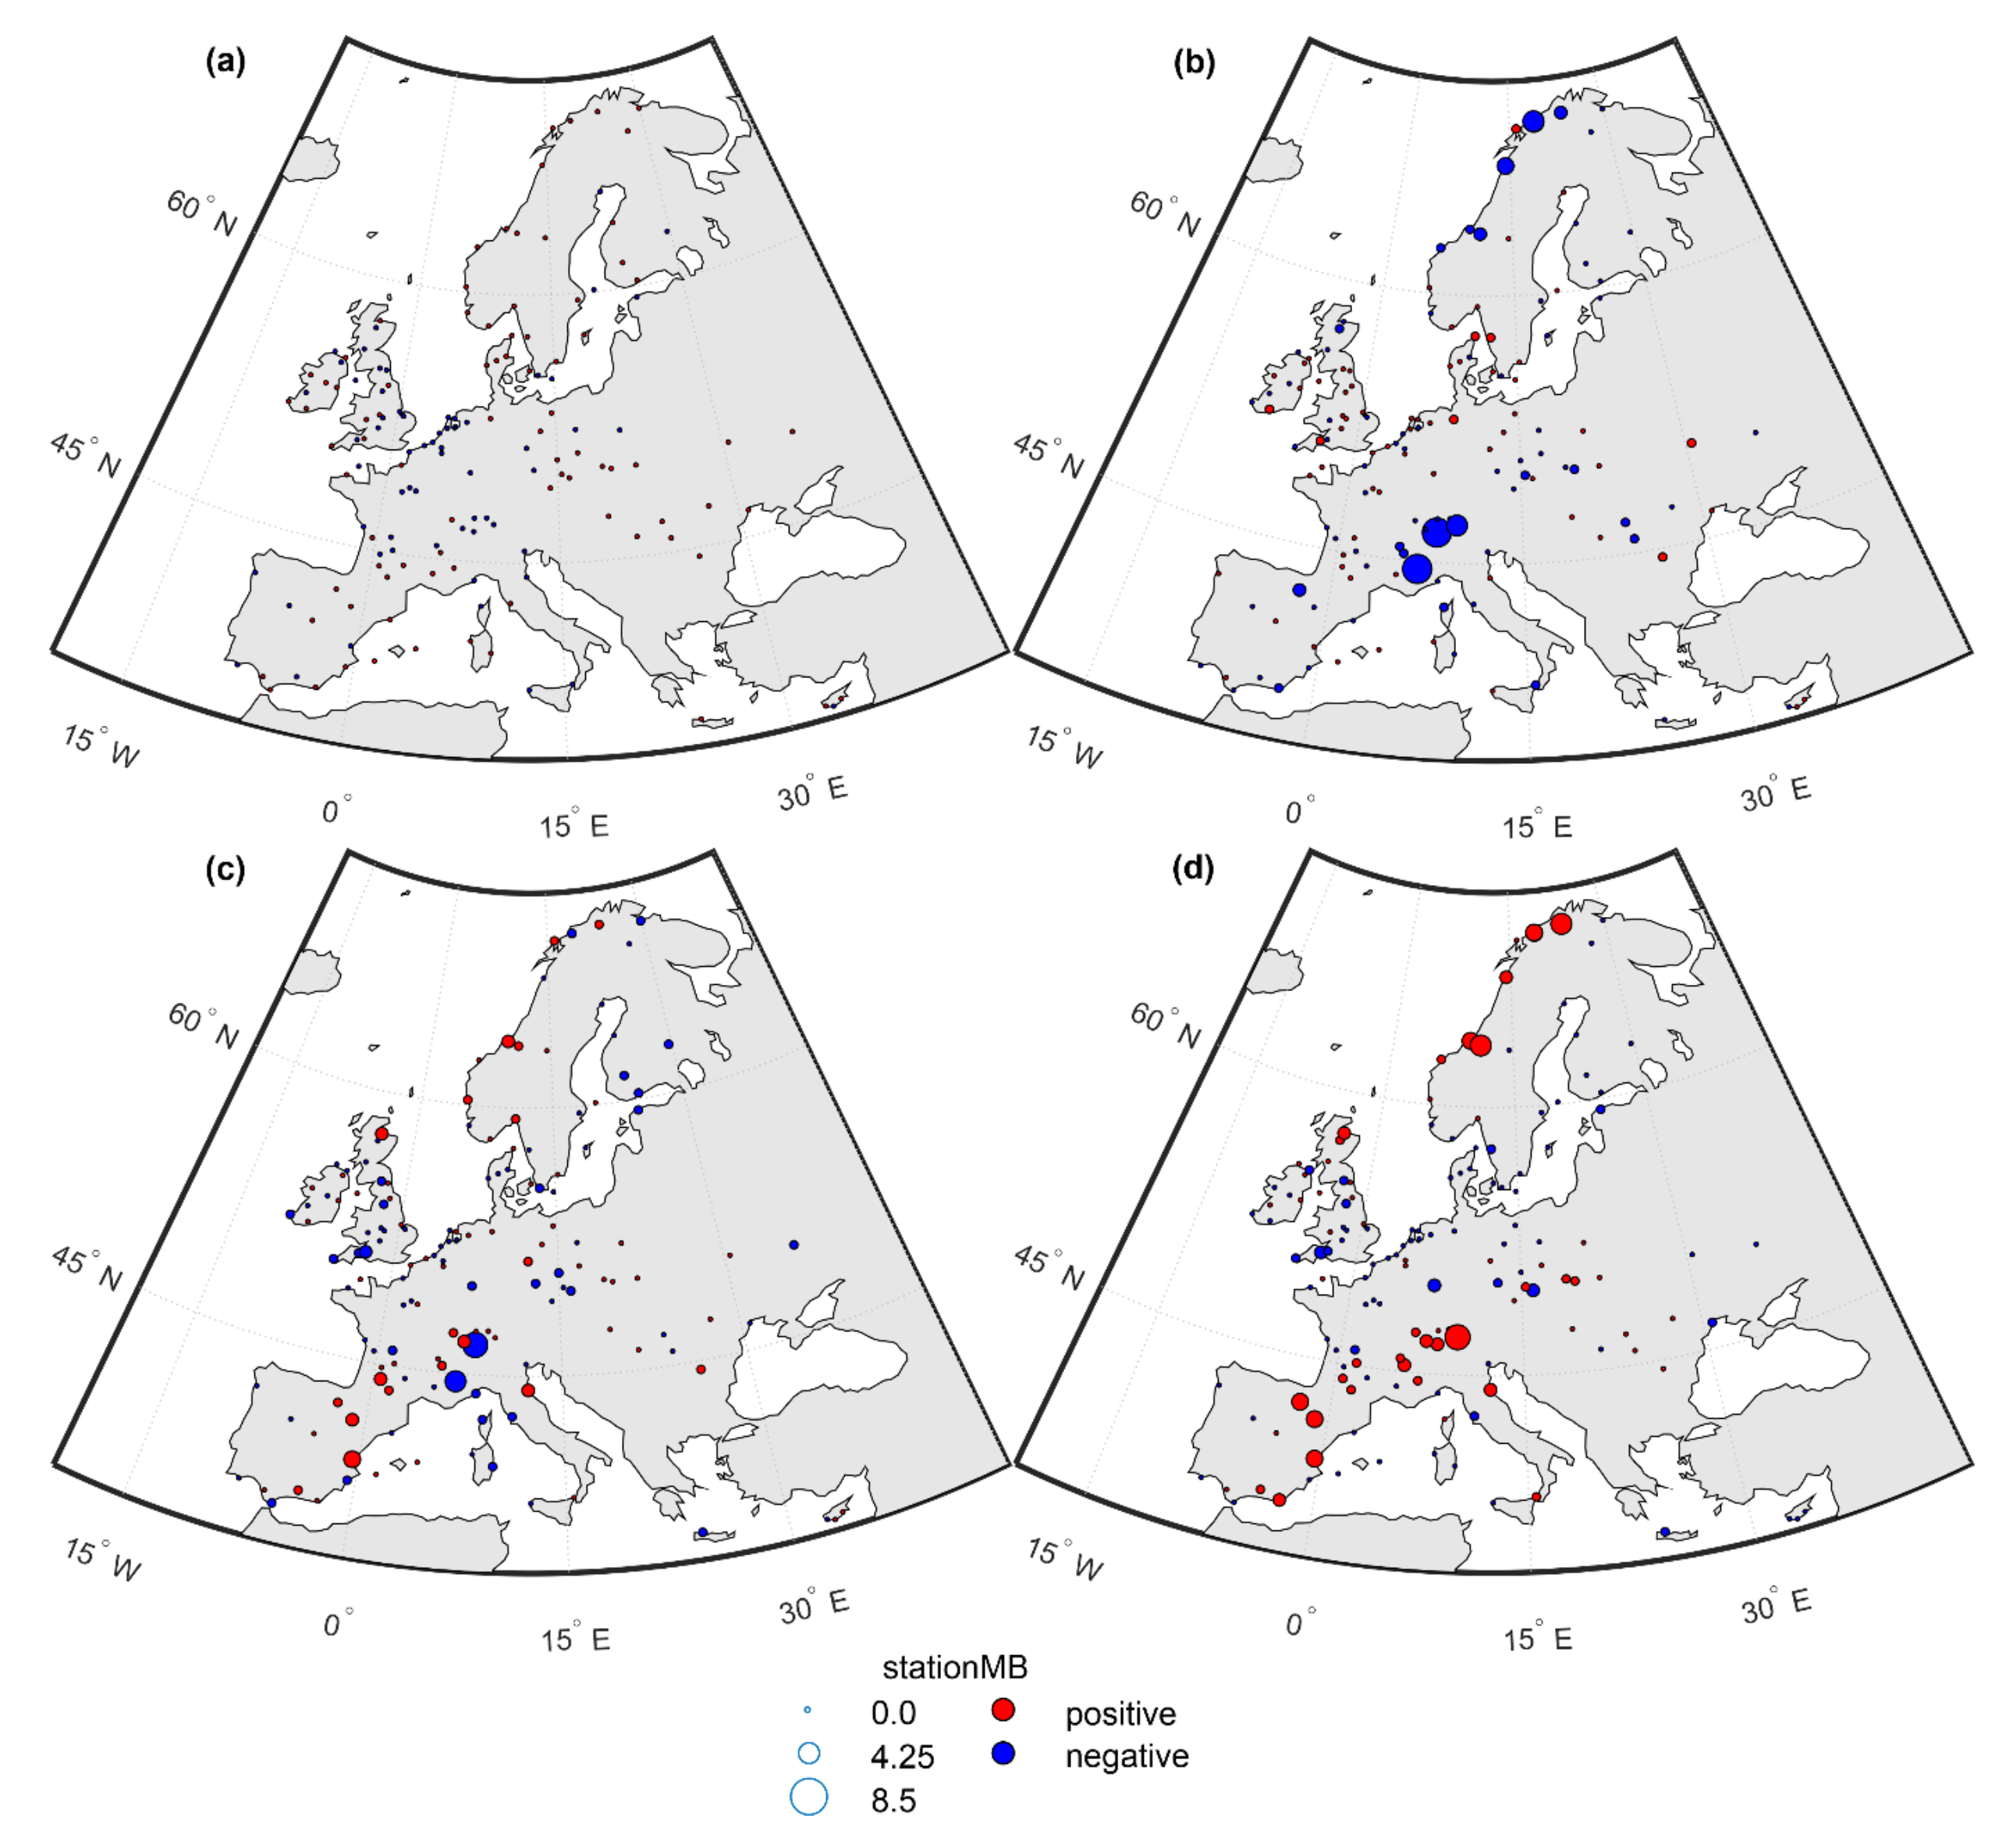
3.1. Comparisons Based on MB and RMSE for Daily Average T
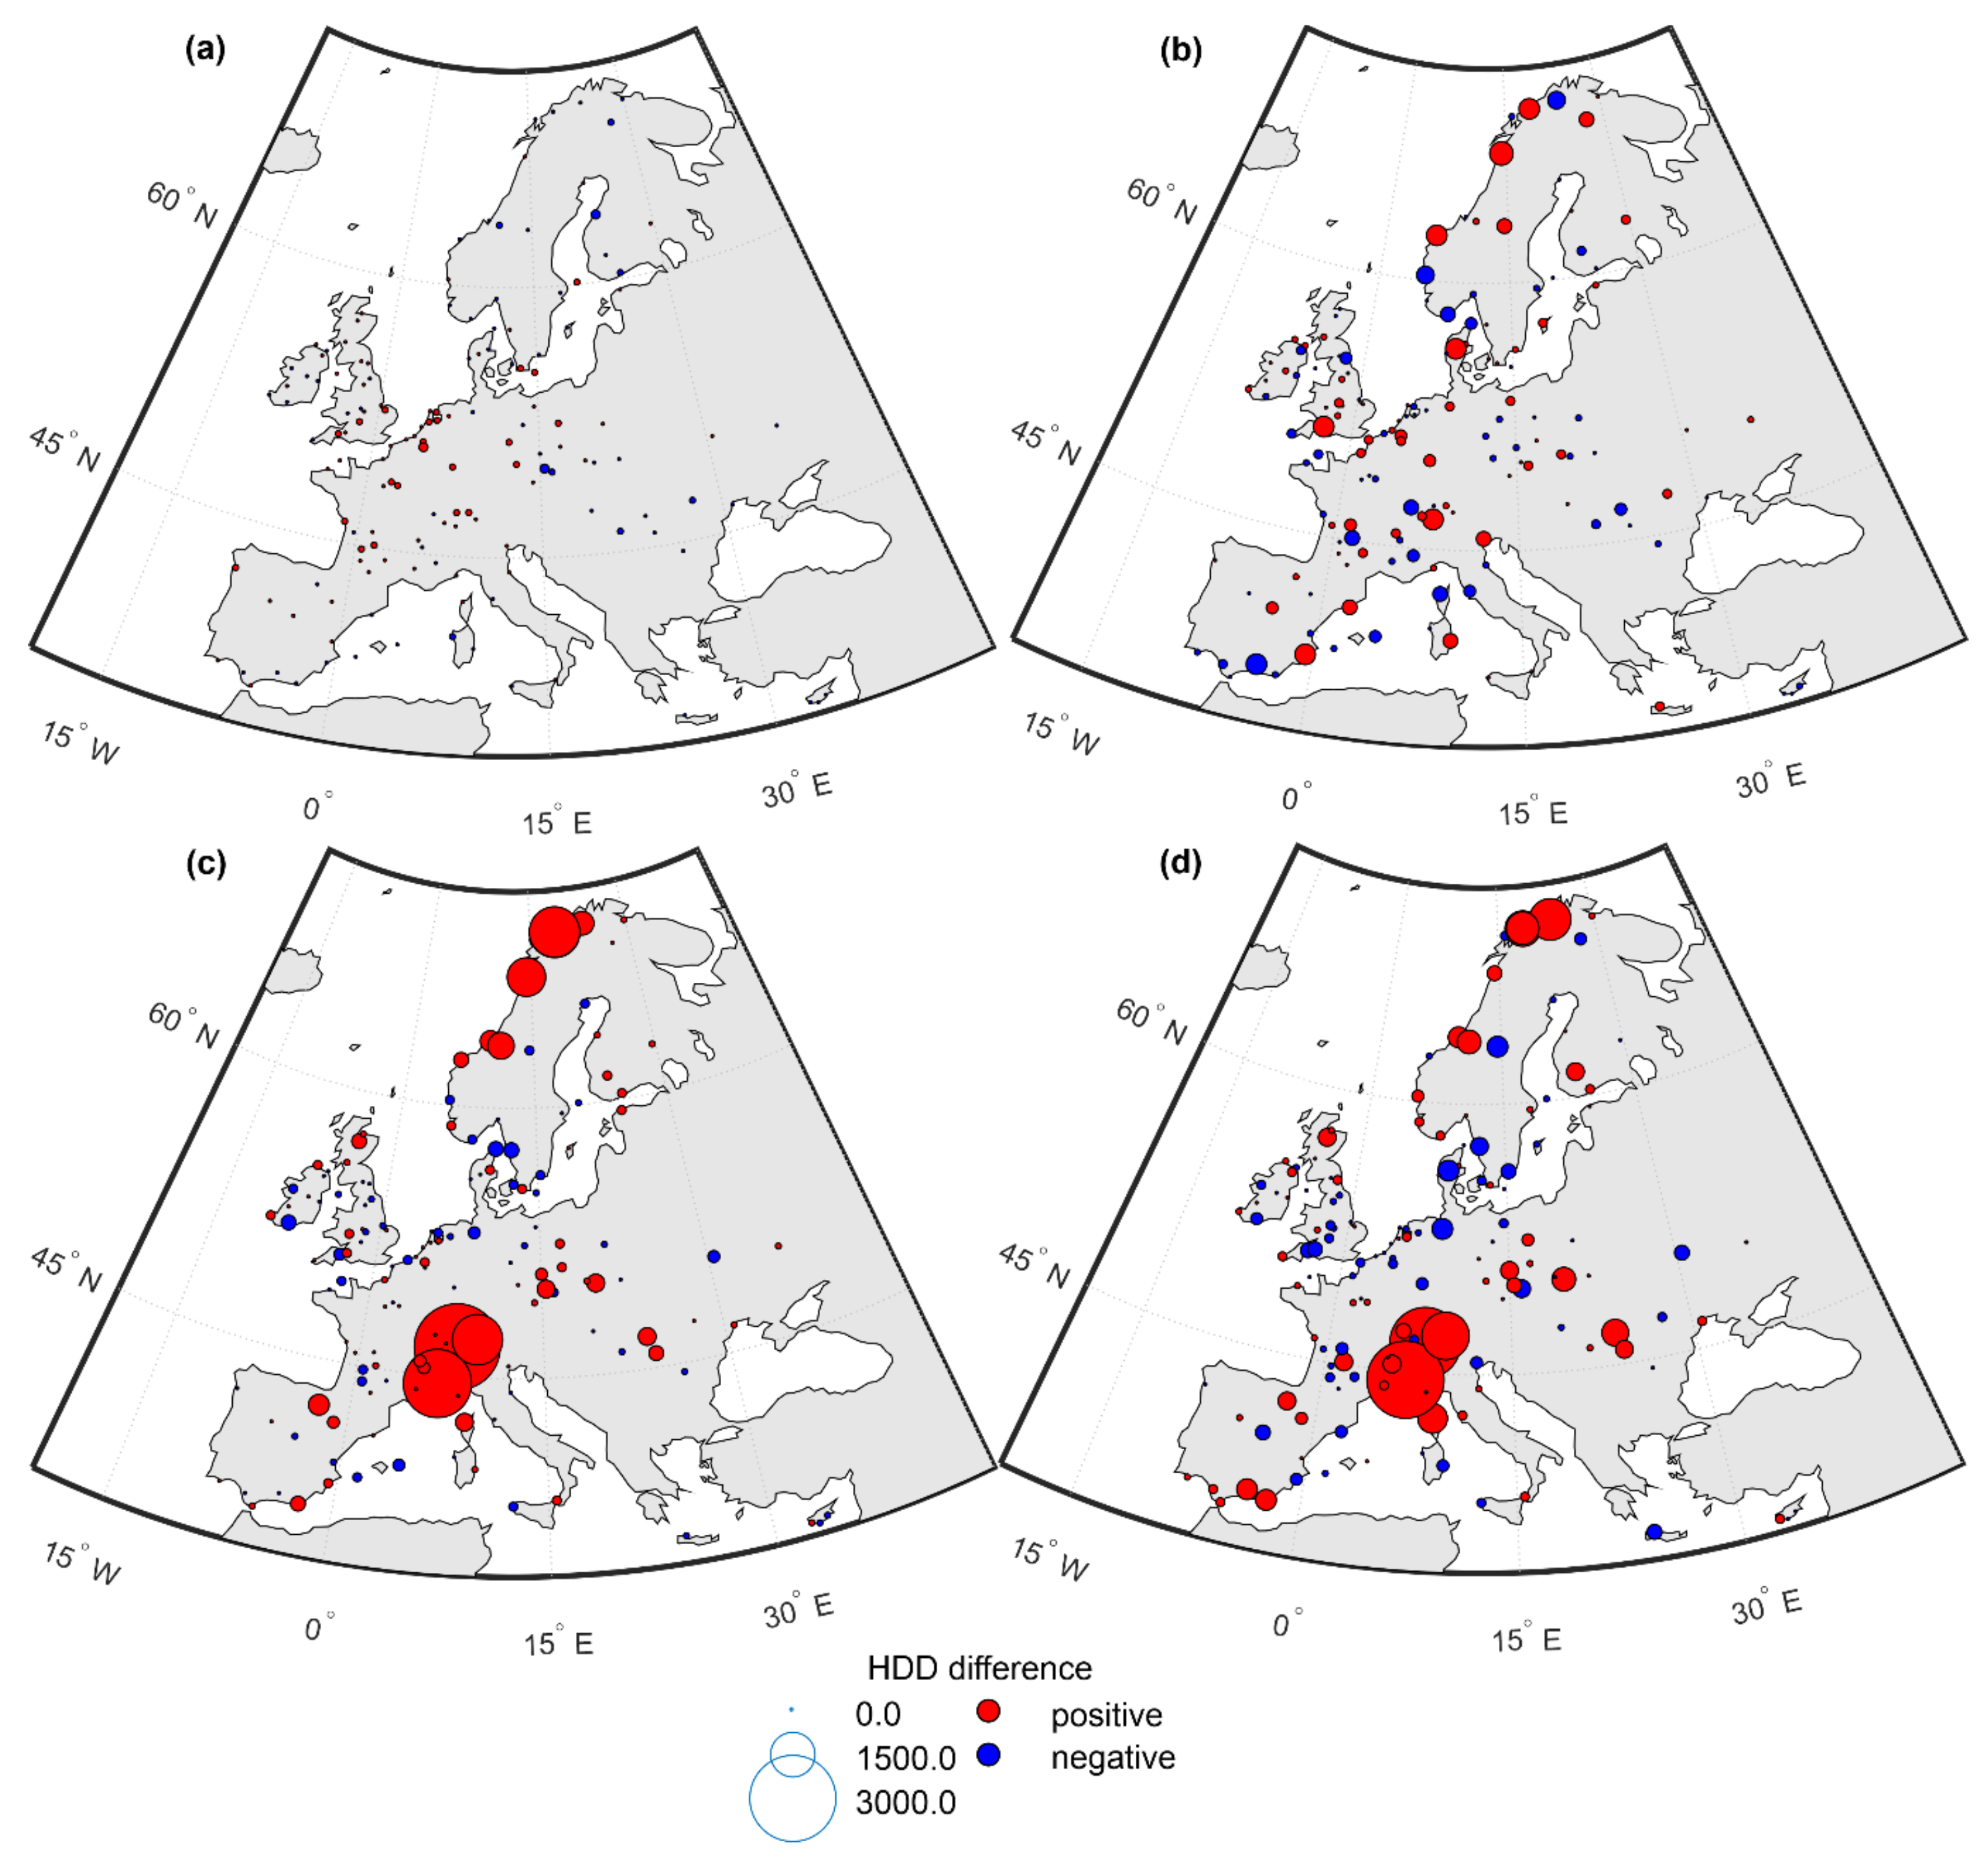
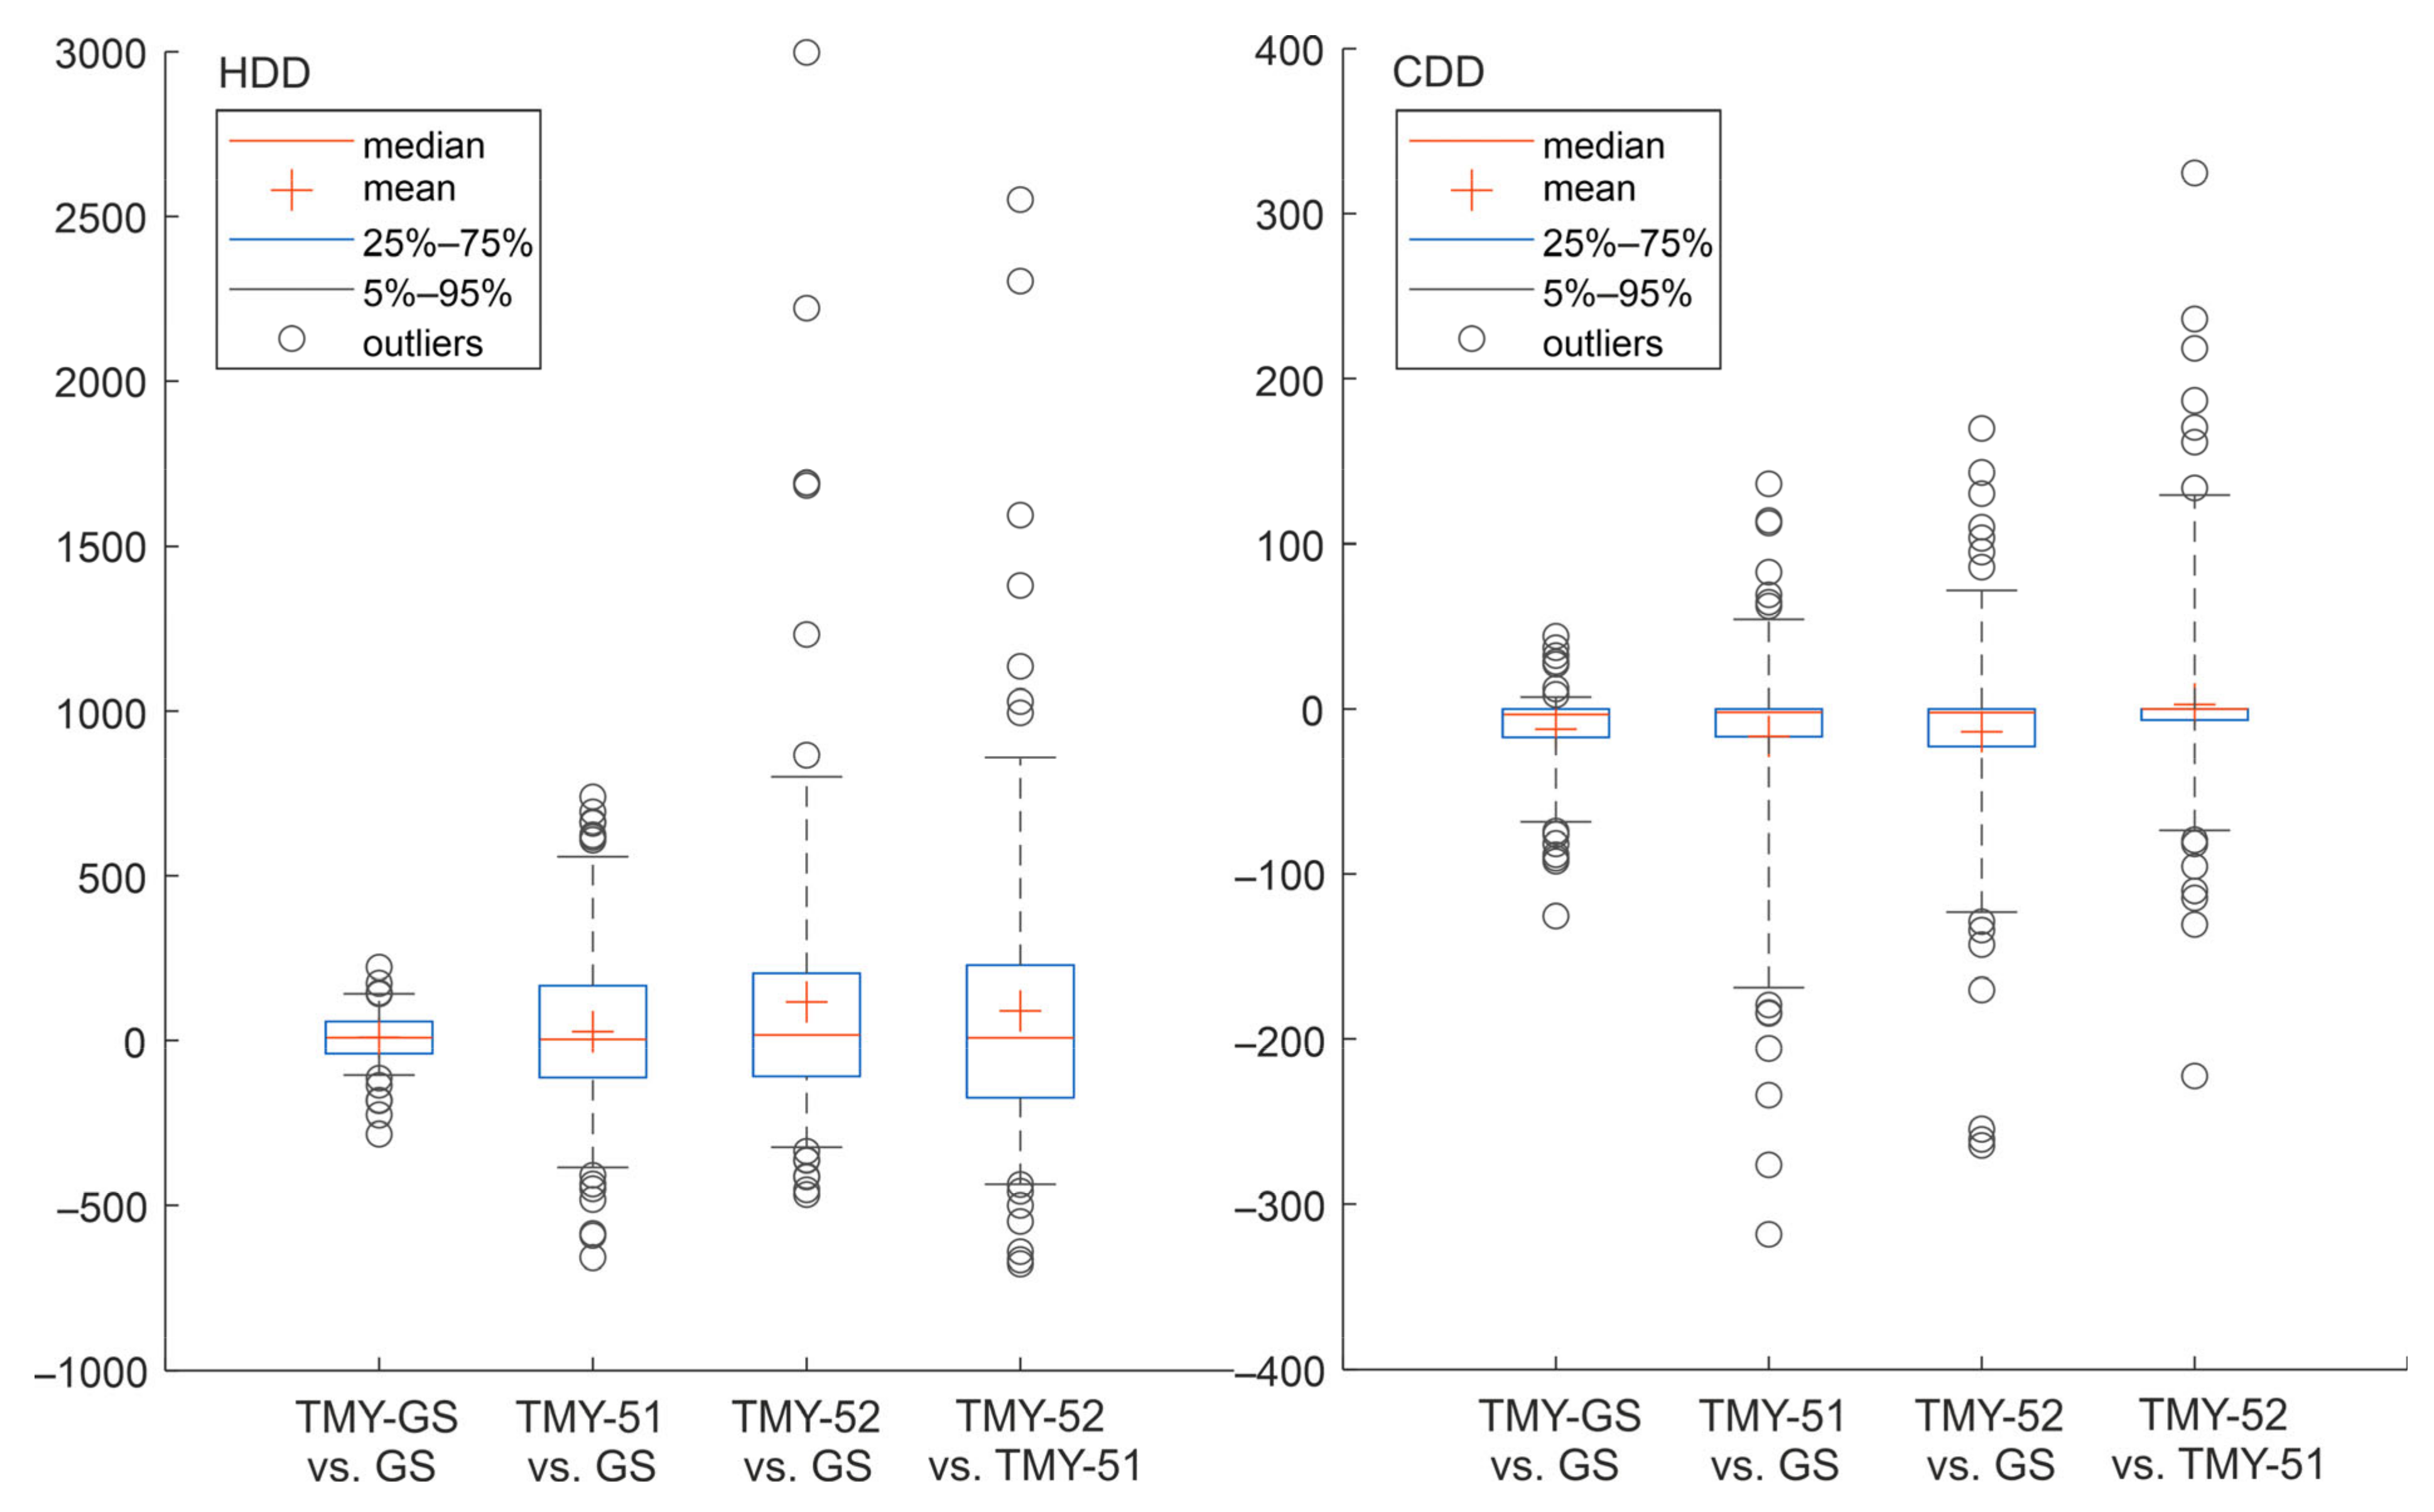
3.2. Comparisons Based on HDDs and CDDs
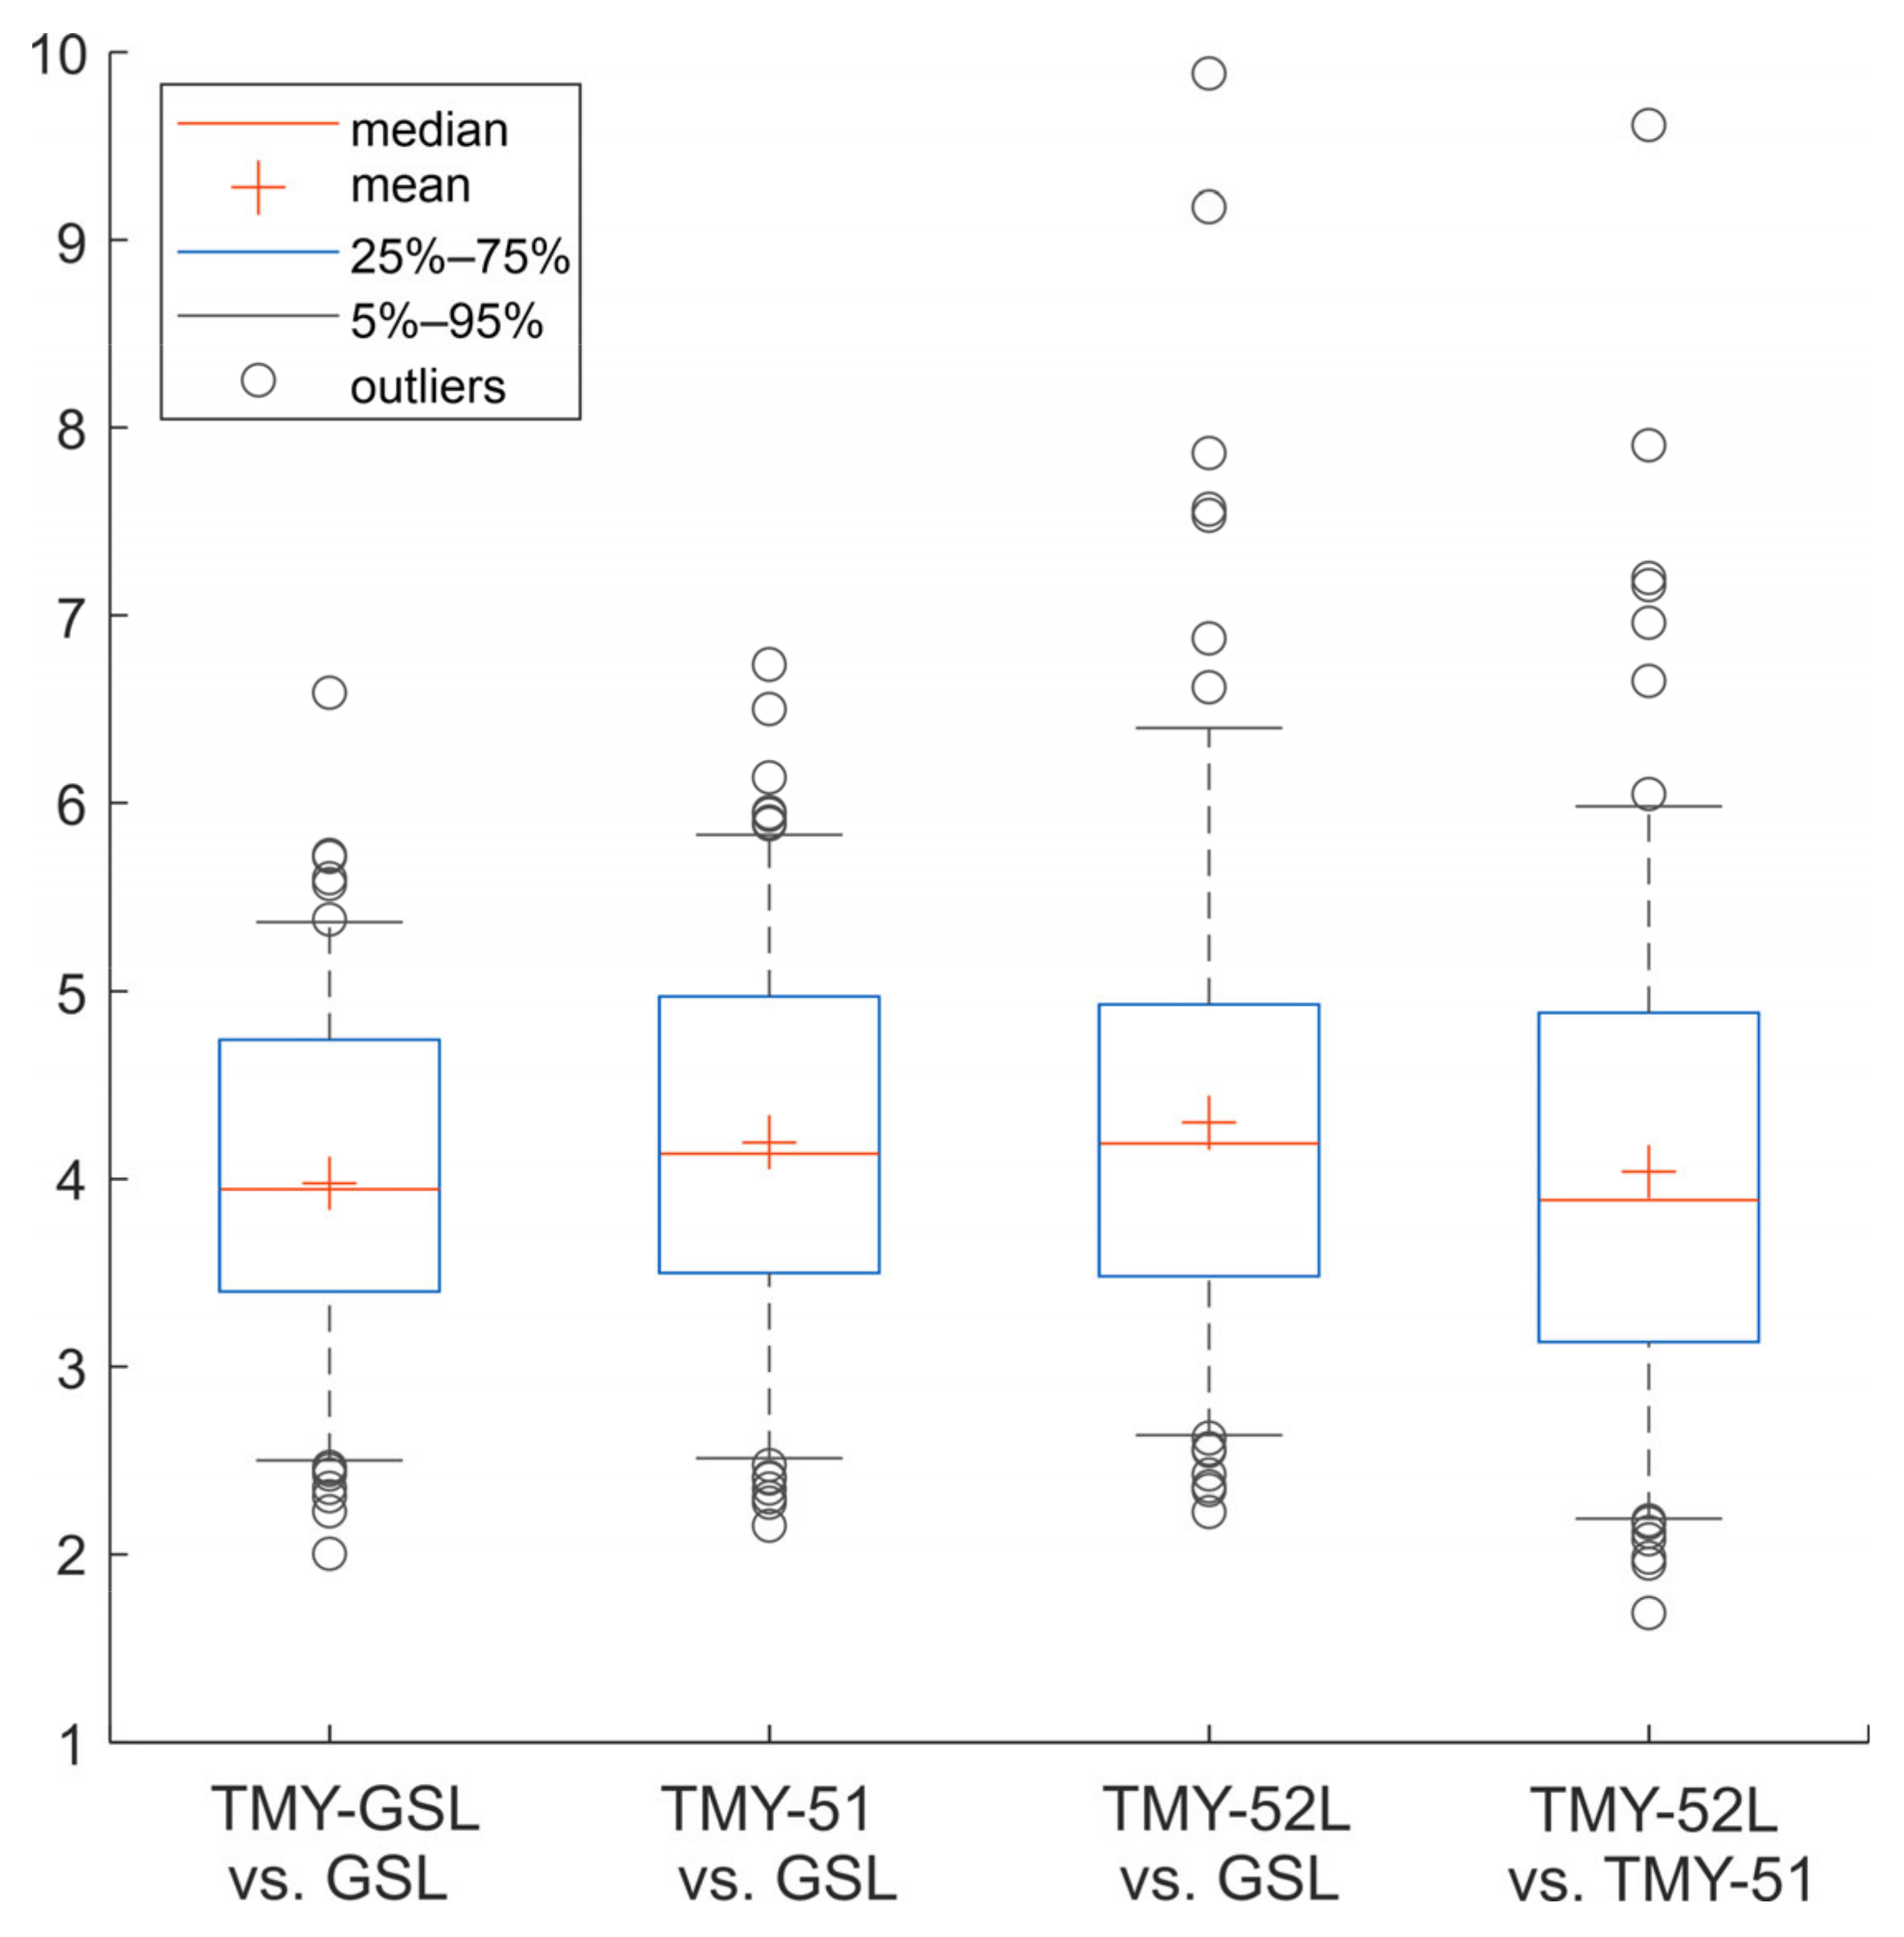
3.3. Applying an Extended Time Period 2005–2020
- GSL: Ground station data from the 16-year time period (2005–2020). The meteorological elements—T, Td, and WS—come from ground station meteorological data, while GHI comes from SARAH-2 or ERA5 (in areas above the 65° N latitude);
- TMY-GSL: TMY generated on the basis of ground station data from the 16-year time period (2005–2020), following the ISO 15927-4 procedure;
- TMY-51: TMY from PVGIS 5.1, generated from the 12-year time period (2005–2016);
- TMY-52L: TMY from PVGIS 5.2, generated from the 16-year time period (2005–2020).
- TMY-GSL (tested data) against GSL (reference data);
- TMY-51 (tested data) against GSL (reference data);
- TMY-52L (tested data) against GSL (reference data);
- TMY-52L (tested data) against TMY-51 (reference data).
3.4. Applying the Temperature Downscaling
- GS: Ground station data from the 12-year time period (2005–2016). The meteorological elements—T, Td and WS—come from ground station meteorological data, while GHI comes from SARAH-2 or ERA5 (in areas above the 65° N latitude);
- TMY-GS: TMY generated on the basis of ground station data from the 12-year time period (2005–2016), following the ISO 15927-4 procedure;
- TMY-52: TMY from PVGIS 5.2, generated from the 12-year time period (2005–2016);
- TMY-52ds: TMY from PVGIS 5.2, generated from the 12-year time period (2005–2016), with the temperature downscaling procedure applied.
- TMY-GS (tested data) against GS (reference data);
- TMY-52 (tested data) against GS (reference data);
- TMY-52ds (tested data) against GS (reference data);
- TMY-52ds (tested data) against TMY-52 (reference data).
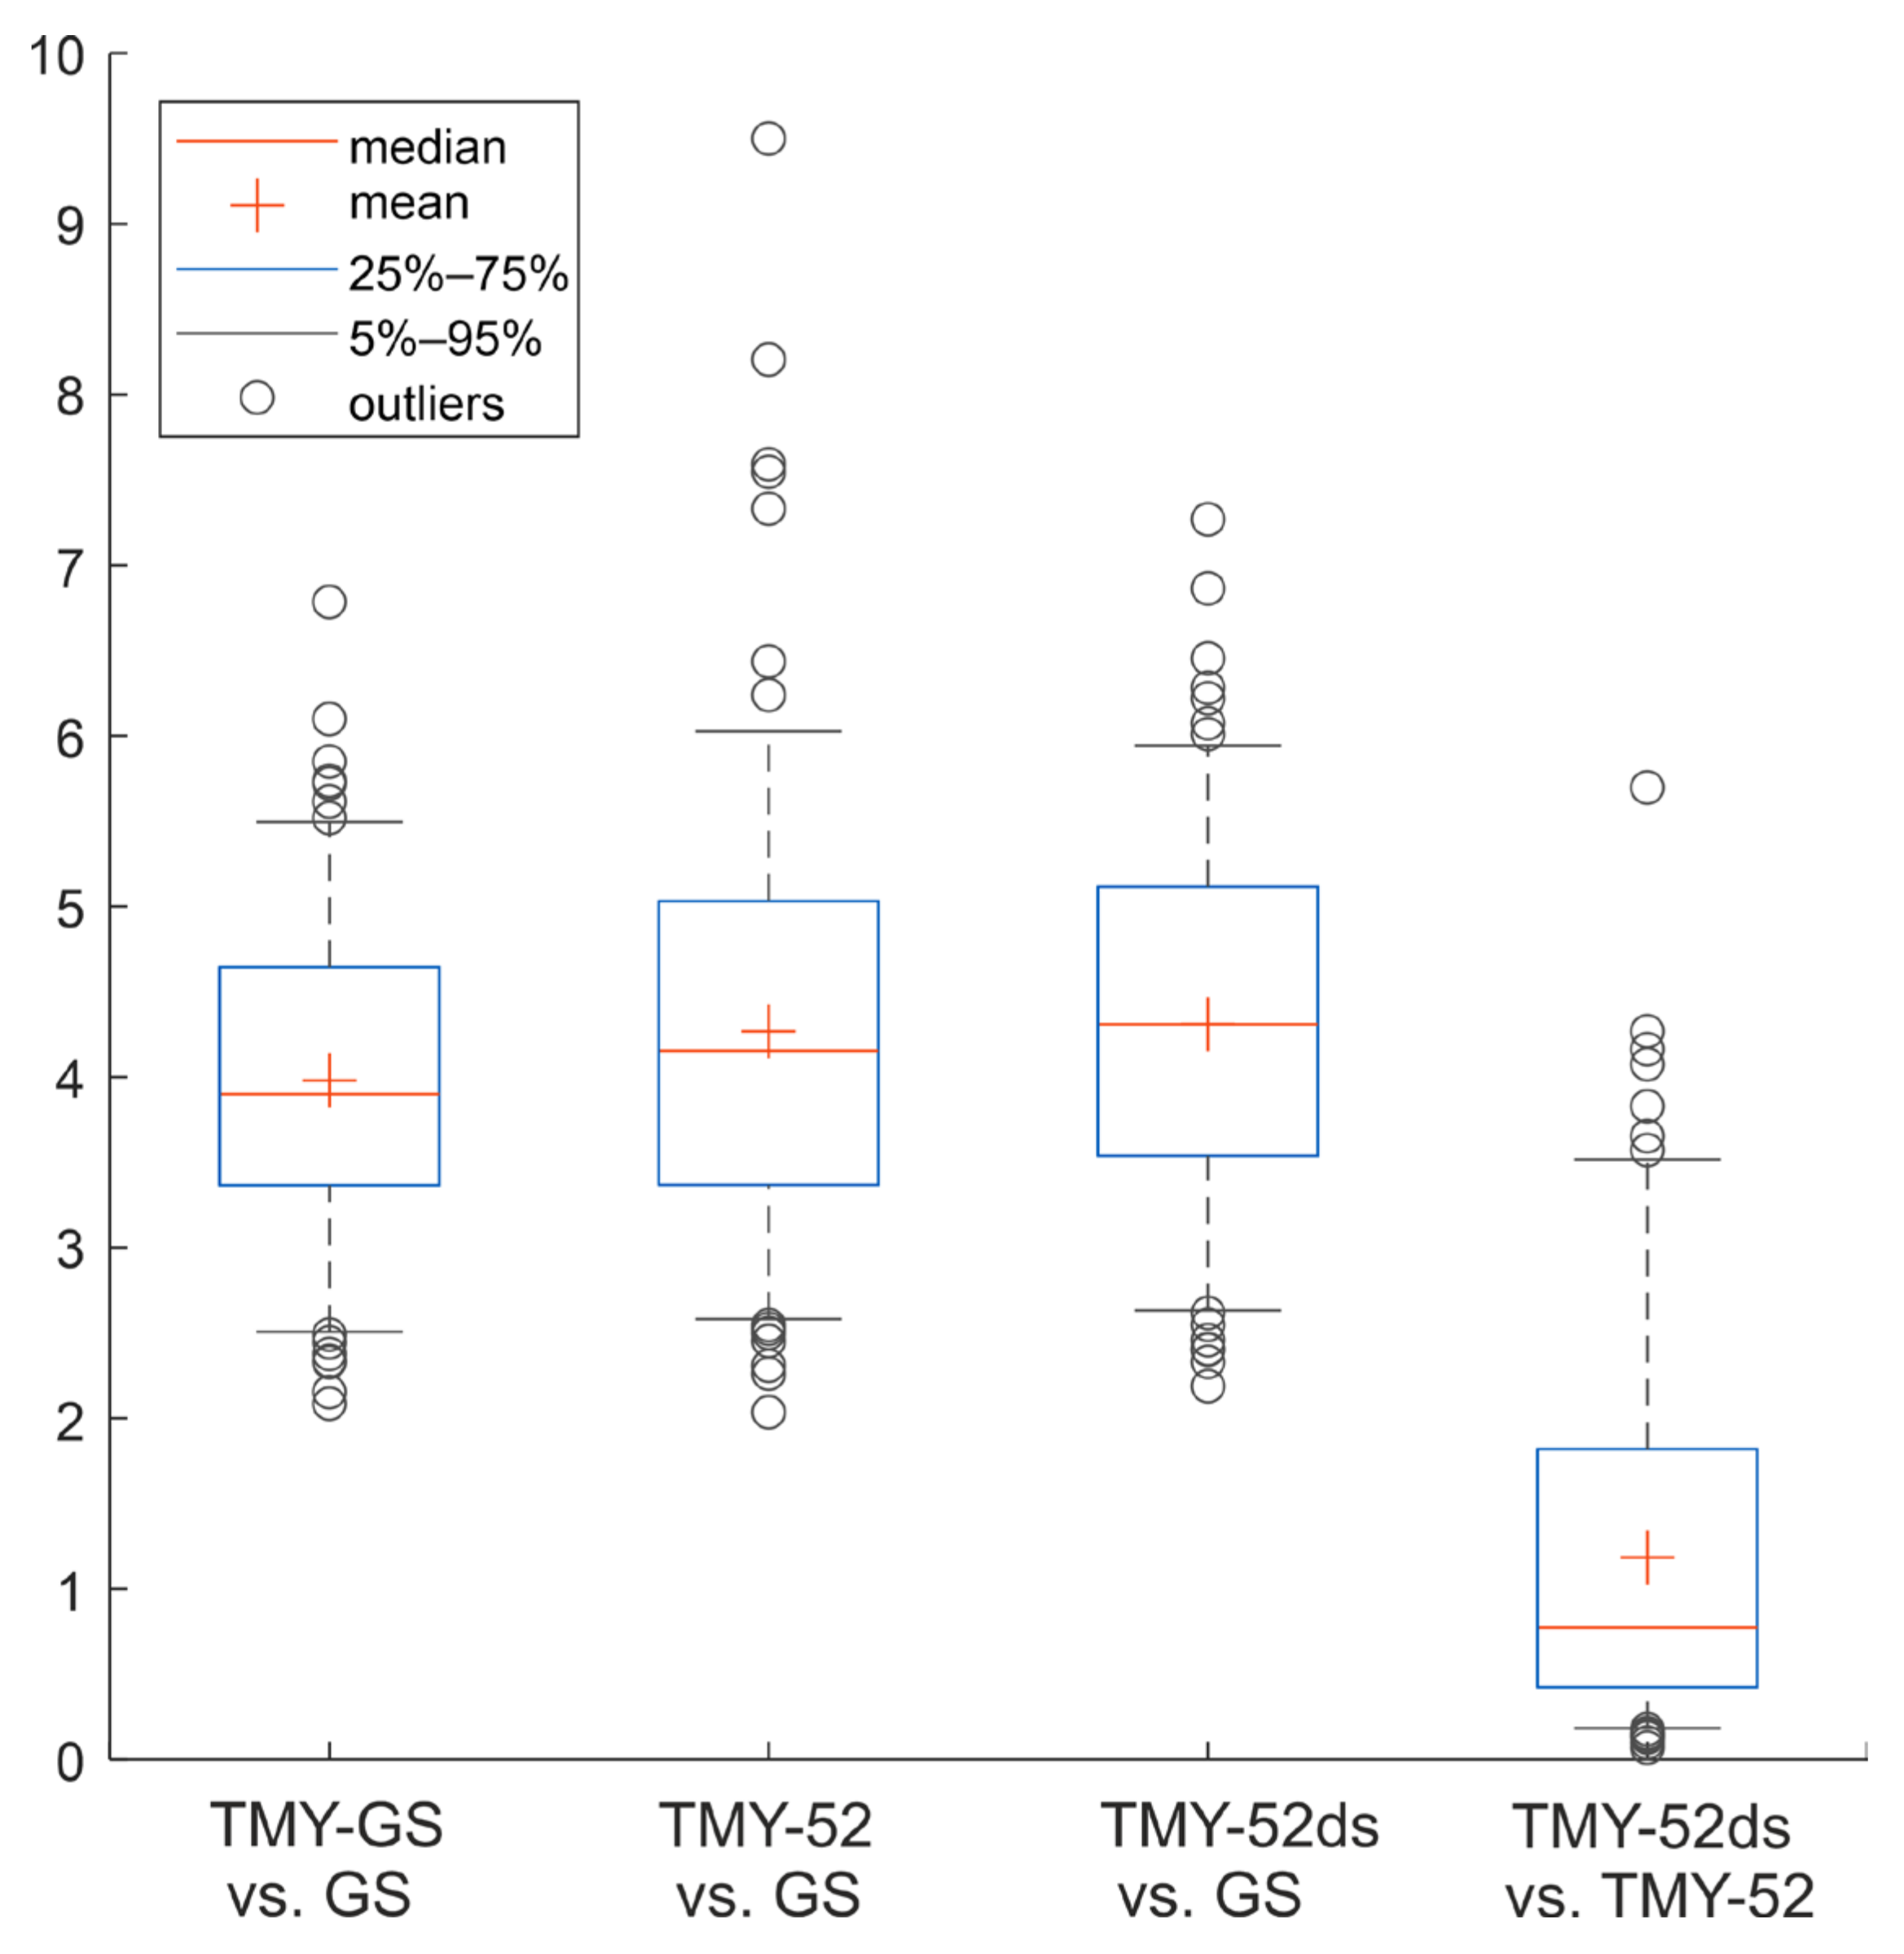
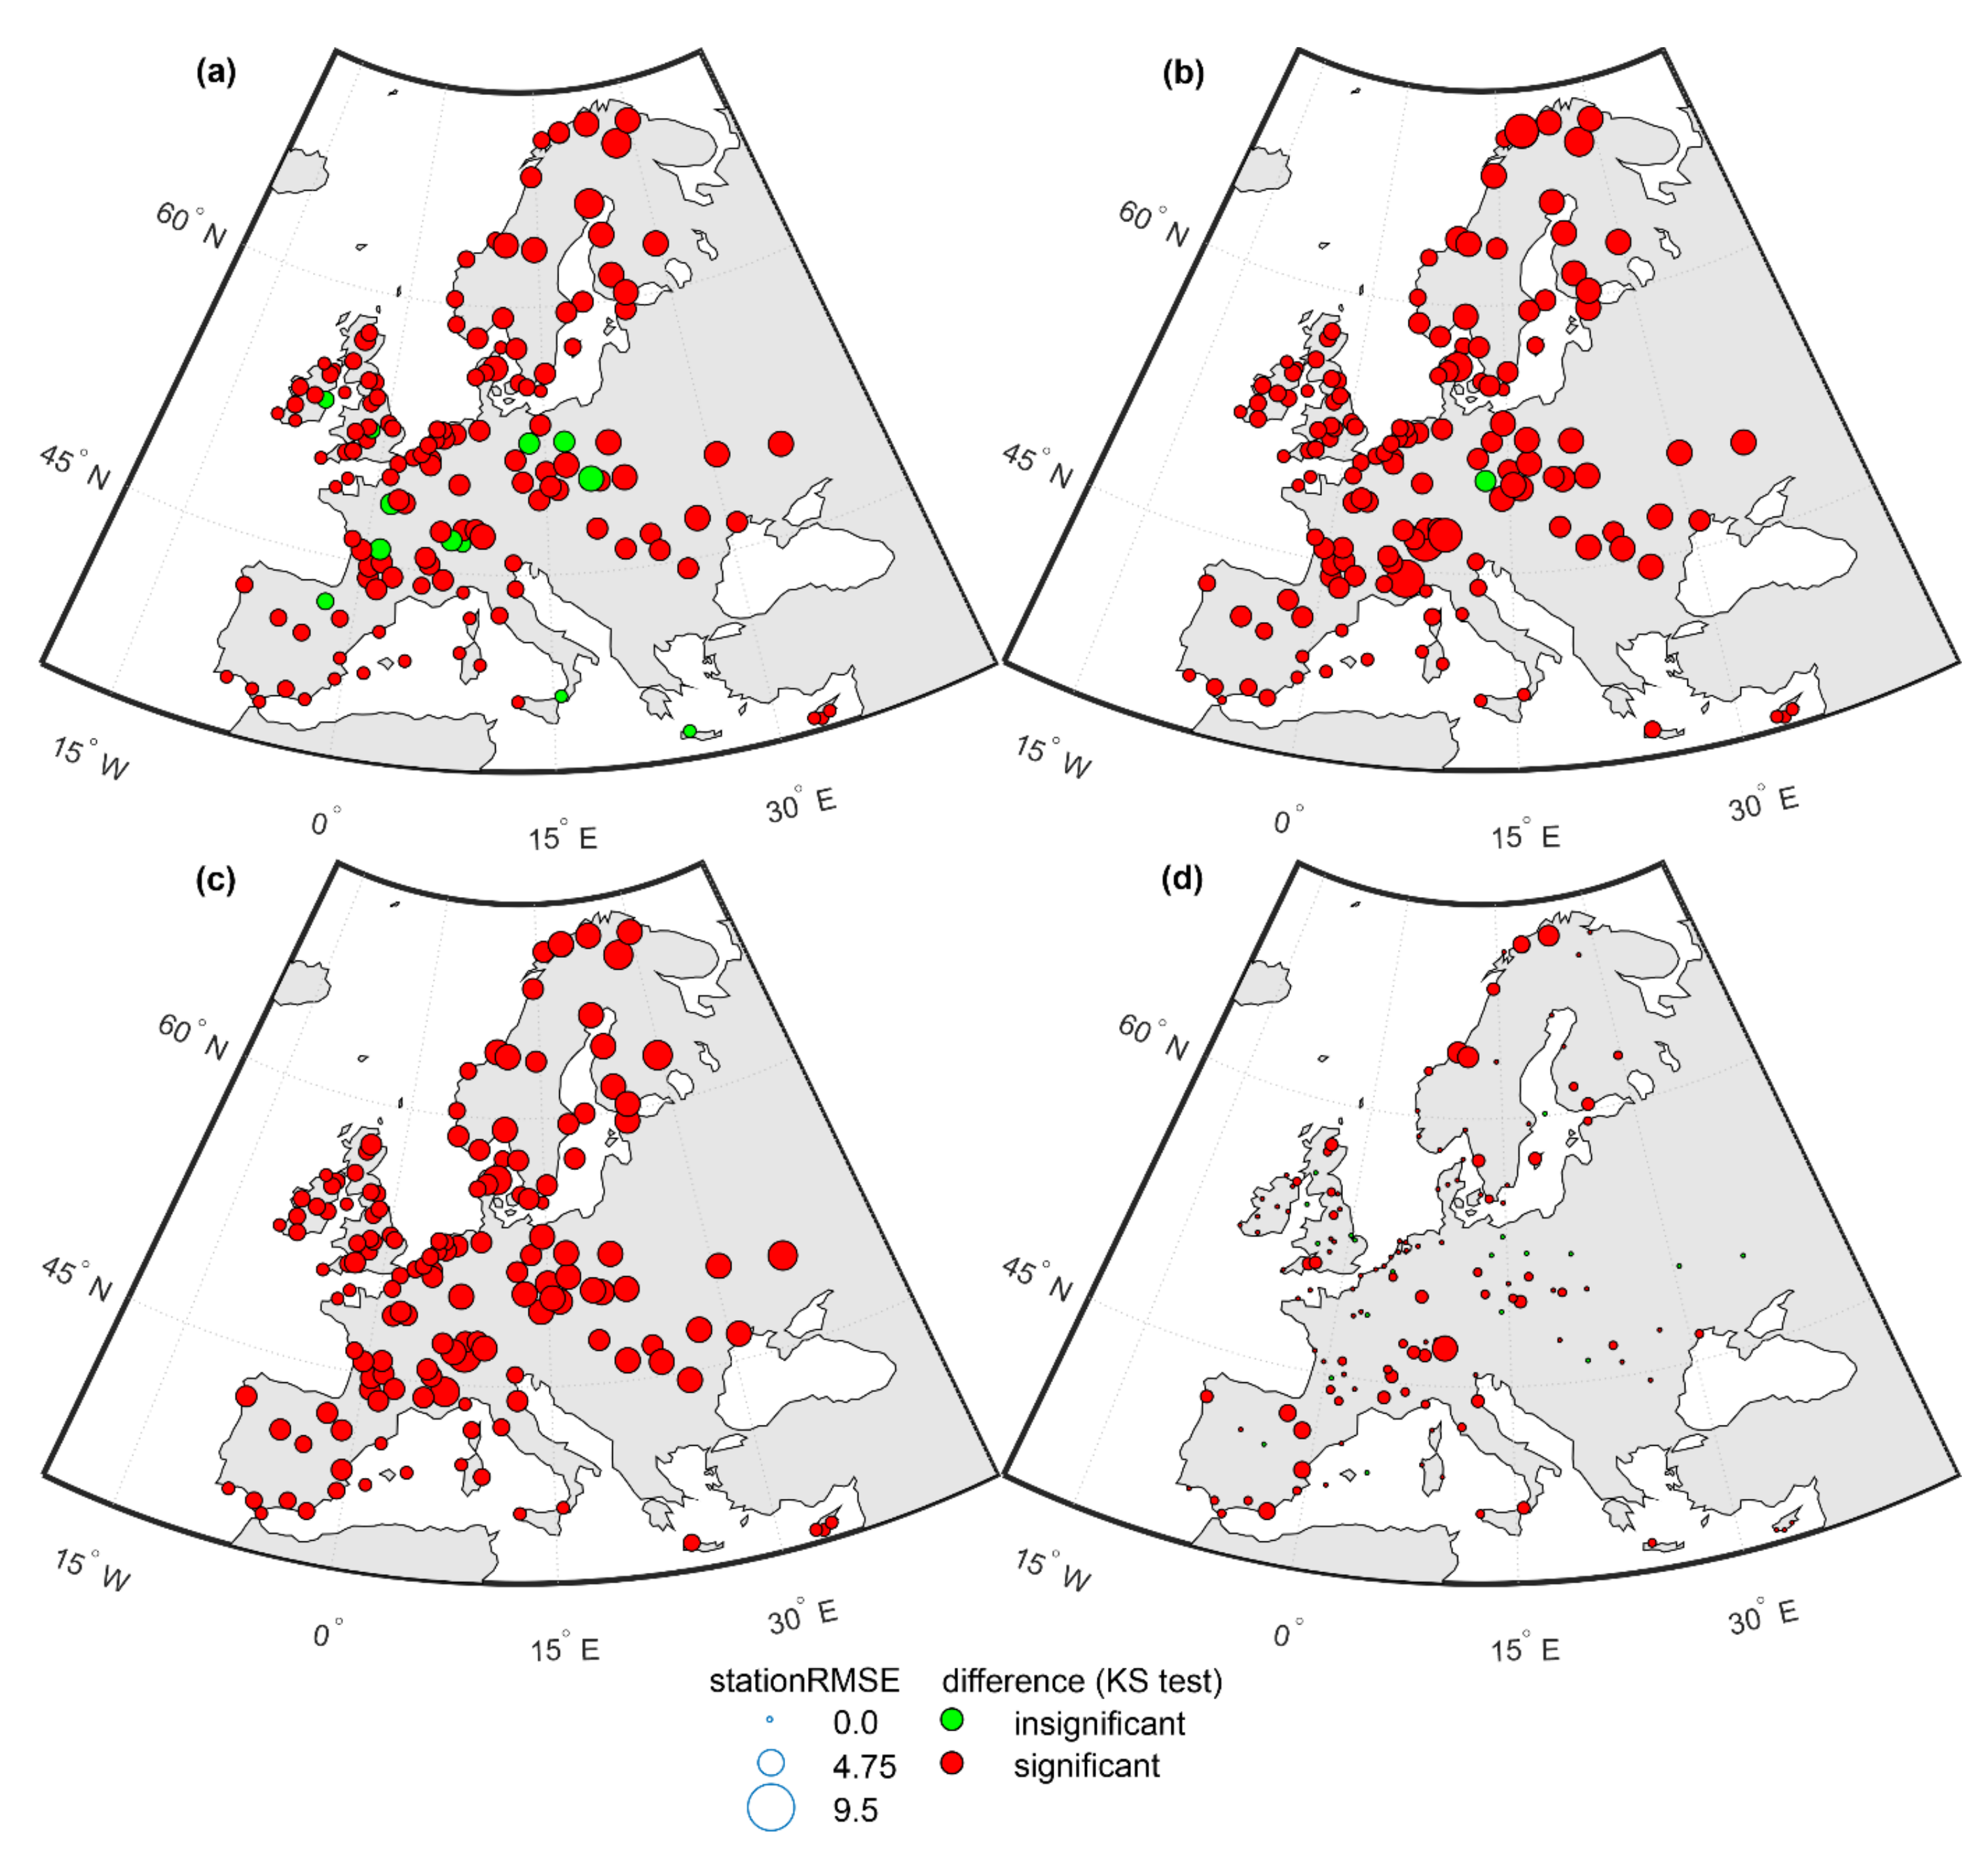
3.4.1. Comparisons Based on MB and RMSE for Daily Average T—Data Sets with Downscaled Temperature
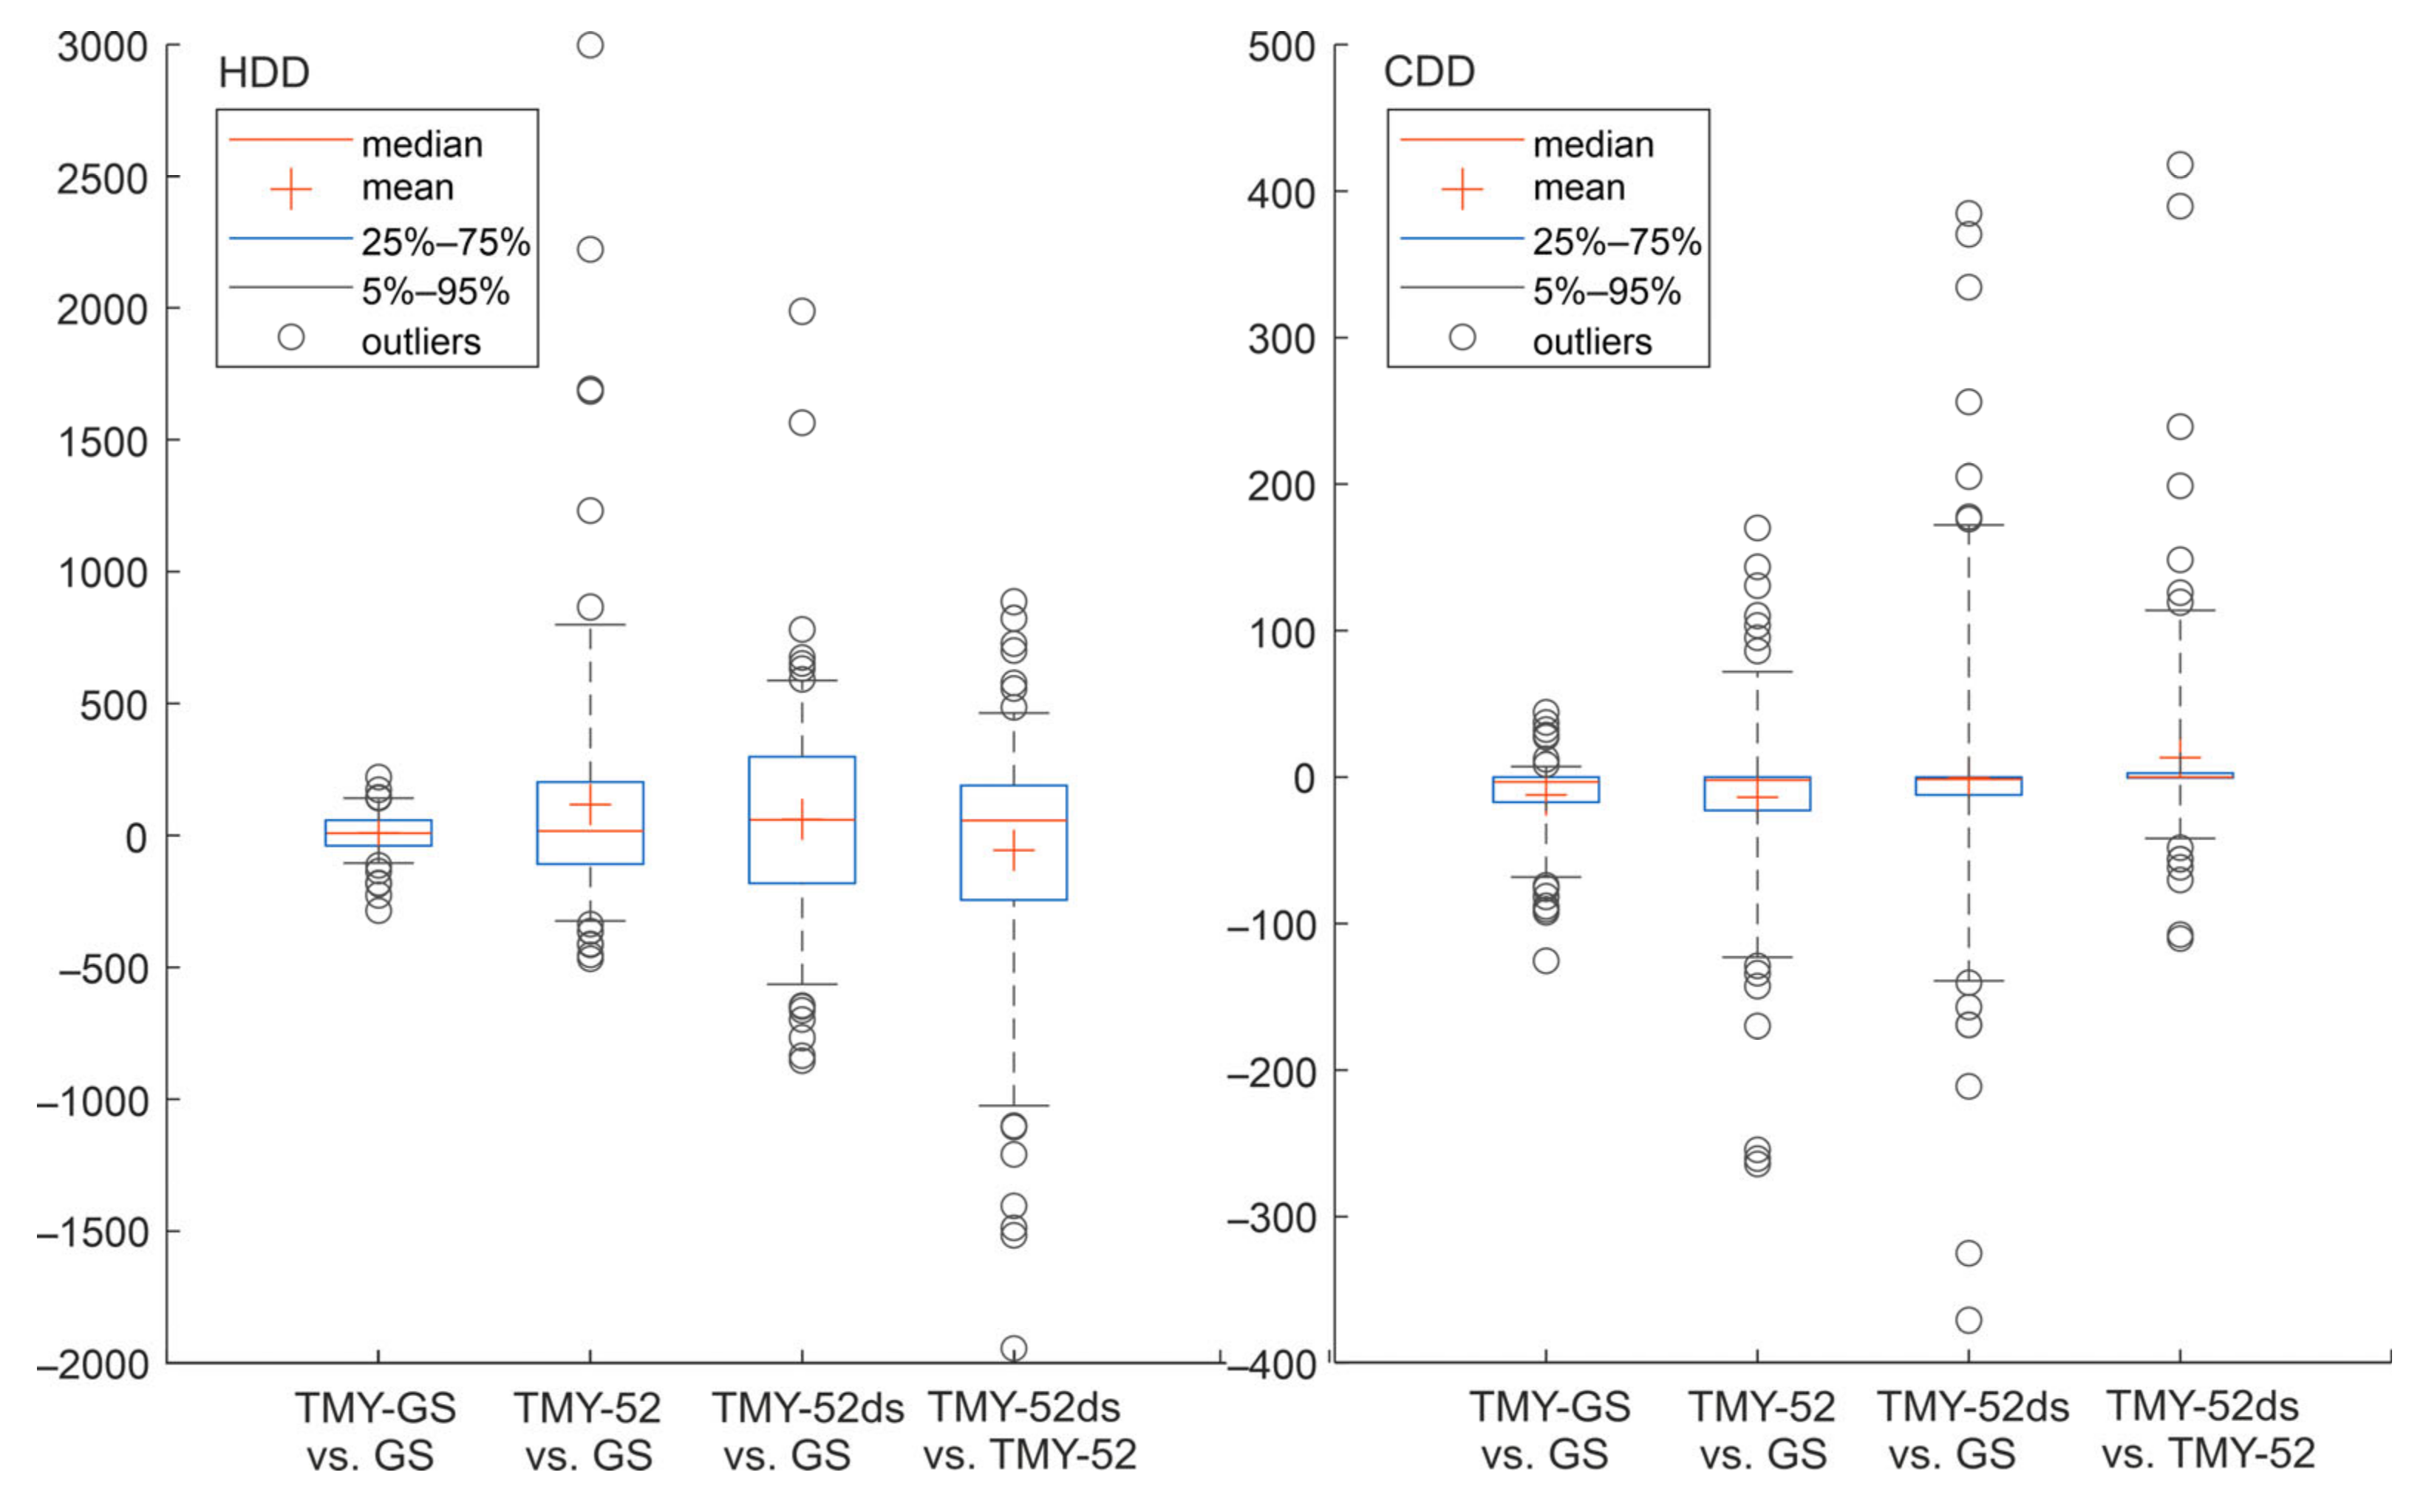
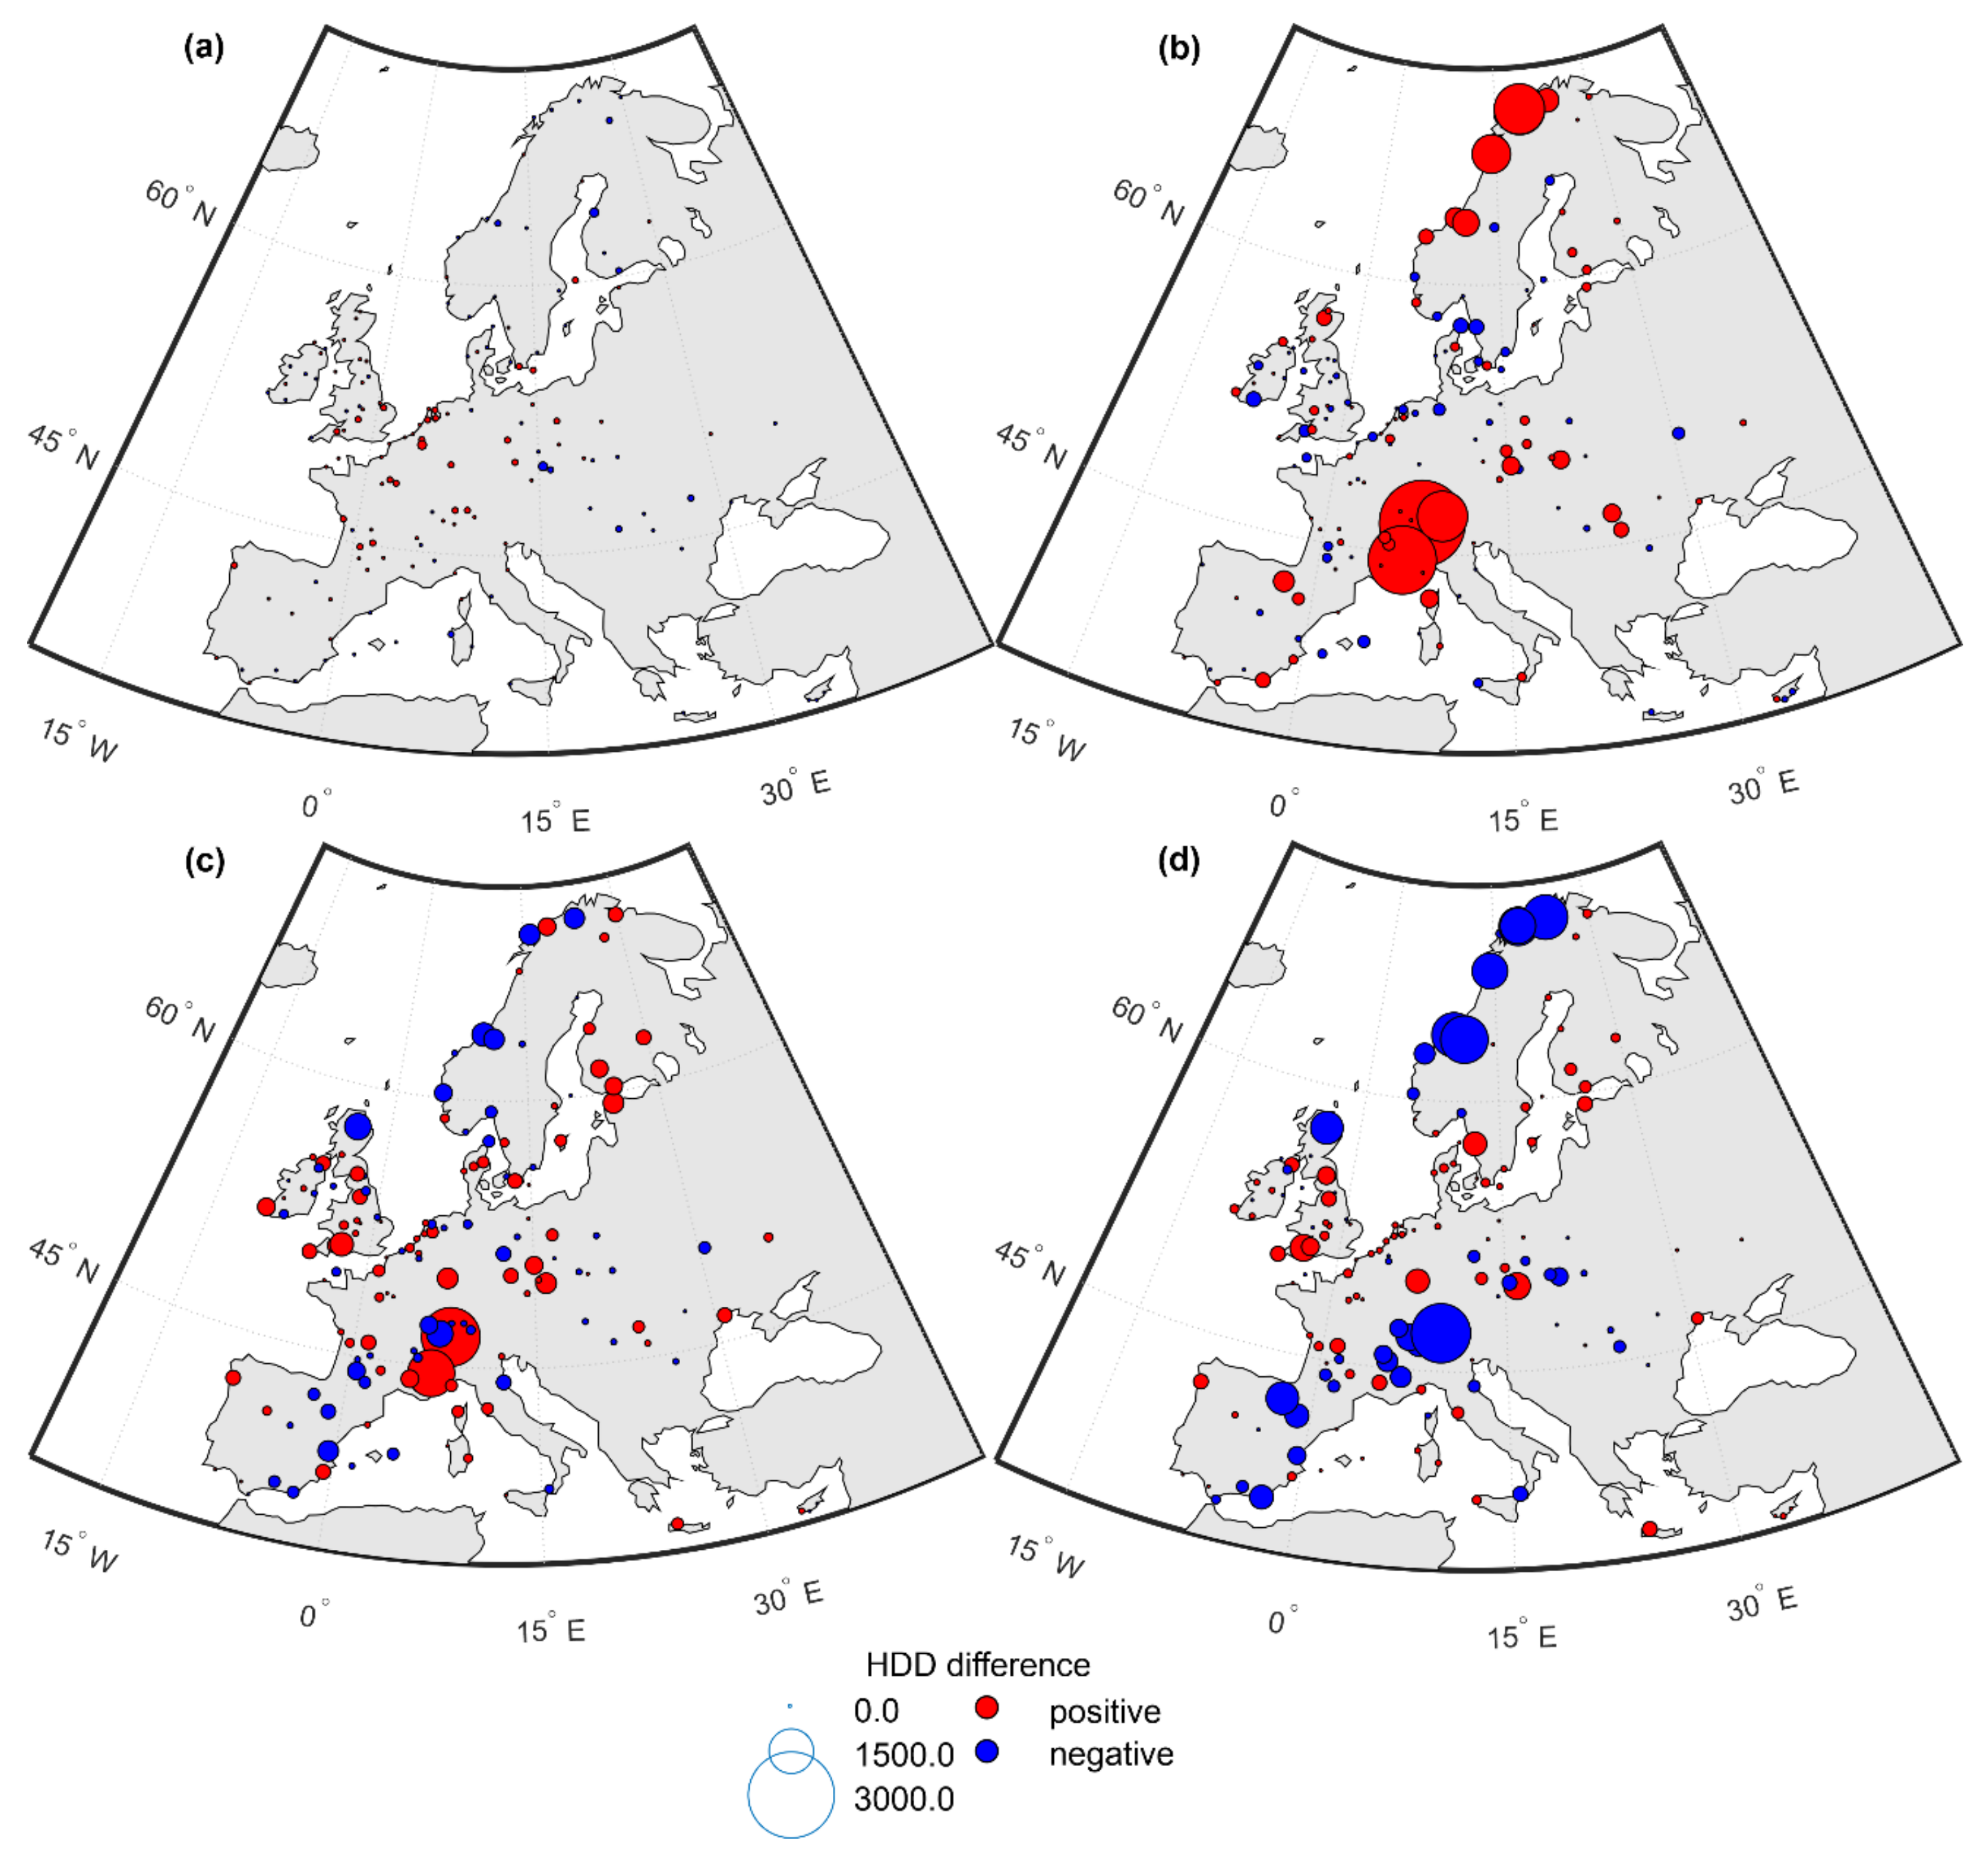
3.4.2. Comparisons Based on HDDs and CDDs—Data Sets with Downscaled Temperature
4. Discussion and Conclusions
Author Contributions
Funding
Institutional Review Board Statement
Informed Consent Statement
Data Availability Statement
Acknowledgments
Conflicts of Interest
Abbreviations
| API | Application Programming Interface |
| CDD | Cooling degree day |
| CMSAF | Satellite Application Facility for Climate Modelling |
| DEM | Digital Elevation Model |
| ECMWF | European Centre for Medium-Range Weather Forecasts |
| ERA5 | The fifth generation of ECMWF reanalysis for the global climate and weather |
| ERA5-Land | The fifth generation of ECMWF reanalysis for the global climate and weather at an enhanced resolution compared to ERA5 |
| GHI | Global horizontal irradiance |
| GRASS | Geographic Resource Analysis Support System |
| GS | Ground stations data set |
| GSL | Ground stations data set for an extended time period (2005–2020) |
| HDD | Heating degree day |
| ISD-Lite | Integrated Surface Database |
| ISO | International Organization for Standardization |
| MB | Mean Bias |
| mRMSE | Mean value of Root Mean Square Error |
| NOAA | National Oceanic and Atmospheric Administration |
| PVGIS | Photovoltaic Geographical Information System |
| RMSE | Root Mean Square Error |
| SARAH-1 | Surface Solar Radiation Data Set—Heliosat, Edition 1 |
| SARAH-2 | Surface Solar Radiation Data Set—Heliosat, Edition 2 |
| SLP | Sea level pressure |
| SRTM | Shuttle Radar Topography Mission |
| stationMB | Mean Bias for an individual station |
| stationRMSE | Root Mean Square Error for an individual station |
| SYNOP | Surface synoptic observations |
| T | 2-metre air temperature |
| Td | 2-metre dew point temperature |
| TMY | Typical meteorological year |
| TMY-GS | Typical meteorological year on the basis of ground station data set |
| TMY-GSL | Typical meteorological year on the basis of ground station data set for an extended time period (2005–2020) |
| TMY-51 | PVGIS 5.1 typical meteorological year data set |
| TMY-52 | PVGIS 5.2 typical meteorological year data set |
| TMY-52ds | PVGIS 5.2 typical meteorological year data set with temperature downscaled |
| TMY-52L | PVGIS 5.2 typical meteorological year data set for an extended time period (2005–2020) |
| WS | Wind speed |
| WD | Wind direction |
References
- Hone, T.Z.; Chang, W.K.; Line, H.W. A Sensitivity Study of Building Performance using 30-Year Actual Weather Data. In Proceedings of the 13th International Conference of the International-Building-Performance-Simulation-Association (IBPSA), Chambery, France, 11 July 2013. [Google Scholar]
- Kim, Y.; Jang, H.K.; Yu, K.H. Study on Extension of Standard Meteorological Data for Cities in South Korea Using ISO 15927-4. Atmosphere 2017, 8, 220. [Google Scholar] [CrossRef]
- Qiao, Q.Y.; Yunusa-Kaltungo, A.; Edwards, R. Predicting Building Energy Consumption based on Meteorological Data. In Proceedings of the 7th Annual IEEE PES/IAS PowerAfrica Conference (PAC)—Sustainable and Smart Energy Revolutions for Powering Africa, Nairobi, Kenya, 25–28 August 2020. [Google Scholar]
- Üner, M.; İleri, A. Typical weather data of main Turkish cities for energy applications. Int. J. Energy Res. 2000, 24, 727–748. [Google Scholar] [CrossRef]
- Bulut, H. Typical solar radiation year for southeastern Anatolia. Renew. Energy 2004, 29, 1477–1488. [Google Scholar] [CrossRef]
- Zhou, J.; Wu, Y.; Yan, G. Generation of typical solar radiation year for China. Renew. Energy 2006, 31, 1972–1985. [Google Scholar] [CrossRef]
- Gawin, D.; Kossecka, E. (Eds.) Typowy rok Meteorologiczny do Symulacji Wymiany Ciepła i Masy w Budynkach (Typical Meteorological Year for Simulating Heat and Mass Transfer in Buildings); Drukarnia Wydawnictw Naukowych: Łódź, Poland, 2002. [Google Scholar]
- Hall, I.; Prairie, R.R.; Anderson, H.E.; Boes, E.C. Generation of a Typical Meteorological Year; Sandia Labs: Albuquerque, NM, USA, 1978. [Google Scholar]
- Wilcox, S.; Marion, W. Users Manual for TMY3 Data Sets; National Renewable Energy Laboratory: Golden, CO, USA, 2008.
- Skeiker, K. Comparison of methodologies for TMY generation using 10 years data for Damascus, Syria. Energy Convers. Manag. 2007, 48, 2090–2102. [Google Scholar] [CrossRef]
- Yang, D.; Gueymard, C.A. Producing high-quality solar resource maps by integrating high- and low-accuracy measurements using Gaussian processes. Renew. Sustain. Energy Rev. 2019, 113, 109260. [Google Scholar] [CrossRef]
- Crow, L.W. Weather year for energy calculations. ASHRAE J. 1984, 26, 42–47. [Google Scholar]
- Lund, H.; Eidorff, E. Selection Methods for Production of Test Reference Years; Technical University of Denmark, Department of Buildings and Energy: Kongens Lyngby, Denmark, 1985. [Google Scholar]
- EN ISO 15927-4; Hygrothermal Performance of Buildings—Calculation and Presentation of Climatic Data—Part 4: Data for Assessing the Annual Energy for Cooling and Heating Systems. CEN: Brussels, Belgium, 2003.
- Kulesza, K. Comparison of typical meteorological year and multi-year time series of solar conditions for Belsk, central Poland. Renew. Energy 2017, 113, 1135–1140. [Google Scholar] [CrossRef]
- Garcia, I.; Torres, J.L. Assessment of the adequacy of EN ISO 15927-4 reference years for photovoltaic systems. Prog. Photovolt. 2015, 23, 1956–1969. [Google Scholar] [CrossRef]
- Couce-Casanova, A.; Lopez-De Ullibarri, I.; Lamas-Galdo, M.; Rodríguez-García, J. Creation of a typical meteorological year in Spain. Step by step application of the method based on UNE-EN ISO-15927-4:2011. Dyna 2022, 97, 620–624. [Google Scholar] [CrossRef]
- Ruduks, M.; Lesinskis, A. Test Reference Year of Riga, Latvia. In Proceedings of the 6th International Scientific Conference on Research for Environment and Civil Engineering Development (Civil Engineering), Jelgava, Latvia, 2–3 November 2017. [Google Scholar]
- Huld, T.; Paietta, E.; Zangheri, P.; Pascua, I.P. Assembling Typical Meteorological Year Data Sets for Building Energy Performance Using Reanalysis and Satellite-Based Data. Atmosphere 2018, 9, 53. [Google Scholar] [CrossRef]
- ISD-Lite. Integrated Surface Database Archive; NOAA: Silver Spring, MD, USA, 2006.
- Smith, A.; Lott, N.; Vose, R. The Integrated Surface Database: Recent Developments and Partnerships. Bull. Am. Meteorol. Soc. 2011, 92, 704–708. [Google Scholar] [CrossRef]
- Pfeifroth, U.; Kothe, S.; Müller, R.; Trentmann, J.; Hollmann, R.; Fuchs, P.; Werscheck, M. Surface Radiation Data Set—Heliosat (SARAH)—Edition 2. Satellite Application Facility on Climate Monitoring; EUMESAT: Darmstadt, Germany, 2017. [Google Scholar]
- Posselt, R.; Müller, R.W.; Stöckli, R.; Trentmann, J. Remote sensing of solar surface radiation for climate monitoring—The CM-SAF retrieval in international comparison. Remote Sens. Environ. 2012, 118, 186–198. [Google Scholar] [CrossRef]
- Gracia Amillo, A.M.; Taylor, N.; Martinez, A.M.; Dunlop, E.D.; Mavrogiorgios, P.; Fahl, F.; Arcaro, G.; Pinedo, I. Adapting PVGIS to Trends in Climate, Technology and User Needs. In Proceedings of the 38th European Photovoltaic Solar Energy Conference and Exhibition (PVSEC), Online, 6–10 September 2021. [Google Scholar]
- Hersbach, H.; Bell, B.; Berrisford, P.; Hirahara, S.; Horanyi, A.; Muñoz-Sabater, J.; Nicolas, J.; Peubey, C.; Radu, R.; Schepers, D.; et al. The ERA5 global reanalysis. Q. J. R. Meteorol. Soc. 2020, 146, 1999–2049. [Google Scholar] [CrossRef]
- Berrisford, P.; Dee, D.P.; Poli, P.; Fielding, B.M.; Fuentes, M.; Kållberg, P.W.; Kobayashi, S.; Uppala, S.; Simmons, A. The ERA-Interim Archive Version 2.0; ECMWF: Reading, UK, 2011. [Google Scholar]
- Dee, D.P.; Uppala, S.M.; Simmons, A.J.; Berrisford, P.; Poli, P.; Kobayashi, S.; Andrae, U.; Balmaseda, M.A.; Balsamo, G.; Bauer, P.; et al. The ERA-Interim reanalysis: Configuration and performance of the data assimilation system. Q. J. R. Meteorol. Soc. 2011, 137, 553–597. [Google Scholar] [CrossRef]
- Huld, T.; Pascua, I.P. Spatial Downscaling of 2-Meter Air Temperature Using Operational Forecast Data. Energies 2015, 8, 2381–2411. [Google Scholar] [CrossRef]
- Pfeifroth, U.; Kothe, S.; Müller, R.; Trentmann, J.; Hollmann, R.; Fuchs, P.; Werscheck, M. Surface Solar Radiation Data Set—Heliosat (SARAH)—Edition 1. Satellite Application Facility on Climate Monitoring; EUMESAT: Darmstadt, Germany, 2015. [Google Scholar]
- Muñoz-Sabater, J.; Dutra, E.; Agusti-Panareda, A.; Albergel, C.; Arduini, G.; Balsamo, G.; Bousetta, S.; Choulga, M.; Harrigan, S.; Hersbach, H.; et al. ERA5-Land: A state-of-the-art global reanalysis dataset for land applications. Earth Syst. Sci. Data 2021, 13, 4349–4383. [Google Scholar] [CrossRef]
- Eurostat. Energy Statistics—Cooling and Heating Degree Days (nrg_chdd); Eurostat: Luxembourg, 2023. [Google Scholar]
- Fortuniak, K.; Kożuchowski, K.; Żmudzka, E. Trendy i okresowość zmian temperatury powietrza w Polsce w drugiej połowie XX wieku (Trends and periodicity of changes in air temperature in Poland in the second half of 20th century). Przegląd Geofiz. 2001, 46, 283–303. [Google Scholar]
- Sanchez-Lorenzo, A.; Wild, M.; Trentmann, J. Validation and stability assessment of the monthly mean CM SAF surface solar radiation dataset over Europe against a homogenized surface dataset (1983–2005). Remote Sens. Environ. 2013, 134, 355–366. [Google Scholar] [CrossRef]
- McMahan, V.A.C.; Grover, C.N. Chapter 5—Bankable Solar-Radiation Datasets. In Solar Energy Forecasting and Resource Assessment; Kleissl, J., Ed.; Academic Press: Boston, MA, USA, 2013; pp. 97–131. [Google Scholar]
- Cebecauer, T.; Suri, M. Typical Meteorological Year Data: SolarGIS Approach. Energy Procedia 2015, 69, 1958–1969. [Google Scholar] [CrossRef]
- Nelken, K.; Żmudzka, E. TMY versus multi-year time series of meteorological conditions for the characterization of central Poland’s suitability for photovoltaics. Meteorol. Z. 2017, 26, 21–31. [Google Scholar] [CrossRef]
- Vignola, F.; Grover, C.; Lemon, N. Building a bankable solar radiation dataset. Sol. Energy 2012, 86, 2218–2229. [Google Scholar] [CrossRef]




| Parameter | PVGIS 5.1 | PVGIS 5.2 |
|---|---|---|
| Solar radiation (satellite) | CMSAF SARAH-1 Time frame 2005–2016 Temporal resolution: 1 h Spatial resolution: 5 × 5 km | CMSAF SARAH-2 Time frame 2005–2020 Temporal resolution: unchanged Spatial resolution: unchanged |
| Solar radiation (reanalysis) | ECMWF ERA5 Time frame 2010–2016 Temporal resolution: 1 h Spatial resolution: 31 × 31 km | ECMWF ERA5 Time frame 2005–2020 Temporal resolution: unchanged Spatial resolution: unchanged |
| Temperature | ECMWF ERA-Interim Temporal resolution: 1 h Spatial resolution: 81 × 81 km + downscaling | ECMWF ERA5-Land Temporal resolution: 1 h Spatial resolution: 9 × 9 km |
| Wind speed | ECMWF ERA-Interim Temporal resolution: 1 h Spatial resolution: 81 × 81 km | ECMWF ERA5-Land Temporal resolution: 1 h Spatial resolution: 9 × 9 km |
| Other TMY elements | ECMWF ERA-Interim Temporal resolution: 1 h Spatial resolution: 81 × 81 km | ECMWF ERA5-Land Temporal resolution: 1 h Spatial resolution: 9 × 9 km |
| Spectral corrections | SARAH-1 (2011) | Unchanged |
| Digital Elevation Model | SRTM 3 DEM (90 m) | Unchanged |
| Horizon | GRASS function, from DEM | Unchanged |
| Comparison | mRMSE | Maximum stationRMSE | Minimum stationRMSE | a |
|---|---|---|---|---|
| TMY-GS vs. GS | 3.98 | 6.78 | 2.09 | 12 |
| TMY-51 vs. GS | 4.19 | 6.77 | 2.15 | 1 |
| TMY-52 vs. GS | 4.27 | 9.50 | 2.04 | 1 |
| TMY-52 vs. TMY-51 | 3.85 | 8.55 | 1.73 | 0 |
| Comparison | HDDs | CDDs | ||
|---|---|---|---|---|
| MB | RMSE | MB | RMSE | |
| TMY-GS vs. GS | 9.18 | 81.42 | −12.26 | 27.28 |
| TMY-51 vs. GS | 27.18 | 257.97 | −16.67 | 65.06 |
| TMY-52 vs. GS | 117.34 | 471.93 | −13.85 | 60.57 |
| TMY-52 vs. TMY-51 | 90.16 | 468.07 | 2.82 | 60.99 |
| Comparison | mRMSE | Maximum stationRMSE | Minimum stationRMSE | a |
|---|---|---|---|---|
| TMY-GSL vs. GSL | 3.98 | 6.60 | 2.01 | 1 |
| TMY-51 vs. GSL | 4.20 | 6.75 | 2.16 | 0 |
| TMY-52L vs. GSL | 4.31 | 9.90 | 2.23 | 0 |
| TMY-52L vs. TMY-51 | 4.05 | 9.63 | 1.69 | 0 |
| Comparison | mRMSE | Maximum stationRMSE | Minimum stationRMSE | a |
|---|---|---|---|---|
| TMY-GS vs. GS | 3.98 | 6.78 | 2.09 | 12 |
| TMY-52 vs. GS | 4.27 | 9.50 | 2.04 | 1 |
| TMY-52ds vs. GS | 4.31 | 7.27 | 2.19 | 0 |
| TMY-52ds vs. TMY-52 | 1.18 | 5.70 | 0.07 | 19 |
| Comparison | HDDs | CDDs | ||
|---|---|---|---|---|
| MB | RMSE | MB | RMSE | |
| TMY-GS vs. GS | 9.18 | 81.42 | −12.26 | 27.28 |
| TMY-52 vs. GS | 117.34 | 471.93 | −13.85 | 60.57 |
| TMY-52ds vs. GS | 61.07 | 394.73 | −0.50 | 88.16 |
| TMY-52ds vs. TMY-52 | −56.27 | 459.36 | 13.35 | 63.87 |
Disclaimer/Publisher’s Note: The statements, opinions and data contained in all publications are solely those of the individual author(s) and contributor(s) and not of MDPI and/or the editor(s). MDPI and/or the editor(s) disclaim responsibility for any injury to people or property resulting from any ideas, methods, instructions or products referred to in the content. |
© 2023 by the authors. Licensee MDPI, Basel, Switzerland. This article is an open access article distributed under the terms and conditions of the Creative Commons Attribution (CC BY) license (https://creativecommons.org/licenses/by/4.0/).
Share and Cite
Kulesza, K.; Martinez, A.; Taylor, N. Assessment of Typical Meteorological Year Data in Photovoltaic Geographical Information System 5.2, Based on Reanalysis and Ground Station Data from 147 European Weather Stations. Atmosphere 2023, 14, 1803. https://doi.org/10.3390/atmos14121803
Kulesza K, Martinez A, Taylor N. Assessment of Typical Meteorological Year Data in Photovoltaic Geographical Information System 5.2, Based on Reanalysis and Ground Station Data from 147 European Weather Stations. Atmosphere. 2023; 14(12):1803. https://doi.org/10.3390/atmos14121803
Chicago/Turabian StyleKulesza, Kinga, Ana Martinez, and Nigel Taylor. 2023. "Assessment of Typical Meteorological Year Data in Photovoltaic Geographical Information System 5.2, Based on Reanalysis and Ground Station Data from 147 European Weather Stations" Atmosphere 14, no. 12: 1803. https://doi.org/10.3390/atmos14121803
APA StyleKulesza, K., Martinez, A., & Taylor, N. (2023). Assessment of Typical Meteorological Year Data in Photovoltaic Geographical Information System 5.2, Based on Reanalysis and Ground Station Data from 147 European Weather Stations. Atmosphere, 14(12), 1803. https://doi.org/10.3390/atmos14121803


