Article

Diagnostic Study of a Severe Dust Storm over North Africa and the Arabian Peninsula

1
Department of Geography, College of Arts, Princess Nourah bint Abdulrahman University, P.O. Box 84428, Riyadh 11671, Saudi Arabia
2
Department of Meteorology, Faculty of Meteorology, Environment and Arid Land Agriculture, King Abdulaziz University, P.O. Box 80208, Jeddah 21589, Saudi Arabia
3
Department of Astronomy and Meteorology, Faculty of Science, Al-Azhar University, Cairo 11884, Egypt
*
Author to whom correspondence should be addressed.
Atmosphere 2023, 14(2), 196; https://doi.org/10.3390/atmos14020196
Submission received: 21 November 2022 / Revised: 7 January 2023 / Accepted: 12 January 2023 / Published: 17 January 2023
(This article belongs to the Section Meteorology)

Abstract

:
This work aimed to study the synoptic evolution and dynamics of the dust activity associated with the desert cyclone occurring over North Africa and the Arabian Peninsula on 4–8 April 2007 based on ECMWF analysis (ERA5) data. This desert cyclone formed over North Africa (Algeria) in the lee of the Atlas Mountains in response to a powerful upper-level trough transporting cold air into northern Africa coming from high latitudes. The development of the cyclone was initiated when the contrast in temperature between the Mediterranean Sea and northern Africa (the desert) was strong, which increased the meridional temperature gradient. The isobaric vorticity analysis illustrated that the strong advection of positive vorticity and warm air ahead of the cyclone triggered cyclogenesis and low-level jet (LLJ) formation. The strong LLJ maintained the development of the cyclone inside the area of baroclinicity at a low-level. The horizontal divergence of 700 hPa level covered the region downstream of the cyclone trough and is coupled with the lower-level convergence. The study of frontogentical function concluded that the first stage of cyclogenesis is associated with frontogenesis working at the initial front of the cyclone. The vertical motions are then dominated by the direct transverse circulation with the ascent of the warmer and descent of the colder air. The mass transport within the circulation causes pressure falls along the surface front connected with convergence leading to the production of vorticity. The dust emissions linked to the cyclone during its duration and along its path were also investigated.

1. Introduction

North Africa is one of the most significant dust sources [1], producing an estimated 50% of the yearly world total for dust [2,3]. Vision, air traffic, and human health are all impacted by the airborne dust particles that are emitted from North Africa, which affects living conditions (like weather, climate, air quality, and ecosystems) of those who live in the Sahara and its surroundings [4,5,6,7,8,9,10,11]. Airborne dust influences clouds by providing nuclei of condensation [12,13], marine biochemistry by supplying nutrients to algae and corals [14,15], and of course, the atmospheric radiation budget in the area and thus vertical stability [16,17,18]. Several atmospheric processes at the local, regional, and synoptic scales produce the necessary climatic conditions for dust mobilization over affected areas [19]. Several investigators indicated that in the spring season over North Africa, Saharan cyclones frequently occur on the lee side of the Atlas Mountains and to the south [20,21,22,23,24,25]; these cyclones are sometimes called Khamsin depressions [20,21], desert depressions, or Sharav cyclones [24]. These cyclones form through the lee effect of Atlas Mountains when there is a significant temperature contrast between the Mediterranean Sea (relatively cold) and the North African continent (relatively warm) and the presence of an upper-level trough to the west [26,27].
Sandstorms and strong winds are frequently brought on by these desert depressions [24], and the resulting dust often impacts the Mediterranean region [28]. According to Barkan et al. [29], the majority of Saharan dust transports to Europe in the spring due to the eastward movement of the strong depressions that traverse the Mediterranean coast from North Africa. In several works, dust storms are accompanied by strong near-surface wind speeds brought on by the mixing of momentum coming from nocturnal low-level jets (LLJs) [30,31,32]. It has also been demonstrated that dust emissions over the Sahara are related to low-level dynamics brought on by an upper-level trough’s penetration of low latitudes [33,34,35,36]. The intense southwesterly flow (LLJs) along the eastern edge of the depression is responsible for the northward movement of dust [37]. Several dust storm records have been utilized thus far to identify the origins of dust and the dispersion of dust particles [38]. While some research concentrated on utilizing in situ measurement data [39,40] and remote sensing [41,42,43], other studies examined dust days by using the current weather code [44,45,46,47,48,49].
In North Africa and the Arabian Peninsula, there are currently no effective ways to avoid or mitigate the negative consequences of dust storms on society, in part because we do not fully understand the spatial and temporal variations in dust loading [50]. Understanding the temporal and spatial distribution of dust activities would undoubtedly help with dust prediction, which is crucial for the local economy and human life in this region [50]. There are only a few surface weather stations across North Africa and the Arabian Peninsula to observe dust activity, and they do not have a long record of dust observations. As a result, the present knowledge of dust activity in this region is mostly reliant on remote sensing data, which have not been fully verified by ground-based observations over this area. Fortunately, rapid progress in satellite monitoring of dust properties and the availability of atmospheric reanalysis have enabled scientists to conduct thorough investigations of the synoptic aspects connected with dust cases [1,51,52,53,54,55,56,57,58,59]. Nevertheless, Yu et al. [50] came to the conclusion that satellite aerosol optical depth may be used as a credible marker for dust activity across high dust regions, but it is unreliable over coastal regions, topographically complicated regions, and regions with normally low dust concentrations.
Given the previously mentioned significance of dust, it is important to investigate dust cases that are distinguished by an extremely high dust load across a particular time and region. During 5 to 8 April 2007, most stations in Algeria, Libya, and Egypt observed a vigorous sandstorm. On April 00Z07, the surface stations in west Egypt reported the storm in this area with visibility of a few meters. The storm continued to be active in Egypt until 18Z07. Then the visibility improved, and the storm calmed down completely in 00Z08 April. This work aims to diagnose the desert depression that occurred in North Africa and the Arabian Peninsula from 4 to 8 April 2007. This aim was achieved by analyzing vorticity in isobaric coordinates, temperature gradients, low-level jet, and frontogenesis to examine in detail the dynamic aspects of the development of this cyclone. Additionally, the cyclone’s accompanying dust emission was followed along its track.

2. Data and Methodology

2.1. Data

Reanalysis datasets are frequently and widely utilized in several scientific fields to replace observations in studying and interpreting atmospheric phenomena [60]. Therefore, to fulfill the objectives of this study, the ERA5 dataset [61] was used. The dataset in this study had a six-hourly temporal resolution and 1° × 1° spatial resolution covering the area from 40° W to 80° E and from 0° to 80° N throughout the period from 4 to 9 April 2007. These data consisted of geopotential height (Z gpm), zonal (u) and meridional (v) components of wind (m/s), and temperature (T °C) at 11 pressure levels (1000, 925, 850, 700, 500, 400, 300, 250, 200, 150, and 100 hPa). This dataset was used for computations and synoptic discussion. The area of calculation shifted throughout time to encompass the cyclone over the duration of its existence. Additionally, the Dust Aerosol Optical Depth at 550 nm was used to identify dust horizontal distribution from the CAMS dataset [62] every 3 h from ECMWF.

2.2. Theoretical Considerations

2.2.1. The Simple Form of the Vorticity Equation

The formation and development of atmospheric circulation systems in extratropical regions can be studied using absolute vorticity in isobaric coordinates and their corresponding advection as important diagnostic tools [63,64,65]. The simple form of the vorticity equation in isobaric coordinates was expressed by [63,66] and given in the following form
ζ t = f ο p · V V · p ζ + f
where ζ is the relative vorticity (vertical component), V is the wind’s horizontal relative velocity, p is the operator of a gradient in the X-Y plane when pressure is constant, f is the Coriolis parameter, and f ο is the Coriolis parameter at reference latitude ο . The relation between f and f ο can be expressed as f = f ο + β y , where   β = d f d y and y is the longitudinal distance and equal to zero at ο . The first term on the right-hand side of Equation (1) is the divergence or convergence term, and the second term is the absolute vorticity advection in the horizontal surface. The local rate of relative vorticity (ζ) change is represented by the term on the left side. The convergence term is primarily responsible for the increase in ζ close to the surface, while the advection term is important in the middle troposphere. Both terms are important near the tropopause.

2.2.2. The Horizontal Advection of Temperature Form

The relation of temperature advection is expressed as:
V · T = u T x + v T y
where, T x   T y is the zonal (meridional) temperature gradient. The meridional temperature gradients are the temperature differences from the north to the south across the coast between the hot desert air and cool air above the Mediterranean Sea.

2.2.3. The Isallobaric Wind

The component of ageostrophic wind arising from the local change in wind vector is called isallobaric wind ( V i s ), and it was given by [67] as
V i s = g f 2   P z t
The local rate of change of the acceleration caused by the pressure gradient force directly relates to the isallobaric component of the wind. The isallobaric wind can be substantial in the presence of a rapidly deepening cyclone or a rapidly building anticyclone.

2.2.4. The Frontogenetical Function

The function of frontogenetic due to horizontal divergence ( D ) and deformation ( F 1 ) fields was given by [65] as
F = T D 2 + F 1 2 cos 2 α
Where D = u x + v y   ,   F 1 = u x v y and α is the angle between the x-axis and ∇T. When F is positive (negative) the isotherms tend to converge (diverge), a process referred to as frontogenesis (frontolysis), and the flow is from cold to warm (flow from warm to cold) regions. It is important to mention that frontolysis suggests a weakening of the thermal gradient and the vertical motion field, and frontogeneis suggests an intensification of the thermal gradient. Moreover, frontogenesis is indicated as an increase in baroclinicity, wind convergence, and resultant ascent, with available potential energy being converted to kinetic energy.

2.2.5. The Rotational and Divergent Winds

To investigate the roles of rotational and divergent winds to the cyclogenesis of this case, one must decompose the horizontal wind into its divergent and rotational parts [68] in terms of the velocity potential (χ) and stream function (ψ). We can write
V = kx ψ + χ
The fields of ψ and χ are calculated from
2 ψ = k · xV   and   2 χ = · V
The relaxation method makes it easy to find solutions for Equation (6) [69], and the vectors of divergent and rotational wind were computed as
u R = ψ y   ,   V R = ψ x   and   u D = χ x   ,   V D = χ y
where the subscript R and D denote rotational and divergent parts, respectively, of zonal and meridional wind components.

2.3. Analytical Procedures

The relative vorticity and absolute vorticity advection were calculated from the actual data using the central finite differences method. Generally, centered finite differences were used to compute horizontal derivatives and all vertical derivatives, except those at 1000 and 100 hPa, where non-centered differences were employed. For each height analysis at 1000 hPa, geopotential tendency at this level was obtained by linear extrapolation. The vertical motion, ω, was computed using the Q-vector representation of the quasi-geostrophic ω equation by using the relaxation method [69]. Patterns of Q-vector divergences could be observed in the vicinity of troughs where one expects descent in the regions of cold air advection west of the trough and ascent in the warm air advection regions east of the trough.
An advanced technique for obtaining divergent and non-divergent winds ( V R and V D ) is the solution of Poisson equations for stream function (ψ) and velocity potential (χ) also using the relaxation method [69]. The variables and terms in our equations were calculated at 6 h. Therefore, time derivatives evaluated by central differences spanning 12 h give a reasonable indication of the time variation of these terms.

3. Results and Discussion

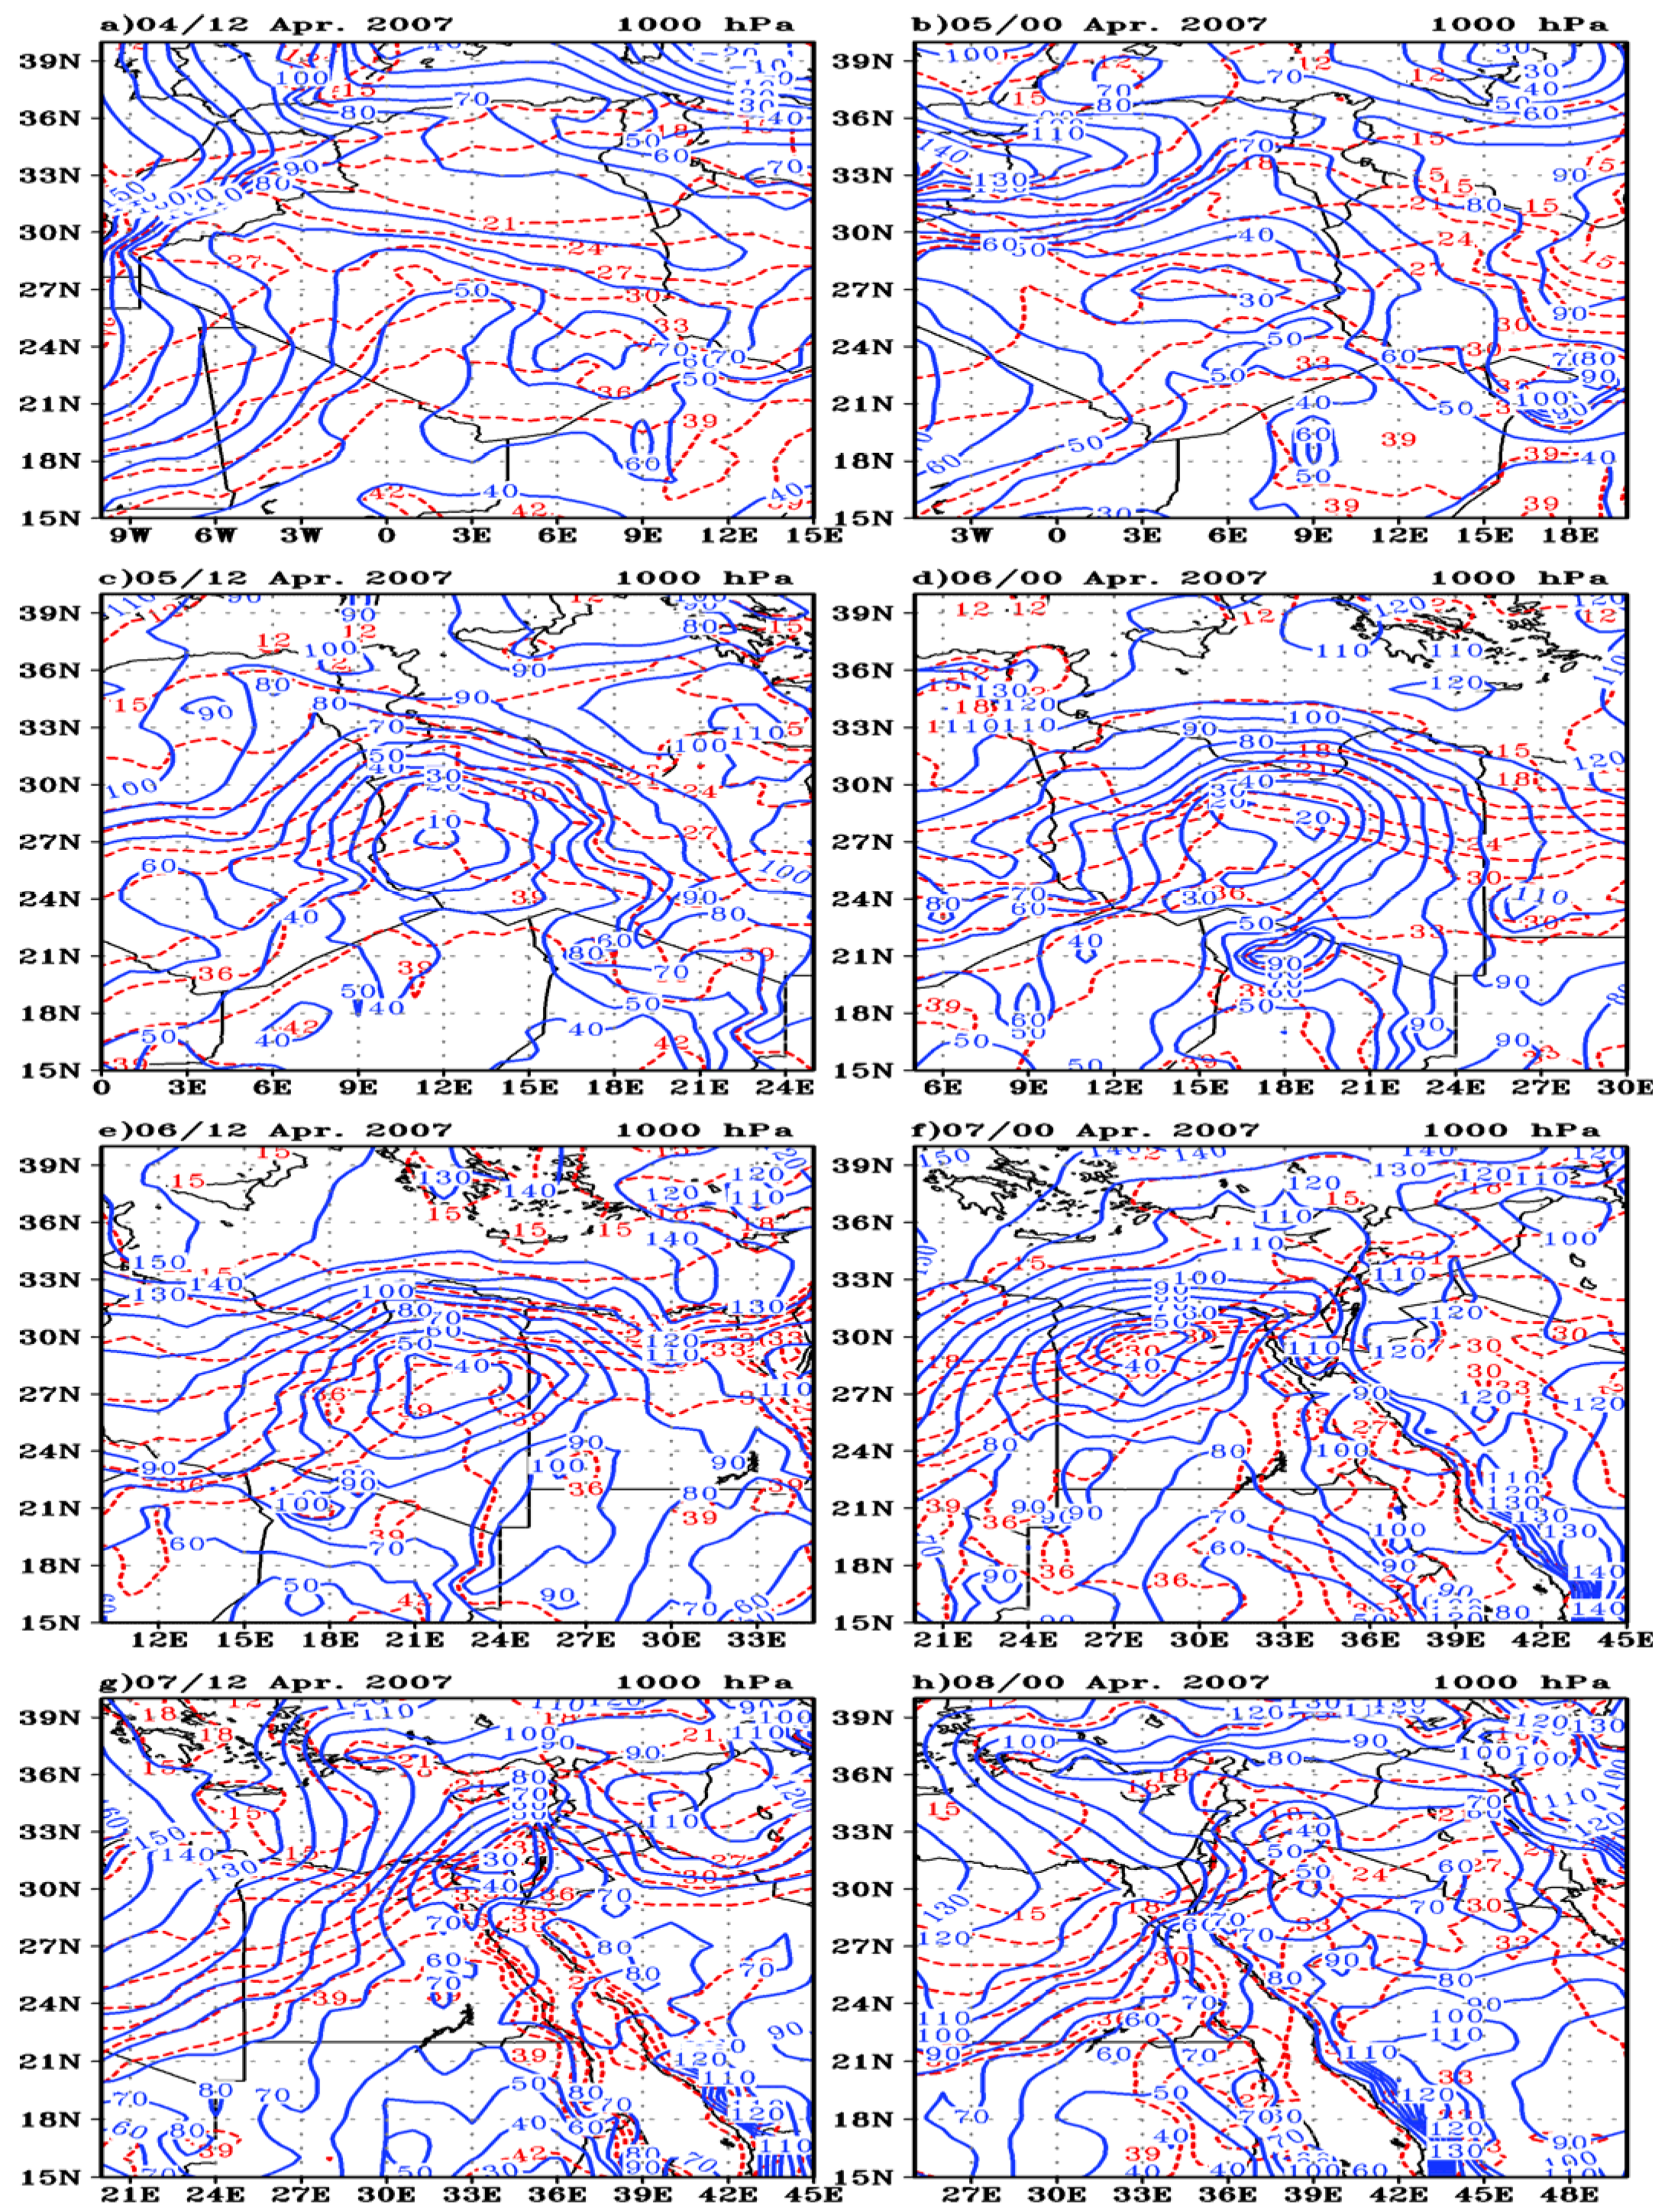
3.1. Synoptic Analysis and Discussion

From 5 to 8 April 2007, most stations in Algeria, Libya, Egypt, east Mediterranean countries, and north KSA observed a strong sandstorm. Figure 1 illustrates the track of the desert cyclone during the period 12Z04 to 12Z08 April 2007. Figure 2 shows the horizontal distribution of geopotential height at 1000 hPa (solid lines, with contour intervals every 10 gpm) and temperature (dashed lines, with isotherms every 3 °C) at 12Z and 00Z for 4–8 April 2007. Figure 3 shows analyses of the wind vectors and geopotential height at 850 hPa, while the color arrows of wind vectors represent the temperature of each region in the domain. Figure 2 and Figure 3 were used to summarize the spatiotemporal development of the desert depression during the period from 4 to 8 April. Overall, after the depression started on 12Z04 April 2007 southeast of the Atlas Mountains (over western Algeria), it drifted to the east over the next three days and deepened. In April 12Z08, it became a shallow depression over the eastern Mediterranean Sea, and by April 12Z09 2007, it was no longer visible.
The main synoptic feature at 12Z04 April 2007 was an anticyclone centered over western Europe extending easterly at the surface to the southwest of Europe and north-west of Africa (west of Algeria) and appearing in upper air as an upper ridge over western Europe. A cyclone appeared as a trough in the upper layers of the atmosphere over southern Europe and the Mediterranean Sea (Figure 2a and Figure 3a). In April 12Z04, our target cyclone formed as an inverted weak trough over Algeria on the northwest coast of Africa. It was also connected with a thermal ridge, a portion of the baroclinic zone extending parallel to the southern Mediterranean coast over the next 12 h. On 00Z05 April, a small thermal cyclone developed under 700 hPa south of Atlas Mountain. (Figure 2b and Figure 3b). Meanwhile, this thermal cyclone and its associated trough (at 850 hPa) were moving eastward to west Libya by 12Z05 April, where they deepened and intensified (Figure 2c and Figure 3c).
The cold advection accompanied by the eastward movement of the anticyclone behind the thermal cyclone and differential heating (warmer and drier air) associated with the southerly flow reinforced the baroclinic zone in the boundary layer. Figure 2d and Figure 3d show that the cyclone traveled eastward across Africa’s northern coast (over Libya) on 00Z06; it reached northeast Libya by 12Z06. The cyclone kept moving eastward with a speed greater than 50 km/h over the coast of the Mediterranean Sea, which generated a storm over the area of the northern Sahara that reached west of Egypt on 12 Z06 April (Figure 3e). In April 00Z07, the storm was observed by the surface stations in west Egypt with a few meters of visibility. Up until 18Z07 in April, the storm was still active in Egypt. After that, visibility improved, and on 00Z08 April, the storm began to dissipate. The last two days (7 and 8 April) saw the cyclone’s center pass across northern Egypt and the eastern Mediterranean. However, a significant sandstorm persisted with a steady decline in activity (Figure 3f,g). The temperature field was likewise almost zonal on 12Z04, as shown in Figure 2a. The disturbance developed 12 h afterward on 06Z05 with a pronounced front at the surface. The cold trough at 1000 and 850 hPa moved westward and intensified. At the same time, the gradient of temperature grew, particularly in the lower layer, and peaked on 12Z05 April. On 12Z06 April, the warm air continued to move northward at all levels; however, the gradient of temperature in the lower layers diminished (Figure 3e).
Figure 4 shows the spatial distribution of the geopotential height (gpm) and temperature (°C) at 700 hPa for the period from 4 to 8 April 2007. The trough at 700 hPa looked like an extension of the Mediterranean or traveling depression south of Europe at 12Z04 April (Figure 4a). Over the Mediterranean and northern Algeria, a cut-off low developed, and a well-defined cyclonic depression became visible (Figure 4b). The 700 hPa contours decreased when the cyclone at the surface deepened, and by 12Z04 to 12Z05 April, the 700 hPa circulation consisted of a large cut-off low over the north Mediterranean. By 12Z06 April, the cut-off low traveled westward when it became weaker and achieved the lowest central pressure over Aspen; its associated zonal trough covered south Europa and the Mediterranean. This upper air pattern continued up to 00Z08 April (Figure 4h).
From the analysis of geopotential height and temperature at 1000, 850, and 700 hPa (Figure 2, Figure 3 and Figure 4), we noticed a weak connection between the depression in the upper troposphere (700 hPa and above) and the surface cyclone, but this connection was only at the initial formation of the surface cyclone. After that, there was no connection, and the movement of each of them was separate from the other. Whereas the surface desert depression moved quickly to the east, the upper depression moved slowly to the west. In general, it is noteworthy that the cyclone’s core was over the continent from 12Z04 to 00Z07 April, when it left the continent towards the Mediterranean Sea over the north of Egypt at 12Z07 April (Figure 3). Over four days, the cyclone’s average speed was 40 km/h eastward and 7 km/h northward (Figure 3). For the entire duration of the cyclone, the eastward displacement speed remained constant. The cyclone’s diameter was between 800 km and 1000 km, peaking on 12Z05 April, as determined by the closed circulation in the 1000 hPa field (Figure 2). Because there was no closed circulation in the geopotential height field at 700 hPa, it may be assumed that the cyclone had a vertical extent of fewer than 3 km (Figure 4).
An atmosphere heavily laden with dust over North Africa was documented in the SEVIRI images during the desert cyclogenesis event (Figure 5). Figure 5 describes the horizontal distribution of dust using the Spinning Enhanced Visible and Infrared Imager (SEVIRI) images of the Meteosat Second Generation (MSG) at five time intervals. On 00Z06 April, the intrusive cold front from midlatitudes induced strong near-surface winds that triggered a dust storm over southern Algeria (Figure 5b). During the development of the cyclone, dust emission continued to increase and was enhanced by strong westerly winds associated with the cold front. By 12Z06 April, the cyclone was apparent in the SEVIRI images as a combination of three features: a curved band of clouds on its northern edge located over northern Libya, a spiraling band of dust over northeastern Libya, and a large trailing band of dust that reached as far east as west of Egypt (Figure 5c). As the cyclone moved eastward, strong winds on its south side associated with the cold front continued to mobilize dust over east of Egypt and southeast Mediterranean countries on 00Z07 April (Figure 5d). By 12Z07 April, most of the southeast Mediterranean as well as the north of the Arabian Peninsula were covered by a large cyclonic structure of dust (Figure 5e).

3.2. Analysis of Isobaric Vorticity

As is well known, the cyclogenesis over the middle Mediterranean and northern African areas is a continued topic of much research [70,71,72,73] because of the high winds, precipitation, and temperature drop brought on by these synoptic-scale significant occurrences. The features of cyclogenesis over this region are receiving a lot of interest due to the strong connection between these phenomena and local weather prediction. Figure 6 illustrates the spatial distribution of relative vorticity at 850 hPa and the maximum horizontal absolute vorticity advection for the study period. It shows that the relative vorticity suffers a fast change of horizontal extension, orientation, and magnitude from time to time.
Figure 6a illustrates that at 12Z04 April 2007, there was one weak cell of relative vorticity associated with the initial formation of our cyclone of interest, where its center existed at 26° N, 2.5° W. Within the next 12 h (Figure 6b), the cyclone developed and moved slightly southeastward, and its center was located at 26° N, 5° E. The maximum absolute vorticity advection was equal to 4.5 × 10⁻⁹ s−2 (shown as a filled circle in Figure 6). On 12Z05 April, the center moved northeastward and originated at 27° N, 10° W in association with the center of the cyclone at 1000 hPa. After 12 h (00Z06 April), the center of the maximum relative vorticity cell moved northeastward, and the maximum absolute vorticity increased to about 6.2 × 10⁻⁹ s−2 (over 27° N, 15° W). The cell of positive relative vorticity advanced eastward and took up a significant portion of the domain in 00Z06, but its maximum value declined to 8 × 10⁻⁴ s−1 (Figure 6e). Additionally, we noticed the movement of the maximum absolute vorticity center northeastward (26° N, 15° W). By 00Z07 April, the cell of positive relative vorticity kept moving northeastward, which accompanied and was identical to the cyclone movement at 1000 hPa to come over the north of Egypt. The maximum positive relative vorticity values increased to 12 × 10−4 s−1 at (28° N, 28° W), and it was noted that the maximum absolute vorticity increased to become 7 × 10⁻⁹ s−2 (Figure 6f). On 12Z07, with the movement of our cyclone northeastward to arrive over the northeast of Egypt (Figure 2g), the cell of positive relative vorticity also moved to the northeast of Egypt. It extended horizontally to cover the middle and east of Egypt (Figure 6g), while its magnitude decreased to about 8 × 10⁻⁴ s−1. After 12 h (00Z08 April), the cyclone moved to the north of KSA and east of the Mediterranean (Figure 2h). The positive relative vorticity cell also moved over the north of KSA with an increase in its maximum value to about 10 × 10−4 s−1. The most important finding in this section is that there was an excellent agreement between the depression center at 1000 hPa and the center of positive relative vorticity at 850 hPa. Additionally, the values of positive relative vorticity at 00Z were higher than that at 12Z, and the horizontal extension of the center of positive relative vorticity values at time 12Z was wider than that at 00Z.

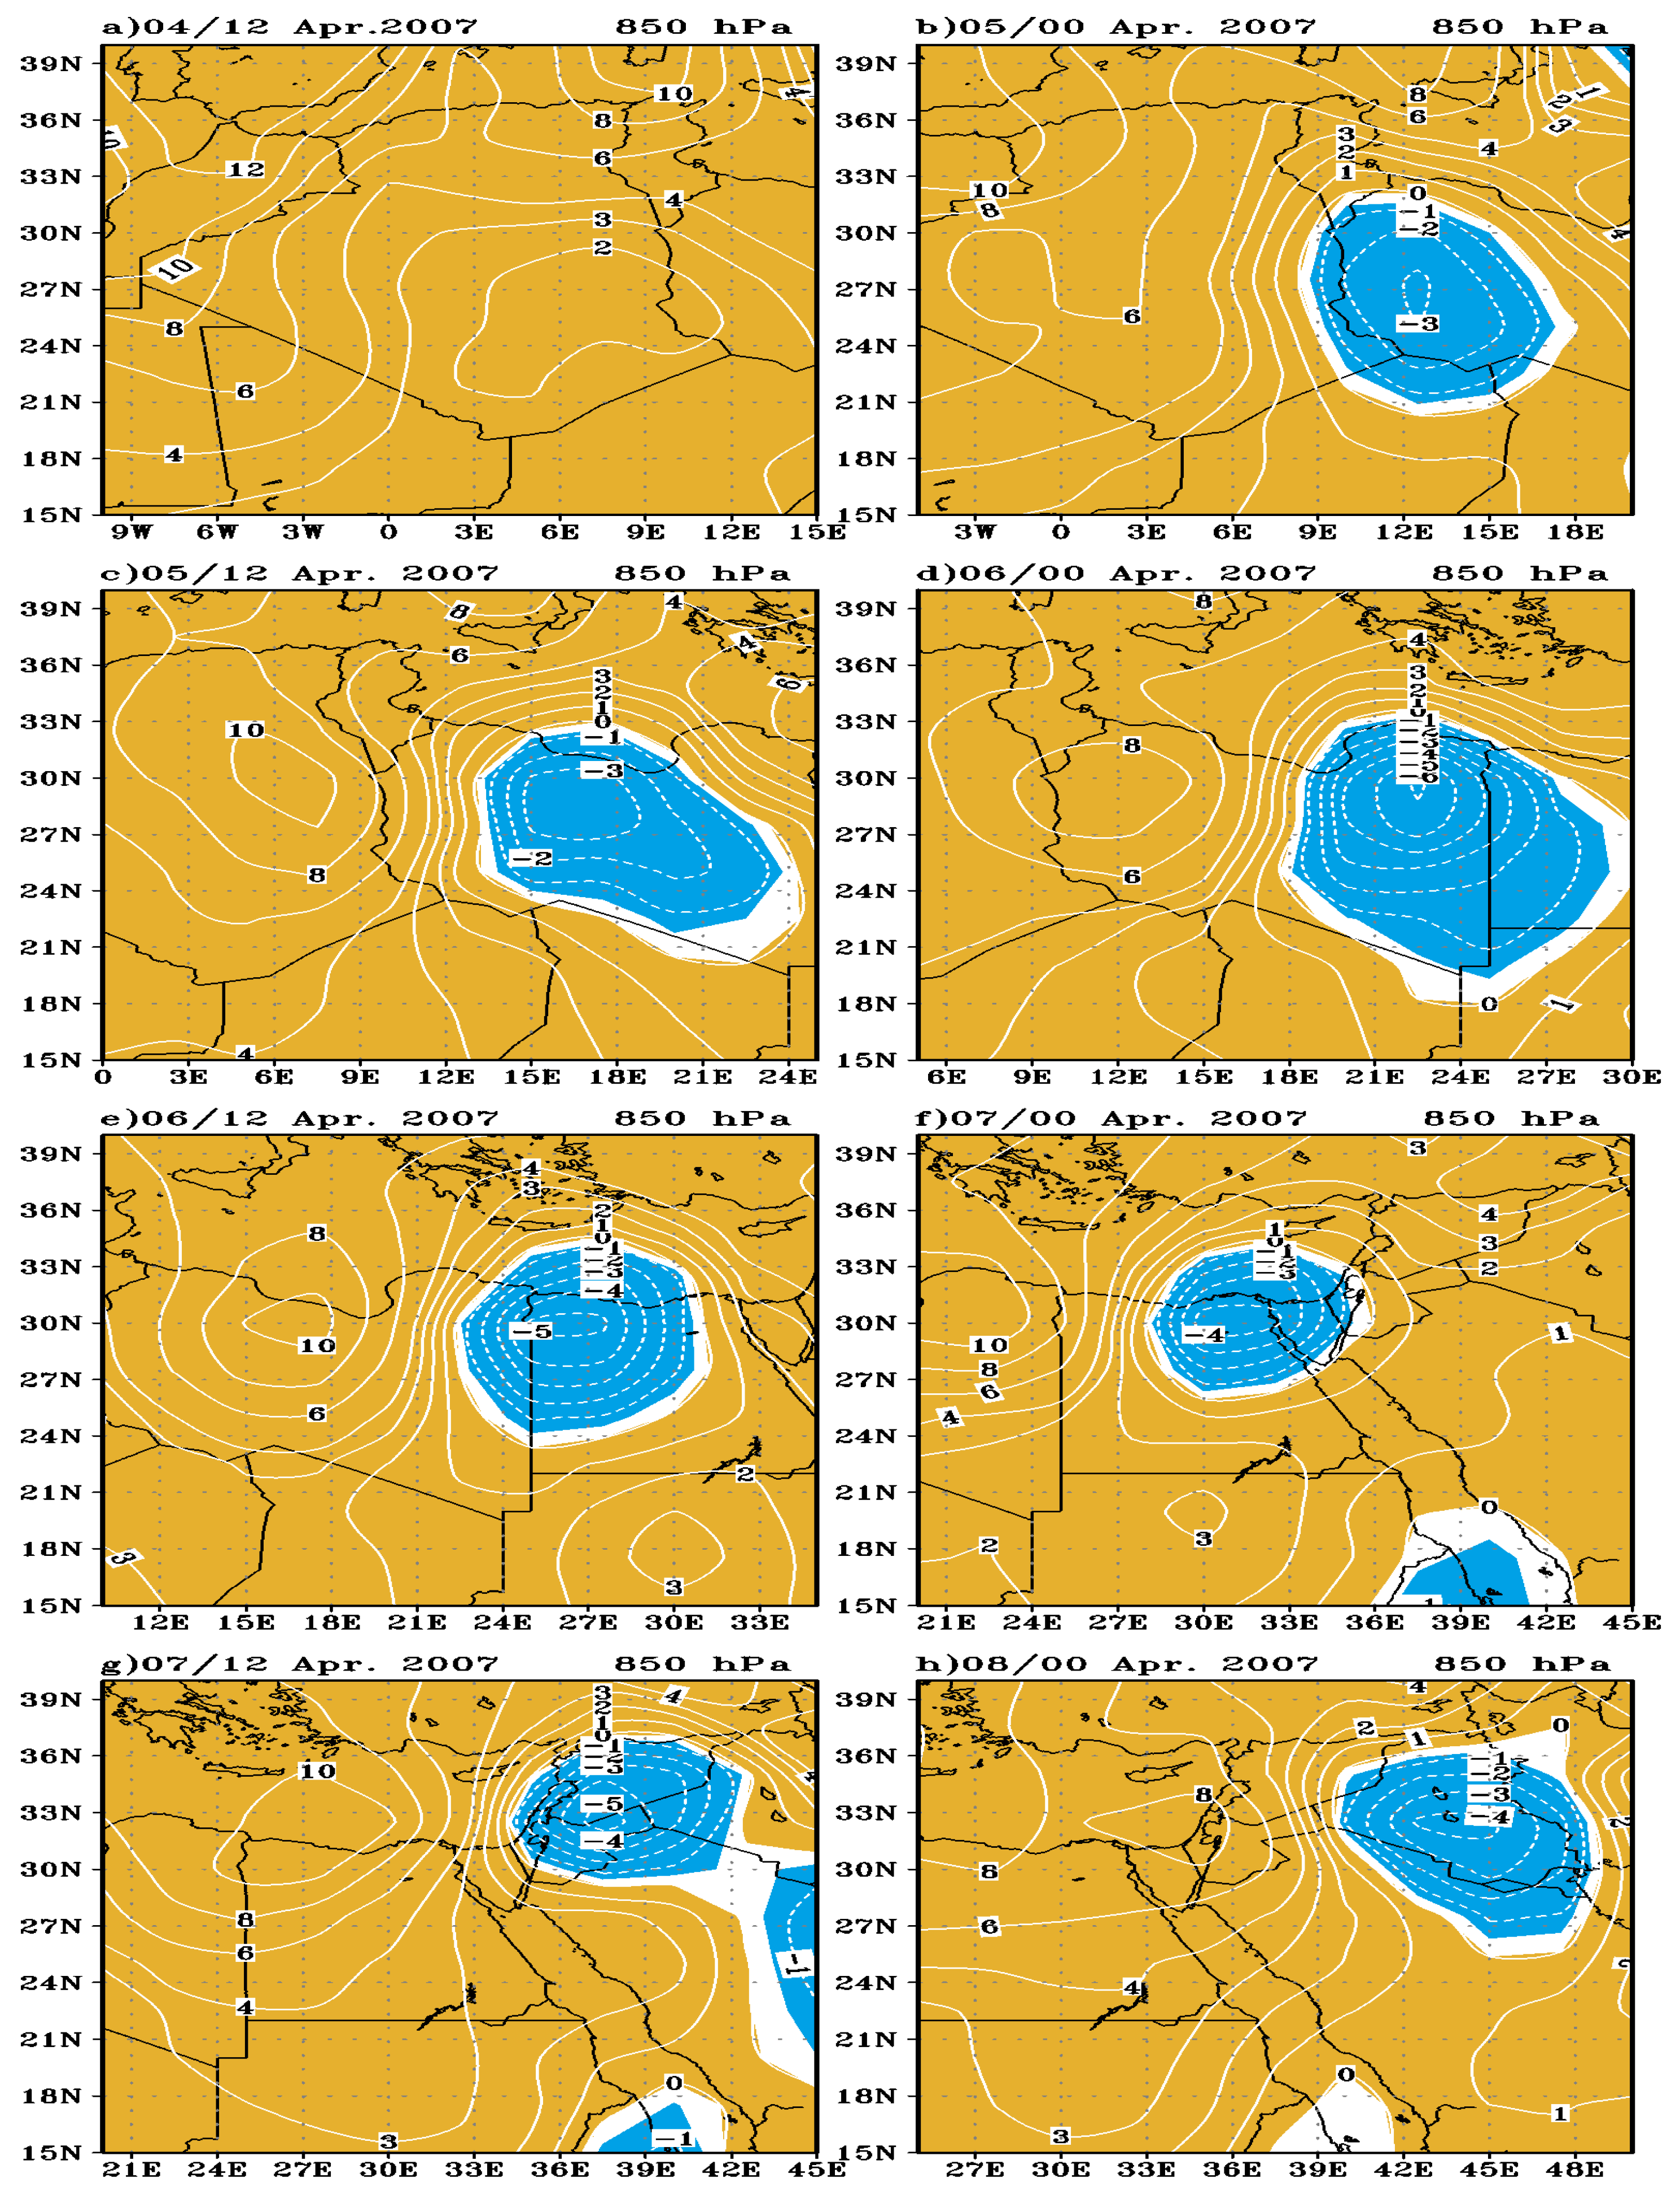
3.3. Horizontal Distribution of Cooling/Heating and Vertical Motion

The relationship between the evolving synoptic features and the cyclogenesis were examined by considering the spatial distribution of vertical motion and advection of temperature. Since we were interested in examining time-to-time variations of temperature advection and vertical motion distributions for this case, Figure 7 and Figure 8 display a time series of the spatial distribution of temperature advection at 925 hPa and vertical motion at 850 hPa in a region where the cyclone existed throughout its entire cycle.
The pattern of temperature advection (cooling/heating) is shown in Figure 7, which illustrates that east of the 925 (850) hPa trough, a warm sector existed along with warm advection at 925 (850) hPa and the presence of heating, while west of the trough, cold advection along with cooling prevailed. Generally, by comparing Figure 7 and Figure 8 for the horizontal distribution of temperature advection and vertical motion during this period with Figure 3 that contains both height and temperature contours for the same period, it is important to note that west of the trough, which was the region of descending motion, there was a region of cooling. Moreover, east of the trough (the region of rising motion), there is a dominant region of heating. In other words, heating behaved like warm advection, and cooling behaved like cold advection. Therefore, heating was usually related to a rising motion, and cooling was generally associated with a sinking motion. Technically speaking, a relative maximum in heating was associated with a rising motion (even if there is cooling), while a relative minimum in heating was associated with a sinking motion (even if there is warming). Suppose we follow the time variation of heating and cooling over the internal domain, which was used for the present calculation. In that case, we can see from Figure 7 a time series of the spatial distribution of temperature advection during the period under study. Two main features may be extracted from Figure 7 for the time 12Z04 April 2007. One feature that protrudes obviously is a cooling maximum over the west of the domain. Maximum cooling tends to increase westward of the domain, suggesting that the source of cooling is due to the cold air advection associated with the subtropical high pressure.
Another prominent feature is the temporal change of the heating pattern over the middle and south of Libya. Indeed, the temporal changes of these two features are essential. We see that the cooling over the east of Libya (12Z04 April) moved slowly eastward at 00Z05 April and intensified. The center of heating also moved eastward with maximum values over the east of Libya. On 12Z05 April, the cyclone moved eastward to arrive over central north Libya. The two centers of cooling and heating also moved eastward with a slight increase in their values. Another eastward movement appeared at 00Z06 and 12Z06 April.

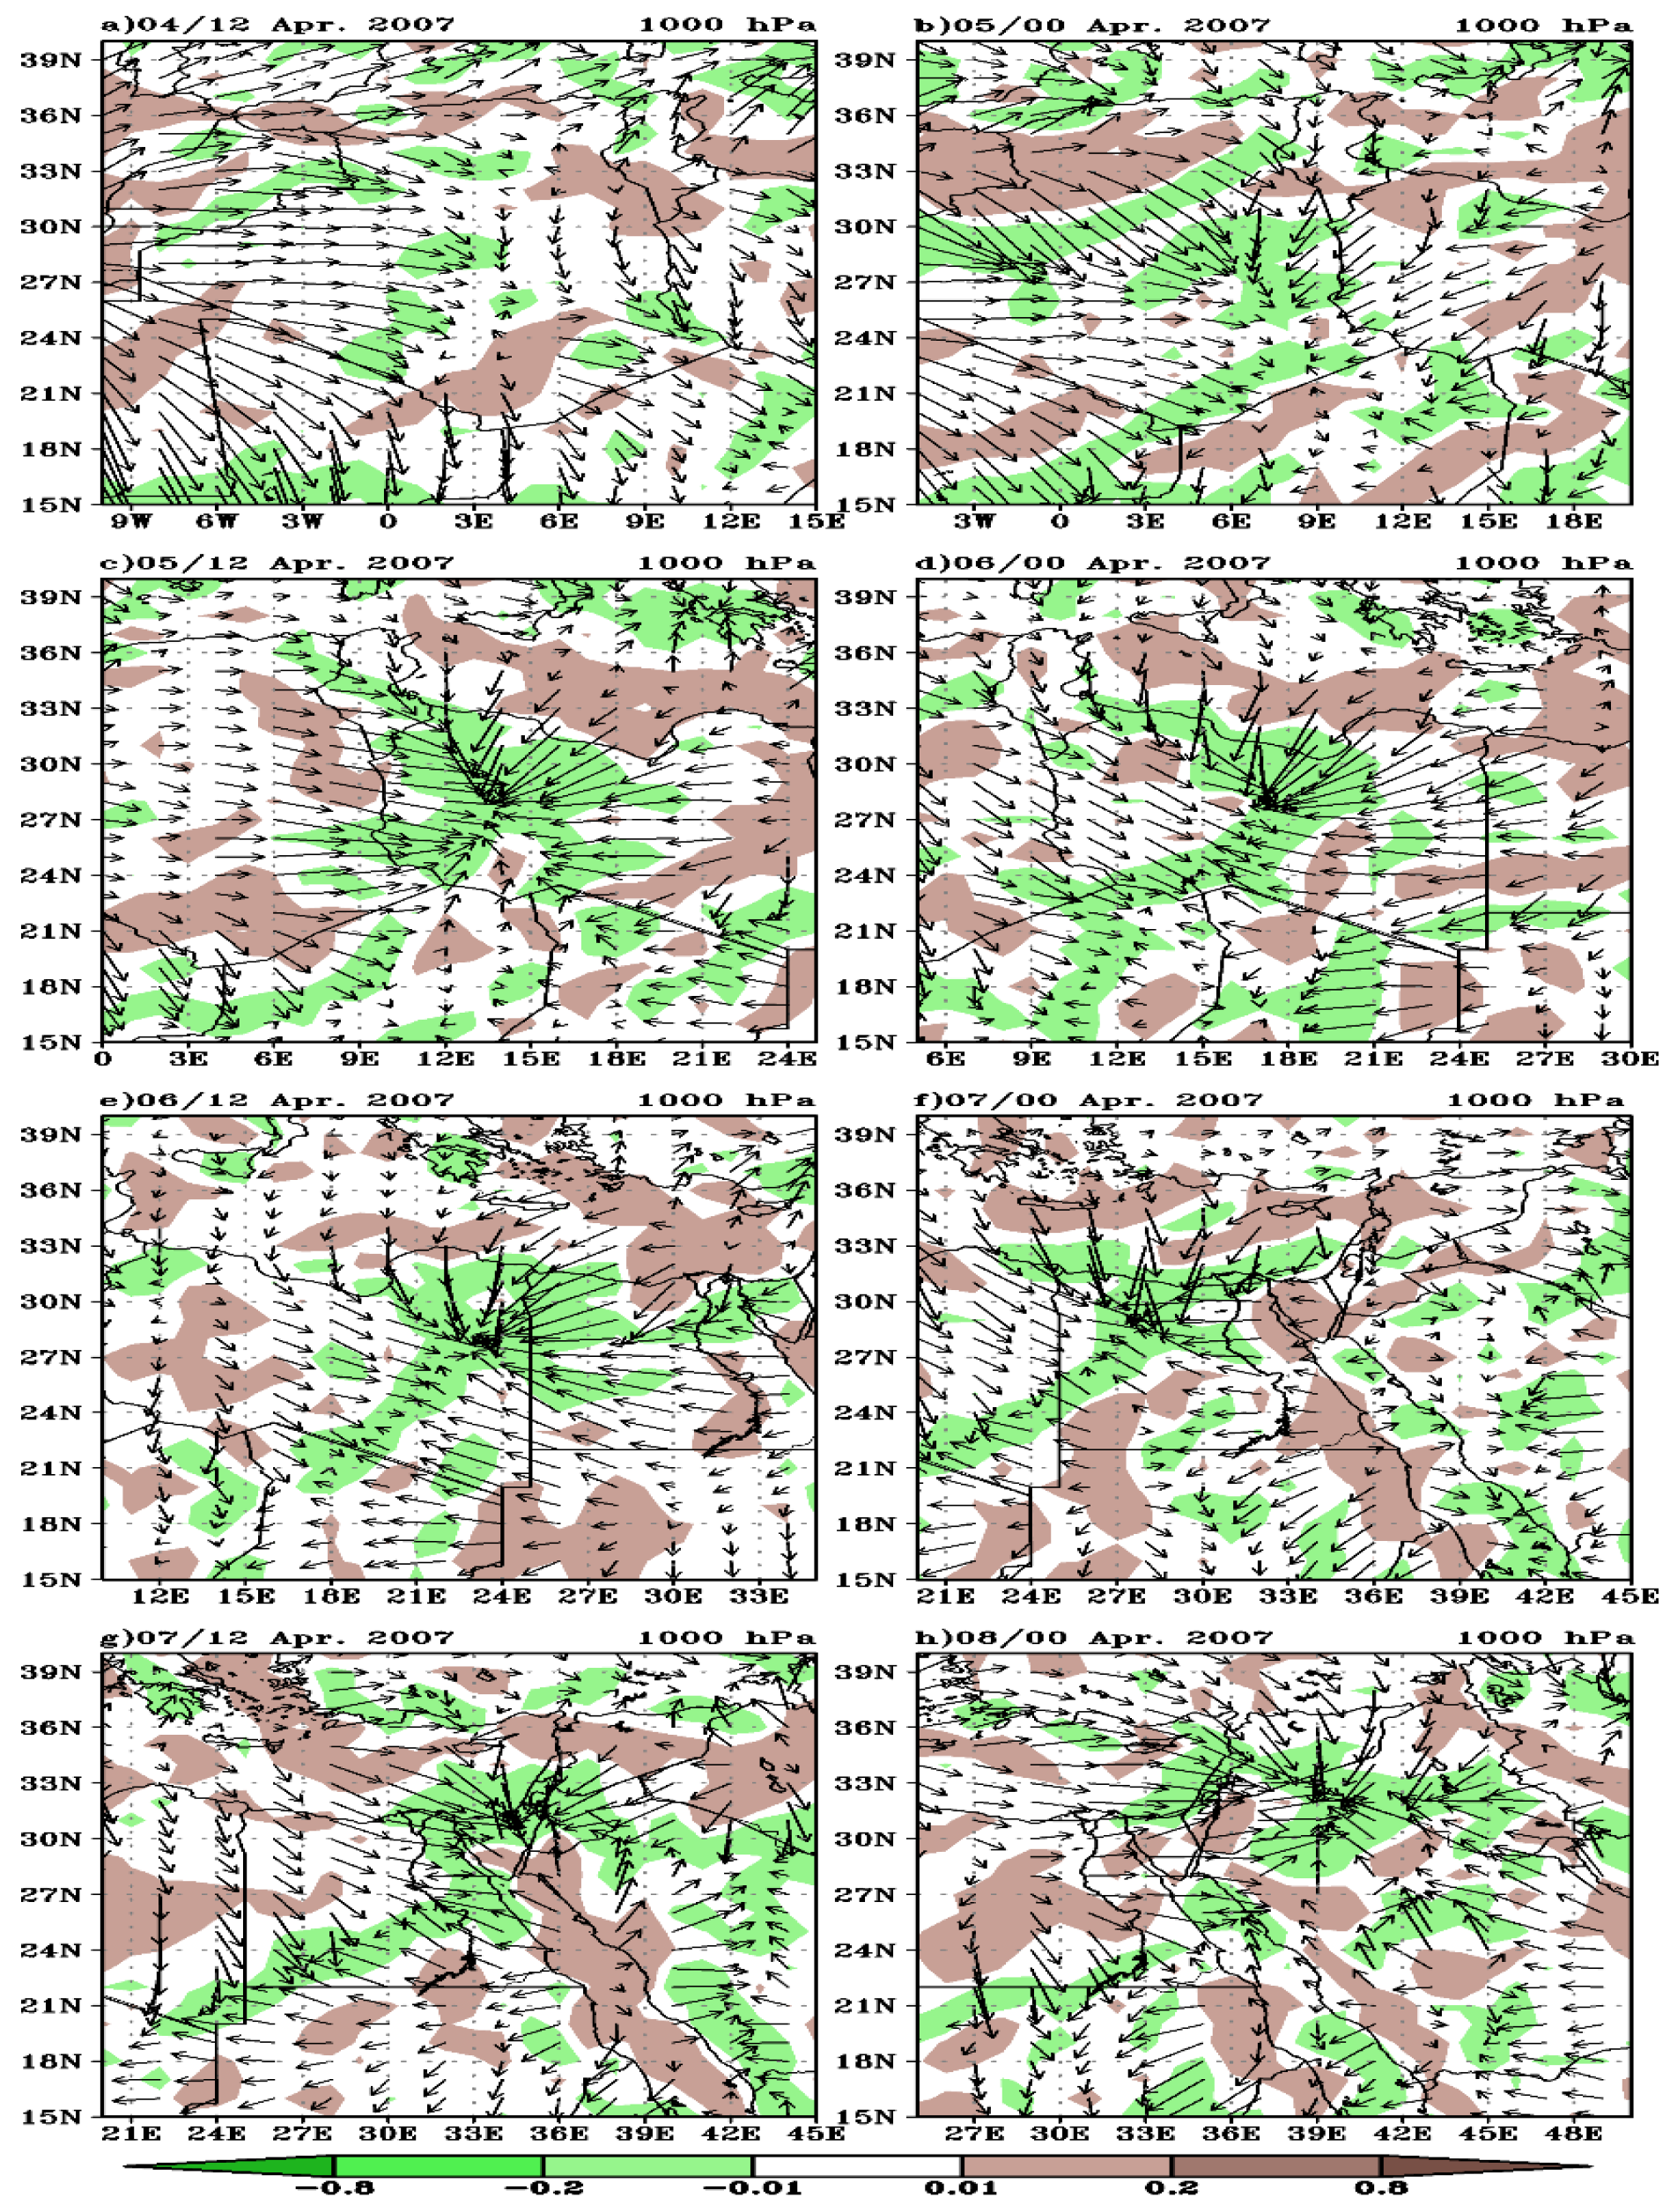
3.4. The Role of the Low-Level Wind on Cyclone Development

The LLJ is a region with a maximum wind speed of at least 12 m/s at some altitudes in the boundary layer, with wind speed at the surface and below the 850 hPa pressure level (about 1400 m) decreasing to at least half of the maximum wind speed [74]. Wind speeds of 25 to 50 knots is produced when air at high elevations cools relative to air farther east at the same geopotential height. This difference in temperature forces warmer easterly air to move toward colder western air. Figure 9 shows the analysis of isotachs of isallobaric wind and the 925 hPa geopotential height at 12Z and 00Z for 4–8 April 2007. It is clear that the higher values of LLJ appeared consistent with the fall in surface pressure over North Africa and the intensifying cyclonic circulation at 850 hPa.
The geopotential heights decreased by more than 30 gpm between 00Z and 12Z05 April (Figure 3), which led to a substantial eastward extension of the cyclone over Libya into North Africa. Figure 9c illustrates that the values of isallobaric wind reached more than 7 m/s along the cyclone’s northern flank; the isallobaric wind here was a considerable portion of the total wind. This demonstrated that the surge-like eastward displacement of the dust during this phase was, to a great extent, driven by the rapid cyclogenesis; at the same time, there were strong negative height tendencies over the center of Libya (Figure 3d). Where the hot Saharan air was advected northward ahead of the upper-level ridge (Figure 7d), it caused the development of a low-level cyclone over central Libya (Figure 2d).
Figure 9 illustrates an excellent agreement between the movement of the depression and the location of the isallobaric wind as well as the areas of convergence at the level of 1000 hPa. Figure 10 and Figure 11 illustrate the divergent component of wind at 1000 and 700 hPa, and the shaded areas are the divergent (source) and convergent (sink) areas during the life cycle of this case. By tracing the locations of the LLJ in Figure 9 and the areas of convergence on 1000 hPa in Figure 10 for the study period, we found that the center of the convergence area at 12Z05 was located between 24–30° N, 12–15° E. It completely corresponded to the place of the highest values of the LLJ. With the movement of the depression to the east on 00Z06, we note the movement of the convergence area to arrive above the middle of Libya (24–30° N, 15–19° E), which is the same place of the highest values of the LLJ (Figure 9d and Figure 10d). On 12Z06, the center of the desert depression moved to the northeast of Libya in association with the LLJ (Figure 9e) and the maximum area of convergence (Figure 10e). This strong relationship continued until 00Z08, when the desert depression reached the northern Arabian Peninsula, accompanied by the LLJ and a strong convergence area (Figure 9h and Figure 10h).
From the above discussion, it can be noticed that LLJ generation happened when a developing baroclinic wave (desert cyclone) was preferred by the intensification of the meridional gradient of temperature in North Africa, mostly in the lee of the Atlas Mountains. The convergence at a lower level was offset by divergence in the upper troposphere (700 hPa in this case), and this was evident by the divergence cycle associated with this baroclinic wave. Strong vertical motion associated with the lower-tropospheric convergence preserved the dust emission caused by severe storms over the low at the surface northeast of the LLJ. Additionally, it was clear that the enhanced gradient of pressure between the anticyclone and the cyclone to the west produced a northeasterly flow that fed moist Mediterranean air into the frontal zone and strong northerly winds over North Africa (east Algeria, Libya, and Egypt) that caused dust mobilization behind the leading dust front. Considerable isallobaric winds were deduced to the southwest of the low. Apart from the strong regions of the isallobaric winds, large actual winds were shown in the region of northern Africa in northern Libya and Egypt, which were most likely related to surface friction. It was found that the wind speed was higher in the early morning, and it reached a maximum of 10 m/s at 00Z06 April. Additionally, the regions of convergence and divergence appeared ahead and behind the low-level trough, respectively, depending on rapid cyclogenesis. Therefore, the main wind that caused dust emission and changing pressure at the cyclone center was isallobaric wind.

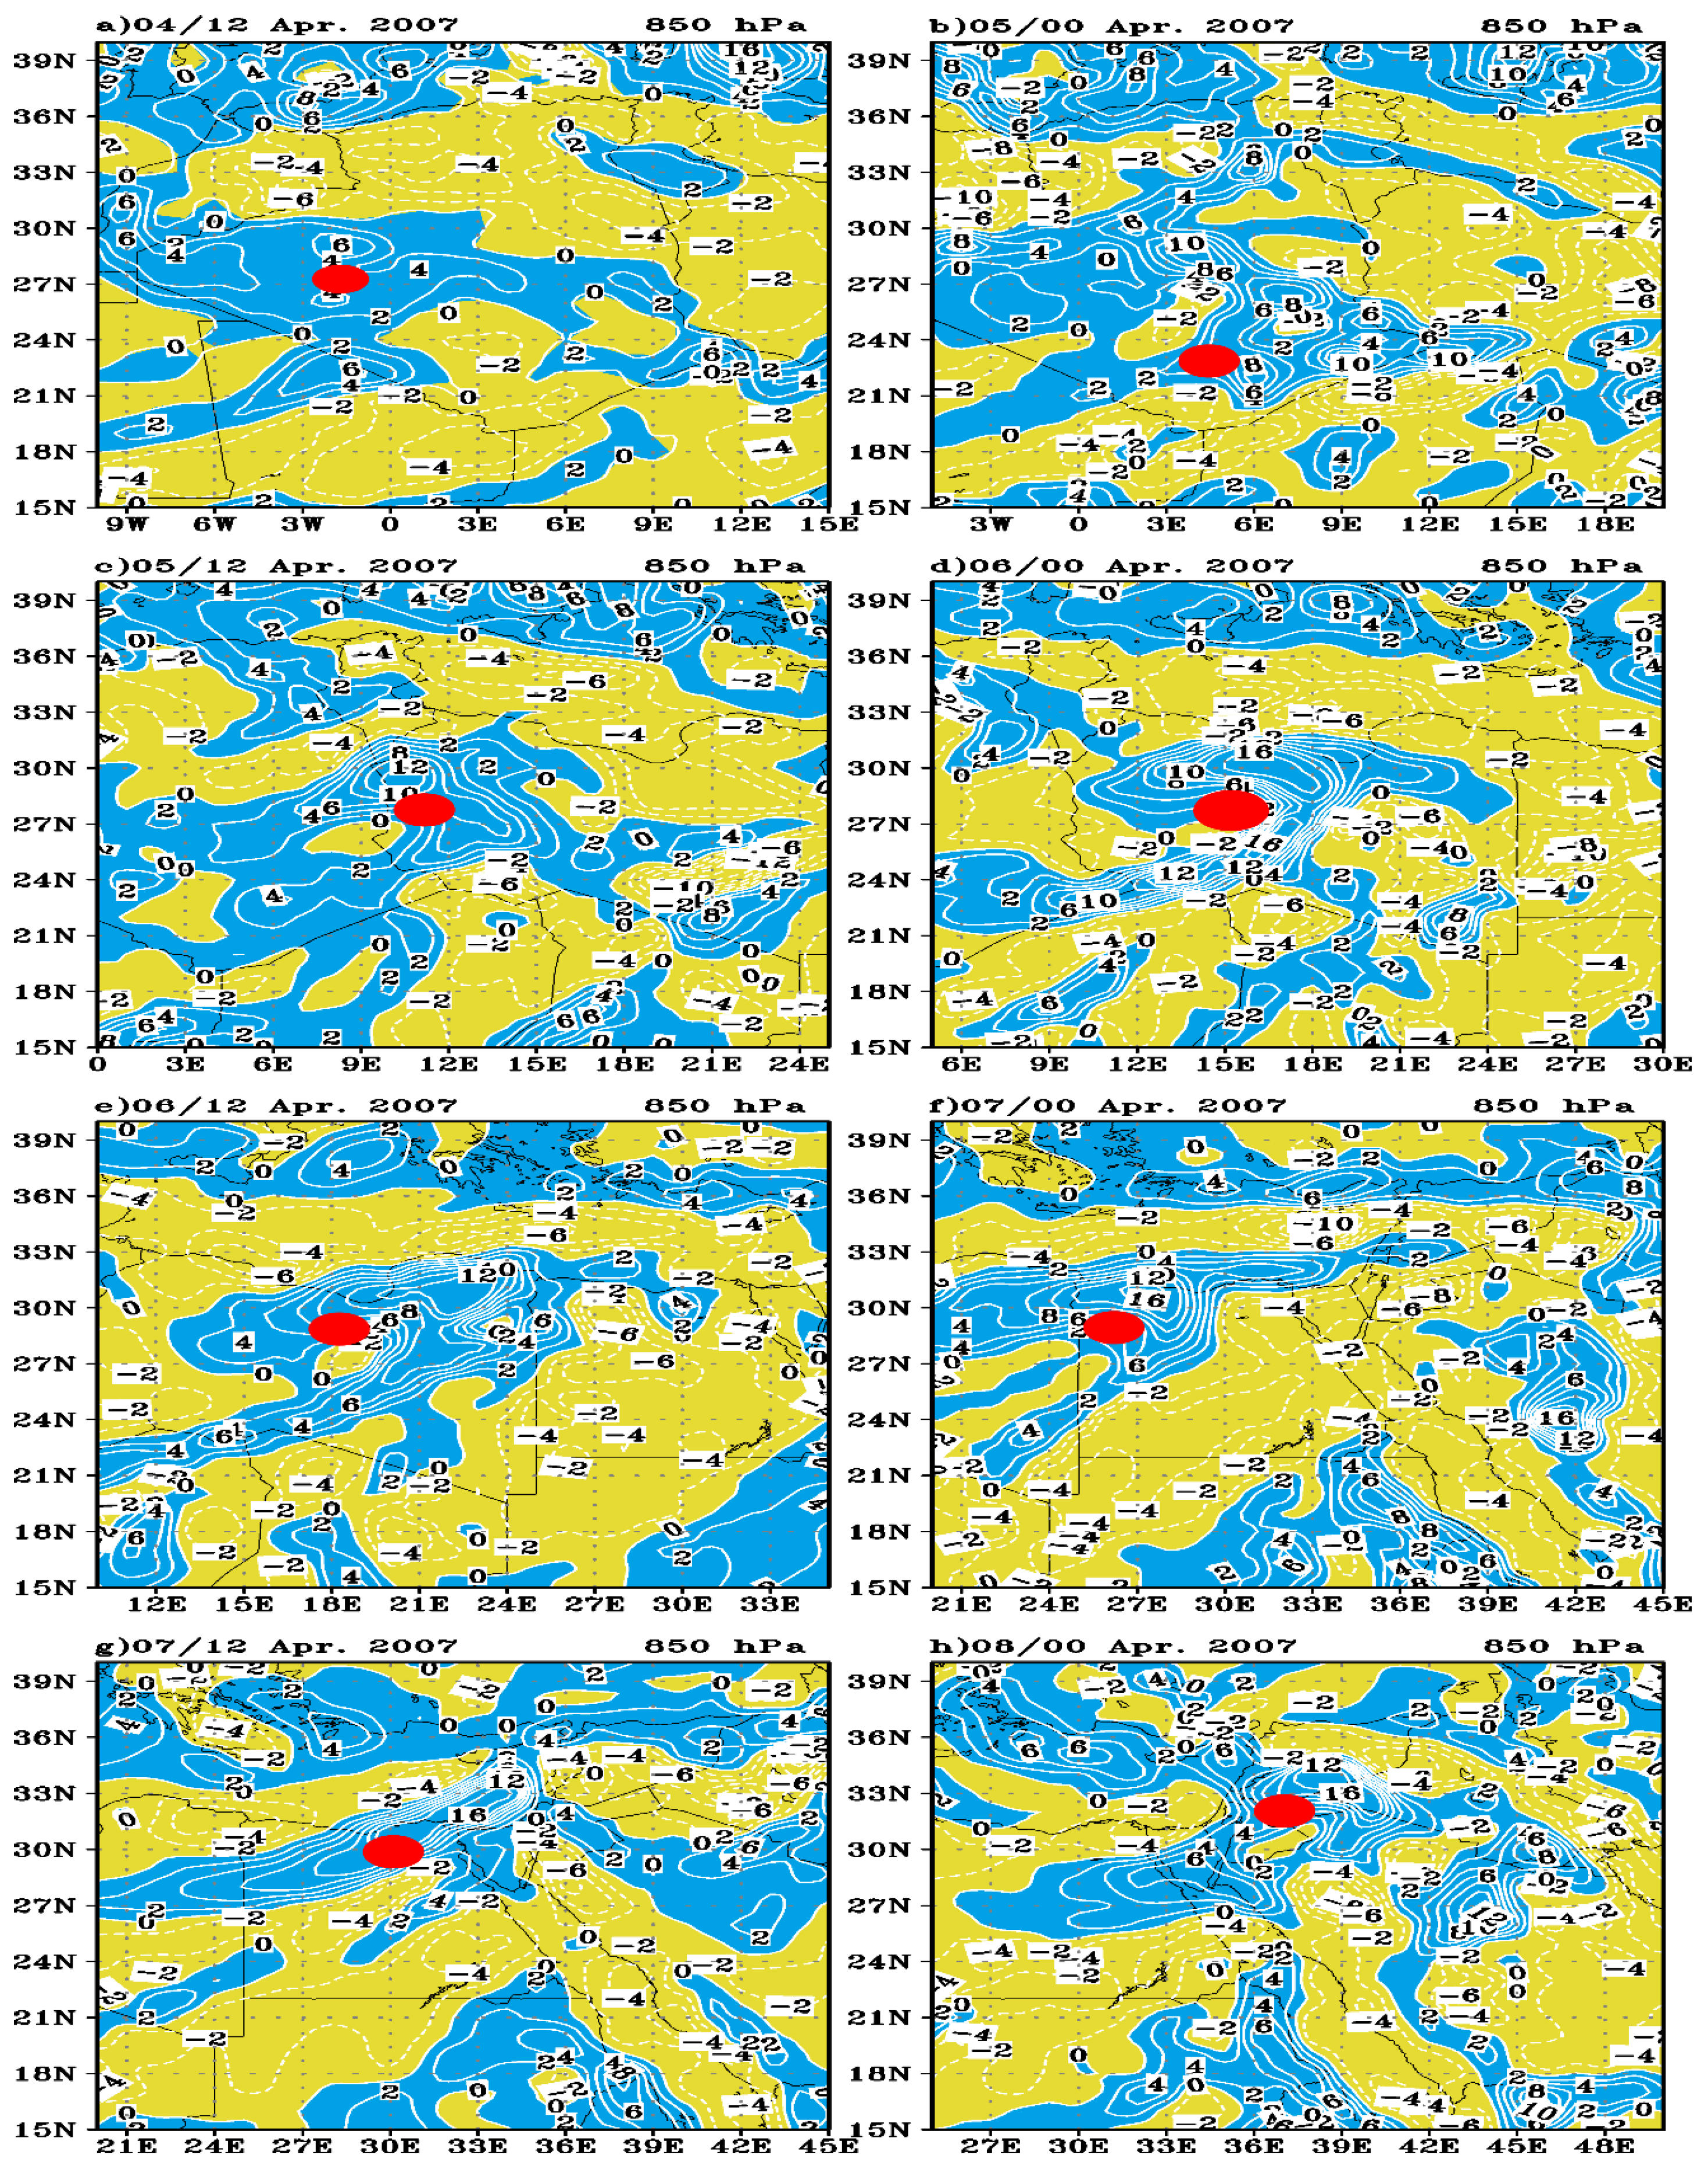
3.5. Meridional Temperature Gradient Analysis

The weather of Egypt and North Africa in spring is troubled by a second type of traveling cyclones, which, in general, are formed south of the Alps when a trough of low pressure extends south over the southwest of Europe, as explained in Figure 2a and Figure 3a. Figure 12 shows the horizontal meridional temperature gradient at 1000 hPa from 4 to 8 April 2007 over North Africa. A low-level baroclinic zone described by an intense temperature gradient covering 1000 km was present over North Africa.
Over the continent’s deeper south, a zonal belt between 20 and 32° N was where the greatest temperature (40 °C) was found (Figure 2). This maximum temperature, which corresponds to the depression in the North African desert, is associated with low pressure and midday surface warmth. The minimum temperature (15 °C) existed over western Africa and the Mediterranean Sea (Figure 2). The high levels of the meridional gradient of temperature (Figure 12) met the necessary requirements for baroclinic instability [75], which is a crucial prerequisite for desert cyclogenesis [24,76]. During the study period (4 to 8 April 2007), we found that the meridional temperature gradient over 1000 hPa from south to north with cyclone movement from west to east gave a strong gradient in early morning hours, and this thermal gradient facilitated intensification of low-level baroclinicity.
Figure 12 illustrates that there was a transition zone that separated the air masses in the interior of the continent and the southeast wind from the air of the Mediterranean. This transition zone covered the latitudes of northern Africa during the study period, but it experienced large displacements. Additionally, it is clear that the temperature gradient appeared at areas of convergence of cold and warm air (Figure 10), where coastal regions are found. At 12Z04 April, this gradient began on the coast of northwest Africa, and the cyclone then formed and intensified by 00Z05 April. After 12 h, the gradient became sharp between warm and cold air. By 00Z07 April, the cyclone moved over the south coast of the Mediterranean Sea, so the values of that thermal gradient reached their maximum. During the next 24 h (Figure 12g,h), the temperature gradient decreased gradually in association with the cyclone weakening over the north of the Arabian Peninsula.

3.6. Frontogenesis

In this section, we analyze the frontogenesis regions related to our cyclone during the period of study (4–8 April 2017). Frontogenesis regions are the regions that have a significant chance to create a front, which contains a thermal gradient from cold to warm air at wind convergence in ascent air areas. We calculated the frontogenetical function from Equation (4) to determine the frontogenesis regions at different pressure levels throughout the study. Figure 13 shows the frontogenesis regions associated with the formation, development, and movement of our desert depression. Figure 13a shows the beginning of the frontogenesis region in southwest Algeria in an area where the cold northwestern air met the hot southern air (Figure 3a) and the occurrence of strong cyclogenesis in this region (Figure 10a). With the formation and development of the depression, a slight movement shifted to the northeast to be located above the middle of Algeria. We also noted the movement and expansion of the frontogenesis region with its intensity in Figure 13b. By 12Z05 April, the frontogenesis region associated with the cyclone reached west of Libya and south of Tunisia above the convergence area (Figure 10c).
On 00Z06, the low-level baroclinicity increased, and the frontogenesis region reached its maximum values and extension (Figure 13d). With the movement of the depression to northwest Libya (Figure 2e), we found the movement of the frontogenesis region (Figure 13e) and its presence also in northwest Libya, which accompanied the strong convergence zone in the surface layer (Figure 10e). On 00Z07, we found that the frontogenesis region (Figure 13f) moved over northwestern Egypt, which accompanied the movement of the depression (Figure 2f). In the middle of 7 April, we noticed the movement of the frontogenesis region to arrive over northeastern Egypt and extend eastward to cover the eastern Mediterranean area. On 8 April, the depression moved to the north of the Arabian Peninsula over Syria and Iraq (Figure 2h), and we found movement of the frontogenesis region to cover Syria, Iraq, and the north of Saudi Arabia.

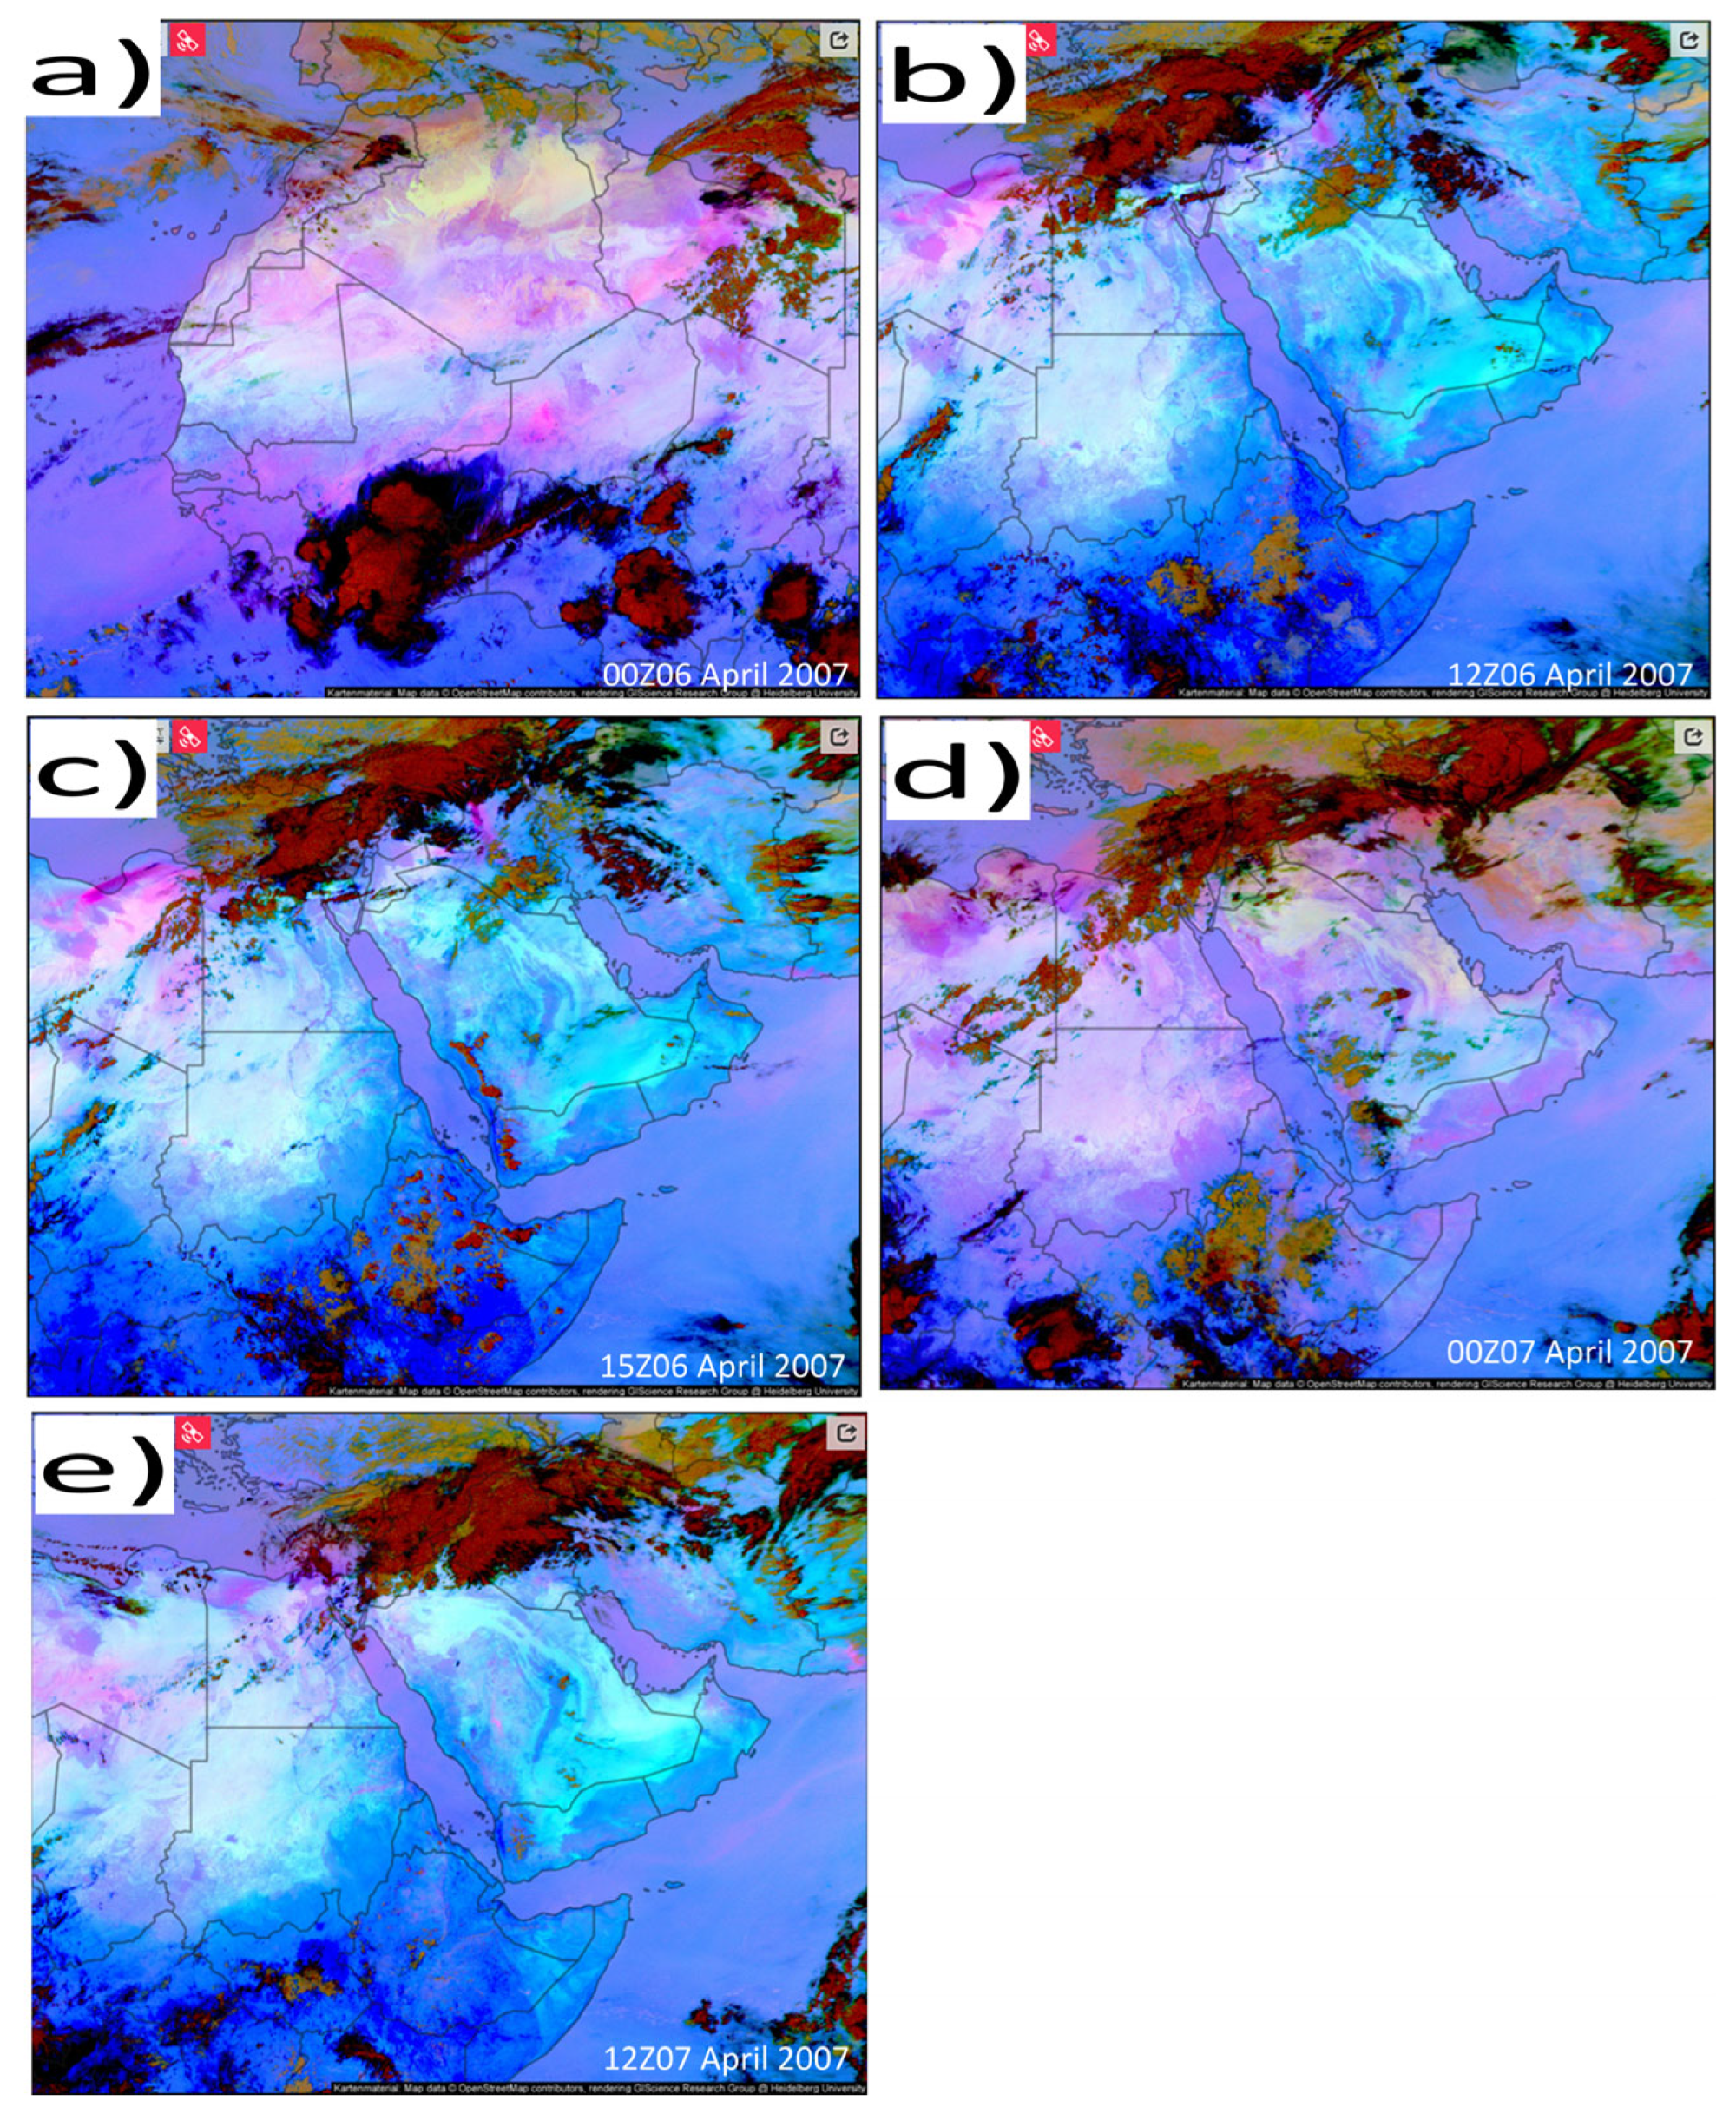
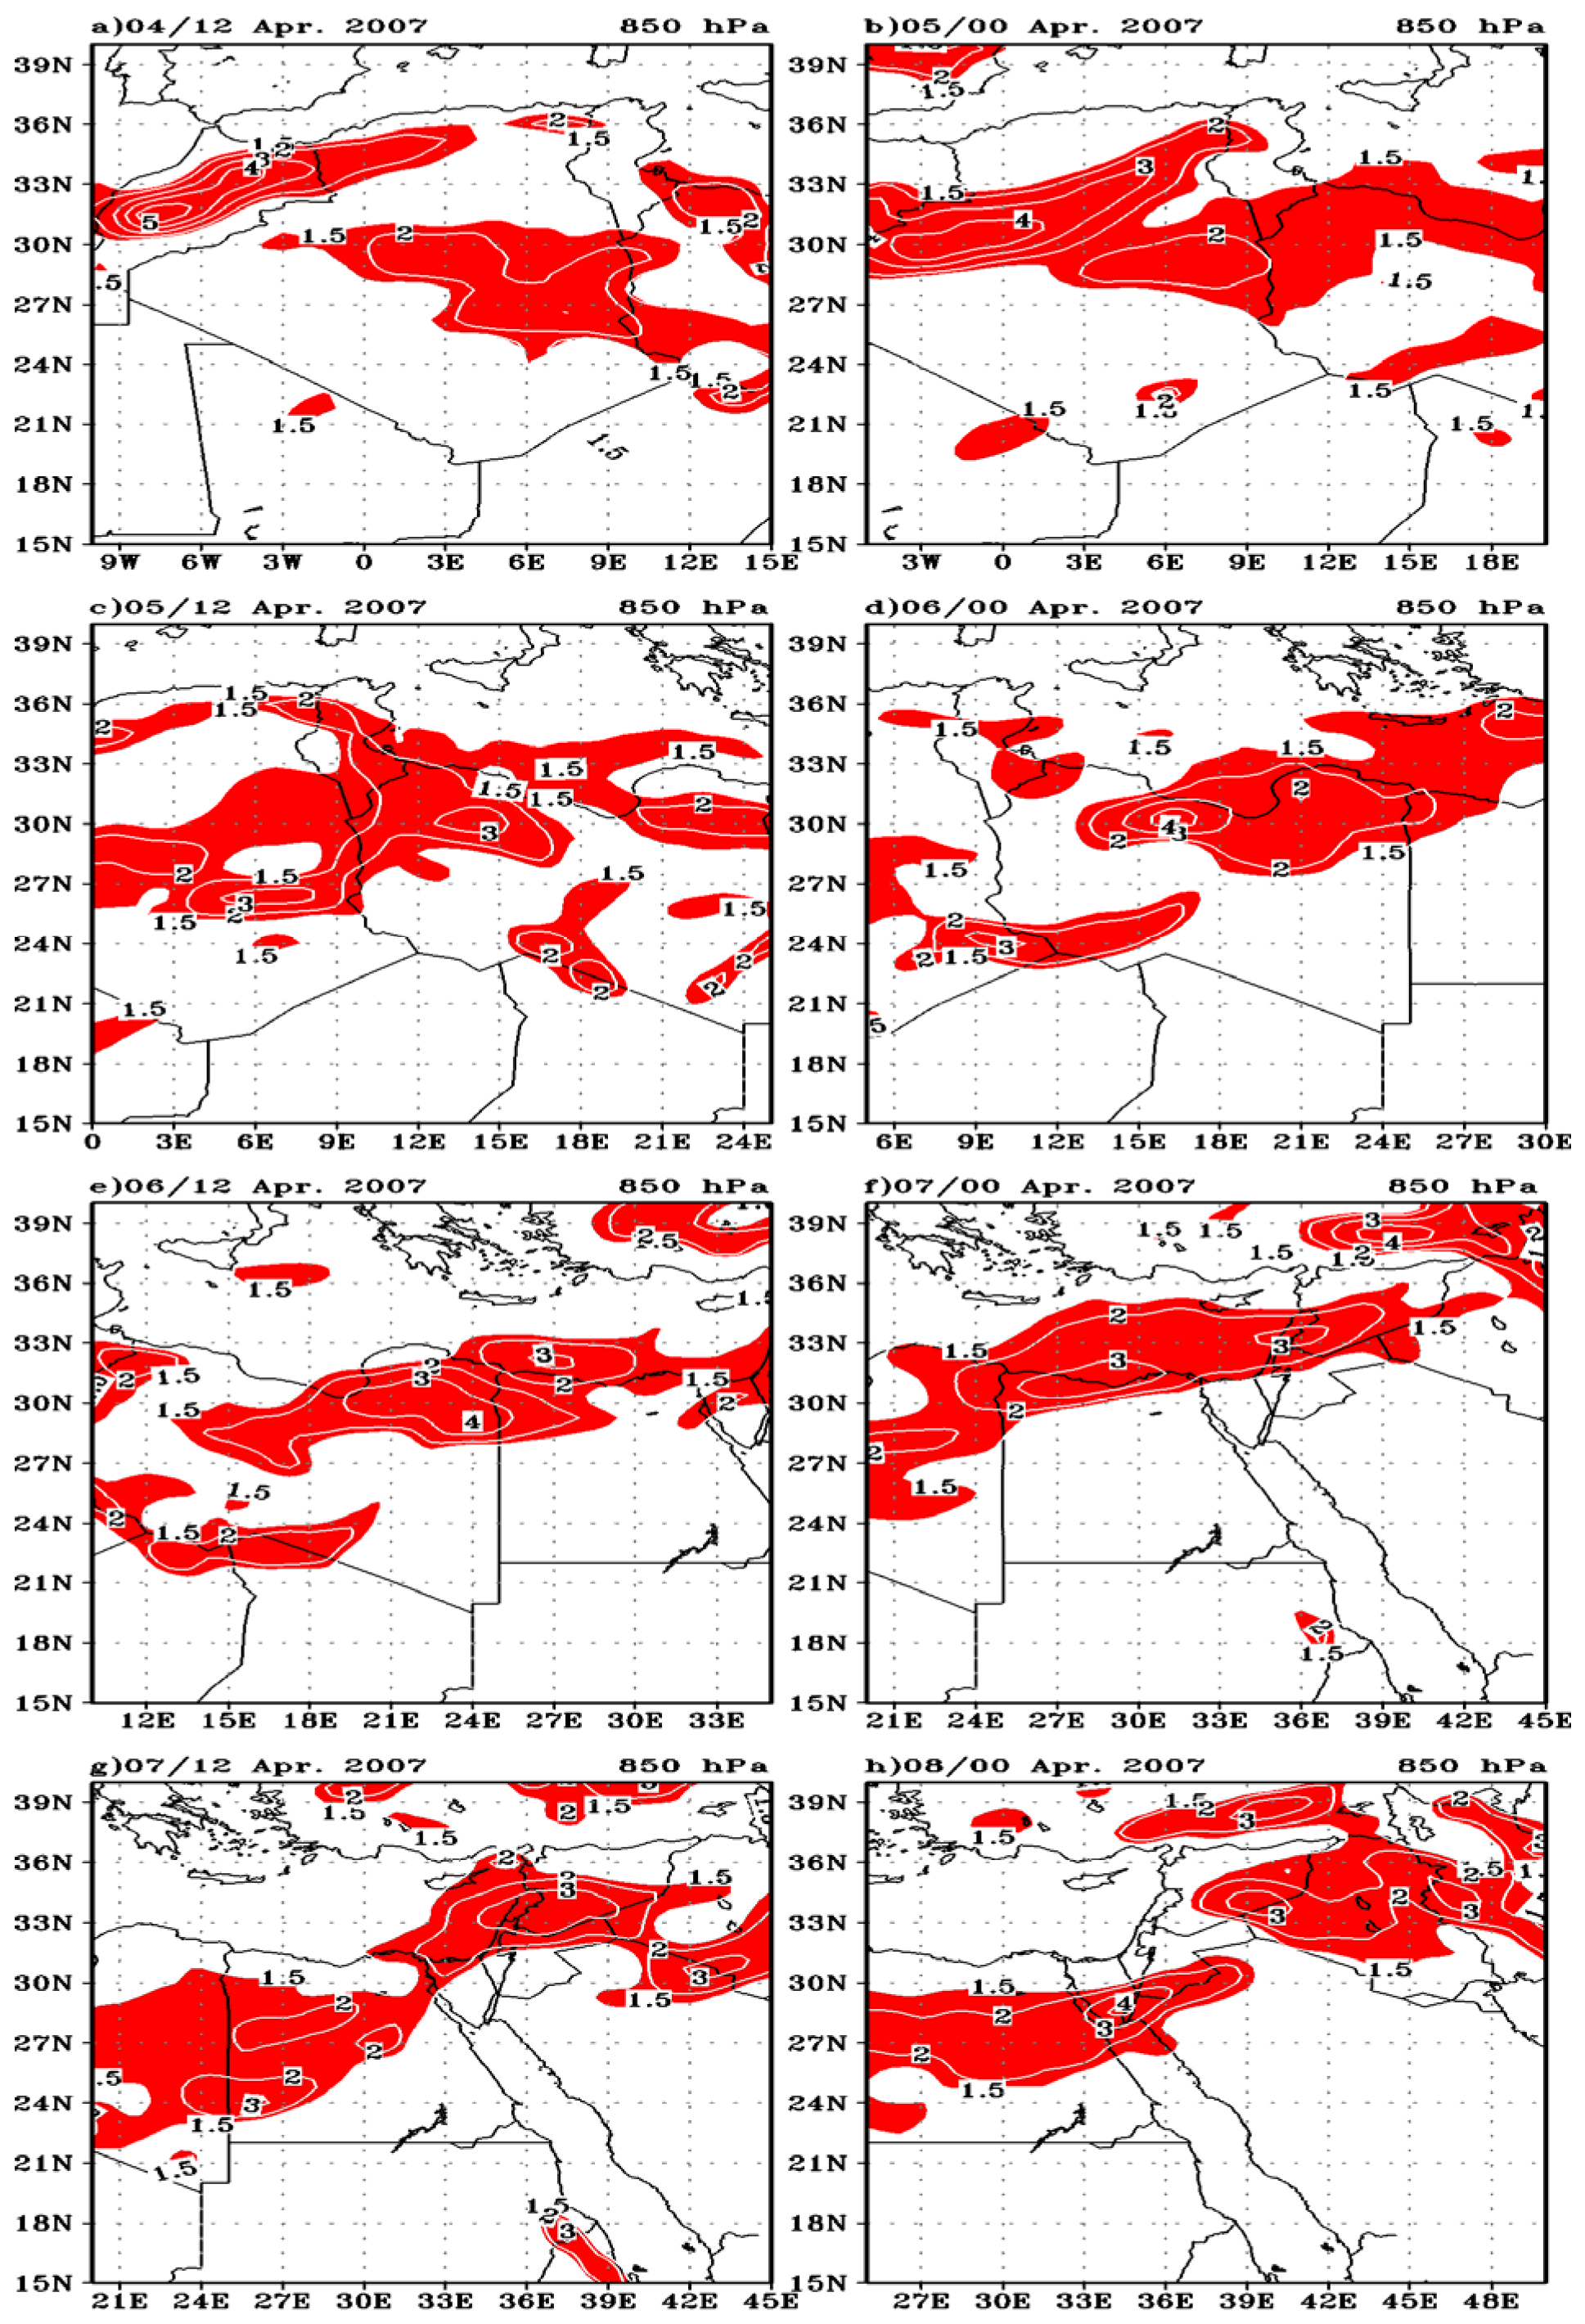
3.7. Spatiotemporal Evolution of Dust Emission

Figure 14 depicts a severely dust-laden atmosphere over North Africa using the CAMS dataset during the cyclogenesis period of our desert cyclone (4–8 April 2007). On 12Z04 April, the intrusive cold front from the southwest of Europe produced severe winds (≥25 m/s) near the surface, which resulted in a dust storm across southern Algeria. Dust emissions continued to increase as the storm developed and were aided by powerful westerly winds linked with the cold front (Figure 14b). The cyclone was apparent in Figure 14c at 12Z05 April as a set of three characteristics: a strong convergence area over the west of Libya associated with a closed band of dust (close to 24–30° N), a spiraling dust band through the north of Niger (north of 15° N) connected to a highly influential dust belt extending north to 21° N, and a free area of dust matching the cyclone’s southwest movement at 21–24° N (Figure 14c).
When the cyclone moved eastward, the cold front’s southerly winds continued to concentrate dust over Libya all day on April 6 (Figure 14d,e). On 6 April at 18Z, much of Algeria and the western half of Libya had been blanketed by a huge cyclonic dust structure as shown in Figure 14c. Spectacular limited visibility conditions occurred over eastern Libya on 6 April and continued until the morning of 7 April, when the storm moved eastward. The approach of the cyclone system over east Egypt was indicated by a rapid loss in visibility connected with advected dust, and measurements of roughly 1 km were recorded on 7 April at 00Z. The center of this cyclone was located over the Mediterranean Sea in the north of Egypt on the morning of April 7 (06Z07), and massive dust plumes were carried eastward over the Mediterranean Sea and Egypt (not shown) and reached Lebanon and Syria in the afternoon (Figure 14g). On 12Z07 April, dust emissions emerged across southern Jordan and northern Saudi Arabia while the storm core was over northeastern Egypt, as shown in Figure 14g. On 12Z07 April, the dust correlated with this cyclone appeared as two bands. The first was on the side of the southwesterly air and covered the cyclone’s northwestern border, while the second was on the side of the warm front and covered the cyclone’s northeastern edge (Figure 14g). Throughout the day on 8 April, the cyclone, with high volumes of dust along its southeastern border, continued to travel eastward and northward, and visibility deteriorated around midday on 8 April, reaching a low of 1 km at 18Z (not shown).
By April 9th at midnight, the storm had departed the north of Saudi Arabia, carrying a dense cloud of dust toward Iraq and Iran (Figure 14h). However, the cyclone’s (not shown) associated high winds continued to blow across Iran on April 9 and helped to mobilize a lot of dust. These winds were roughly 16 m/s.

4. Remarks on the Cyclogenesis Mechanism of This Case

This section aims to show the main results that were reached in this research and to develop a vision for the mechanism of the formation and development of the desert depression. According to the results of the analysis of the meridional temperature gradient over North Africa during the study period, the region’s strong meridional temperature gradient satisfied the conditions necessary for baroclinic instability in the boundary layer, which is a crucial prerequisite for desert cyclogenesis. The key finding from the investigation of temperature advection and vertical motion concerning the movement of our cyclone is that a dominant region of cooling (cold advection) was located west of the trough (which was the region of descending motion), and a region of heating (warm advection) was located east of the trough (which was the region of rising motion). Additionally, it found that the frontogenesis regions associated with cyclone movement were the regions that had a significant chance to create a front, which contained a thermal gradient from cold to warm air at wind convergence in ascent air areas. The generation of LLJ occurred when a developing desert cyclone was preferred by reinforcement of the meridional temperature gradient on the North African coast. The convergence at the lower level was offset by divergence in 700 hPa, which was evident by the divergence cycle associated with this baroclinic wave. Strong vertical motion associated with the lower-tropospheric convergence preserved the dust emission caused by the severe storms over the low at the surface, northeast of the LLJ.
Some studies focused on the role of the jet stream in the formation, development, and transmission of desert cyclones due to the presence of an intense phase of the subtropical jet stream and its dominance over the desert throughout most of the year [21]. Nevertheless, it was discovered that a jet maximum in the upper troposphere was connected to every case examined in one way or another. Studies that were in-depth, dynamic, energetic, and quantitative have been conducted for specific Sahara cyclone cases [77,78,79]. It has been shown that this particular kind of sub-synoptic phenomenon, which occurs across a low-latitude region with a particular configuration (a coastal desert area), can have a free oscillation wave with a period of the order of 24 h. Such an area’s diurnal variation may significantly contribute to amplifying the magnitude of such a disturbance. The quick mass changes in such a small active disturbance are a more critical and dominant component than the change in wind. The following is a summary of the properties of the cyclogenetic mechanism based on the work in this study and the work of Peterssen and Smebye [80]:
(1)
A disturbance in the high troposphere and an enhancement in baroclinicity are the initial synoptic conditions.
(2)
The jet stream region is the primary source of kinetic energy imported into the cyclone zone.
(3)
When a low-level region of warm advection (or near absence of cold advection) is covered by an already existing upper trough with significant vorticity advection on its forward side, development begins.
(4)
The distance between the upper trough and the low-level system rapidly narrows.
(5)
Thermal advection is initially small but grows as the low-level cyclone intensifies.
(6)
The amount of vorticity advection aloft is significant initially and gets smaller as peak intensity approaches.
(7)
Lower troposphere baroclinicity is comparatively low and rises as the storm gets stronger.
(8)
Both a front and several fronts co-occurring cannot be identified in the domain of the cyclone.
(9)
At first, the disturbance moves rather quickly, but as the cyclone gets closer to its maximum intensity, it moves less quickly.
(10)
As the storm nears its peak intensity, the cut-off is routinely seen.
The first eight characteristics are present in the desert cyclone in one form or another. The exit region of the jet steam may also experience significant vorticity advection as stated in (3). As a result, vorticity advection will result in an indirect circulation with a strong descent to the right and a strong ascent to the left of the jet stream. This technique allows the mass to adapt to the local anomaly in the velocity field. The kinetic energy will be transferred from the jet stream region to the lower layer mentioned in (2) by the intense subsidence, which will then take it to the surface of the earth as a hot, dry, and dusty wind. The lower layer mentioned in (6) and (7) will experience increased baroclinicity and thermal advection due to indirect circulation (Figure 15).

5. Conclusions

This work aimed to study the synoptic evolution and dynamics of the dust activity associated with the desert depression that occurred over the North African and Arabian Peninsula in 4–8 April 2007 based on ERA5 reanalysis data. This aim was achieved by analyzing vorticity in isobaric coordinates, temperature gradient, low-level jet, and frontogenesis to examine in detail the dynamic aspects of the development of this cyclone. Additionally, the cyclone’s accompanying dust emission was followed along its track. The depression was accompanied by very unusual weather, including hot, windy, and dusty conditions in vast regions of North Africa and the Arabian Peninsula. The main significant findings are the following.
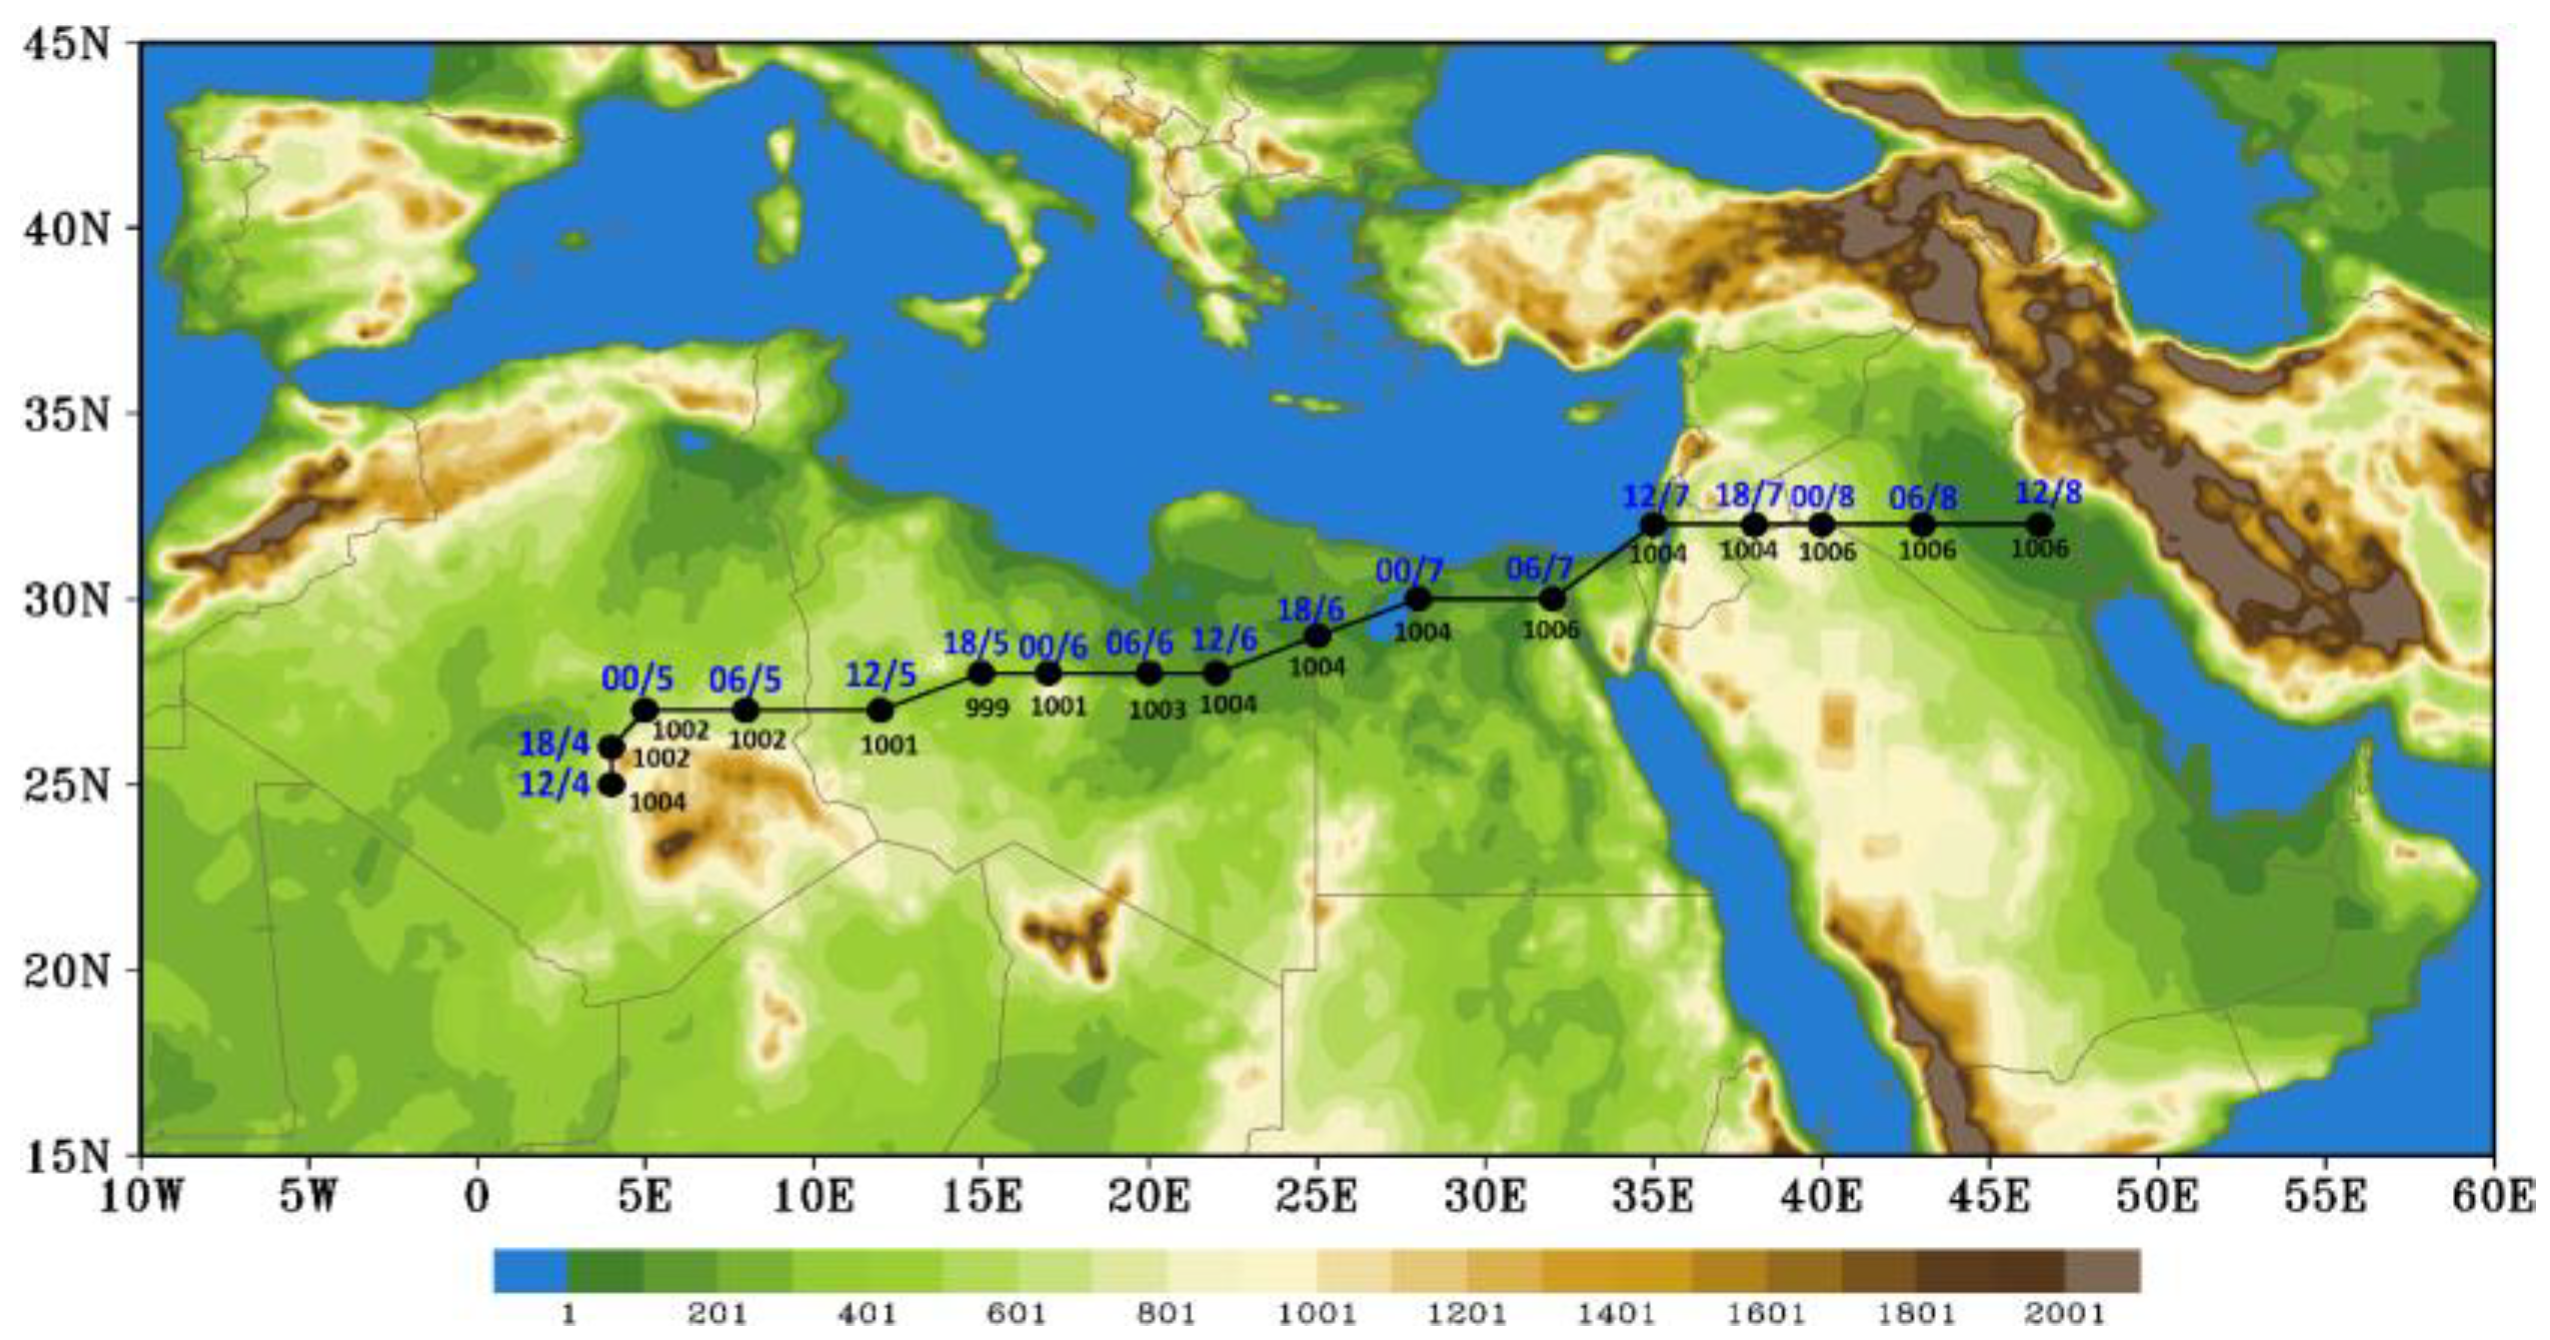
  • A significant trough at 850 hPa with a strong north–south orientation allowed cold air to enter northern Africa (Algeria) from higher latitudes. The desert cyclone formed over Algeria when the contrast of temperature between North Africa (the Sahara) and the Mediterranean Sea (the water) was intense due to the significant increase in temperatures over the hot Sahara compared to the cold seawater. Our desert cyclone developed along the front, where the cold air from the Mediterranean Sea met the hot air from Africa.
  • The cyclone and its front were the main dynamic elements that mobilized and transported dust through the life cycle of this cyclone. Powerful winds (≥25 m/s) at the surface connected with the cyclone cold front caused significant dust emissions as it passed across Algeria, Libya, Mali, and Egypt. After the dust production at a high altitude (~3 km), upward mixing around the cyclone eye occurred. In addition to transporting air masses of dust, the cyclone continued to generate dust locally as it moved over the hot desert.
  • The analysis of vorticity in isobaric coordinates is a practical, precise, and simple technique to describe the initiation and evolution of our case of cyclogenesis. Additionally, the presentation of the chronology of the relative vorticity on different isobaric surfaces has helped to understand the dynamics of low-level evolution easily.
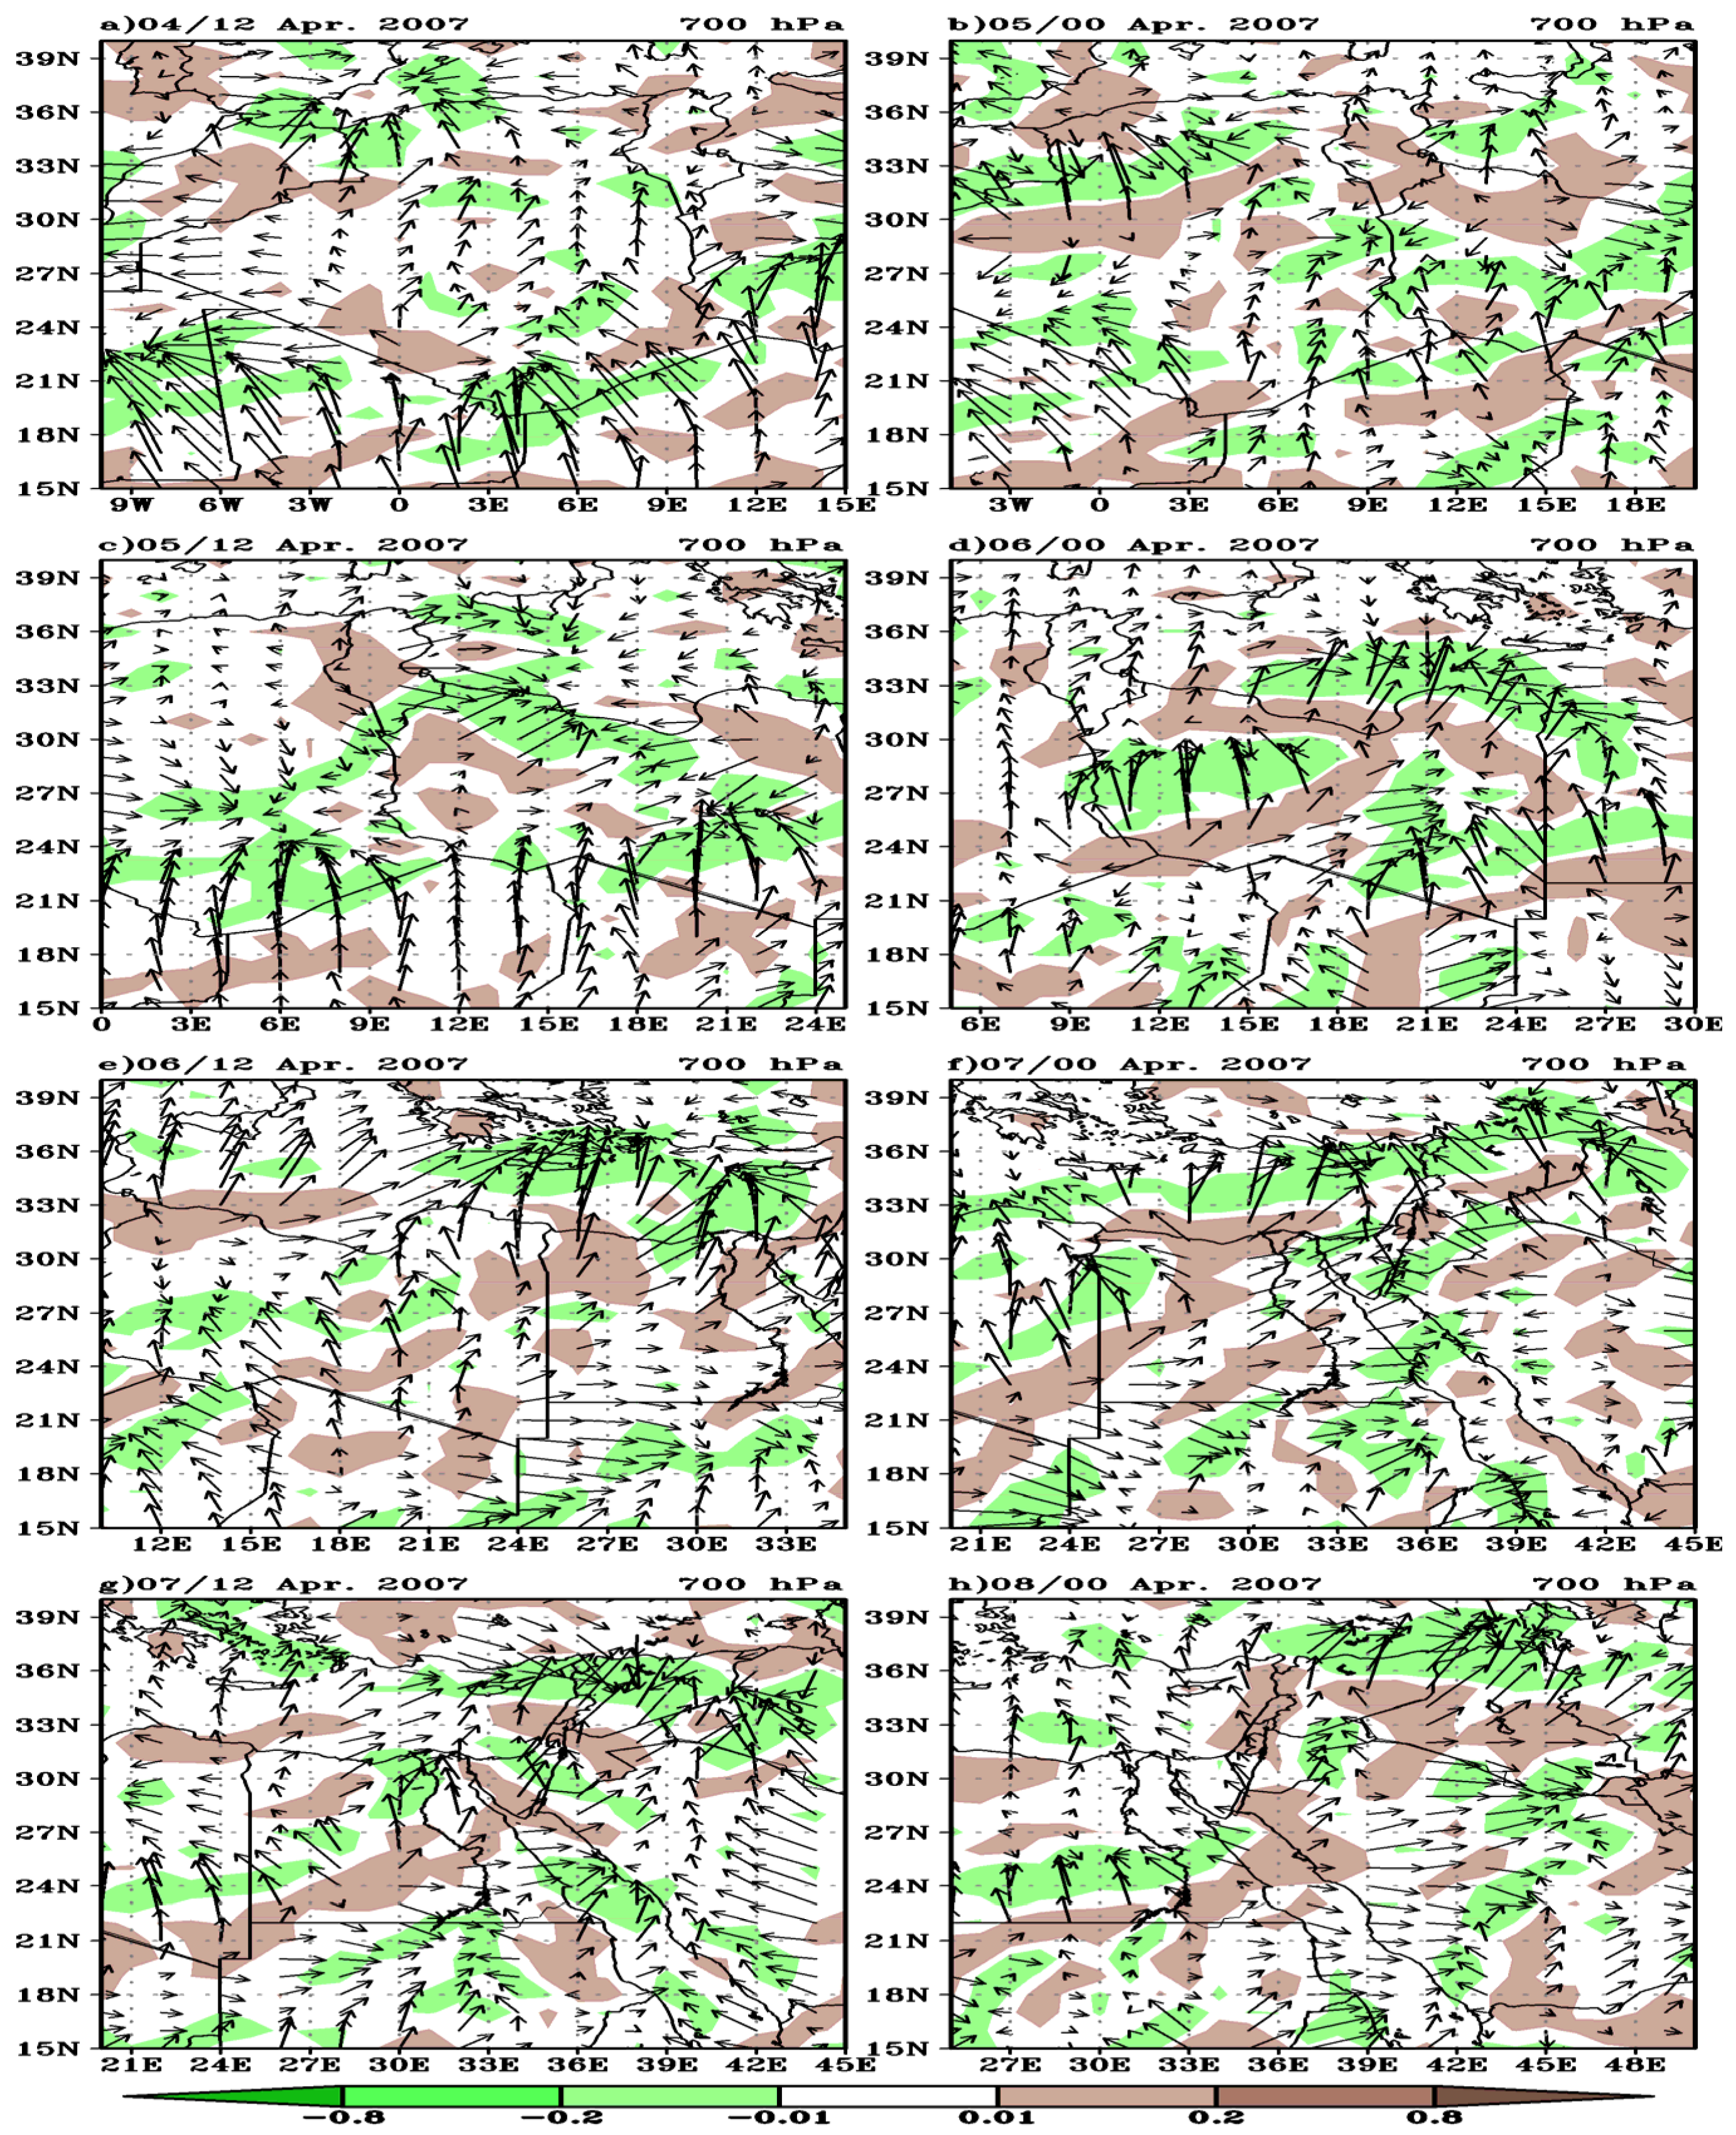
  • The LLJ forms when a desert cyclone (baroclinic wave) develops over northern Africa, usually in the lee of the Atlas Mountains, and the meridional gradient of temperature strengthens. The convergence at a lower level is offset by divergence in the upper troposphere (700 hPa in this case), and this is evident by the divergence cycle associated with this baroclinic wave. The intense vertical motion brought on by the lower-tropospheric convergence sustains the dust emission produced by severe storms over the surface just northeast of the low-level jet.
  • The study indicated the role of some mechanisms in frequently occurring desert depressions in North Africa, including the lee effects of the mountains, strong boundary layer baroclinity (since the northern African coast has a significant meridional temperature gradient), and low-level jet stream related to the circulations.
  • The overall amount of dust noticed each year across North and East Africa may be considerably impacted by desert cyclones of this type. High dust loads related to this type of cyclone throughout its life and along its path are also anticipated to influence the regional energy budget and radiate over northern and eastern Africa, and it may also influence the atmospheric dynamics in that area.

Author Contributions

Conceptualization, M.A.-M., H.A.B. and A.A. (Abdallah Abdeldym); Data curation, M.A.-M., A.A. (Abdallah Abdeldym) and A.L.; Formal analysis, M.A.-M. and H.A.B.; Funding acquisition, A.L.; Methodology, A.A. (Ahmed Alkhouly), M.A.-M., H.A.B., M.M. and A.L.; Project administration, M.A.-M.; Resources, M.A.-M.; Software, A.A. (Abdallah Abdeldym) and A.A. (Ahmed Alkhouly); Supervision, A.L., M.A.-M. and H.A.B.; Validation, A.A. (Abdallah Abdeldym) and M.M.; Visualization, A.A. (Abdallah Abdeldym) and A.A. (Ahmed Alkhouly); Writing—original draft, M.M.; Writing—review&editing, H.A.B. All authors have read and agreed to the published version of the manuscript.

Funding

This research was funded by Princess Nourah bint Abdulrahman University Researchers Supporting Project number (PNURSP2023R241), Princess Nourah bint Abdulrahman University, Riyadh, Saudi Arabia.

Institutional Review Board Statement

Not applicable.

Informed Consent Statement

Not applicable.

Data Availability Statement

The data supporting the findings of this article are included within the article and obtained from https://cds.climate.copernicus.eu/cdsapp#!/dataset/reanalysis-era5-pressure-levels?tab=overview (accessed on 11 May 2022) and https://ads.atmosphere.copernicus.eu/cdsapp#!/dataset/cams-global-reanalysis-eac4?tab=form (accessed on 17 Jun 2022) for dust aerosol optical depth.

Acknowledgments

The researchers express their great thanks and appreciation to the Princess Nourah bint Abdulrahman University for their support and funding of this research.

Conflicts of Interest

The authors declare no conflict of interest.

References

  1. Prospero, J.M.; Ginoux, P.; Torres, O.; Nicholson, S.E.; Gill, T.E. Environmental characterization of global sources of atmospheric soil dust identified with the Nimbus 7 Total Ozone Mapping Spectrometer (TOMS) absorbing aerosol product. Rev. Geo-Phys. 2002, 40, 2-1-2-31. [Google Scholar] [CrossRef]
  2. Engelstaedter, S.; Tegen, I.; Washington, R. North African dust emissions and transport. Earth-Sci. Rev. 2006, 79, 73–100. [Google Scholar] [CrossRef]
  3. Laurent, B.; Marticorena, B.; Bergametti, G.; Léon, J.F.; Mahowald, N.M. Modeling mineral dust emissions from the Sahara desert using new surface properties and soil database. J. Geophys. Res. Atmos. 2008, 113, D14218. [Google Scholar] [CrossRef] [Green Version]
  4. Gerasopoulos, E.; Kouvarakis, G.; Babasakalis, P.; Vrekoussis, M.; Putaud, J.; Mihalopoulos, N. Origin and variability of particulate matter (PM10) mass concentrations over the Eastern Mediterranean. Atmos. Environ. 2006, 40, 4679–4690. [Google Scholar] [CrossRef]
  5. Balis, D.; Amiridis, V.; Kazadzis, S.; Papayannis, A.; Tsaknakis, G.; Tzortzakis, S.; Kalivitis, N.; Vrekoussis, M.; Kanakidou, M.; Mihalopoulos, N.; et al. Optical characteristics of desert dust over the East Mediterranean during summer: A case study. Ann. Geophys. 2006, 24, 807–821. [Google Scholar] [CrossRef] [Green Version]
  6. Kalivitis, N.; Gerasopoulos, E.; Vrekoussis, M.; Kouvarakis, G.; Kubilay, N.; Hatzianastassiou, N.; Vardavas, I.; Mihalopoulos, N. Dust transport over the eastern Mediterranean derived from Total Ozone Mapping Spectrometer, Aerosol Robotic Network, and surface measurements. J. Geophys. Res. 2007, 112, D03202. [Google Scholar] [CrossRef] [Green Version]
  7. Amiridis, V.; Kafatos, M.; Perez, C.; Kazadzis, S.; Gerasopoulos, E.; Mamouri, R.E.; Papayannis, A.; Kokkalis, P.; Giannakaki, E.; Basart, S.; et al. The potential of the synergistic use of passive and active remote sensing measurements for the validation of a regional dust model. Ann. Geophys. 2009, 27, 3155–3164. [Google Scholar] [CrossRef] [Green Version]
  8. Derbyshire, E. Natural Minerogenic Dust and Human Health. AMBIO J. Hum. Environ. 2007, 36, 73–77. [Google Scholar] [CrossRef]
  9. Mitsakou, C.; Kallos, G.; Papantoniou, N.; Spyrou, C.; Solomos, S.; Astitha, M.; Housiadas, C. Saharan dust levels in Greece and received inhalation doses. Atmos. Chem. Phys. 2008, 8, 7181–7192. [Google Scholar] [CrossRef] [Green Version]
  10. Nastos, P.T.; Paliatsos, A.G.; Anthracopoulos, M.B.; Roma, E.S.; Priftis, K.N. Outdoor particulate matter and childhood asthma admissions in Athens, Greece: A time-series study. Environ. Health 2010, 9, 45. [Google Scholar] [CrossRef]
  11. Samoli, E.; Nastos, P.T.; Paliatsos, A.G.; Katsouyanni, K.; Priftis, K.N. Acute effects of air pollution on pediatric asthma exacerbation: Evidence of association and effect modification. Environ. Res. 2011, 111, 418–424. [Google Scholar] [CrossRef] [PubMed]
  12. Solomos, S.; Kallos, G.; Kushta, J.; Astitha, M.; Tremback, C.; Nenes, A.; Levin, Z. An integrated modeling study on the effects of mineral dust and sea salt particles on clouds and precipitation. Atmos. Chem. Phys. 2011, 11, 873–892. [Google Scholar] [CrossRef] [Green Version]
  13. Kallos, G.; Solomos, S.; Kushta, J.; Mitsakou, C.; Spyrou, C.; Bartsotas, N.; Kalogeri, C. Natural and Anthropogenic Aerosols in the Mediterranean region and Middle East: Patterns and Impacts. Sci. Total Environ. 2014, 488, 389–397. [Google Scholar] [CrossRef] [PubMed]
  14. Jickells, T.D.; An, Z.S.; Andersen, K.K.; Baker, A.R.; Bergametti, G.; Brooks, N.; Cao, J.J.; Boyd, P.W.; Duce, R.A.; Hunter, K.A.; et al. Global iron connections between desert dust, ocean biogeochemistry, and climate. Science 2005, 308, 67–71. [Google Scholar] [CrossRef] [PubMed] [Green Version]
  15. Okin, G.; Parsons, A.; Wainwright, J.; Herrick, J.; Bestelmeyer, B.; Peters, D.; Fredrickson, E. Do Changes in Connectivity Explain Desertification? Bioscience 2009, 59, 237–244. [Google Scholar] [CrossRef]
  16. Kushta, J.; Kallos, G.; Astitha, M.; Solomos, S.; Spyrou, C.; Mitsakou, C.; Lelieveld, J. Impact of natural aerosols on atmospheric radiation and consequent feedbacks with the meteorological and photochemical state of the atmosphere. J. Geophys. Res. Atmos. 2013, 119, 1463–1491. [Google Scholar] [CrossRef]
  17. Gkikas, A.; Obiso, V.; Pérez García-Pando, C.; Jorba, O.; Hatzianastassiou, N.; Vendrell, L.; Basart, S.; Solomos, S.; Gassó, S.; Baldasano, J.M. Direct radiative effects during intense Mediterranean desert dust outbreaks. Atmos. Chem. Phys. 2018, 18, 8757–8787. [Google Scholar] [CrossRef] [Green Version]
  18. Kosmopoulos, P.G.; Kazadzis, S.; Taylor, M.; Athanasopoulou, E.; Speyer, O.; Raptis, P.I.; Marinou, E.; Proestakis, E.; Solomos, S.; Gerasopoulos, E.; et al. Dust impact on surface solar irradiance assessed with model simulations, satellite observations and ground-based measurements. Atmos. Meas. Tech. 2017, 10, 2435–2453. [Google Scholar] [CrossRef] [Green Version]
  19. Péwé, T.L. Desert dust: An overview. In Desert Dust: Origin, Characteristics, and Effect on Man; Geological Society of America: Boulder, CO, USA, 1981; Volume 186, pp. 1–10. [Google Scholar]
  20. El fandy, M.G. The formation of depressions of the Khamsin type. Q. J. R. Meteorol. Soc. 1940, 66, 323–336. [Google Scholar] [CrossRef]
  21. Tantawy, A.H. The role of the jet stream in the formation of desert depressions in the Middle East. WMO Tech. Note 1964, 64, 159–171. [Google Scholar]
  22. Lee, I.Y. Simulation of transport and removal processes of the Saharan dust. J. Clim. Appl. Meteorol. 1983, 22, 632–639. [Google Scholar] [CrossRef]
  23. Westphal, D.L.; Toon, O.B.; Carlson, T.N. A Numerical Investigation of Saharan Dust Storms. Ph.D. Thesis, Penn State University, State College, PA, USA, 1985. [Google Scholar]
  24. Alpert, P.; Ziv, B. The Sharav cyclone: Observations and some theoretical considerations. J. Geophys. Res. Atmos. 1989, 94, 18495–18514. [Google Scholar] [CrossRef] [Green Version]
  25. Schepanski, K.; Tegen, I.; Todd, M.C.; Heinold, B.; Bönisch, G.; Laurent, B.; Macke, A. Meteorological processes forcing Saharan dust emission inferred from MSG-SEVIRI observations of subdaily dust source activation and numerical models. J. Geophys. Res. Atmos. 2009, 114, D10201. [Google Scholar] [CrossRef] [Green Version]
  26. Pedgley, D.E. Desert depression over north-east Africa. Meteorol. Mag. 1972, 1, 228–244. [Google Scholar]
  27. Winstanley, D. The North African flood disaster September 1969. Weather 1970, 25, 390–403. [Google Scholar] [CrossRef]
  28. Moulin, C.; Lambert, C.E.; Dayan, U.; Masson, V.; Ramonet, M.; Bousquet, P.; Legrand, M.; Balkanski, Y.J.; Guelle, W.; Marticorena, B.; et al. Satellite climatology of African dust transport in the Mediterranean atmosphere. J. Geophys. Res. Atmos. 1998, 103, 13137–13144. [Google Scholar] [CrossRef]
  29. Barkan, J.; Alpert, P.; Kutiel, H.; Kishcha, P. Synoptics of dust transportation days from Africa toward Italy and central Europe. J. Geophys. Res. Atmos. 2005, 110, D07208. [Google Scholar] [CrossRef] [Green Version]
  30. Knippertz, P. Dust emissions in the West African heat trough-the role of the diurnal cycle and of extratropical disturbances. Meteorol. Z. 2008, 17, 553. [Google Scholar] [CrossRef] [Green Version]
  31. Todd, M.C.; Washington, R.; Raghavan, S.; Lizcano, G.; Knippertz, P. Regional model simulations of the Bodélé low-level jet of northern Chad during the Bodélé Dust Experiment (BoDEx 2005). J. Clim. 2008, 21, 995–1012. [Google Scholar] [CrossRef]
  32. Washington, R.; Todd, M.C. Atmospheric controls on mineral dust emission from the Bodélé Depression, Chad: The role of the low level jet. Geophys. Res. Lett. 2005, 32, L17701. [Google Scholar] [CrossRef]
  33. Cavazos, C.; Todd, M.C.; Schepanski, K. Numerical model simulation of the Saharan dust event of 6–11 March 2006 using the Regional Climate Model version 3 (RegCM3). J. Geophys. Res. Atmos. 2009, 114, D12109. [Google Scholar] [CrossRef] [Green Version]
  34. Jankowiak, I.; Tanré, D. Satellite climatology of Saharan dust outbreaks: Method and preliminary results. J. Clim. 1992, 5, 646–656. [Google Scholar] [CrossRef]
  35. Knippertz, P.; Fink, A.H. Synoptic and dynamic aspects of an extreme springtime Saharan dust outbreak. Q. J. R. Meteorol. Soc. 2006, 132, 1153–1177. [Google Scholar] [CrossRef] [Green Version]
  36. Tulet, P.; Mallet, M.; Pont, V.; Pelon, J.; Boone, A. The 7–13 March 2006 dust storm over West Africa: Generation, transport, and vertical stratification. J. Geophys. Res. Atmos. 2008, 113, D00C08. [Google Scholar] [CrossRef] [Green Version]
  37. Prodi, F.; Fea, G. A case of transport and deposition of Saharan dust over the Italian peninsula and southern Europe. J. Geophys. Res. Ocean. 1979, 84, 6951–6960. [Google Scholar] [CrossRef]
  38. Wang, J.X. Mapping the global dust storm records: Review of dust data sources in supporting modeling/climate study. Curr. Pollut. Rep. 2015, 1, 82–94. [Google Scholar] [CrossRef] [Green Version]
  39. Cuspilici, A.; Monforte, P.; Ragusa, M.A. Study of Saharan dust influence on PM10 measures in Sicily from 2013 to 2015. Ecol. Indic. 2017, 76, 297–303. [Google Scholar] [CrossRef]
  40. Krasnov, H.; Katra, I.; Koutrakis, P.; Friger, M.D. Contribution of dust storms to PM10 levels in an urban arid environment. J. Air Waste Manag. Assoc. 2014, 64, 89–94. [Google Scholar] [CrossRef] [Green Version]
  41. Jafari, R.; Malekian, M. Comparison and evaluation of dust detection algorithms using MODIS Aqua/Terra Level 1B data and MODIS/OMI dust products in the Middle East. Int. J. Remote Sens. 2015, 36, 597–617. [Google Scholar] [CrossRef]
  42. Marchese, F.; Sannazzaro, F.; Falconieri, A.; Filizzola, C.; Pergola, N.; Tramutoli, V. An enhanced satellite-based algorithm for de-tecting and tracking dust outbreaks by means of SEVIRI data. Remote Sens. 2017, 9, 537. [Google Scholar] [CrossRef] [Green Version]
  43. Marinou, E.; Amiridis, V.; Binietoglou, I.; Tsikerdekis, A.; Solomos, S.; Proestakis, E.; Konsta, D.; Papagiannopoulos, N.; Tsekeri, A.; Vlastou, G.; et al. Three-dimensional evolution of Saharan dust transport towards Europe based on a 9-year EARLINET-optimized CALIPSO dataset. Atmos. Chem. Phys. 2017, 17, 5893–5919. [Google Scholar] [CrossRef] [Green Version]
  44. Chun, Y.; Boo, K.O.; Kim, J.; Park, S.U.; Lee, M. Synopsis, transport, and physical characteristics of Asian dust in Korea. J. Geophys. Res. Atmos. 2001, 106, 18461–18469. [Google Scholar] [CrossRef]
  45. Kurosaki, Y.; Mikami, M. Recent frequent dust events and their relation to surface wind in East Asia. Geophys. Res. Lett. 2003, 30, 1–4. [Google Scholar] [CrossRef]
  46. Natsagdorj, L.; Jugder, D.; Chung, Y.S. Analysis of dust storms observed in Mongolia during 1937–1999. Atmos. Environ. 2003, 37, 1401–1411. [Google Scholar] [CrossRef]
  47. Qian, W.; Quan, L.; Shi, S. Variations of the dust storm in China and its climatic control. J. Clim. 2002, 15, 1216–1229. [Google Scholar] [CrossRef]
  48. Shao, Y.; Dong, C.H. A review on East Asian dust storm climate, modelling and monitoring. Glob. Planet. Chang. 2006, 52, 1–22. [Google Scholar] [CrossRef]
  49. Sun, J.; Zhang, M.; Liu, T. Spatial and temporal characteristics of dust storms in China and its surrounding regions, 1960–1999: Relations to source area and climate. J. Geophys. Res. Atmos. 2001, 106, 10325–10333. [Google Scholar] [CrossRef]
  50. Yu, Y.; Notaro, M.; Liu, Z.; Kalashnikova, O.; Alkolibi, F.; Fadda, E.; Bakhrjy, F. Assessing temporal and spatial variations in atmospheric dust over Saudi Arabia through satellite, radiometric, and station data. J. Geophys. Res. Atmos. 2013, 118, 213–253. [Google Scholar] [CrossRef]
  51. Washington, R.; Todd, M.C.; Middleton, N.J.; Goudie, E.S. Dust-storm source areas determined by the total ozone monitoring spectrometer and surface observations. Ann. Assoc. Am. Geogr. 2003, 93, 297–313. [Google Scholar] [CrossRef]
  52. Mashat, A.; Awad, A.M. The classification of the dusty areas over the Middle-East. Bull. Fac. Sci. Cairo Univ. 2010, 78, 1–19. [Google Scholar]
  53. Barnaba, F.; Gobbi, G.P. Aerosol seasonal variability over the Mediterranean region and relative impact of maritime, continental and Saharan dust particles over the basin from MODIS data in the year 2001. Atmos. Chem. Phys. 2004, 4, 2367–2391. [Google Scholar] [CrossRef] [Green Version]
  54. Papadimas, C.D.; Hatzianastassiou, N.; Mihalopoulos, N.; Kanakidou, M.; Katsoulis, B.D.; Vardavas, I. Assessment of the MODIS Collections C005 and C004 aerosol optical depth products over the Mediterranean Basin. Atmos. Chem. Phys. 2008, 9, 2987–2999. [Google Scholar] [CrossRef] [Green Version]
  55. Hatzianastassiou, N.; Gkikas, A.; Mihalopoulos, N.; Torres, O.; Katsoulis, B.D. Natural versus anthropogenic aerosols in the eastern Mediterranean Basin derived from multiyear TOMS and MODIS satellite data. J. Geophys. Res. 2009, 114, D24202. [Google Scholar] [CrossRef]
  56. Gaetani, M.; Pasqui, M. Synoptic patterns associated with extreme dust events in the Mediterranean Basin. Reg. Environ. Chang. 2012, 14, 1847–1860. [Google Scholar] [CrossRef]
  57. Al-Jumaily, K.J.; Ibrahim, M.K. Analysis of synoptic situation for dust storms in Iraq. Int. J. Energy Environ. 2013, 4, 851–858. [Google Scholar]
  58. Awad, A.M.; Mashat, A.S. Synoptic features associated with dust transition processes from North Africa to Asia. Arab J. Geosci. 2014, 7, 2451–2467. [Google Scholar] [CrossRef]
  59. Awad, A.M.; Mashat, A.S.; Abo Salem, F.F. Diagnostic study of spring dusty days over the southwest region of the Kingdom of Saudi Arabia. Arab J. Geosci. 2015, 8, 2265–2282. [Google Scholar] [CrossRef]
  60. Davis, S.M.; Hegglin, M.I.; Fujiwara, M.; Dragani, R.; Harada, Y.; Kobayashi, C.; Long, C.; Manney, G.L.; Nash, E.R.; Potter, G.L.; et al. Assessment of upper tropospheric and stratospheric water vapor and ozone in reanalyses as part of S-RIP. Atmos. Chem. Phys. 2017, 17, 12743–12778. [Google Scholar] [CrossRef] [Green Version]
  61. Hersbach, H.; Bell, B.; Berrisford, P.; Hirahara, S.; Horányi, A.; Muñoz-Sabater, J.; Nicolas, J.; Peubey, C.; Radu, R.; Schepers, D.; et al. The ERA5 global reanalysis. Q. J. R. Meteorol. Soc. 2020, 146, 1999–2049. [Google Scholar] [CrossRef]
  62. Inness, A.; Ades, M.; Agustí-Panareda, A.; Barré, J.; Benedictow, A.; Blechschmidt, A.M.; Dominguez, J.J.; Engelen, R.; Eskes, H.; Flemming, J.; et al. The CAMS reanalysis of atmospheric composition. Atmos. Chem. Phys. 2019, 19, 3515–3556. [Google Scholar] [CrossRef] [Green Version]
  63. Carlson, T.N. Mid-Latitude Weather Systems; Harper Collins Academic: London, UK, 1991. [Google Scholar]
  64. Palmén, E.H.; Newton, C.W. Atmospheric Circulation Systems: Their Structure and Physical Interpretation; Academic Press: Cambridge, MA, USA, 1969. [Google Scholar]
  65. Petterssen, S. Weather Analysis and Forecasting; McGraw Hill: New York, NY, USA, 1956. [Google Scholar]
  66. Holton, J.R. An introduction to dynamic meteorology. Am. J. Phys. 1973, 41, 752–754. [Google Scholar] [CrossRef]
  67. Parish, T.R.; Oolman, L.D. On the role of sloping terrain in the forcing of the Great Plains low-level jet. J. Atmos. Sci. 2010, 67, 2690–2699. [Google Scholar] [CrossRef] [Green Version]
  68. Abdeldym, A.; Basset, H.A.; Sayad, T.; Morsy, M. Kinetic energy budget and moisture flux convergence analysis during interaction between two cyclonic systems: Case study. Dyn. Atmos. Ocean. 2019, 86, 73–89. [Google Scholar] [CrossRef]
  69. Krishnamupti, T.N.; Bounoua, L. An Introduction to Numerical Weather Prediction Techniques; CRC Press: Boca Raton, FL, USA, 2018. [Google Scholar]
  70. Flocas, H.A.; Karacostas, T.S. Cyclogenesis over the Aegean Sea: Identification and synoptic categories. Meteorol. Appl. 1996, 3, 53–61. [Google Scholar] [CrossRef]
  71. Karacostas, T.S.; Flocas, A.A. The development of the bomb over the Mediterranean area in Climat méditerranéen et ressources en eau. Première partie. La Météorologie Paris 1983, 34, 351–358. [Google Scholar]
  72. Prezerakos, N.G. Some appreciable tropospheric circulation features leading to surface cyclogenesis in the central Mediterranean region. In Extended Abstracts of Papers ICS/ICTP/WMO International Workshop on Mediterranean Cyclones Studies; International Center for Theoretical Physics: Trieste, Italy, 1992; Volume 18022, pp. 74–80. [Google Scholar]
  73. Prezerakos, N.G.; Flocas, H.A.; Michaelides, S.C. Upper-tropospheric downstream development leading to surface cyclogenesis in the central Mediterranean. Meteorol. Appl. 1999, 6, 313–322. [Google Scholar] [CrossRef]
  74. Balmez, M.; Stefan, S. On the formation mechanism of low-level jet over Bucharest’s airports. Rom. J. Phys. 2014, 59, 792–807. [Google Scholar]
  75. Thorncroft, C.D.; Flocas, H.A. A case study of Saharan cyclogenesis. Mon. Weather. Rev. 1997, 125, 1147–1165. [Google Scholar] [CrossRef]
  76. Trigo, I.F.; Bigg, G.R.; Davies, T.D. Climatology of cyclogenesis mechanisms in the Mediterranean. Mon. Weather. Rev. 2002, 130, 549–569. [Google Scholar] [CrossRef]
  77. Hassan, A.A. A Diagnostic Study of a Northern African Depression. Ph.D. Thesis, University of Reading, Reading, UK, 1974. [Google Scholar]
  78. Yousef, A. Development and application of a limited area numerical model. Ph.D. Thesis, Cairo University, Giza Governorate, Dusty, 1988. [Google Scholar]
  79. Abdel Basset, H. Energy conversions of a desert depression. Meteorol. Atmos. Phys. 2001, 76, 203–222. [Google Scholar] [CrossRef]
  80. Petterssen, S.; Smebye, S.J. On the development of extratropical cyclones. Q. J. R. Meteorol. Soc. 1971, 97, 457–482. [Google Scholar] [CrossRef]
Figure 1. The track of the desert depression during the period from 12Z04 to 12Z08 April 2007. The black numbers are the values of pressure at the center of the depression every six hours, and the blue numbers are the time during the period from 12Z04 to 12Z08 April 2007. The shaded areas represent the elevation of the surface topography (m).
Atmosphere 14 00196 g001
Figure 2. 1000 hPa geopotential height contours at every 10 gpm interval (blue solid) and temperature (red dashed) every 3 °C at 12Z and 00Z for 4–8 April 2007.
Atmosphere 14 00196 g002
Figure 3. The 850 hPa geopotential height contour at every 10 gpm interval (solid) and wind in vectors (m/s) at 12Z and 00Z for 4–8 April 2007.
Atmosphere 14 00196 g003
Figure 4. The 700 hPa geopotential height contour at every 20 gpm interval (blue solid) and isotherms (red dashed) every 3 °C at 12Z and 00Z for 4–8 April 2007.
Atmosphere 14 00196 g004
Figure 5. MSG SEVIRI-derived false color images over North Africa showing dust (pink/purple), clouds (brown/orange), and differences in surface emissivity retrieved in absence of dust or clouds (light blue/blue) on (a) 00Z06 April 2007, (b) 12Z06 April 2007, (c) 15Z06 April 2007, (d) 00Z07 April 2007, and (e) 12Z07 April 2007. (https://meteologix.com/eg/satellite/africa-northeast/satellite-dust-15min/20070406-1000z.html; accessed on 14 November 2022).
Atmosphere 14 00196 g005
Figure 6. Relative vorticity at 850 hPa contours every 2 × 10⁻⁴ s−1. Solid lines denote positive values, and dashed lines denote negative values. The red-filled circle indicates the maximum absolute vorticity advection at 12Z and 00Z for 4–8 April 2007. (Unit: 10−9 s−2 for maximum absolute vorticity advection).
Atmosphere 14 00196 g006
Figure 7. The 925 hPa geopotential height with 10 gpm contour intervals (solid lines) and temperature advection (shaded areas) at 12Z and 00Z for 4–8 April 2007.
Atmosphere 14 00196 g007
Figure 8. The 850 hPa Q vector ω fields have units of 10−2 Pa/s. Solid (dashed) contours represent subsidence (rising motion) at 12Z and 00Z for 4–8 April 2007.
Atmosphere 14 00196 g008
Figure 9. The 925 hPa geopotential height with 10 gpm contour intervals (solid lines) and isotachs of isallobaric wind (shaded areas) ≥ 4 m/s, every 1 m/s (dashed lines), at 12Z and 00Z for 4–8 April 2007.
Atmosphere 14 00196 g009
Figure 10. Divergent component of wind (m/s) (black arrow) at 1000 hPa. The shaded areas are the divergent (source) and convergent (sink) for 12Z and 00Z for 4–8 April 2007. (Unit: 10−3 × s−1 for divergent or convergent).
Atmosphere 14 00196 g010
Figure 11. Same as Figure 10 but at 700 hPa.
Atmosphere 14 00196 g011
Figure 12. The meridional temperature gradient at 850 hPa that ≥1.5 °C/km at 12Z and 00Z for 4–8 April 2007.
Atmosphere 14 00196 g012
Figure 13. Frontogenesis regions (colored regions) at 850 hPa that ≥4 × 10⁻⁹ at 12Z and 00Z for 4–8 April 2007.
Atmosphere 14 00196 g013
Figure 14. Horizontal distribution of dust aerosol optical depth at 550 nm (colored regions) and divergent components of wind (m/s) (black arrow) at 1000 hPa for 12Z and 00Z from 4 to 8 April 2007.
Atmosphere 14 00196 g014
Figure 15. Schematic diagram for dust storm associated with desert cyclone.
Atmosphere 14 00196 g015
Disclaimer/Publisher’s Note: The statements, opinions and data contained in all publications are solely those of the individual author(s) and contributor(s) and not of MDPI and/or the editor(s). MDPI and/or the editor(s) disclaim responsibility for any injury to people or property resulting from any ideas, methods, instructions or products referred to in the content.

