Abstract
The tropical cyclone (TC) Rammasun (1409) successively caused three extreme rainstorms centered in Hepu, Fangcheng, and Lingshan in Guangxi. In this study, a set of datasets, including the China Meteorological Administration (CMA) TC best-track data, rain gauge stations, radar products, and the latest ERA5 reanalysis, were used to investigate the spatial–temporal characteristics and causes of the three rainstorms. Overall, there are apparent discrepancies among them regarding the triggering and maintenance mechanisms. Prior to its landfall in Guangxi, the rainstorm surge (hourly precipitation 136.9 mm) around Hepu was triggered by the approaching low-level jet and northward intrusion of convective instability in the context of abundant vapor supply and vigorous convection. At the weakening stage, Rammasun gradually crossed over the Shiwan Mountains, with a strong convection zone in the western eyewall moving to Fangcheng, which enhanced the precipitation there under the help of topographic uplift. The friction effect slowed down the TC, and contributed to accumulation of the precipitation, which, however, was somewhat suppressed (hourly precipitation less than 50 mm) by the low-level stratification. In the decaying stage, the Lingshan rainstorm was triggered under the combined efforts of the high-level divergence due to the expansion of the South Asian high and the surface convergence between the southeasterly and southerly winds, accompanied by the westward expansion of the high-energy zone. Finally, the corresponding conceptual models for the three rainstorms are summarized and should provide important implications to both research and forecasting for TC-related heavy precipitation.
1. Introduction
Tropical cyclones (TCs) are often accompanied by strong winds, heavy rains, and storm surges, which could cause serious casualties and property losses especially over the coastal region, and thus have become the focus of disaster prevention and mitigation for the government. In particular, a TC-related rainstorm is destructive and can cause severe damage via secondary disasters (e.g., floods). However, it is difficult to be accurately predicted due to complex multiscale interactions and non-linear dynamics, and have long been a research hotspot [1,2].
When typhoon makes landfall, the spatio-temporal distributions of heavy precipitation are determined by the joint efforts of many factors. Despite the weakening due to surface friction and reduced vapor supply, a favorable environmental condition (e.g., high-level outflow and moderate vertical wind shear) is advantageous to the occurrence and persistence of a heavy rain event [3,4,5]. Typically, a low-level jet (LLJ) could establish a vapor transport channel between a TC and monsoon system (e.g., southwest monsoon), which is conductive to the maintenance of TC circulation and the formation of torrential rainfall [6,7]. Meanwhile, the LLJ-induced low-level convergence could also play an important role in the development of the mesoscale convective systems [8], which are normally characterized by extreme precipitation. Additionally, the influence of terrain on precipitation especially over the mountainous region has been identified by numerous studies [9,10,11,12]. The rapid change in surface characteristics and terrain heights largely facilitate the occurrence or amplification of the precipitation. In addition to the aforementioned factors, rainfall reinforcement is also closely associated with the extra energy supplement, mainly including baroclinic energy and latent heat [13,14]. In particular, the former is related to the intrusion of cold air above the lower layers, while the latter is due to moisture transport, which is mainly attributed to LLJ embedded in the monsoonal surge [15].
The construction of the conceptual model is helpful in improving the understanding and prediction skill for the TC-related rainstorms. On the basis of a large scale, Tang and Hu [16] and Chen et al. [17] analyzed the multiple amplification and non-amplification TC rainstorms over distinct regions and summarized the corresponding conceptual models for the amplification zone and triggering condition for the rainstorms. Jiang et al. [11] statistically analyzed the large-scale characteristics of typhoon extreme rainstorms affecting Hainan during 1969–2014 and found that TCs characterized by stronger intensity and slower westward movement are advantageous to the occurrence of rainstorms in the context of a weaker northwest Pacific subtropical high. On a convective scale, Tang et al. [18] found that the rainband of TC Hagupit (0818) presented different horizontal and vertical structures in comparison with the proposed conceptual models. However, its outer rainbands showed similarities to squalls, which is related to the low-level anticyclonic vertical shear and strong convective instability. Moreover, Wang et al. [19] established a conceptual model of the principal rainband structure for TC Matmo (1410). It revealed that the warm rain process (i.e., conversion, accretion, and coalescence) after landfall and the melting of graupel particles in the ascending zone are two main factors contributing to the local heavy rainfall.
Since the South China Sea (SCS) is semi-enclosed, there is a high possibility that the TCs occurring in the SCS could hit and cause severe damages to South China. Particularly, TC landfall in South China appears to have become stronger, and the annual maximum landfall shows an increase since 2012 [20]. TCs Vicente (1208) and Hato (1713) experienced rare rapid intensification over the SCS prior to landfall, and thus made landfall at high intensity, which caused widespread severe damage and economic losses in Hong Kong, Macau, and Guangdong. Additionally, TC Mangkhut (1822) hit South China with a quite large radius of gale-force winds. More importantly, Rammasun (1409) was the strongest TC landing on the China mainland on meteorological record. It caused the death of at least 73 persons and economic losses of more than CNY 44 billion [21]. Zheng et al. [22] identified that the heavy rainfall in northern Hainan, characterized by non-convective activities and high efficiency, resulted from eyewall echoes, while the precipitation in the western part should be classified into the convective rainfall caused by the “train effect” of the peripheral spiral rain bands. Jiang et al. [23] demonstrated that the Rammasun precipitation over Hainan presented an obvious asymmetry, with the strong precipitation mainly distributed on the left (or front) flank of the southwest environmental shear. Lu et al. [24] and Gao et al. [25] focused on the large-scale conditions only and found that abundant vapor transport and strong ascending motion due to convergence were responsible for the heavy rain in Guangxi.
Note that Rammasun caused four rainstorm centers over South China (Figure 1), including one (i.e., Changjiang) in Hainan and three (i.e., Hepu, Fangcheng, and Lingshan) in Guangxi. In spite of much attention from previous work, there still remained some issues to be elucidated. Firstly, previous studies mainly focus on the TC intensification [26] and its induced rainfall in Hainan, while the inland extreme precipitation only gained little attention, which was the primary motivation for this study. In fact, both objective numerical and subjective manual forecasts largely underestimated the intensity of the Hepu and Fangcheng rainstorms, and even omitted the Lingshan rainstorm. Secondly, the major differences among these three rainstorms or between them and that occurred in Hainan are yet to be elucidated. The demand has thus risen for an in-depth analysis of these distinct events, which should provide important implications for improving forecasting skills. Thirdly, the numerical forecasts for heavy precipitation should be subject to manual correction, in which the concept models with distinct regional characteristics should play an important role [27]. Therefore, there is a high necessity to propose conceptual models to conclude the triggering and maintenance mechanisms under the affecting large-scale circulations for the rainstorms individually.
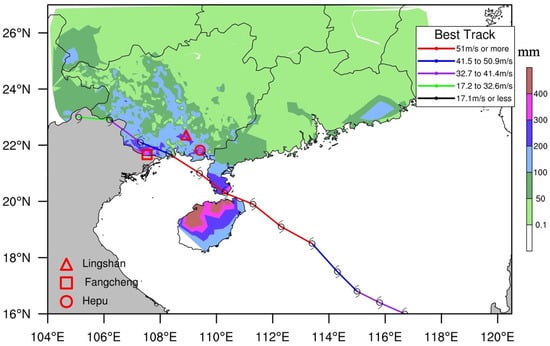
Figure 1.
The accumulated precipitation (mm) from 20BST 17th to 20BST 20th July and the track and intensity changes of Rammasun, with the red markers denoting centers of three Guangxi rainstorms defined in Section 3.
In summary, this study explores spatio-temporal variations and a cause analysis of three rainstorm centers in Guangxi caused by TC Rammasun mainly from multiple perspectives, and then summarizes the corresponding conceptual models. The remaining sections are organized as follows. Section 2 describes the data and methodology used in this study. Section 3 presents an overview of the three rainstorms, followed by the analysis of the favorable large-scale atmospheric environments in Section 4. Section 5 presents the cause analysis in detail. Section 6 summarizes the corresponding conceptual models as a conclusion.
2. Data and Methodology
2.1. Data
The data used in this study are listed as follows: (1) hourly precipitation measurements from 2685 stations in South China (including Guangdong, Guangxi, and Hainan Provinces) provided by the Meteorological Information Center of China Meteorological Administration (CMA); (2) the latest ERA5 hourly reanalysis [28], including wind, humidity, geopotential height, and temperature on pressure levels, as well as 10 m wind and static terrain height, at a spatial resolution of 0.25° × 0.25°, downloaded from the European Centre for Medium-Range Weather Forecasts (ECMWF) (https://cds.climate.copernicus.eu/cdsapp#!/dataset/, accessed on 2 February 2022); (3) the best-track dataset of tropical cyclones [29], including 6-hour track and intensity analysis, downloaded from Shanghai Typhoon Institute of CMA (https://tcdata.typhoon.org.cn/zjljsjj_zlhq.html, accessed on 2 February 2022); (4) Doppler weather radar products from Nanning and Beihai sites.
2.2. Orographic Precipitation Equation
The orographic precipitation equation was employed in this study to quantitively measure the terrain effects on the precipitation. It was first proposed by Smith [30] with subsequent improvements from Xu et al. [31]. The specific formulas are described as follows.
Assuming that the decrease in density of the saturated water vapor (kg s−1) for a reference volume () is caused by adiabatic lifting, and the condensation rate of at a certain height z (m) is
where , is the saturated mixing ratio (%), is the air density (kg s−1), and is the intensity of the orographic uplift (m s−1), then the corresponding ground precipitation rate R (kg m−2 s−1), assuming no downstream shift) is formulated as
To represent the uplift motion due to topographic effect, the orographic forcing vertical motion w (m s−1) at location (x, y, z) at time t can be considered as the dot product between horizontal wind vector Vh and gradient of the terrain height , that is
where u and v are the zonal and meridional flows (m s−1), and is the static terrain height (m).
Following the study from Xu et al. [31], we adopted the height of relative humidity reaching 90% () as the upper bound of the saturated layer (i.e., the upper bound of the integral). This is mainly due to that the spiral structure of the typhoon is obvious and the saturation cannot be guaranteed everywhere at a certain height. Generally, the saturated wet layer is thicker in the eyewall and spiral rain belts. As a result, is used to reasonably represent the distribution differences for thickness of the saturated wet layer within the TC circulation. Consequently, the orographic precipitation rate R becomes
Accordingly, the ERA5 reanalysis was used to perform the above diagnostic analysis in this study. Note that the terrain height H is also the static filed from ERA5, which has the same horizontal grid as the fields on pressure levels. Moreover, when the calculated is less than the terrain height H, it is assumed that the orographic precipitation may not happen.
3. Overview of the Guangxi Rainstorms
Figure 2 presents the geographic distribution of 6-hour precipitation in South China from 20BST 18th to 20BST 19th July in 2014. When Rammasun struck the Leizhou Peninsula as a super typhoon (Figure 2a), it brought about severe land rainfall mainly distributed over the Leizhou Peninsula and most of Hainan, with the maximum precipitation reaching 363.3 mm (Changjiang station) on the southwest of its moving path. When entering the Beibu Gulf (Figure 2b), Rammasun still maintained its strength as a super typhoon. Correspondingly, the rainband was mainly located on the east, north, and southwest sides of the typhoon, with the maximum shifting to Hepu station (282.7 mm). Then, it made landfall in Guangxi as a severe typhoon (Figure 2c), and caused heavy rainfall on the northwest side of its center, with the maximum located at Fangcheng station (232.9 mm). Eventually, the TC proceeded into the decay stage (Figure 2d) due to the reduced energy and surface friction during the continued northwest movement. Meanwhile, the maximum precipitation moved to Lingshan station (228.6 mm) within the east peripheral rainband. In particular, the aforementioned three stations in Guangxi were identical to the three rainstorm centers successively caused by the TC (Figure 1). Consequently, this study selected these three stations as the representatives of the corresponding rainstorms.
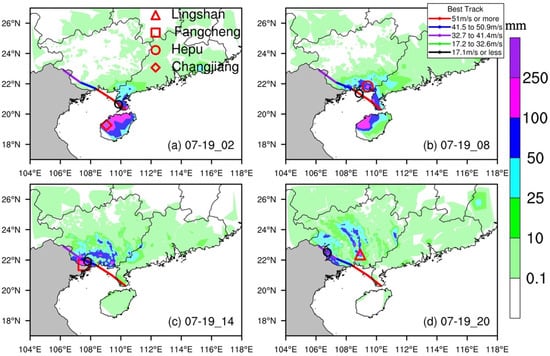
Figure 2.
The geographic distribution of observed 6-hour precipitation and track and intensity changes of Rammasun from 20BST 18th to 20BST 19th July (a–d), with the red markers denoting location of maximum precipitation of the corresponding accumulated period (shown as the end time).
These three centers showed obvious differences with regard to the rainfall period and intensity (Figure 3). Specifically, Hepu exhibited intense precipitation during 05-08BST, with the hourly peak up to 136.9 mm at 07BST. The precipitation became relatively moderate at Fangcheng while concentrated during 08-12BST, with the maximum hourly precipitation up to 45.9 mm. In the case of Lingshan, the precipitation enhancement emerged at 16BST and peaked at 17BST, with the hourly maximum reaching 81.3 mm. Totally, Hepu presented the highest cumulative precipitation up to 581.8 mm, followed by Fangcheng (319 mm) and Lingshan (318 mm) on 19th July.
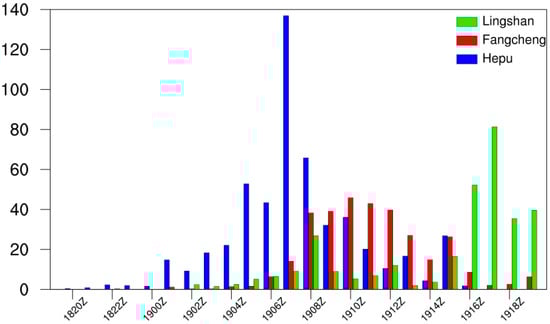
Figure 3.
The variations in hourly precipitation at three rainstorm centers (i.e., Hepu, Fangcheng, and Lingshan) from 20BST 18th to 20BST 19th July.
4. Synoptic Situation
Previous studies [22,23] have pointed out the synoptic systems that affect the strength of Rammasun, including the South Asia high (SAH), Western Pacific subtropical high (WPSH), and LLJ. In the case of Hainan, the heavy rainfall caused by Rammasun was closely related to the stronger SAH in the upper troposphere and weaker WPSH in the middle troposphere, as well as the stronger LLJ [23]. Accordingly, this section focuses on analyzing the large-scale environments that are favorable to the three rainstorms in Guangxi.
Prior to the Hepu rainstorm (02BST on the 19th, Figure 4a), the SAH dominated at 200 hPa. Its main body was strong, with the 1250 dagpm contour covering the whole of Guangdong, and TC Rammasun was just located in the southeast of the SAH, where it was charactered by obvious high-level outflow (i.e., divergence). The divergence anomaly enhances ascending motion due to Ekman pumping, which is conductive to the formation of heavy precipitation. Meanwhile, Rammasun was characterized by vigorous vertical movement extending up to 200 hPa. Under such circumstances, the SAH over southern Guangxi shrank northwards, and thus located Hepu in the northeast corner of the 1250 dagpm line, which contributed to the convection development. Concurrently, WPSH presented an obvious eastward retreat, with the 588 dagpm line shrinking to the east of Guangdong and the 590 dagpm line centering on the coast of Zhejiang. Meanwhile, the TC was located on its west side. Additionally, two separate low-level vapor channels from the South China Sea and the Bay of Bengal continuously transported the vapor into the TC, which prepared an advantageous moisture prerequisite for the occurrence of heavy rain. The above configuration between different levels was similar to that during the Hainan rainstorm [23].
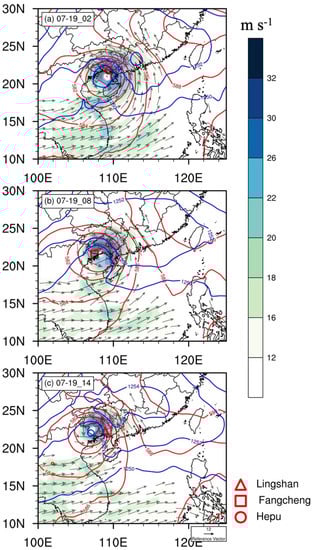
Figure 4.
The geographic distributions of 850 hPa wind (shadings and vectors, shown exceeding 12 m s−1), overlaid with 500 hPa (red lines) and 200 hPa (blue lines) geopotential heights (dagpm) from ERA5 at (a) 02BST, (b) 08BST, and (c) 14BST on 19th July, with the red markers denoting three rainstorm centers.
At 08BST (Figure 4b), Rammasun gradually weakened after making landfall on Fangchenggang with no obvious variations in SAH. However, due to the westward movement and progressive decay of the typhoon after landfall, the WPSH became reinforced with a westward extension. While the 588 dagpm line stretched and almost covered the eastern part of Guangdong, the low-pressure circulation (580 dagpm) maintained and gradually became close to Fangcheng, which was conducive to the convection reinforcement. On the other hand, the 850 hPa vapor transport channel together with the southwest monsoon became weakened to a certain degree. However, the overall maintenance of the southwest jet was still eligible for the moisture transport, with the vapor flux magnitude over 30 g kg−1 s.
As the typhoon continued to move northwestward over land (Figure 4c), it experienced a rapid weakening process with a shrinking coverage of low-pressure circulation. In contrast, the SAH became strengthened and expanded southwards, with the center (i.e., 1254 dagpm) extending to eastern Guangxi, accompanied by a southward movement of the 1252 dagpm line. Meanwhile, the Lingshan rainstorm was located at the back of the low-pressure circulation, where an obvious high-level divergence emerged and contributed to the convection development. Concurrently, the WPSH extended westwards in conjunction with the decreased intensity of low-level southerly wind. However, the re-establishment of the southwest monsoon strengthened the southwest jet. It helped to sustain the vapor transport to the TC, which satisfies the requirements for the occurrence of heavy rain.
5. Cause Analysis
The previous section analyzed the large-scale environments in favor of the occurrence and development of these rainstorms. The subsequent analysis performs the cause analysis for the three rainstorms.
5.1. Low-Level Convergence
A TC rainstorm is commonly closely related to a LLJ [8,32], which can transport water vapor and accumulate the convective instability energy via heating and humidifying the lower troposphere, both of which contribute to the occurrence and maintenance of the heavy rain. Prior to landfall (Figure 5a), there was a strong southerly jet on the east side of the TC, with the maximum magnitude exceeding 36 m s−1. Coincidently, the Hepu station was located in the northeast quadrant of the TC’s center. As the TC moved northwest, the front of the jet core was approaching, and formed an obvious convergence over Hepu (Figure 5b).
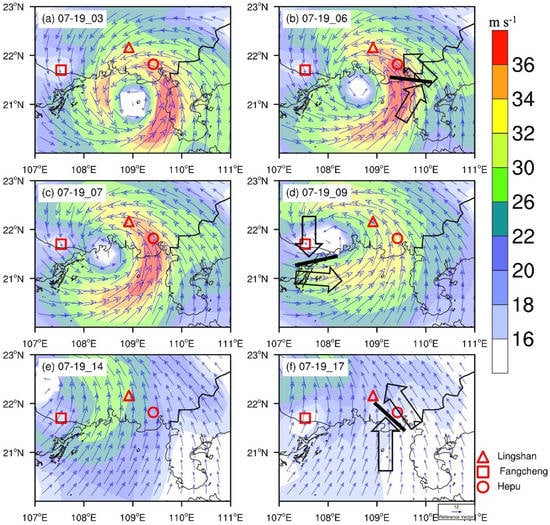
Figure 5.
The geographic distributions of the 925 hPa wind (vectors and shadings, 16 m s−1) and divergence (contours, 10−5 s−1) from ERA5 at onset and peak for Hepu (a,b), Fangcheng (c,d), and Lingshan (e,f) rainstorms, with the red markers and black lines denoting the rainstorm centers and convergence lines.
After the landfall, TC Rammasun headed northwest to the Shiwan Mountain region, which substantially weakened its intensity and slowed down its movement. The LLJ was still located on the east side of the TC, but with a much-decreased intensity (Figure 5c,d), leading to the decline in its related precipitation at Hepu. Meanwhile, across the Shiwan Mountain, there was an obvious convergence between the northwesterly and westerly winds on the west side of the TC’s center, which peaked at 10BST (Figure 5d).
The intensity of Rammasun declined obviously when crossing the Shiwan Mountains. At 14BST, the southerly wind prevailed around Lingshan (Figure 5e), while there was an abrupt change to the southeasterly wind on its east side at 17BST (Figure 5f), forming a convergence zone there. It was further intensified due to the wind speed differences between land and sea and triggered the occurrence of precipitation.
5.2. Radar-Observed Characteristics
According to the radar products (Figure 6a), the strong mesoscale convective system (MCS) was just above Hepu, leading to the precipitation surge. Afterwards, a series of small-to-medium convective systems embedded in the spiral rainband continuously passed through (i.e., train effect), and maintained the heavy rainfall for a period of time. Notably, the echo was not strong (≤35 dBz) at the initial time (not shown), and progressively intensified. At 06:44BST (Figure 6d), the strong convection (≥45 dBz) was at a height of over 7 km and a width of around 15 km, with the maximum exceeding 50 dBZ.
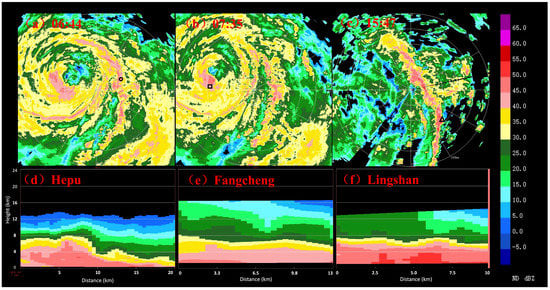
Figure 6.
The horizontal distributions (at 1.5° elevation) and cross sections of radar reflectivity (dBZ) from Doppler weather radar at the peak of three rainstorms centered at (a,d) Hepu, (b,e) Fangcheng, and (c,f) Lingshan.
Subsequently, the strong echo zone on the west of the TC’s center gradually moved to Fangcheng (Figure 6b) and increased the precipitation there. Due to the surface friction, the intensity of the TC rainband weakened, with the peak of the near-surface echo just greater than 45 dBZ. The topographic uplift helped the strong convection (40–45 dBZ) extend up to a height of 4 km.
In the case of the Lingshan rainstorm, an MCS was located just above Lingshan (Figure 6c), followed by a succession of approaching convective cells, which resulted in the formation of a rainstorm. In addition, the echo maximum could reach 50 dBZ, but at a height less than 4 km, indicating a representative heavy precipitation process of insufficient convective motion, agreeing well with the aforementioned analysis.
5.3. Vertical Motion and Thermal Condition
Figure 7 presents the time–pressure cross sections of divergence and vertical velocity, as well as the pseudo-equivalent potential temperature and its vertical gradient, averaged over the three rainstorm regions. Note that the equivalent potential temperature , which combines the air temperature and humidity, is a more comprehensive metric [33]. Moreover, a number of studies use its gradient to quantitatively measure the instability of the air mass [34]. Under the influence of the jet stream, the strong 850 hPa convergence over Hepu emerged after 00BST on the 19th. As the jet core approached, the convergence gradually enhanced with the peak at 0.8 × 10⁻⁵ s−1 during 06-08 BST. Meanwhile, the upward motion was also obvious, and exceeded −13 Pa s−1 at 08 BST in the lower troposphere, with the center around the 850 hPa level. In the case of thermal conditions (Figure 7b), the high-energy zone of (greater than 340K) stretched from the ground to the 500 hPa level, indicating the vigorousness of the warm and moist flow. After 00BST on the 19th, the whole lower atmosphere presented an apparent unstable state (i.e., a positive vertical gradient of ), and peaked during 06-07 BST, agreeing well with period of the most intense precipitation (Figure 3). Particularly, the low-level convergence enhanced the upward motion up to −18 Pa s−1 and triggered the release of the unstable energy, and then jointly stimulated the precipitation surge, with the hourly maximum of 136.9 mm at 07BST. Subsequently, due to the consumption of unstable energy, together with the convergence decrease due to the departure and weakening of the jet, the precipitation declined.
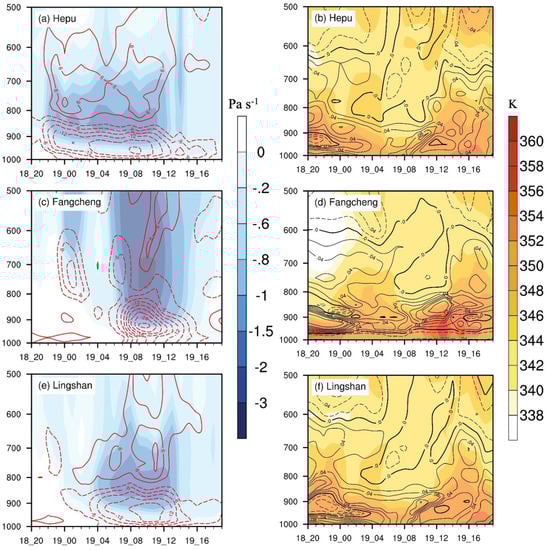
Figure 7.
Left panels (a,c,e): the time–pressure cross sections of the area-averaged (1° × 1°) vertical velocity (shadings, Pa s−1) overlaid with divergence (contours, 10−5 s−1) from ERA5 for three rainstorms centered at Hepu, Fangcheng, and Lingshan. Right panels (b,d,f): the same except for equivalent potential temperature (shadings, K) overlaid with its corresponding gradient (contours, K Pa−1).
Prior to landfall, the low-level divergence and downward motion dominated over Fangcheng, which was located on the west side of the TC. After the landfall, the TC continued to move northwestward, with the west-side strong convection zone shifting to the vicinity of Fangcheng during 08-12BST. Consequently, the low-level convergence zone was replaced, and extended to over 850 hPa due to the uplift of the Shiwan Mountains, as well as the upward motion, which could stretch to around 700 hPa level with a maximum of −27 Pa s−1 at the 900 hPa level. In the context of the high energy, the existence of stable stratification below 950hPa (, Figure 7d) somewhat restrained local development of the convection, leading to the hourly precipitation being less than 50 mm throughout.
The low-level convergence emerged around Lingshan at 02BST (Figure 7e). Then, it gradually intensified, and reached a maximum at 10BST, followed by a progressive decrease in a consistent state of convergence. Additionally, the whole lower atmosphere (below 800 hPa) was characterized by an obvious upward motion. However, due to the weakening of the southwest monsoon and its associated vapor transport, the precipitation around Lingshan did not present a significant increase during 10-11BST. Note that the following precipitation enhancement was attributed to the increased vapor supply from the Bay of Bengal again. Meanwhile, the upper atmosphere over Lingshan was relatively unstable () after 04 BST (Figure 7f). The convective instability energy peaked at 07 BST and then rapidly decreased. Correspondingly, the Lingshan precipitation experienced a slight increase at 08BST and then decreased. The unstable energy increased at 15BST again and then released in the condition of low-level convergence, promoting the convection enhancement. Accordingly, the precipitation increased with the hourly maximum occurring at 17BST (81.3 mm).
5.4. Discussion of Orographic Precipitation
A number of studies have emphasized the effects of topography on rainfall reinforcement [35,36,37,38]. More relevantly, the stronger precipitation in Hainan was also identified on the windward slopes of the Wuzhi Mountains during the Rammasun case.
To verify the topographic effect on the Fangcheng rainstorm, the orographic precipitation equation [31] was also employed in this study. Overall, it could reasonably reproduce the temporal and spatial variations in the precipitation related to topographic effects in spite of some inaccuracies (Figure 8). Prior to the landfall (Figure 8a,b), the moderate divergence of the TC outer circulation triggered the orographic precipitation (at a rate of up to 7.8 mm/h) over the mountain region, which was also denoted from the observations (Figure 2b). On the other hand, the terrain effect was limited over Hepu, which was characterized by flat terrain despite an obvious convergence. When the main body of the TC encountered the Shiwan Mountains (Figure 8c), the diagnostic equation (Figure 8d) could realistically reproduce the precipitation enhancement over the mountain region, but mainly distributed over the wind slope, reflecting some spatial deviations. As the TC gradually moved northwestward and weakened, the previous orographic precipitation was superseded by that in the north (Figure 2d), while the precipitation over flat terrain (i.e., Lingshan) was almost unaffected by the terrain, both of which were also faithfully diagnosed (Figure 8f).
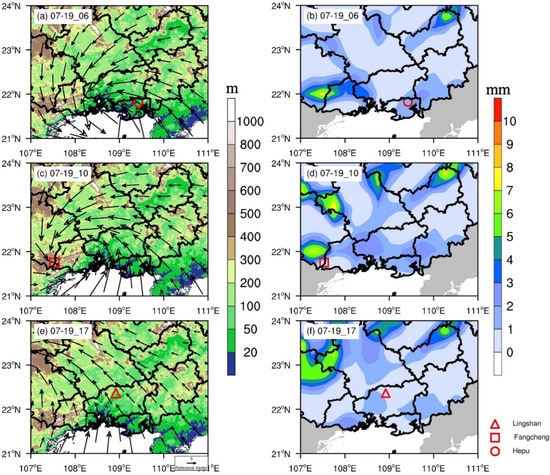
Figure 8.
Left panels (a,c,e): the geographic distributions of terrain heights (shadings, m) overlaid with 10 m wind (vectors, m s−1) at the peak for Hepu, Fangcheng, and Lingshan rainstorms with the red markers denoting the rainstorm centers. Right panels (b,d,f): the corresponding diagnosed hourly orographic precipitation (mm) using ERA5.
It should be noted that the deviations of the diagnosed orographic precipitation (in particular for the spatial consistency) are mainly attributed to the following: Firstly, the latest ERA5 reanalysis was considered to be the best proxy for the observations, but there were still some uncertainties as well as the limitation of the relatively coarse resolution (0.25°). Secondly, the orographic precipitation could be divided into three categories [39], however, only the windward-slope precipitation in a stable atmosphere was considered in the diagnostic equation. Thirdly, while climbing over mountains, the precipitation particles should experience an obvious advection, which was revealed in a range of 5–25 km by some studies [40] but was also not accounted for in this study. A subsequent study could remove the topography in the sensitivity numerical experiments to quantitatively measure the terrain effect during this period.
6. Conceptual Model and Conclusions
The super typhoon Rammasun successively caused three characteristic rainstorms centered at Hepu, Fangcheng, and Lingshan stations in Guangxi. This study explores the distinct spatio-temporal characteristics and causes of these three rainstorms. Overall, there are apparent discrepancies among them regarding the triggering and maintenance mechanisms under favorable large-scale circulations, which are summarized using the proposed conceptual models (Figure 9) as follows:
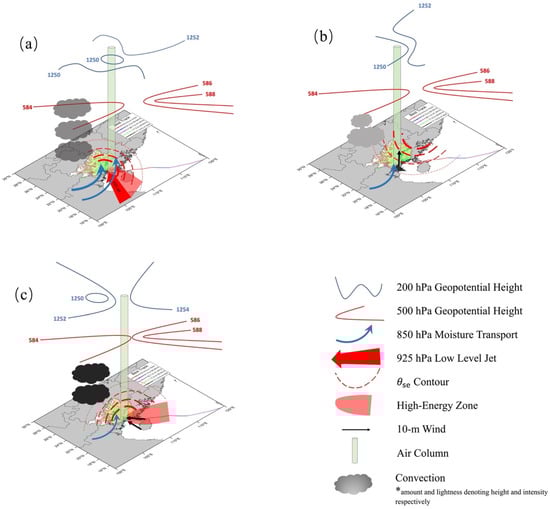
Figure 9.
Schematics of conceptual models for (a) Hepu, (b) Fangcheng, and (c) Lingshan rainstorms caused by TC Rammasun.
(1) Prior to the landfall, the intensity of Rammasun was pretty strong, with the vigorous convection extending up to 200 hPa. Under this circumstance, the Hepu rainstorm zone was located on the northeast side of the TC’s center, which was conducive to the convection development. Concurrently, two separate vapor channels continuously transported the vapor into Guangxi via the low-level southwest and southerly jets, respectively. As the LLJ approached, the occurrence of the wind convergence of both magnitude and direction, in the context of the abundant convective instability energy at a low level, contributed to the precipitation surge centered at Hepu.
(2) After making landfall in Guangxi, the TC’s intensity experienced a continuous decline, while the 200 hPa low-pressure structure and the closed 580 dagpm line still persisted. The Fangcheng rainstorm zone was situated on the west side of the TC’s center, where the large-scale environments remained favorable, and the vapor flux magnitude reached more than 30 g kg−1 s despite a slight weakening of the LLJ. In this situation, the topographic uplift as Rammasun climbed over the Shiwan Mountains resulted in the enhanced precipitation around Fangcheng. Additionally, the slowdown of the TC due to surface friction contributed to the rainfall accumulation, which, however, was somewhat limited due to the relatively stable stratification (), leading to the maximum hourly precipitation less than 50 mm. Moreover, the terrain effect on the Fangcheng rainstorm was further verified using the orographic precipitation equation, which could reasonably reproduce the rainfall reinforcement when the TC crossed the mountains.
(3) After crossing the Shiwan Mountains, the TC continued move northwestward and rapidly weakened. There was a southward expansion of the SAH located Lingshan station between 1252 and 1254 dagpms. Moreover, the upper-level divergence and the low-level vapor transport were still sustained in spite of the further westward extension of the WPSH. In this context, the convergence between the southeasterly and southerly winds, in conjunction with the release of convective instability energy, led to the enhancement of ascending motion and thus triggered the heavy rain centered at Lingshan.
In this study, we proposed three conceptual models (Figure 9) to further illustrate the similarities and differences in the environmental configurations for these three rainstorms. On a large scale, the dominant synoptic systems in general provide favorable conditions for the three rainstorms, and present similar configurations to the heavy rainfall caused by Rammasun over Hainan, which highlights the importance of this study to present the detailed cause analysis for these three rainstorms. The low-level convergence plays an important role in the occurrences of all three rainstorms (Figure 5), with the stronger LLJ and its associated vapor transport over Hepu maximizing the precipitation intensity there (Figure 9a). For the radar-observed characteristics, the Hepu rainstorm is characterized by highest convection of moderate intensity, due to the wind convergence and abundant supply of convective instability energy. Similarly, the dynamic and thermal effects also contribute to the heavy precipitation over Lingshan (Figure 9c) to a substantial extent, despite the decay of the TC after landfall. As a result, the strongest convection intensity was presented under the help of the surface convergence. In the case of the Fangcheng rainstorm (Figure 9b), it presented a smaller intensity in company with weaker convection due to the inferior environmental conditions as compared to others. However, the topographic uplift when climbing over mountains significantly enhanced the intensity and accumulation of the precipitation.
Overall, we believe that the above conceptual models should provide important implications in improving the understanding of the complex mechanisms of the TC-related rainstorms and are meaningful for the subjective correction of the numerical forecasts. However, this study still lacked in-depth analysis, in particular for the complex multiscale interactions and the evolution characteristics for the fine inner structures of the landfall typhoon and associated mesoscale systems. This could be investigated in future study based on the high-resolution and accurate simulation using the numerical weather model (e.g., WRF). Moreover, it is still a great challenge to quantify the relative contributions from the multiple factors due to their complex interactions and non-linear dynamics, in the context of the growth of the complexity of the numerical model which depends on a large number of parameters. On the other hand, the emerging machine learning methods, such as the structural equation model (SEM, [41]), was considered promising to deal with this complicated issue, and could also be explored in future research. Ultimately, the objective forecast is expected to be improved through the efforts in the refinement of the key physical parameterization schemes (e.g., cumulus parameterization).
Author Contributions
Conceptualization, C.Y., Y.L. and Z.X.; methodology, Y.L., Z.X. and L.S.; formal analysis, Y.L., J.H. and W.L.; writing—original draft preparation, Y.L.; writing—review and editing, L.S.; visualization, Y.L. and L.S.; supervision, C.Y. All authors have read and agreed to the published version of the manuscript.
Funding
This research was supported by the National Natural Science Foundation of China (Grants 41665006 and 41465003), the Natural Science Foundation of Guangxi (Grant 007141265020), the Guangxi Key Research & Development Project (Guike AB21196041 and AB22035016), and the Innovation Group of Southern Marine Science and Engineering Guangdong Laboratory (Zhuhai) (Grant 311021001).
Institutional Review Board Statement
Not applicable.
Informed Consent Statement
Not applicable.
Data Availability Statement
The datasets generated during and/or analyzed during the current study are available from the corresponding author upon reasonable request.
Conflicts of Interest
The authors declare no competing interest.
References
- Chen, L.; Meng, Z. An overview on Tropical Cyclone Research Progress in China during the Past Ten Years. Chin. J. Atmos. Sci. 2001, 25, 420–432. (In Chinese) [Google Scholar]
- Cheng, Z.; Chen, L.; Xu, X.; Peng, T. Research Progress on Typhoon Heavy Rainfall in China for Last Ten Years. Meteorol. Mon. 2005, 31, 3–9. (In Chinese) [Google Scholar]
- Sun, W.; Xu, Y. Assimilation of FY-3D MWHS-2 Radiances with WRF Hybrid-3DVAR System for the Forecast of Heavy Rainfall Evolution Associated with Typhoon Ampil. Mon. Weather. Rev. 2021, 149, 1419–1437. [Google Scholar] [CrossRef]
- Cui, Y.; Lü, H.; Shi, D.; Xia, C.; Dong, C. A Comparative Study of the Landfall Precipitation by Tropical Cyclones ARB 01 (2002) and Luban (2018) near the Arabian Peninsula. Remote Sens. 2022, 14, 1194. [Google Scholar] [CrossRef]
- Yan, L.; Zhou, Y.; Liu, X.; Huang, Y.; Wang, Y. Comparative analyses of the heavy rainfall associated with landfalling tropical cy-clones SOULIK (1307) and MARIA (1808) with similar routes. Atmos. Res. 2022, 271, 106124. [Google Scholar] [CrossRef]
- Zhou, Y.; Wu, T. Composite analysis of precipitation intensity and distribution characteristics of western track land-fall typhoons over China under strong and weak monsoon conditions. Atmos. Res. 2019, 225, 131–143. [Google Scholar] [CrossRef]
- Liu, H.; Wang, L.; Dai, Y.; Chen, H. Relationships between the Southwest Monsoon Surge and the Heavy Rainfall Associated with Landfalling Super Typhoon Rammasun. Atmosphere 2022, 13, 130. [Google Scholar] [CrossRef]
- Meng, W.; Wang, Y. A diagnostic study on heavy rainfall induced by landfalling Typhoon Utor (2013) in South China: 2. Postlandfall rainfall. J. Geophys. Res. Atmos. 2016, 121, 12803–12819. [Google Scholar] [CrossRef]
- Fang, X.; Kuo, Y.H.; Wang, A. The impacts of Taiwan topography on the predictability of Typhoon Morakot’s rec-ord-breaking rainfall: A high-resolution ensemble simulation. Weather Forecast. 2011, 26, 613–633. [Google Scholar] [CrossRef]
- DeHart, J.C.; Houze, R.A. Orographic Modification of Precipitation Processes in Hurricane Karl (2010). Mon. Weather Rev. 2017, 145, 4171–4186. [Google Scholar] [CrossRef]
- Jiang, X.; Ren, F.; Li, Y.; Qiu, W.; Ma, Z.; Cai, Q. Characteristics and Preliminary Causes of Tropical Cyclone Extreme Rainfall Events over Hainan Island. Adv. Atmos. Sci. 2018, 35, 580–591. [Google Scholar] [CrossRef]
- Wang, C.-C.; Paul, S.; Huang, S.-Y.; Wang, Y.-W.; Tsuboki, K.; Lee, D.-I.; Lee, J.-S. Typhoon Quantitative Precipitation Forecasts by the 2.5 km CReSS Model in Taiwan: Examples and Role of Topography. Atmosphere 2022, 13, 623. [Google Scholar] [CrossRef]
- Dong, M.; Chen, L.; Li, Y.; Lu, C. Rainfall Reinforcement Associated with Landfalling Tropical Cyclones. J. Atmos. Sci. 2010, 67, 3541–3558. [Google Scholar] [CrossRef]
- Wu, Z.; Huang, Y.; Zhang, Y.; Zhang, L.; Lei, H.; Zheng, H. Precipitation characteristics of typhoon Lekima (2019) at landfall revealed by joint observations from GPM satellite and S-band radar. Atmos. Res. 2021, 260, 105714. [Google Scholar] [CrossRef]
- Zhao, D.; Yu, Y.; Chen, L. Impact of the Monsoonal Surge on Extreme Rainfall of Landfalling Tropical Cyclones. Adv. Atmos. Sci. 2021, 38, 771–784. [Google Scholar] [CrossRef]
- Tang, Z.; Hu, L. Diagnosis of previous conditions for typhoon rainstorm amplification in the north of east China with a conceptual model. J. Nanjing Inst. Meteorol. 1996, 19, 130–134. (In Chinese) [Google Scholar]
- Chen, X.; Yu, Z.; Ye, Z. Analysis of atmospheric circulation characteristics of regional rainstorm reinforcement associ-ated with typhoons making landfall in northern Fujian and southern Zhejiang. Torrential Rain Disasters 2018, 37, 246–256. (In Chinese) [Google Scholar]
- Tang, X.; Lee, W.-C.; Bell, M. A Squall-Line-Like Principal Rainband in Typhoon Hagupit (2008) Observed by Airborne Doppler Radar. J. Atmos. Sci. 2014, 71, 2733–2746. [Google Scholar] [CrossRef]
- Wang, M.; Zhao, K.; Lee, W.-C.; Zhang, F. Microphysical and Kinematic Structure of Convective-Scale Elements in the Inner Rainband of Typhoon Matmo (2014) After Landfall. J. Geophys. Res. Atmos. 2018, 123, 6549–6564. [Google Scholar] [CrossRef]
- Liu, K.S.; Chan, J.C.L. Recent increase in extreme intensity of tropical cyclones making landfall in South China. Clim. Dyn. 2020, 55, 1059–1074. [Google Scholar] [CrossRef]
- Wen, S.; Su, B.; Wang, Y.; Fischer, T.; Li, X.; Yin, Y.; Chao, G.; Wang, R.; Jiang, T. Economic sector loss from influential tropical cyclones and relationship to associated rainfall and wind speed in China. Glob. Planet. Chang. 2018, 169, 224–233. [Google Scholar] [CrossRef]
- Zheng, Y.; Cai, Q.; Cheng, S. Characteristics on intensity and precipitation of super typhoon Rammasun (1409) and reason why it rapidly intensified offshore. Torrential Rain Disasters 2014, 33, 333–341. (In Chinese) [Google Scholar]
- Jiang, X.; Ren, F.; Ma, Z.; Cai, Q. Rainfall characteristic and cause comparison of two track-similar tropical cyclones in 2014. Chin. J. Geophys. 2017, 60, 1305–1320. (In Chinese) [Google Scholar]
- Lu, X.; Wang, L.; Liu, G.; Yao, X. Comparative analysis of moisture and helicity during extraordinary storms caused by two typhoons in different seasons. J. Trop. Meteorol. 2017, 33, 375–385. (In Chinese) [Google Scholar]
- Gao, A.; Li, J.; Chen, J.; Qi, L. Rammasun Intensification in Near Sea and Induced Abnormal Rainstorm in Guangxi. Meteorol. Sci. Technol. 2018, 44, 653–668. (In Chinese) [Google Scholar]
- Xiao, Z.; Yao, C.; Luo, X.; Sun, H. A Comparative Study on the Offshore Intensification of Supertyphoon Rammasun (2014) and Typhoon Rumbia (2013): The Role of Summer Monsoon. Asia-Pacific J. Atmos. Sci. 2021, 57, 405–420. [Google Scholar] [CrossRef]
- Li, Z.; Zhang, L.; Qian, Q.; Ma, S.; Xu, J.; Dai, K.; Chen, Y.; Wang, Y. The development of consideration of typhoon forecast operation of Central Meteoro-logical Center. Trans. Atmos. Sci. 2020, 43, 10–19. (In Chinese) [Google Scholar]
- Hersbach, H.; Bell, B.; Berrisford, P.; Hirahara, S.; Horanyi, A.; Muñoz-Sabater, J.; Nicolas, J.; Peubey, C.; Radu, R.; Schepers, D.; et al. The ERA5 global reanalysis. Q. J. R. Meteorol. Soc. 2020, 146, 1999–2049. [Google Scholar] [CrossRef]
- Ying, M.; Zhang, W.; Yu, H.; Lu, X.; Feng, J.; Fan, Y.; Zhu, Y.; Chen, D. An overview of the China Meteorological Administration tropical cyclone data-base. J. Atmos. Oceanic Technol. 2014, 31, 287–301. [Google Scholar] [CrossRef]
- Smith, R.B. The Influence of Mountains on the Atmosphere. Adv. Geophys. 1979, 21, 87–230. [Google Scholar] [CrossRef]
- Xu, Y.; Qian, H.; Luo, L.; Yu, H. A study of terrain correction method on typhoon precipitation based on ECMWF fore-casts. Acta Meteorol. Sin. 2019, 77, 674–685. (In Chinese) [Google Scholar]
- Dong, M.; Chen, L.; Li, Y.; Lu, C. Research progress on abrupt intensification of heavy rainfall and super heavy rainfall associated with landfalling tropical cyclones. J. Trop. Meteorol. 2009, 25, 495–502. (In Chinese) [Google Scholar]
- Song, F.; Zhang, G.J.; Ramanathan, V.; Leung, L.R. Trends in surface equivalent potential temperature: A more comprehensive metric for global warming and weather extremes. Proc. Natl. Acad. Sci. USA 2022, 119, e2117832119. [Google Scholar] [CrossRef]
- Zeng, Z.; Chen, Y.; Wang, D.H. Observation and Mechanism Analysis for a Record-Breaking Heavy Rainfall Event over Southern China in August 2018. Chin. J. Atmos. Sci. 2020, 44, 695–715. (In Chinese) [Google Scholar]
- Chen, L.; Ding, Y. Introduction to Typhoons in the Western Pacific; Science Press: Beijing, China, 1979. (In Chinese) [Google Scholar]
- Niu, X.; Dong, J.; Du, H. Climatic analysis on typhoon rainfall of east china and affecting factors of the precipitation. J. Appl. Meteorol. Sci. 2005, 16, 402–407. (In Chinese) [Google Scholar]
- Wang, X.; Hu, B. The Effect of Terrain on Landing Typhoon 0604 Bilis. Torrential Rain Disasters 2007, 26, 97–102. (In Chinese) [Google Scholar]
- Lin, X.; Ren, F.; Liu, A.; Huang, Z. Climatic variation features of typhoon precipitation influencing fujian for the past 46 years. J. Trop. Meteorol. 2008, 24, 411–416. (In Chinese) [Google Scholar]
- Chu, C.-M.; Lin, Y.-L. Effects of Orography on the Generation and Propagation of Mesoscale Convective Systems in a Two-Dimensional Conditionally Unstable Flow. J. Atmos. Sci. 2000, 57, 3817–3837. [Google Scholar] [CrossRef]
- Smith, R.B.; Schafer, P.; Kirshbaum, D.; Regina, E. Orographic Enhancement of Precipitation inside Hurricane Dean. J. Hydrometeorol. 2009, 10, 820–831. [Google Scholar] [CrossRef]
- Sun, C.; Liang, X.-Z. Improving US extreme precipitation simulation: Dependence on cumulus parameterization and underlying mechanism. Clim. Dyn. 2020, 55, 1325–1352. [Google Scholar] [CrossRef]


Disclaimer/Publisher’s Note: The statements, opinions and data contained in all publications are solely those of the individual author(s) and contributor(s) and not of MDPI and/or the editor(s). MDPI and/or the editor(s) disclaim responsibility for any injury to people or property resulting from any ideas, methods, instructions or products referred to in the content. |
© 2023 by the authors. Licensee MDPI, Basel, Switzerland. This article is an open access article distributed under the terms and conditions of the Creative Commons Attribution (CC BY) license (https://creativecommons.org/licenses/by/4.0/).