Abstract
Phthalates can be found in personal care products as solvents and plasticizers in various polymers, especially PVC, wall coverings, certain paints, vinyl floor coverings, electronic devices, medical devices, food packages, toys, cables and other products. Humans are ingesting food products that contain phthalates, or they have dermal contact with phthalate-containing material, such as clothes, PVC gloves, personal care products or house dust. In this study, samples of dust from several houses in Kozani city, Greece, were collected and analyzed for phthalate concentration, and the potential association with building characteristics was examined utilizing detailed checklists. Samples were taken from the vacuum cleaner of the houses and extracted with ethyl acetate, and then analyzed with GC-MS in the SIM mode. The levels of phthalate ranged from 10.57 to 221.19 μg/g for Di-iso-butyl phthalate (DiBP), 4.03 to 264.91 μg/g for Di-n-butyl phthalate (DBP), 0.72 to 20.22 μg/g for benzyl-butyl phthalate (BBP) and 62.73 to 1233.54 μg/g for Di- (2-ethylhexyl) phthalate (DEHP), with detection limits of 4.5, 3.3, 11.6 and 13.1 ng/g, respectively. Using the Kruskal–Wallis statistical test, several associations were found between the measured phthalate and occupant activities (duration of ventilation and location of temporary garbage storage) and building characteristics (plastic or synthetic materials inside the houses).
1. Introduction
Modern life forces people to spend an average of about 90% of their time in indoor environments, such as homes, offices, passenger cars, shops, restaurants, etc. []. Dust is ubiquitous, present in all of the above environments, and can be found as air-suspended particles or settled on surfaces. Furthermore, particulates can be inhaled and damage the respiratory system and lungs; dust acts as a sink for indoor chemicals and is an important exposure route to those bounded compounds []. Phthalates, polycyclic aromatic hydrocarbons and other semi-volatile organic compounds have been found among many other pollutants in home dust, making human indoor residential exposure of particular interest [,,,]. Phthalate esters, which are derivatives of phthalic acid esters, are produced and used worldwide regardless of the ban on some substances from certain products imposed by the European Union (2005/84/EC) [,,]. Thus, phthalates are widely and commonly used as plasticizers in order to increase the extensibility and flexibility of industrial products []. Depending on different chemical and physical properties, phthalates can be found as additives in PVC flooring, synthetic leather, wall covering materials, food packaging, toys, adhesives, carpet backing material, lubricants, polishing products, sealants, dyes and shoes, as well as in personal care products such as fragrance fixatives in cosmetics, skin care products, foams and shampoos [,,].
Phthalate esters have been associated with many adverse effects on human health. Specifically, phthalates serve as endocrine disruptors and contribute to reproductive system variations, such as declining sperm quality and sperm DNA damage, premature breast development and alterations to reproductive hormones [,,]. Allergies, asthma and impaired nervous system functions are demonstrated to be affected by phthalate esters [,]. In addition, di-(2-ethylhexyl) phthalate (DEHP) has been classified as belonging to group 2b (possible carcinogen to humans) by the International Agency for Research on Cancer (IARC) []. Many studies also demonstrate the presence of phthalate metabolites in human urine, serum and breast milk due to extensive human exposure to such compounds; additionally, phthalates can be metabolized into more toxic compounds in the human body [,,].
As inferred from the above, human exposure to phthalates from indoor home dust is a significant pathway of hazardous intake. People are mainly exposed to phthalates through inhalation, ingestion and dermal absorption []. The daily intake (DI) of phthalates depends on the age group, i.e., infants, toddlers, children, teenagers and adults; for example, in China, the total DI of phthalate esters through dust ingestion ranges from 186 for adults to 1110 ng/kg-bw/day for toddlers []. Thus, the type of occupant in a house combined with building characteristics together with consumer products and occupant habits are crucial parameters for human exposure to phthalates.
To the best of our knowledge, there are almost no studies on the phthalate concentrations of home dust in Greece. Specifically, for Kozani, a medium-sized city settled in the northern part of Greece, where four power plants and mining activities operate, this is the first survey studying the level of phthalate concentrations in house dust. The notable phthalates mostly found in home dust are di-(2-ethylhexyl) phthalate (DEHP), di-n-butyl phthalate (DBP), benzyl-butyl phthalate (BzBP) and di-iso-butyl Phthalate (DiBP) []. Thus, in this study, 26 home dust samples were collected from an equal number of houses in Kozani city and analyzed for the above-mentioned phthalate ester concentrations. Furthermore, the associations of the phthalate concentrations with the building’s characteristics were examined through statistical analysis. Lastly, the exposure of various age groups was examined using daily intake rates through the route of dust ingestion.
2. Materials and Methods
2.1. Sampling and Analysis
A monitoring campaign took place during the spring of 2017 in the city of Kozani (Figure 1), collecting dust samples from the vacuum cleaners of 26 volunteer households. The researchers requested that the housekeepers collect a sufficient dust sample from the top of the vacuum cleaner bags and pack it in aluminum foil, as reported elsewhere []. The samples were transported back to the laboratory and stored under −18 °C prior to analysis. The samples were cleaned by manually removing large objects (such as hair, small pieces of paper, etc.) and then weighed (about 1 gr) using an analytical balance. The samples were analyzed to estimate the concentration of the following phthalates:
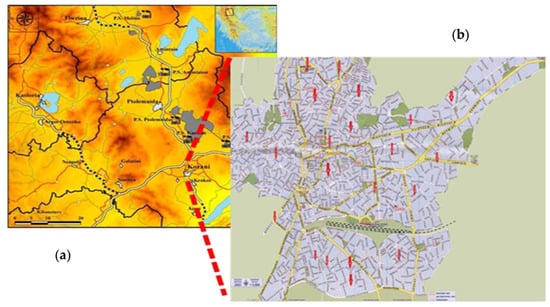
Figure 1.
(a) Location of Kozani city in the wider area of Western Macedonia (grey areas: lignite open mines; black points: power plants (5)). (b) Map of Kozani city with the locations of the 26 participating households (highlighted by red arrows).
- -
- DiBP (Di-iso-butyl Phthalate);
- -
- DBP (Di-n-Butyl Phthalate);
- -
- BBP (Benzyl-butyl Phthalate);
- -
- DEHP (Di-2-ethylhexyl Phthalate).
Many extraction methods for phthalates have been used in the literature with different solvents or a mixture of solvents and instrumentations. In this study, the method described by Abb et al., 2009 [], was applied. In brief, each sample was extracted with 20 mL ethyl acetate for 30 min using an ultrasonic device (SOLTEC-SONICA). Then, the extract was filtered through a Nylon PFTEE 0.45 μm filter, and the filtrate was injected (1 μL) into the gas chromatography unit. An Agilent 6890 gas chromatography equipped with 5975 mass spectrometry was used in the analysis with the following parameters:
- -
- First, 60 °C for 1 min, 30 °C/min until 160 °C;
- -
- Remain at 160 °C for 0.25 min;
- -
- Then, 5 °C/min until 200 °C and remain for 0.25 min;
- -
- 10 °C/min until 290 °C with final time 10 min;
- -
- Mass spectroscopy was operated in the SIM mode.
The target phthalates were purchased from Sigma-Aldrich with a purity of ≥99.7%. The instrument detection limit (LOD) was calculated at three times that of the background noise level (S/N ≥ 3) from the lowest calibration standard. The LODs were 4.5, 3.3, 11.6 and 13.1 ng/g for DiBP, DBP, BBP and DEHP, respectively. Blank samples were injected in GC-MS every 8 samples and subtracted from the results of the samples. The recovery efficiencies monitored by spiking standard solution on the extraction procedure were between 87.6 and 106 ± 4.15%.
2.2. Data Collection
The houses were located throughout the whole city, covering the entire city area (Figure 1b). The house selection was based on three fundamentals: (i) the location of the selected houses should represent the whole area of the city and not only a part of it; in other words, include all of the geographical axes (see Figure 1b). (ii) To include in our study several houses with different outdoor pollution levels (such as those next to busy roads, urban background pollution etc.) and (iii) the volunteer availability. In addition to dust sampling, a detailed checklist was completed in order to correlate building characteristics and occupant behavior with the phthalate concentration found in the dust samples. The checklist was divided into three parts:
- (I)
- The first part contains information related to the house location and the building characteristics (road address, floor number, year of construction, renovating actions, type of heating, type of window frames, flooring, ventilation etc.).
- (II)
- The second part contains information related to the equipment used inside the houses (such as TV sets, personal computers, laptops, plastic toys, plastic curtains in baths, white appliances etc.).
- (III)
- The third part deals with information related to occupant activities and their time fraction (smokers, using personal care products, cleaning products, air fresheners, garbage managing etc.).
2.3. Data Processing Method
A combined database has been produced from the budlings’ checklists and the phthalate measurements. Thus, the characteristics of each building were assigned to their respective indoor concentrations using the building code. The potential correlation between the measured phthalates and the building’s characteristics/home occupants’ behavior was investigated using the Kruskal–Wallis [] analysis of variance test. Furthermore, Pearson correlation was selected to examine the intra-correlation between the measured phthalates. All of the analyses were performed using the Statistical Package for the Social Sciences (SPSS v22).
3. Results and Discussion
3.1. Phthalates in Home Dust
The detailed results of the 26 home dust samples, as well as the average concentration of the four measured phthalate esters, are presented in Table 1. As mentioned before, these four phthalates are mostly present in similar studies conducted worldwide, and the results of this study are consistent with the literature. As shown in Table 1, the most abundant compound of each dust sample and for the overall study was DEHP. The fact that DEHP is contained in large amounts in a wide variety of products and due to its relatively low vapor pressure [] resulted in higher concentrations. Furthermore, the DEHP concentration in settled dust is larger than when in its gas phase []. On the other hand, BBP was the phthalate with the lowest average concentration, as well as in the majority of the collected dust samples (24 out of 26). The latter observation, combined with the large variety of the concentrations of the measured phthalates, as presented in Table 1, shows that there were many differences in the characteristics of the buildings, products used inside and different occupants’ habits (see below). For example, in house #1, the highest concentration of some phthalate esters is possibly due to the plastic toys stored in the house, recorded on the checklist []. The above findings of the concentration trends are consistent with previous studies that have been carried out across the world [,,,] (and references therein).

Table 1.
Phthalate concentration (μg/g) in dust samples from homes in Kozani, Greece.
Table 2 summarizes the phthalate concentrations of home dust reported in previous studies as an indicative list for comparison purposes. The reported values from this study are within the range of values reported worldwide. Looking at Table 2, the values can greatly vary from site to site due to several factors such as the ventilation rate, sampling method, materials used indoors, occupants’ habits, etc.
Table 2.
Phthalate concentration (μg/g) in dust samples from homes reported in previous studies. All values are medians unless stated otherwise.
Table 3 shows the Pearson correlation between four targeted phthalates. DiBP was strongly correlated with DBP (r = 0.87), while DHEP was correlated with DiBP and DBP (r = 0.583 and 0.581, respectively). These results indicated that DHEP, DiBP and DBP may be released from common sources. In addition, the strong correlation between DiBP and DBP can be attributed to the fact that these two compounds are isomers; therefore, these two types of phthalates are likely to be emitted from the same sources []. The above findings are consistent with other studies on phthalate concentrations in home dust [,].
Table 3.
Correlations between the measured phthalates (Pearson test).
3.2. Human Exposure to Phthalates via Dust Ingestion and Dermal Absorption
Humans are exposed to various environmental pollutants through various routes. These routes for human exposure to phthalates can be identified through involuntary ingestion, dermal absorption, inhalation and dietary intake []. As reported, indoor dust is an important source of human exposure, especially for high-molecular-weight phthalate esters []. To estimate the Daily Intake (DI, ng/kg-bw/day) of phthalates via dust ingestion, the following equation was used []:
where Cdust is the mean concentration of each phthalate ester in the dust (μg/g), f1 is the time fraction a person spends indoors a day (indoor exposure factor), f2 is the dust ingestion rate (g/day) and M is body weight (kg). Because of the differences in the body weight and dust ingestion rates of humans, the DI rate is calculated for five age groups: infants (<1 yr), toddlers (1–3 yr), children (4–10 yr), teenagers (11–18 yr) and adults (≥19 yr). The average body weight for each age group was taken as 5, 16, 29, 52 and 65 kg. The estimated DIs of phthalate esters through dust ingestion in Kozani city are illustrated in Figure 2. The total DI of measured phthalates via dust ingestion range from 243 ng/kg-bw/day for adults to 1766 ng/kg-bw/day for toddlers. The estimated daily intake of phthalate esters was higher for toddlers than for the other age groups. This trend is also similar to the findings obtained in the study conducted by Albar et al. []. Toddlers are at high exposure risk due to lower body weights and higher dust intake because of frequent hand-to-mouth activities and intensive contact with dust during crawling. However, due to the small number of samples, it should be pointed out that the daily intake of phthalates is an indication of the likely range for the population in this study area. Compared with other studies, the estimated DIs for DEHP for children in Kozani (443–1605 ng/kg-bw/day) are in good agreement with those in the USA (400–1500 ng/kg-bw/day) [] and slightly higher in the case of Denmark’s (~1000 ng/kg-bw/day) []. The comparison between the DI rate for DEHP and DBP found in this study and the reference dose (RfD) recommended by the United State Environmental Protection Agency (U.S.EPA) (20 μg/kg-bw/day for DEHP and 100 μg/kg-bw/day for DBP [,] reveal that the values are far below the reference levels.
DIdust ingestion = Cdust × f1 × f2/M
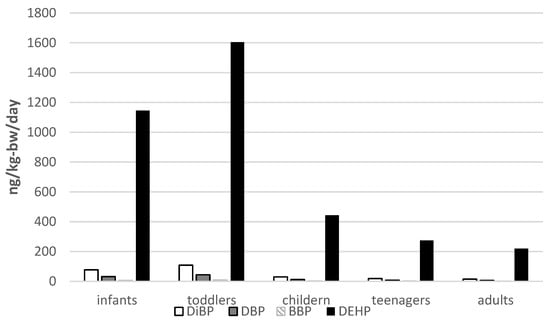
Figure 2.
Daily intake due to dust ingestion of phthalate Eeters from indoor dust (ng/kg-bw/day) among various age groups.
Dermal absorption daily intake index can be calculated with the following equation []:
where Cdust is the phthalate concentration in dust, A is the body surface area (cm2/day), M2 is the dust adhered to the skin (mg/cm2) and f3 is the fraction of phthalate absorbed through the skin. As for dust ingestion, the values for the above fractions were obtained according to the literature []. The DI values for dermal absorption are listed in Table 4. DHEP shows a higher dermal absorption daily index for the five age groups, while the BBP ester has the lowest. This trend is also reported in similar studies conducted in China and the USA []. For the measured phthalate esters, the total DI of dermal absorption ranged from 1.66 ng/kg-bw/day for adults to 0.37 ng/kg-bw/day for infants. These values are slightly higher than those estimated in China (0.2–1.1 ng/kg-bw/day) and the USA. (0.2–1.0 ng/kg-bw/day) []. The total DI of dermal uptake, as shown in Table 4, decreases with age. Compared to DI dust ingestion, the dermal absorption daily index was 100–1000 times lower.
DIdermal uptake= Cdust × A × M2 × f1 × f3/M
Table 4.
Daily intakes of measured phthalate esters from indoor dust (ng/kg-bw/day) for various age groups in Kozani, Greece.
3.3. Building Characteristics and Occupants Behavior
During the home inspections, checklists were collected, and then they were digitally transformed into a suitable SPSS format. Each characteristic was assigned to each phthalate concentration. In the merged database, further statistical analyses were performed using the Kruskal–Wallis test, which revealed significant associations between the building’s characteristics and the concentrations levels of the measured phthalates. The results are reported for a significance level of p-value < 0.05 and marginal significance of p-value < 0.1. The DiBP and BBP concentrations were revealed to be significantly associated with the level of ventilation and the increasing time of opened windows, with p-values of 0.043 and 0.012, respectively. Furthermore, the temporary storage of home garbage indoors was found to be associated with DiBP and BBP concentrations (p-value 0.075 and 0.030, respectively). In the case of DiBP concentrations, the existence of aluminum-based door frames was found to be a significant factor (p-value 0.036), while for BBP, this was related to synthetic door frames (p-value 0.047). This is in line with the findings of Zhang et al. [], where modern window frames were associated with BBP concentration. This might be because phthalates are widely used in plastic–steel window materials and/or because sealants are always used in modern window frames to seal the insulation glass []. The usage of plastic curtains in bathrooms is associated with DEHP (p-value 0.040). Almost all of the phthalate concentrations (except DBP) were related to the existence of MDF furniture (p-values <0.055). Similar findings were revealed in a Japanese study [] and a Chinese study [], where strong correlations were found between laminated wood/wood and phthalates concentration (DiBP and BBP). This is probably due to the large quantities of adhesives added during the manufacturing process of wood products [].
4. Conclusions
Dust samples from 26 homes in Kozani city in Greece were collected from vacuum cleaners and analyzed for four commonly founded phthalate esters. In all samples, the four phthalates were present, with levels ranging from 10.57 to 221.19 μg/g for Di-iso-butyl phthalate (DiBP), 4.03 to 264.91 μg/g for Di-n-butyl phthalate (DBP), 0.72 to 20.22 μg/g for benzyl-butyl phthalate (BBP) and 62.73 to1233.54 μg/g for Di- (2-ethylhexyl) phthalate (DEHP). The concentration of phthalates varied between homes due to the differences in the types of products used in each household but also due to the types of furniture that existed, something that was also apparent in the analysis for correlation with the buildings’ characteristics. Concerning non-nutritional exposure, the values found were far from the suggested RfD levels, and children were at greater risk of exposure to dust-related phthalates than teenagers and adults. The statistical analysis reveals significant associations between phthalate ester concentrations and the duration of ventilation, the type of door frames, the existence of plastic curtains in bathrooms, the indoor location of garbage storage and MDF furniture present in the house.
Author Contributions
E.H.: formal analysis, investigation, M.G.: formal analysis, investigation, I.S.: software, methodology, writing—review and editing, E.T.: conceptualization, formal analysis, writing—original draft preparation, J.B.: supervision. All authors have read and agreed to the published version of the manuscript.
Funding
This research received no external funding.
Institutional Review Board Statement
Not applicable.
Informed Consent Statement
Not applicable.
Data Availability Statement
Data available upon request due to privacy restrictions.
Conflicts of Interest
The authors declare no conflict of interest.
References
- Schweizer, C.; Edwards, R.D.; Bayer-Oglesby, L.; Gauderman, W.J.; Ilacqua, V.; Jantunen, M.J.; Lai, H.K.; Nieuwenhuijsen, M.; Künzli, N. Indoor Time-Microenvironment-Activity Patterns in Seven Regions of Europe. J. Expo. Sci. Environ. Epidemiol. 2007, 17, 170–181. [Google Scholar] [CrossRef]
- Melymuk, L.; Demirtepe, H.; Jílková, S.R. Indoor Dust and Associated Chemical Exposures. Curr. Opin. Environ. Sci. Health 2020, 15, 1–6. [Google Scholar] [CrossRef]
- Butte, W.; Heinzow, B. Pollutants in House Dust as Indicators of Indoor Contamination. Rev. Environ. Contam. Toxicol. 2002, 175, 1–46. [Google Scholar] [PubMed]
- Rudel, R.A.; Camann, D.E.; Spengler, J.D.; Korn, L.R.; Brody, J.G. Phthalates, Alkylphenols, Pesticides, Polybrominated Diphenyl Ethers, and Other Endocrine-Disrupting Compounds in Indoor Air and Dust. Environ. Sci. Technol. 2003, 37, 4543–4553. [Google Scholar] [CrossRef] [PubMed]
- Hwang, H.-M.; Park, E.-K.; Young, T.M.; Hammock, B.D. Occurrence of Endocrine-Disrupting Chemicals in Indoor Dust. Sci. Total Environ. 2008, 404, 26–35. [Google Scholar] [CrossRef]
- European Chemicals Bureau; Institute for Health and Consumer Protection (Joint Research Centre); Toxicology and Chemical Substances; Cosgrove, O.; Pakalin, S.; Aschberger, K. European Union Risk Assessment Report: Bis(2-Ethylhexyl)Phthalate (DEHP); Publications Office of the European Union: Luxembourg, 2008. [Google Scholar]
- Ittershagen, M.; Döpke, A.; Mavromati, F.; Pfeifer, T. Phthalate—Die NützlichenWeichmacher Mit Den Unerwünschten Eigenschaften 2007. Available online: http://www.sv-zwiener.de/fileadmin/user_upload/Phthalate-UBA-2-2007.pdf (accessed on 21 December 2022).
- Directive 2005/84/EC of the European Parliament and of the Council of 14 December 2005 Amending for the 22nd Time Council Directive 76/769/EEC on the Approximation of the Laws, Regulations and Administrative Provisions of the Member States Relating to Restrictions on the Marketing and Use of Certain Dangerous Substances and Preparations (Phthalates in Toys and Childcare Articles); 2005; Volume 344. Available online: https://eur-lex.europa.eu/legal-content/EN/TXT/?uri=celex:32005L0084 (accessed on 21 December 2022).
- Weschler, C.J. Changes in Indoor Pollutants since the 1950s. Atmos. Environ. 2009, 43, 153–169. [Google Scholar] [CrossRef]
- ATSDR. Toxicological Profile ForDi(2-Ethylhexyl)Phthalate (DEHP); ATSDR: Atlanta, GA, USA, 2002. [Google Scholar]
- Schettler, T. Human Exposure to Phthalates via Consumer Products. Int. J. Androl. 2006, 29, 134–139. [Google Scholar] [CrossRef]
- Zhang, Q.; Sun, Y.; Zhang, Q.; Hou, J.; Wang, P.; Kong, X.; Sundell, J. Phthalate Exposure in Chinese Homes and Its Association with Household Consumer Products. Sci. Total Environ. 2020, 719, 136965. [Google Scholar] [CrossRef]
- Rudel, R.A.; Perovich, L.J. Endocrine Disrupting Chemicals in Indoor and Outdoor Air. Atmos. Environ. 2009, 43, 170–181. [Google Scholar] [CrossRef]
- Toft, G.; Jönsson, B.A.G.; Lindh, C.H.; Jensen, T.K.; Hjollund, N.H.; Vested, A.; Bonde, J.P. Association between Pregnancy Loss and Urinary Phthalate Levels around the Time of Conception. Environ. Health Perspect. 2012, 120, 458–463. [Google Scholar] [CrossRef]
- Duty, S.M.; Singh, N.P.; Silva, M.J.; Barr, D.B.; Brock, J.W.; Ryan, L.; Herrick, R.F.; Christiani, D.C.; Hauser, R. The Relationship between Environmental Exposures to Phthalates and DNA Damage in Human Sperm Using the Neutral Comet Assay. Environ. Health Perspect. 2003, 111, 1164–1169. [Google Scholar] [CrossRef]
- Langer, S.; Weschler, C.J.; Fischer, A.; Bekö, G.; Toftum, J.; Clausen, G. Phthalate and PAH Concentrations in Dust Collected from Danish Homes and Daycare Centers. Atmos. Environ. 2010, 44, 2294–2301. [Google Scholar] [CrossRef]
- Stein, T.P.; Schluter, M.D.; Steer, R.A.; Ming, X. Autism and Phthalate Metabolite Glucuronidation. J. Autism. Dev. Disord. 2013, 43, 2677–2685. [Google Scholar] [CrossRef]
- IARC. Overall Evaluations of Carcinogenicity: An Updating of IARC Monographs Volumes 1–42; IARC: Lyon, France, 1987; ISBN 978-92-832-1411-3. [Google Scholar]
- Gao, C.-J.; Liu, L.-Y.; Ma, W.-L.; Ren, N.-Q.; Guo, Y.; Zhu, N.-Z.; Jiang, L.; Li, Y.-F.; Kannan, K. Phthalate Metabolites in Urine of Chinese Young Adults: Concentration, Profile, Exposure and Cumulative Risk Assessment. Sci. Total Environ. 2016, 543, 19–27. [Google Scholar] [CrossRef]
- Högberg, J.; Hanberg, A.; Berglund, M.; Skerfving, S.; Remberger, M.; Calafat, A.M.; Filipsson, A.F.; Jansson, B.; Johansson, N.; Appelgren, M.; et al. Phthalate Diesters and Their Metabolites in Human Breast Milk, Blood or Serum, and Urine as Biomarkers of Exposure in Vulnerable Populations. Environ. Health Perspect. 2008, 116, 334–339. [Google Scholar] [CrossRef]
- Preuss, R.; Koch, H.M.; Angerer, J. Biological Monitoring of the Five Major Metabolites of Di-(2-Ethylhexyl)Phthalate (DEHP) in Human Urine Using Column-Switching Liquid Chromatography-Tandem Mass Spectrometry. J. Chromatogr. B Analyt. Technol. Biomed. Life Sci. 2005, 816, 269–280. [Google Scholar] [CrossRef]
- Bekö, G.; Weschler, C.J.; Langer, S.; Callesen, M.; Toftum, J.; Clausen, G. Children’s Phthalate Intakes and Resultant Cumulative Exposures Estimated from Urine Compared with Estimates from Dust Ingestion, Inhalation and Dermal Absorption in Their Homes and Daycare Centers. PLoS ONE 2013, 8, e62442. [Google Scholar] [CrossRef]
- Guo, Y.; Kannan, K. Comparative Assessment of Human Exposure to Phthalate Esters from House Dust in China and the United States. Environ. Sci. Technol. 2011, 45, 3788–3794. [Google Scholar] [CrossRef]
- Albar, H.M.S.A.; Ali, N.; Shahzad, K.; Ismail, I.M.I.; Rashid, M.I.; Wang, W.; Ali, L.N.; Eqani, S.A.M.A.S. Phthalate Esters in Settled Dust of Different Indoor Microenvironments; Source of Non-Dietary Human Exposure. Microchem. J. 2017, 132, 227–232. [Google Scholar] [CrossRef]
- Abb, M.; Heinrich, T.; Sorkau, E.; Lorenz, W. Phthalates in House Dust. Environ. Int. 2009, 35, 965–970. [Google Scholar] [CrossRef]
- Theodorsson-Norheim, E. Kruskal-Wallis Test: BASIC Computer Program to Perform Nonparametric One-Way Analysis of Variance and Multiple Comparisons on Ranks of Several Independent Samples. Comput. Methods Programs Biomed. 1986, 23, 57–62. [Google Scholar] [CrossRef] [PubMed]
- Weschler, C.J.; Nazaroff, W.W. Semivolatile Organic Compounds in Indoor Environments. Atmos. Environ. 2008, 42, 9018–9040. [Google Scholar] [CrossRef]
- Li, H.-L.; Song, W.-W.; Zhang, Z.-F.; Ma, W.-L.; Gao, C.-J.; Li, J.; Huo, C.-Y.; Mohammed, M.O.A.; Liu, L.-Y.; Kannan, K.; et al. Phthalates in Dormitory and House Dust of Northern Chinese Cities: Occurrence, Human Exposure, and Risk Assessment. Sci. Total Environ. 2016, 565, 496–502. [Google Scholar] [CrossRef] [PubMed]
- Kolarik, B.; Bornehag, C.-G.; Naydenov, K.; Sundell, J.; Stavova, P.; Nielsen, O.F. The Concentrations of Phthalates in Settled Dust in Bulgarian Homes in Relation to Building Characteristic and Cleaning Habits in the Family. Atmos. Environ. 2008, 42, 8553–8559. [Google Scholar] [CrossRef]
- Orecchio, S.; Indelicato, R.; Barreca, S. The Distribution of Phthalate Esters in Indoor Dust of Palermo (Italy). Environ. Geochem. Health 2013, 35, 613–624. [Google Scholar] [CrossRef] [PubMed]
- Bornehag, C.-G.; Lundgren, B.; Weschler, C.J.; Sigsgaard, T.; Hagerhed-Engman, L.; Sundell, J. Phthalates in Indoor Dust and Their Association with Building Characteristics. Environ. Health Perspect. 2005, 113, 1399–1404. [Google Scholar] [CrossRef]
- Wang, L.; Wu, Z.; Gong, M.; Xu, Y.; Zhang, Y. Non-Dietary Exposure to Phthalates for Pre-School Children in Kindergarten in Beijing, China. Build. Environ. 2020, 167, 106438. [Google Scholar] [CrossRef]
- Blanchard, O.; Glorennec, P.; Mercier, F.; Bonvallot, N.; Chevrier, C.; Ramalho, O.; Mandin, C.; Bot, B.L. Semivolatile Organic Compounds in Indoor Air and Settled Dust in 30 French Dwellings. Environ. Sci. Technol. 2014, 48, 3959–3969. [Google Scholar] [CrossRef]
- Luongo, G.; Östman, C. Organophosphate and Phthalate Esters in Settled Dust from Apartment Buildings in Stockholm. Indoor Air 2016, 26, 414–425. [Google Scholar] [CrossRef]
- US EPA National Center for Environmental, U.E.N.C.; for E. Dibutyl Phthalate (DBP) CASRN 84-74-2|IRIS|US EPA, ORD. Available online: https://iris.epa.gov/ChemicalLanding/&substance_nmbr=38 (accessed on 2 December 2022).
- US EPA, O. Di (2-Ethylhexyl)Phthalate (DEHP) CASRN 117-81-7|DTXSID5020607|IRIS|US EPA, ORD. Available online: https://cfpub.epa.gov/ncea/iris2/chemicallanding.cfm?substance_nmbr=14 (accessed on 2 December 2022).
- Bamai, Y.A.; Araki, A.; Kawai, T.; Tsuboi, T.; Saito, I.; Yoshioka, E.; Kanazawa, A.; Tajima, S.; Shi, C.; Tamakoshi, A.; et al. Associations of phthalate concentrations in floor dust and multi-surface dust with the interior materials in Japanese dwellings. Sci. Total Environ. 2014, 468, 147–157. [Google Scholar] [CrossRef]
- Liu, Y.; Song, X.J. Research progress on phthalate pollution of interior building decoration materials. Chin. J. Public Health 2013, 29, 617–619. (In Chinese) [Google Scholar] [CrossRef]
Disclaimer/Publisher’s Note: The statements, opinions and data contained in all publications are solely those of the individual author(s) and contributor(s) and not of MDPI and/or the editor(s). MDPI and/or the editor(s) disclaim responsibility for any injury to people or property resulting from any ideas, methods, instructions or products referred to in the content. |
© 2023 by the authors. Licensee MDPI, Basel, Switzerland. This article is an open access article distributed under the terms and conditions of the Creative Commons Attribution (CC BY) license (https://creativecommons.org/licenses/by/4.0/).