Abstract
The intensification of global warming under the influence of human activities has directly led to an increase in the magnitude of changes in the climate system, further exacerbating the impact on the global water cycle and making extreme weather events more frequent and intense. In this study, daily temperature data from 1960 to 2020 from nine meteorological stations in the Qingyi River basin were used to analyze the changes of 16 extreme temperature indicators using extreme temperature indicators, the trend analysis method, and the MK analysis method. The results show that in terms of spatial distribution, the colder extreme events in the basin mainly occur in the upstream and that the warmer extreme events mainly occur in the midstream and downstream. According to the temporal trends of the indicators, the indicators of extreme events with anomalous warming are dominated by a significant upward trend, in which the warm night index increases by up to 3.8 days/decade, whereas the indicators of extreme events with anomalous cold are dominated by a significant downward trend, in which the cold night index decreases by up to −3.4 days/decade. In terms of the magnitude of change in the indicators, the cold and night indicators are more variable. According the spatial difference of index changes, the extreme value index mainly shows a decreasing trend in the upstream of the basin and an increasing trend in the midstream and downstream. Combined with the characteristic of a low extreme value index in the upstream and high extreme value index in the midstream and downstream of the basin as a whole, the spatial difference in the extreme value index in the basin is expected to further increase.
1. Introduction
The IPCC Sixth Assessment Report Working Group I, which combines cutting-edge climate models, diverse analytical approaches, and the latest observational data, concluded that recent climate change has been widespread, rapid, and strong, with magnitudes of change not seen in thousands of years, and that human activities have contributed to the increase in global mean surface temperature. Compared with preindustrial levels (1850–1900), the anthropogenic-induced global average surface temperature increase from 2010 to 2019 was about 1.07 °C (0.8 °C to 1.3 °C), with natural forces influencing only −0.1–0.1 °C of the temperature change []. Compared with the average climate, extreme weather events, such as floods, droughts, hurricanes, storms, and extreme heat and cold, are characterized by suddenness, unpredictability, and strong destructiveness, which can have a great impact on the natural system and seriously restrict the development and progress of human society and the economy and even affect global food security and water supply and demand [,]. The AR6 WG I Report also noted that since the 1950s, anthropogenic impacts have most likely increased the probability of compound extreme events, such as heat waves and droughts occurring at similar or simultaneous times, mountain fires on all continents of the globe, and some regions experiencing compound floods []. Climate change not only affects crop yields but also has an impact on agricultural pests and diseases. Global warming has led to melting of the North and South Poles, rising sea levels, and higher winter temperatures than in the past, accelerating the development and reproduction of pests, thereby indirectly affecting agricultural development. The Qingyi River basin is located in the grain production area of China, and the study of the change pattern and formation mechanism of extreme temperature events has important guiding significance for the development of agricultural production in China.
The complexity of extreme temperature events is manifested by regional differences in space and of a multiscale nature in time. For instance, Alexander et al. [] found that in the last 50 years, 70% of global regions showed a trend of significantly fewer cold nights and significantly more warm nights. Klein [] determined that in central and south Asia, both maximum and minimum temperatures showed an increasing trend during the period of 1961–2000, with a more consistent trend in minimum temperatures and a strong variability in maximum temperatures during the period of 1901–2000. Manton et al. [] calculated and analyzed 91 temperature stations in 15 countries and concluded that the number of warm days and nights in Southeast Asia increased significantly and the number of cold days and nights decreased significantly during the period of 1961–1988. Klein [] found that in central and south Asia, both maximum and minimum temperatures showed an increasing trend between 1961 and 2000, with a more consistent trend in minimum temperatures and a strong variability in maximum temperatures between 1901 and 2000. In general, in the context of global warming, extreme temperatures show inter-regional variations in spatial and temporal characteristics.
In China, the average surface temperature has increased by about 0.5–0.8 °C over the last 100 years, while the annual average surface temperature for the last 50 years has increased by 1.1 °C at a warming rate of 0.22 °C/decade [], which is higher than the global average. A high temperature accompanied by high humidity may result in unbearable and oppressive weather. Southeast China will experience the severest heat stress in the near future because extreme high temperature and heat waves will occur more often in this region []. In the past few decades, large areas of China have experienced longer, stronger, and more frequent compound heat waves. The spatial extent affected by compound heat waves has significantly expanded since the 1960s, with the largest expanding rate of over 6% decade−1 detected in north China and northeast China []. Wang et al. [] concluded that the warming of the cold index was significantly greater than that of the warm index in the Yangtze River basin and that the warming of the night index was significantly greater than that of the day index. Although many scholars have studied the spatial and temporal characteristics of extreme temperature events from different temporal and regional perspectives [,,,], previous studies of extreme temperatures in China have mainly focused on the more economically developed regions in the east, and relatively few studies have been conducted in western China due to the complex topography and sparse observation sites. At the same time, due to the complex topography, western China is often a sensitive and vulnerable area to climate change.
In this study, we applied linear trend analysis and the Mann–Kendall (MK) test to analyze the extreme temperature variation in the Qingyi River basin using daily temperature data from nine meteorological stations from 1960 to 2020. The study analyzed the spatial and temporal variations of temperature extremes in the Qingyi River basin and explored the reasons for the spatial variation of temperature extremes. The study of extreme temperature changes in the region is of great importance for the sustainable development of the region, disaster prevention and mitigation, and for ensuring food security.
2. Materials and Methods
2.1. Study Area
The Qingyi River basin is located in the southwest of China between 102°16′–103°43′ E and 29°24′–30°56′ N in the hinterland of Sichuan Province (Figure 1), with an area of 12,793 km2. This basin originates from the southeast edge of the Tibetan Plateau and merges into the Yangtze River after converging with the Minjiang River. The Qingyi River basin has large altitudinal variations, and the special topography of the Tibetan Plateau side slope zone makes its precipitation spatial distribution extremely uneven. The Qingyi River basin is warm and humid, with average annual precipitation decreasing from southeast to northwest, including 1775 mm at Ya’an station and 963 mm at Baoxing station, and an average annual temperature of 14~21 °C. The Qingyi River basin is located in western China and is a tributary of the upstream of the Yangtze River. The upstream of the Yangtze River is affected by both the southeast monsoon and the southwest monsoon and is a vulnerable area to climate change with frequent droughts and floods []. At the same time, the Qingyi River basin is located in the Sichuan Basin, which is influenced by the special topography of the Qinghai–Tibet Plateau. The Sichuan basin is a typical area with violent, abnormal, and diverse weather changes and is the most complex area, with topography influencing precipitation []. The Qingyi River basin frequently experiences heavy rainfall and floods, and the amount of heavy rainfall is the highest in the Yangtze River basin []; the average incoming water per unit area reaches 1,344,000 m3/km2, ranking first in the Yangtze River basin and third in the country. As well as being rich in water resources, the Qingyi River basin is also located in China’s grain-producing region, and the basin is particularly rich in tourism resources.
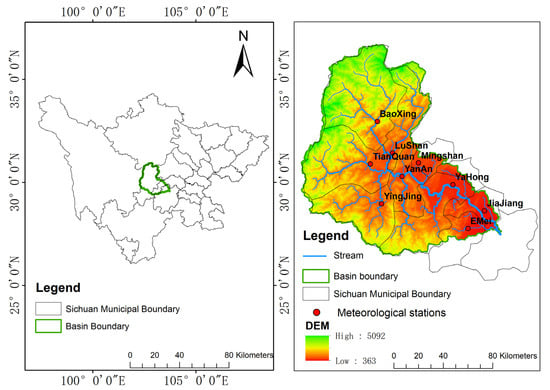
Figure 1.
Distribution of water systems and weather stations in the Qingyi River basin.
The Qingyi River basin is rich in history and tourism resources, as well as in hydro-energy resources, making it an important area for hydropower development in southwest China. Above Lushan is the considered upstream, the section from Lushan to Xingying is considered the midstream, and below Xingying is the downstream.
Land use data based on the International Geosphere-Biosphere Programme (IGBP), published by the United States Geological Survey (USGS, https://lpdaac.usgs.gov/products/mcd12q1v006/, accessed on 1 November 2022) were used to analyze the Qingyi River basin. There are 14 land use types in the Qingyi River basin, among which mixed forests account for the largest proportion (78.62%), followed by croplands and grasslands (8.26% and 7.06%, respectively). Classification of the soils in the Qingyi River basin was carried out using soil type data provided by the United Food and Agriculture Organization (FAO). The data classify global soils into 6988 categories, mainly according to the proportion of clay, silt, and sand in the soils. It was found that there are ten soil types in the Qingyi River basin, coded as 3085, 3959, 4266, 4281, 4327, 4343, 4389, and 6998 and accounting for 22.8%, 5.3%, 0.9%, 19.1%, 10.6%, 0.9%, 23.8%, 12.2%, 3.4%, and 0.8%, respectively.
2.2. Data
The temperature data used in this study were obtained from the China Meteorological Administration and are available at https://data.cma.cn/ (accessed on 17 April 2020). In consideration of the continuity of temperature data, daily temperature data from nine national meteorological stations (Figure 1) in the Qingyi River basin were selected and quality-controlled, using the temperature period of 1960–2020.
2.3. Methodology
2.3.1. Extreme Temperature Indices
This study used 16 important extreme temperature indicators recommended and defined as thresholds by the World Meteorological Organization (WMO) Climate Committee, as shown in Table 1. These indices can reflect different aspects of climate extremes [] and are characterized by weak extremes, low noise, and high significance, making extreme temperature indices widely used in extreme temperature analysis [,,,].

Table 1.
Definitions of extreme temperature indices.
2.3.2. MK Trend Test
In time series trend analysis, the MK test is a nonparametric test recommended by the WMO that has been widely used; it was originally proposed by Mann and Kendall [,]. The MK trend test is used to analyze the trend changes in time series of precipitation, runoff, temperature, and water quality. It does not require the sample to follow a certain distribution and is not disturbed by a few outliers, making it suitable for hydrological and meteorological data that are not normally distributed and easy to calculate [,].
The MK test is a rank-based nonparametric test that is capable of testing for linear or nonlinear trends. In this test, the null hypothesis (H0) and the alternative hypothesis (H1) are equal on the question of whether there is a time series trend in the observed data.
In the MK test, the statistical value (S) and the standardized test statistic (ZMK) are calculated as follows:
where Xi and X are the values corresponding to years i and j in the time series, respectively; n is the length of the time series data; tp is the bundle value corresponding to the pth number; ZMK is the trend of time series data, i.e., if ZMK > 0, then the time series data show an increasing trend over time; otherwise, the time series data show a decreasing trend over time. When |ZMK| > Z(1-a/2), the null hypothesis is rejected, and the time series data are considered to have a significant trend. The value of Z(1-a/2) can be determined from the standard normal distribution table, and its corresponding Z(1-a/2) value is 1.96 when a significance level of a = 5% is considered.
2.3.3. Linear Tendency Estimation Method
In this study, the linear trend estimation method was used to analyze the trend of climate change. The arithmetic of the climatic tendency rate is as follows: Let the time series of a meteorological element of a station be y1, y2, … yn, which can be expressed by a polynomial:
where t is time (year), and a1 × 0 is the climatic tendency rate (d/decade or °C/decade). The coefficients in the equation can be determined by the least square method or empirical orthogonal polynomial. The linear propensity estimation method is simple and computationally fast, and the model is not only valid for very large data sets but also for sparse data.
y(t) = a0 + a1t1 + a2t2 + …+ amtn,
3. Results
3.1. Spatial Distribution
In the relative index, the low-value indices (TX10p and TN10p) and the high-value indices (TX90p and TN90p) do not differ significantly in the Qingyi River basin, with mean values of 36–37 days for cold nights (TN10p) and cold days (TX10p) and 36–37 days for warm nights (TN90p) and warm days (TX90p). In the absolute index, indicators representing low values (ID0 and FD0) have the highest upstream and lowest downstream values (Table 2). For the indicators representing high values (SU25 and TR20), the highest value is associated with the downstream, and the lowest value is associated with the upstream. Among the other indices, the basin-wide differences in the WSDI, CSDI, and DTR indices are insignificant, with basin-wide averages of 6.9, 9.7 and 17.4 days, respectively.
Table 2.
Mean extreme temperatures in the Qingyi River basin from 1960 to 2020 (°C or days).
Figure 2 shows the distribution characteristics of extreme temperature indicators in the Qingyi River basin. The spatial distribution characteristics of the relative, absolute, extreme, and other indices were analyzed.
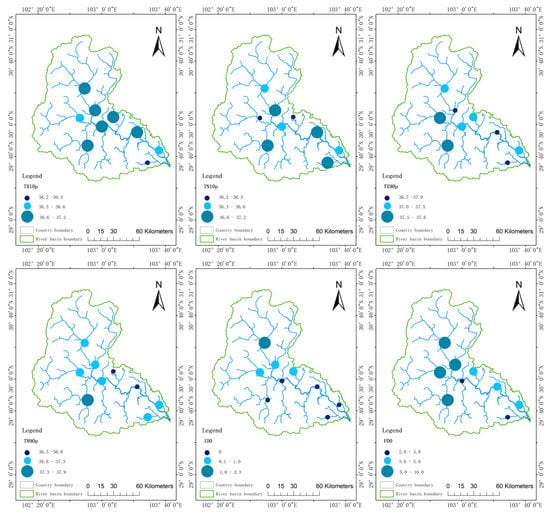
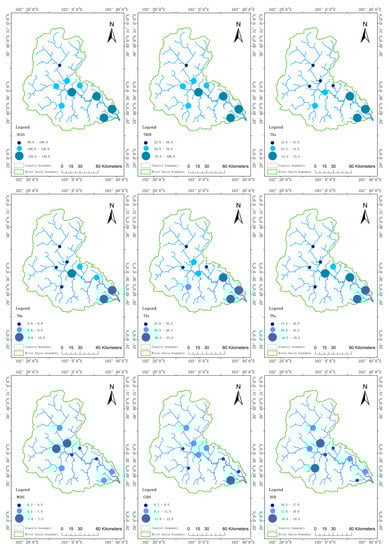
Figure 2.
Spatial distribution of extreme temperature index in the Qingyi River basin from 1960 to 2020.
According the indicators of cold nights (TN10p), cold days (TX10p), warm nights (TN90p), and warm days (TX90p), the relative indices of the Qingyi River basin are relatively evenly distributed throughout the basin, with small differences, indicating a good climatic consistency of the relative indices of the basin.
In the absolute index, the number of ice days (ID0) is mainly concentrated in the upper part of the basin, with the maximum value located at Baoxing station (2.3 days), and the number of ice days in the middle and lower parts of the basin is 0. The large-value area of frost days (FD0) is located in the upper part of the basin (5–10 days), and the maximum value is located at Baoxing station (9.5 days), with 2–5 frost days in the middle and lower parts of the basin. The number of summer days (SU25) in the middle and downstream of the basin is greater than that in the upstream, with the fewest summer days (90 days) at Baoxing station and the greatest number of summer days (138 days) at Jiejiang station. The number of tropical nights (TR20) in the middle and downstream of the basin is greater than that in the upstream, with the fewest heat wave days at Baoxing station (22 days) and the greatest number of heat wave days at Emei station (98 days). The main distribution characteristics of the absolute indices in the basin are that the areas with high values of ice and frost days are mainly located in the upper basin with higher elevation, and the areas with high values of summer days and tropical nights are mainly located in the middle and lower basin with lower elevation.
The minimum Tmax (TXn) is the lowest in the upper part of the basin, with medium values in the middle part and the highest values in the lower part, with the minimum value at Baoxing station (12.7 °C) and the maximum value at Jiejiang station (15.3 °C). The minimum Tmin (TNn) is lower in the upstream of the basin (6.9–8.0 °C) than in the middle and downstream (8.0–10.0 °C), with the lowest value located in Baoxing (7 °C) and the highest value located in Emei (9.8 °C). The maximum Tmax (TXx) is highest in the midstream and lowest in the upstream. The downstream values are in the range of 26.6–27 °C, and the upper and midstream values are in the range of 25–26.5 °C. The highest value is 27.1 °C in Jiajiang, and the lowest value is 25.0 °C in Baoxing. The maximum Tmin ranges from 14.6 °C to 16.0 °C in the upper part of the basin and from 16.0 °C to 18.5 °C in the middle and downstream. Hence, the distribution of maximum values in the extreme index is characterized by lower values in the upstream than in the middle and downstream, while the distribution of minimum values is characterized by higher values in the downstream than in the upstream and midstream.
The warm spell duration (WSDI) varies minimally across the Qingyi River basin, ranging from 6.3 days to 7.5 days, with the lowest value of 6.3 days at Meishan station in the midstream. The cold day duration (CSDI) ranges from 8.2 days to 11.0 days. The diurnal temperature range (DTR) is relatively small across the basin, ranging from 16.5 days to 18.3 days. This finding indicates that the indicators have good consistency in the watershed.
3.2. Time Variation Trend
The numbers of cold days (TX10p) and cold nights (TN10p) in the Qingyi River basin show a decreasing trend with interannual tendency rates of −1.6 and −3.4 days/decade, respectively (Table 3, Figure 3). The numbers of warm days (TX10p) and warm nights (TN10p) show an increasing trend with interannual tendency rates of 3.2 and 3.8 days/decade, respectively. Combined with the results of the MK significance test, the number of cold indicator days in the relative index of the Qingyi River basin shows a significant decreasing trend, and the number of warm indicator days shows a significant increasing trend. At the same time, the increasing trend of the warm index is larger than the increasing trend of the cold index.
Table 3.
Temporal trends of extreme temperature indicators in the Qingyi River basin.
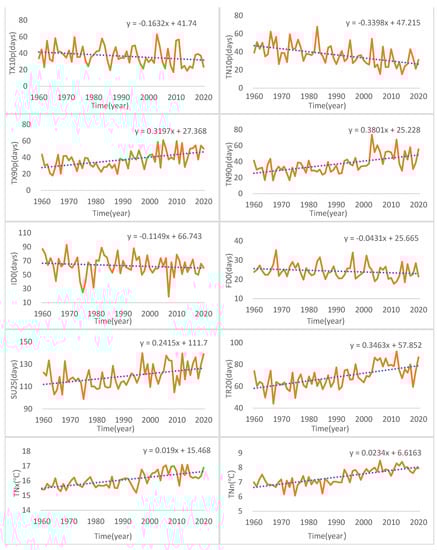
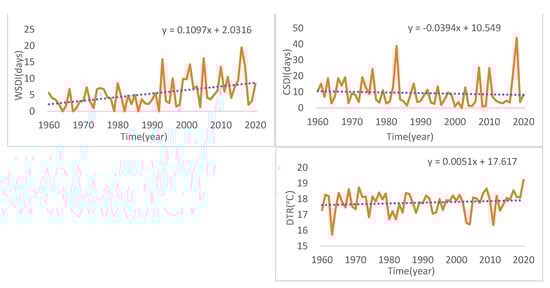
Figure 3.
Interannual variation in the extreme temperature index in the Qingyi River basin from 1960 to 2020.
The numbers of ice and frost days show a decreasing trend with interannual tendency rates of −1.1 and −0.43 days/decade, respectively. The numbers of summer days (SU25) and tropical days show an increasing trend with interannual tendency rates of 2.4 and 3.5 days/decade, respectively. Combined with the results of the MK significance test, among the absolute indicators of the Qingyi River, the cold indicators show a decreasing trend, among which the number of frost days shows a significant decrease, and the warm indicators show a significant increasing trend. The increasing trend of warm indicators is greater than the decreasing trend of cold indicators.
The extreme indicators of the Qingyi River basin all show a decreasing trend with interannual tendency rates of 0.08, 0.23, 0.28, and 0.19 °C/decade. Combined with the results of the MK significance test, TNn, TXx, and TNx show a significant increase, indicating that both cold and warm extremes in the Qingyi River basin demonstrate an increasing trend, especially the highest temperature extremes.
The warm spell duration (WSDI) in the Qingyi River basin shows an increasing trend with an interannual tendency of 1.1 days/decade. The cold spell duration (CSDI) shows a decreasing trend with an interannual tendency of −0.39 days/decade. The diurnal temperature range (DTR) shows a weak increasing trend with an interannual tendency of 0.05 °C/decade. A significant increase in the number of hot duration days and a significant decrease in the number of cold duration days are observed.
3.3. Spatial Trends
Table 4 shows the mean values of the trends in the middle and upstream of the Qingyi River basin from 1960 to 2020. The cold indicators of the relative indices show a decreasing trend, and the warm indicators show an increasing trend. The decreasing trend of the upstream of the cold indicators (TX10p and TN10p) is greater than the decreasing trend of the midstream and downstream, and the changing trend of the night indicators (TN10p and TN90p) is more obvious in the upstream than in the midstream and downstream. The absolute cold indicators show a decreasing trend, and the warm indicators show an increasing trend, in which the decreasing trend of cold indicators is more obvious in the upstream. The extreme indicators do not vary significantly in the upstream and midstream, and the downstream trend is in the range of 0.2–0.4 °C/decade, making the downstream more spatially different from the upstream and midstream. Other warm indicators show an increasing trend, the cold indicators present a decreasing trend, and the upstream decreasing trend is more obvious. The daily difference in temperature and the basin changes are not obvious.
Table 4.
Temporal trends of extreme temperature indicators in the Qingyi River basin.
The overall trend of cold days and nights in the Qingyi River basin is decreasing, and the decreasing trend of cold days in the upstream is stronger than that in the middle and downstream. That is, the decreasing trend in the upstream is −2.5–1.5 days/decade. The decreasing trend of cold nights in the whole basin is inconsiderably different, except for the decreasing trend of 4.7 days/decade at Lushan station; the decreasing trend in the rest of the stations is −2.4–2.7 days/decade and 4.7 days/decade. The numbers of warm days and nights show increasing trends of 2.2–4.0 days/decade and 2.5–5.2 days/decade, respectively. This finding shows that the relative indices exhibit a decreasing trend for the cold indicators and an increasing trend for the warm indicators.
Given that the Qingyi River basin is in the subtropical region, the overall number of ice days (ID0) is small, so the change pattern was not analyzed (Figure 4). The number of frost days (FD0) in the Qingyi River basin shows a decreasing trend as a whole, and the decreasing trend in the upstream is greater than that in the middle and downstream. The number of summer days (SU25) shows an overall upward trend of between 1.0 and 3.2 days/decade. Thus, the absolute indicators show a significant downward trend for cold indicators and a significant upward trend for warm indicators.
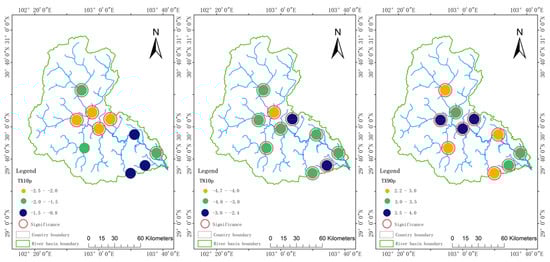
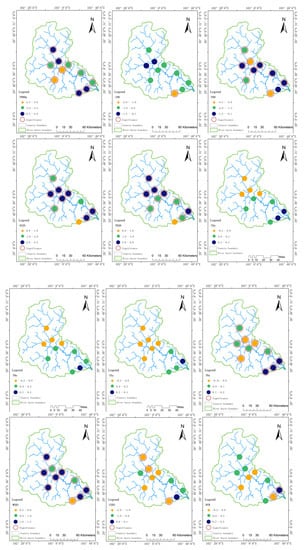
Figure 4.
Spatial distribution of the extreme temperature variation trend in the Qingyi River basin from 1960 to 2020.
The minimum Tmax (TXn) in the basin mainly shows a decreasing trend in the upstream and an increasing trend in the middle and downstream. The minimum Tmin (TNn) mainly presents a decreasing trend in the upstream of the basin and an increasing trend in the middle and downstream. The maximum Tmax (TXx) shows a decreasing trend in the upper part of the basin and an increasing trend in the middle and lower parts. The maximum Tmin (TNx) mainly shows a weak downward trend in the upper part of the basin and a weak upward trend in the lower part. This finding indicates that the extreme value index mainly shows a decreasing trend in the upstream of the basin and an increasing trend in the middle and downstream. Combined with the fact that the extreme value index is characterized by small low in the upstream and high values in the middle and downstream of the basin as a whole, the spatial differences of the extreme value index in the basin are expected to further increase.
The warm spell duration (WSDI) shows an increasing trend in the basin of between 0.9 and 1.3 days/decade. The cold spell duration (CSDI) shows a decreasing trend in the basin, at −0.9–2.1 days/decade. The overall variation in diurnal temperature range (DTR) in the Qingyi River basin is small, ranging from −0.1 °C/decade to 0.3 °C/decade. Therefore, among other indicators, the number of hot duration days shows an increasing trend, and the number of cold duration days shows a decreasing trend.
4. Discussion
The Qingyi River basin is an important grain-producing area in China, and the self-regulation capacity of the ecosystem is already far from being able to withstand the harm caused by global warming. Therefore, studying the changes in extreme temperature events can provide useful references to actively respond to climate change. As an upstream tributary of the Yangtze River, the Qingyi River basin is abundant in precipitation and very rich in hydropower resources, while the population distribution in the Qingyi River basin is concentrated, and the changes in extreme temperature indicators in this basin play an important role in the sustainable development of regional resources, the environment, and society.
The results imply that the overall trend of the warm and cold indicators shows that the extreme temperature warm indices in the basin present an increasing trend, and the extreme temperature cold indices present a decreasing trend. The trends converge with the findings of studies on extreme temperature events in other regions of China [,], such as the Yangtze River basin [], the Sichuan basin [], and the Qinghai–Tibet Plateau [].
In the analysis of the degree of variation of the indicators, the extreme temperature indicators vary from region to region due to different topographic conditions and climatic backgrounds. The Qingyi River basin exhibits less cooling than warming in the cold indices and a greater change in the night indices than in the day indices. This indicates that there is no symmetry between the cold and warm indices and between the diurnal and nocturnal indices and that the cold and nocturnal indices are more sensitive to the response to climate change, which is generally consistent with the findings of other researchers [,].
In the analysis of trends over time, the Qingyi River basin shows an increasing trend after the 1990s, which is consistent with the overall trend in the Min River basin, where the Qingyi River is located []. This phenomenon is mainly related to the urbanization process in China in the last 30 years. Since the 1970s, China has undergone a phase of rapid urbanization and rapid economic development, and many studies have shown that urbanization has largely contributed to surface warming [,,,].
The extreme value indicators show an insignificant increase similar to the results of other studies in the hinterland of Sichuan basin, the eastern TP [,], and the Yangtze River basin []. The increase in the number of summer days in the Qingyi River basin is 2.4 days/decade, which is higher than that in the Yangtze River basin (2.16 days/decade). This indicates that the response of the Qingyi River basin scale to climate warming is more sensitive than the Yangtze River basin to which it belongs as a whole. The Qingyi River basin is in the transition zone from the Qinghai–Tibet Plateau to the Sichuan Basin, with complex topography, and is sensitive to the impact of climate change. In summer, the strengthening of subtropical high pressure, the intensification of the summer and autumn anticyclonic circulation in east Asia, and the weakening of the Asian monsoon system increase the temperature, leading to an increase in extreme heat events. In winter, the southwest monsoon strengthens, and the westerly winds intensify, thereby reducing winter winds and cold air southward while limiting the southward shift of the northwest Siberian high pressure, leading to a decrease in cold events []. The response of different regional climates to different circulation indicators is inconsistent, and subsequent studies should consider the influence of different circulation indicators on different climatic zones to reveal the formation mechanism of extreme temperature events and combine their spatial and temporal evolution patterns to provide a scientific basis for improved response to the occurrence of regional extreme temperature events.
In the spatial trend analysis, the extreme value indicators mainly show a decreasing trend in the upstream of the basin and an increasing trend in the middle and downstream. Combined with the fact that the extreme value index is characterized by low values in the upstream and high values in the middle and downstream of the basin as a whole, the spatial variation of the extreme value index in the basin is expected to further increase. The greater variability in the high-value areas of the extreme indicators will further increase the spatial variability of the basin and will further contribute to the development of extreme weather and climate events. The frequent occurrence of extreme temperature events on the Qinghai–Tibet Plateau and surrounding areas, which is manifest as an increase in the number of warm days and warm nights and a decrease in the number of cold days and cold nights, is consistent with the findings of this paper []. You [] found that the Qinghai–Tibet Plateau region has experienced significant warming and that this warming trend may persist for a long time. As a highly sensitive area, the Qinghai–Tibet Plateau has a large cold bias due to the complex topography of the region, and the average surface temperature has been underestimated [].This implies that the temperature in the Tibetan Plateau region will continue to increase in the future and that the permafrost layer may undergo more significant thermal degradation, with far-reaching effects on the regional ecological environment, water quality security, and the plateau climate system.
5. Conclusions
This study analyzed the spatial and temporal characteristics of extreme temperature indicators in the Qingyi River basin from 1960 to 2020 using temperature monitoring data from nine meteorological stations in the basin.
The indicators of extreme events of FD0, ID0, TXn, and TNn are higher in the upstream than in the middle and downstream of the basin, while the indicators of extreme events of TNn, TNx, SU25, and TR20 are higher in the middle and downstream than in the upstream. The relative indicators and other indicators show relatively small differences across the basin.
The numbers of frost days, cold nights, and cold days, as well as the cold day duration index of extreme events with abnormal coldness, show a significant decrease, and the number of freezing days shows an insignificant decrease. Meanwhile, the indicators of extreme events with abnormal warmth, monthly extreme maximum temperature, monthly minimum temperature maximum, warm nights, warm days, summer days, heat wave days, and heat duration show a significant increasing trend. The variation in cold indices (ID0, FD0, TX10p, and TN10p) is lower than that in warm indices (SU25, TR20, TX90p, and TN90p), and the variation in night indices (TN10p and TN90p) is greater than that in day indices (TX10p and TX90p).The obvious change in the warm index makes the warming trend in the Qingyi River basin obvious, and the more obvious change in the nighttime index makes the daily difference in temperature larger, which provides favorable conditions for the development of extreme weather.
The extreme value index mainly shows a decreasing trend in the upstream of the basin and an increasing trend in the midstream and downstream. Combined with the fact that the extreme value index is characterized by low values in the upstream and high values in the midstream and downstream of the basin as a whole, the spatial differences in the extreme value index in the basin are expected to further increase. The elevation of the Qingyi River basin varies greatly, with the lowest elevation of 363 m in the middle and lower reaches and the highest elevation of 5092 m in the upper reaches. Climate change has a significant impact on changes in snow, ice, and vegetation in the region, while further spatial variation within the region will have a feedback effect on climate change, which will also affect regional and even global climate change, water resources, and ecosystems.
Author Contributions
Conceptualization, T.C. and J.G.; methodology, T.C. and J.G.; software, T.C.; formal analysis, T.C. and J.G.; writing—original draft preparation, T.C.; writing—review and editing, T.C. and T.A.; visualization, T.C. and T.A.; supervision, J.G. and T.A.; funding acquisition, T.A. All authors have read and agreed to the published version of the manuscript.
Funding
This research was financially supported by the Chengdu Heavy Rain and Drought-Flood Disasters in Plateau and Basin Key Laboratory of Sichuan Province (no. SZKT202201), the University of Information Engineering Scientific Research Fund Grant Results (no. KYTZ202129), and the Regional Innovation Cooperation Program from Science &Technology Department of Sichuan Province (no.2020YFQ0013).
Institutional Review Board Statement
Not applicable.
Informed Consent Statement
Not applicable.
Data Availability Statement
This study did not report any data.
Conflicts of Interest
The authors declare no conflict of interest.
References
- Climate Change 2021—The Physical Science Basis. Chem. Int. 2021, 43, 22–23. [CrossRef]
- Hoare, V.C.; Miles, V.; Misal, H. Responding to the climate crisis—Taking action on the IPCC 6th Assessment Report. Weather 2022, 77, 149–150. [Google Scholar]
- United Nations. Secretary-General Calls Latest IPCC Climate Report “Code Red for Humanity”, Stressing “Irrefutable” Evidence of Human Influence [EB/OL]. (2021-08-11). Available online: https://www.un.org/press/en/2021/sgsm20847.doc.htm (accessed on 28 July 2022).
- Alexander, L.V.; Zhang, X.; Peterson, T.C.; Caesar, J.; Gleason, B.; Klein Tank, A.M.; Haylock, M.; Collins, D.; Trewin, B.; Rahimzadeh, F.; et al. Global observed changes in daily climate extremes of temperature and precipitation. J. Geophys. Res. 2006, 111, D05109. [Google Scholar] [CrossRef]
- Klein Tank, A.M.; Peterson, T.C.; Quadir, D.A.; Dorji, S.; Zou, X.; Tang, H.; Santhosh, K.; Joshi, U.R.; Jaswal, A.K.; Kolli, R.K.; et al. Changes in daily temperature and precipitation extremes in central and south Asia. J. Geophys. Res. 2006, 111, D06316. [Google Scholar] [CrossRef]
- Manton, M.J.; Della-Marta, P.M.; Haylock, M.R.; Hennessy, K.J.; Nicholls, N.; Chambers, L.E.; Collins, D.A.; Daw, G.; Finet, A.; Gunawan, D.; et al. Trends in extreme daily rainfall and temperature in Southeast Asia and the South Pacific: 1991–1998. Int. J. Climatol. 2001, 21, 269–284. [Google Scholar] [CrossRef]
- Ding, Y.H.; Ren, G.Y.; Shi, G.Y. National Assessment Report of Climate Change (I): Climate change in China and its future trend. Adv. Clim. Chang. Res. 2006, 2, 3–8. [Google Scholar]
- Liu, X.C.; Tang, Q.H.; Zhang, X.J.; SUN, S. Projected Changes in Extreme High Temperature and Heat Stress in China. J. Meteorol. Res. 2018, 32, 351–366. [Google Scholar] [CrossRef]
- Yi, L.; Ding, Y.H.; Li, W.J. Observed Trends in Various Aspects of Compound Heat Waves across China from 1961 to 2015. J. Meteorol. Res. 2017, 31, 455–467. [Google Scholar]
- Wang, Q.; Zhang, M.J.; Wang, S.J.; Luo, S.F.; Wang, B.L.; Zhu, X.F. Extreme temperature events in Yangtze River Basin during 1962–2011. Acta Geogr. Sinica. 2013, 68, 611–625. [Google Scholar]
- Zhou, D.G.; Huang, R.H.; Huang, G. Variations of Climate and Vegetation Coverover the Upper Reaches of Yangtze River in the Past Decades. Trans. Atmos. Sci. 2009, 32, 377–385. [Google Scholar]
- Li, Y.Q.; Li, D.J.; Yang, S.; Liu, C.; Zhong, A.H.; Li, Y. Characteristics of the precipitation over the eastern edge of the Tibetan Plateau. Meteorol. Atmos. Phys. 2010, 106, 49–56. [Google Scholar] [CrossRef]
- Li, Y.Q.; Zhang, X.C. Main Advances in the Research of “Yaan Sky Leakage”. Torrential Rain Disasters 2011, 30, 289–295. [Google Scholar]
- Mann, H.B. Non-parametric tests against trend. Econometrica 1945, 13, 245–259. [Google Scholar] [CrossRef]
- Kendall, M.G. Rank Correlation Methods. Br. J. Psychol. 1990, 25, 86–91. [Google Scholar] [CrossRef]
- Wu, X.S.; Wang, Z.L.; Zhou, X.W.; Lai, C.G.; Lin, W.X.; Chen, X.H. Observed changes in precipitation extremes across 11 basins in China during 1961–2013. Int. J. Climatol. 2016, 36, 2866–2885. [Google Scholar] [CrossRef]
- Vijay, K.; Sharad, K.J. Trends in seasonal and annualrainfall and rainy days in Kashmir Valley in the last century. Quat. Int. 2010, 212, 64–69. [Google Scholar]
- Zhong, K.Y.; Zheng, F.L.; Wu, H.Y.; Qin, C.; Xu, X.M. Dynamic changes in temperature extremes and their association with atmospheric circulation patterns in the Songhua River Basin, China. Atmos. Res. 2017, 190, 77–88. [Google Scholar] [CrossRef]
- Shang, S.S.; Lian, L.S.; Ma, T.; Zhang, K.; Han, T. Spatiotemporal variation of temperature and precipitation in Northwest China in recent 54 years. Arid. Zone Res. 2018, 35, 68–76. [Google Scholar]
- Guan, Y.H.; Zhang, X.C.; Zheng, F.L.; Wang, B. Trends and variability of daily temperature extremes during 1960–2012 in the Yangtze River Basin, China. Glob. Planet. Chang. 2015, 124, 79–94. [Google Scholar] [CrossRef]
- Sun, C.; Cheng, Z.G.; Mao, X.L.; Mei, S.D.; Yang, X.Y. Extreme climatic change trend and features in Sichuan for the latest 44 years. J. Lanzhou Univ. (Nat. Sci.) 2017, 53, 119–126. [Google Scholar]
- Xu, L.J.; Hu, Z.Y.; Zhao, Y.N.; Hong, X.Y. Climate change characteristics in Qinghai—Tibetan Plateau during 1961–2010. Plateau Meteorol. 2019, 38, 911–919. [Google Scholar]
- Sun, W.Y.; Mu, X.M.; Song, X.Y.; Wu, D.; Cheng, A.F.; Qiu, B. Changes in extreme temperature and precipitation events in the Loess Plateau (China) during 1960–2013 under global warming. Atmos. Res. 2016, 168, 33–48. [Google Scholar] [CrossRef]
- Choi, G.; Collins, D.; Ren, G.; Trewin, B.; Baldi, M.; Fukuda, Y.; Afzaal, M.; Pianmana, T.; Gomboluudev, P.; Huong, P.T.; et al. Changes in means and extreme temperature and precipitation events in the Asia-Pacific Network Region,1955–2007. Int. J. Climatol. 2009, 29, 1906–1925. [Google Scholar] [CrossRef]
- Chen, T.; Ao, T.Q.; Zhang, X.; Li, X.D.; Yang, K.B. Climate change characteristics of extreme temperature in the Minjiang River Basin. Adv. Meteorol. 2019, 2019, 1935719. [Google Scholar] [CrossRef]
- Jones, P.D.; Lister, D.H.; Li, Q. Urbanization effects in largescale temperature records, with an emphasis on China. J. Geophys. Res. 2008, 113, D009916. [Google Scholar]
- Zhou, L.M.; Dickinson, R.E.; Tian, Y.H.; Fang, J.; Li, Q.; Kaufmann, R.K.; Tucker, C.J.; Myneni, R.B. Evidence for a significant urbanization effect on climate in China. Proc. Natl. Acad. Sci. USA 2004, 101, 9540–9544. [Google Scholar] [CrossRef]
- Van Dijk, A.I.; Beck, H.E.; Crosbie, R.S.; De Jeu, R.A.; Liu, Y.Y.; Podger, G.M.; Timbal, B.; Viney, N.R. The millennium drought in southeast Australia (2001–2009): Natural and human causes and implications for water resources, ecosystems, economy and society. Water Resour. Res. 2013, 49, 1040–1057. [Google Scholar] [CrossRef]
- Ren, G.Y.; Zhou, Y.Q. Urbanization effect on trends of extreme temperature indices of national stations over Mainland Chian, 1961–2008. J. Clim. 2013, 27, 2340–2360. [Google Scholar] [CrossRef]
- You, Q.L.; Kang, S.C.; Aguilar, E.; Pepin, N.; Flügel, W.A.; Yan, Y.; Xu, Y.; Zhang, Y.; Huang, J. Changes in daily climate extremes in China and their connection to the large scale atmospheric circulation during 1961–2003. Clim. Dyn. 2011, 36, 2399–2417. [Google Scholar] [CrossRef]
- You, Q.L.; Min, J.Z.; Kang, S.C. Rapid warming in the Tibetan Plateau from observations and CMIP5 models in recent decades. Int. J. Climatol. 2016, 36, 2660–2670. [Google Scholar] [CrossRef]
- You, Q.L.; Cai, Z.Y.; Wu, F.Y.; Jiang, Z.H.; Pepin, N.; Shen, S.S.P. Temperature dataset of CMIP6 models over China: Evaluation, trend and uncertainty. Clim. Dyn. 2021, 57, 17–35. [Google Scholar] [CrossRef]
Disclaimer/Publisher’s Note: The statements, opinions and data contained in all publications are solely those of the individual author(s) and contributor(s) and not of MDPI and/or the editor(s). MDPI and/or the editor(s) disclaim responsibility for any injury to people or property resulting from any ideas, methods, instructions or products referred to in the content. |
© 2023 by the authors. Licensee MDPI, Basel, Switzerland. This article is an open access article distributed under the terms and conditions of the Creative Commons Attribution (CC BY) license (https://creativecommons.org/licenses/by/4.0/).