Article

The Hemispheric Asymmetry of Gravity Wave Impact on the Polar Mesospheric Cloud, Based on the Aeronomy of Ice in the Mesosphere Satellite

1
Department of Geophysics, College of the Geology Engineering and Geomatics, Chang’an University, Xi’an 710054, China
2
Key Laboratory of Geospace Environment, Chinese Academy of Sciences, University of Science & Technology of China, Hefei 230026, China
3
Center for Environmental Research and Earth Sciences (CERES), Salem, MA 01970, USA
4
Institute of Earth Physics and Space Science (ELKH EPSS), 9400 Sopron, Hungary
5
Instituto De Geofísica, Universidad Nacional Autónoma De México, Mexico City 04510, Mexico
*
Authors to whom correspondence should be addressed.
Atmosphere 2023, 14(3), 419; https://doi.org/10.3390/atmos14030419
Submission received: 20 January 2023 / Revised: 15 February 2023 / Accepted: 20 February 2023 / Published: 21 February 2023
(This article belongs to the Section Upper Atmosphere)

Abstract

:
In this research, we analyze the gravity wave (GW) energy density, ice water content (IWC), particle radius, and cloud albedo data of 16 polar mesospheric cloud (PMC) seasons in the Northern Hemisphere (NH) from 2007 to 2014 and Southern Hemisphere (SH) from 2007/2008 to 2014/2015, based on observations from the Cloud Imaging and Particle Size and Solar Occultation For Ice Experiment instruments. The influence of GW activity on the formation of PMCs is studied by hemispheric contrast. In the NH, the GW flux generally starts to increase significantly around the summer solstice during the 8 PMC seasons. In 6/8 of these seasons, the IWC is positively correlated with the variation of GW. When the GW activity is enhanced to reach the maximum, the IWC will start to increase and reach the peak within 0–23 days. In comparison, in the SH, the GW peaks around 55 days after the solstice. The timing of PMC appearance also varies, with the IWC starting to grow 20 days after the solstice and the GW increasing in 55 days after the solstice. In particular, the IWC starts even earlier than the solstice in the seasons of 2012/2013 and 2013/2014.

1. Introduction

The noctilucent cloud was first mentioned by R. Leslie in 1885 [1]. It is a phenomenon observed after sunset through ground−based methods or even visually, showing a wave-like character [1]. It was thought to be a new phenomenon when first seen in the late 19th century, occurring in the high-latitude summer mesopause region of 80–85 km [1]. Conventional space−based observations of this cloud began in 1982, by the Solar Mesosphere Exploration Satellite (SME), and the term polar mesospheric clouds (PMCs) was introduced to describe it [2]. In the Northern Hemisphere (NH) from mid−May to mid−August, PMCs are often seen at latitudes of 55° to 85° [3]. In the Southern Hemisphere (SH), they can be observed from November to February [4]. These periods are often referred to as the PMC seasons. A typical PMC season occurs around the summer solstice and lasts for about three months [5]. Similar to the clouds in the troposphere, the formation of PMC is mainly influenced by the temperature [6] and water vapor content [7] of the surrounding atmosphere. The difference is that the temperature of the PMC region is extremely low (about 140 K) [8]. Thus, when the water vapor content of the region reaches 3~10 ppmv it can form condensation nuclei [8]. The formation of PMCs is also affected by dynamic driving, such as atmospheric fluctuations and circulations [9].
Regarding the effect of dynamic processes on PMCs, one of the most studied factors is the gravity wave (GW) [10]. The GW is excited in the lower atmosphere and will propagate upward with increasing amplitude due to the lower density in the upper atmosphere [11,12]. Eventually, it becomes unstable and breaks up in the middle and upper atmosphere [11,12]. The GW propagation will make the upwellings cooler, which could probably cause extremely low temperatures (e.g., <140 K) in the summer mesopause over high latitudes [13]. This condition triggers water vapor to reach nucleation conditions, resulting in the formation of ice particles [13]. On the other hand, the breaking of GW can release energy, leading to the sublimation of existing ice particles and reducing the brightness of PMCs [14]. The dual role of GW in the formation and destruction of PMCs shows that GW mainly triggers PMCs by creating cold summer mesopause [15]. However, the dissipation of GW will heat the PMC regions, resulting in fewer and darker PMCs [16].
In addition, more and more observational evidence indicates that the correlation between PMCs and GW is different between the hemispheres [17,18,19,20]. The statistical results reveal that there is an asymmetry between the lidar observations in the two hemispheres [4,21]. Lidar measurements in Greenland (67° N) show that short-period GW activity in the stratosphere is inversely correlated to PMC backscattering [22,23]. This result is also confirmed by lidar data of PMCs and upper stratospheric gravity waves from the Arctic Lidar Technology (ARCLITE) facility through observations from 1995–2001 [21]. In contrast, observations at Davis (66.6° S) exhibit no significant correlation between PMC brightness and stratospheric GW activity [24]. The results from the Aeronomy of Ice in the Mesosphere (AIM) show that the change rate of particle size perturbation amplitude with GW wavelength is slightly larger in the SH than in the NH [9].
In this study, we will focus on the changes in GW, IWC, particle radius, and albedo during the PMC seasons. We use the GW data in the PMC seasons of the NH 2007–2014 and 2007/2008–2014/2015 SH, from the Solar Occultation For Ice Experiment (SOFIE) onboard the AIM satellite. We combine the ice water content (IWC), particle radius data, and albedo images from the Cloud Imaging and Particle Size (CIPS) instrument, to explore the differences between the impact of GW activity on the NH and SH. This is the first time a study has investigated the hemispheric discrepancy in the impact of GW on PMC through such long-period observations.

2. Materials and Methods

The data for this study are from the Aeronomy of Ice in the Mesosphere (AIM) satellite launched by NASA. The overall goal of the AIM is to address how PMCs are formed and why they have discrepancies [25]. There are two instruments on the AIM to detect PMC: Cloud Imaging and Particle Size (CIPS) [26] and the Solar Occultation For Ice Experiment (SOFIE) [27].
The CIPS is an ultraviolet imager that continuously measures the scattered radiation at 265 nm through four low-altitude cameras at different scattering angles [26]. The spatial resolution of the sunward and backside cameras varies between 2.5 km near the lowest point and 5 km at the end corner [26]. Each four-camera image covers an area of about 2200 km along the orbit and 950 km in the vertical orbit [26]. We analyze the IWC, particle radius, and albedo data from CIPS V5.20 [28] in both Northern and Southern Hemispheres.
SOFIE is a solar occultation instrument that provides NLC and MSP extinction and vertical temperature profiles, abundances of five gases (e.g., ozone (O3), water vapor (H2O), carbon dioxide (CO2), methane (CH4) and nitric oxide (NO)) at 0.292–5.316 μm, with a vertical resolution of about 1.8 km [27,29,30]. It also provides a variety of parameters characterizing PMC properties, including ice mass density (Mice), IWC, and ice grain size [30]. SOFIE makes continuous observations at latitudes from 65°–85° S (sunset) and 65°–85° N (sunrise), following the latitude of the diurnal boundary that varies with the season [29]. We process data of SOFIE V1.3 [31] to obtain gravity wave, IWC, and albedo results on the PMC seasons from 2007–2014 for NH and 2007/2008–2014/2015 for SH.

3. Results and Discussions

3.1. The Distributions of the GW Potential Energy over the Two Hemispheres

The activity of GW can be expressed by the potential energy per unit mass ( E p = 1 2 N 2 ξ 2 1 2 ( g N ) 2 ( T T 0 ) 2 ) [32,33]. The value of Ep is variable throughout the day and usually increases with altitude [34,35]. Figure 1 shows the GW zonal mean potential energy distribution from 40 days before the summer solstice to 80 days after the solstice in the NH PMC seasons from 2007–2014. The overall GW activity was frequent in the early period (e.g., within 40 days after the solstice), and gradually weakened in the later period. It can be found that the averaged GW in 2009 was the weakest of the eight seasons, with a mean value of 32.23 J/kg. The GW values in 2008 and 2013 were close to that in 2009, with 32.83 J/kg for 2008 and 32.31 J/kg for 2013. The GW activity was stronger in 2007, 2012, and 2014 among the eight seasons, with the peak energy density exceeding 40 J/kg. Especially, GW was strongest in 2014, with a peak energy density of 46.75 J/kg.
Figure 2 shows the GW potential energy distribution for the PMC seasons from 2007/2008 to 2014/2015 over SH. Among the eight PMC seasons in the SH, the averaged GW value in 2008/2009 was the weakest, with a mean value of 34.87 J/kg. The GW activity was strong during the other seven seasons in SH, with a peak energy density exceeding 40 J/kg. In contrast, the GW activity was mainly frequent in the late periods (e.g., about 55 days after the solstice) in the SH. This discrepancy indicates a different influence of GW on the formation of PMCs between the NH and SH.

3.2. The Distributions of the Ice Water Content (IWC)

In this section, we compare the GW potential energy with the IWC distributions annually. The IWC data are retrieved from the CIPS Level 3c Summary Files [7], and the daily average value is performed at latitudes between 30° and 89° of the Earth with a grid of 1°. The latitude grid (LAT_GRID) contains the observation range from 30° to 150° (excluding 90°) with a step of 1°, where LAT_GRID > 90° corresponds to the ascending node and LAT_GRID < 90° corresponds to the descending node. The observed LAT_GRID of the 60°–110° grid is chosen for this study, and this grid includes the same latitude of the NH and SH to distinguish between ascending and descending nodes of the orbit.
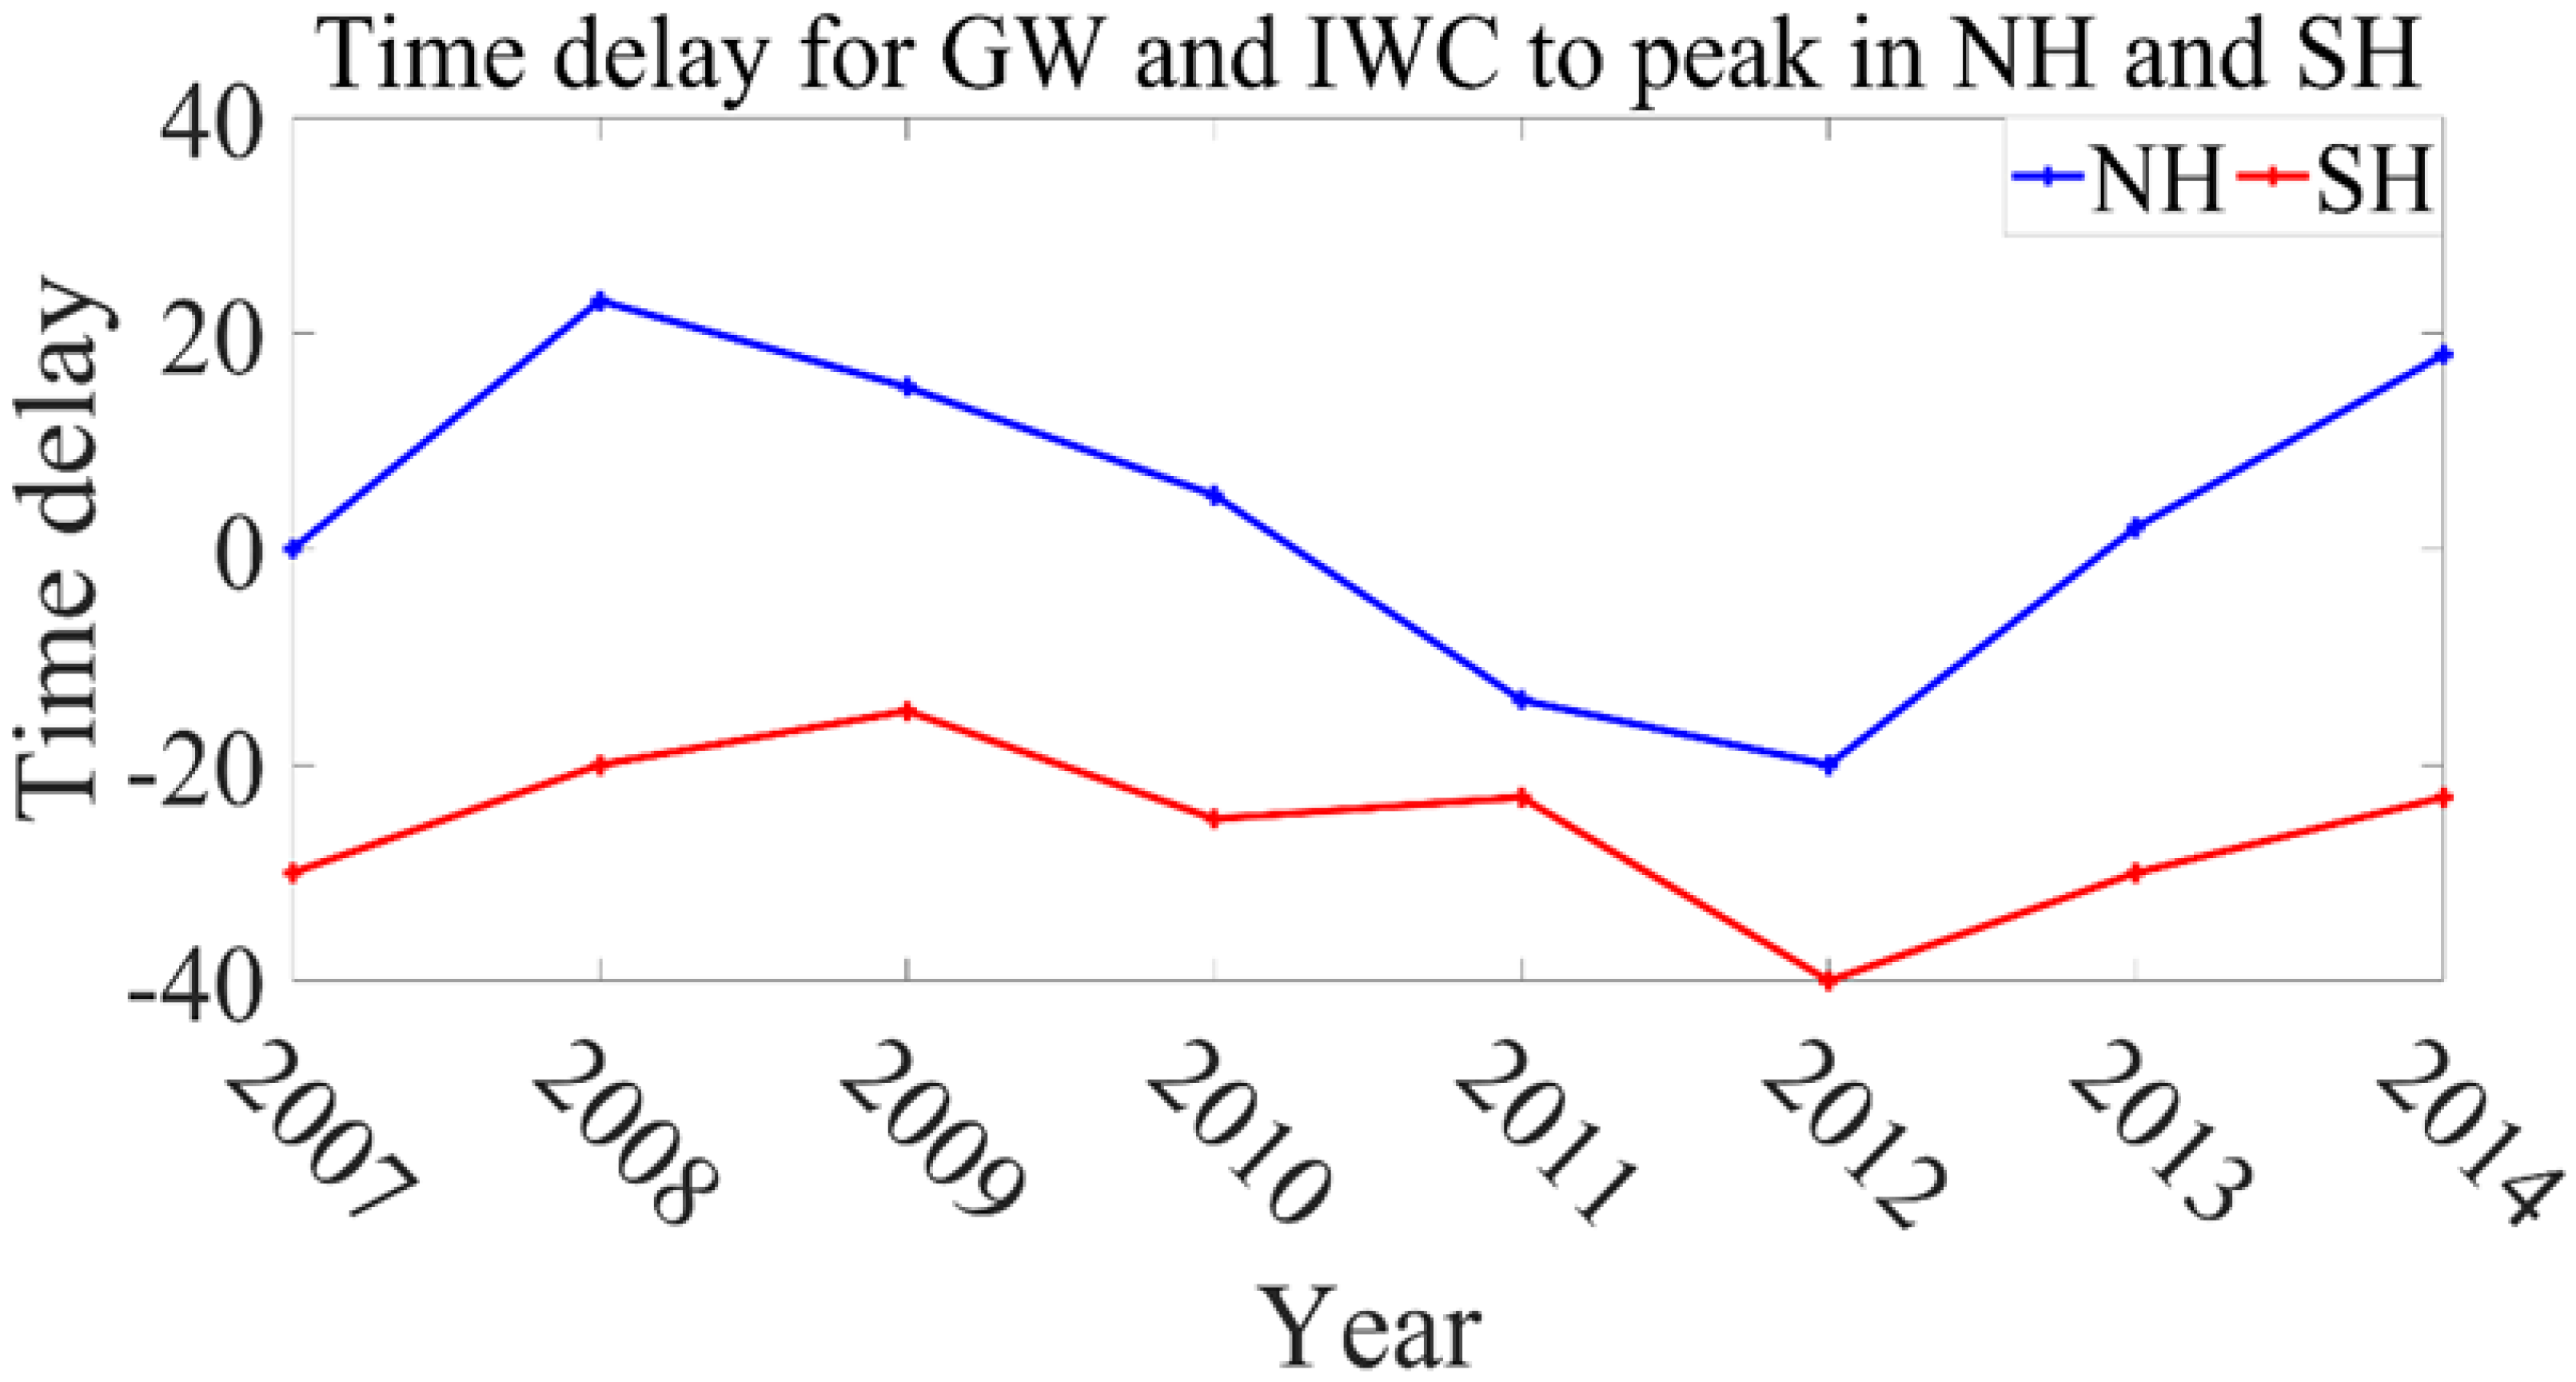
Figure 3 shows the distribution of daily averaged IWC during the PMC seasons (e.g., from 20 days before the summer solstice to 60 days after the solstice) from 2007 to 2014 in NH. It can be observed that the IWC increased rapidly in the early periods of the eight seasons. More details of the time delay for each PMC season are plotted in Figure 4. Compared with Figure 1, in 6/8 seasons (e.g., 2007, 2008, 2009, 2010, 2013, and 2014), the GW activity and IWC variations were more synchronous. During these six seasons, when the GW activity reached its peak value, the IWC would increase and peak within 0–23 days.
Figure 5 shows the distribution of IWC in the SH during the PMC seasons from 2007/2008 to 2014/2015. Compared with Figure 2, the GW activities in the SH were mainly concentrated in the late periods of the PMC seasons. Among them, in three seasons (e.g., 2009/2010, 2012/2013, and 2014/2015) the GW activity was the most frequent, and the corresponding IWC varied more dramatically. The time delay for GW and IWC in the SH is also plotted in Figure 4. In the eight PMC seasons in the SH, GW peaked around 55 days after the summer solstice. Except for the 2012/2013 and 2013/2014 seasons, the IWC in the other six seasons increased about 20 days after the summer solstice. In all eight seasons, the IWC started to increase ahead of GW activity. Taking the 2009/2010 PMC season as an example, the IWC increased rapidly and peaked at 25–30 days after the solstice, and then gradually decreased until the end of the season. On the contrary, the GW increased and peaked about 55 days after the solstice. In the 2012/2013 and 2013/2014 seasons, the IWC began to increase even earlier than the solstice, but the GW activity peaked around 55 days after the solstice. This result indicates that the variations of IWC in the SH are unlikely to be driven by the GW activities during the PMC seasons.
In addition, the PMC ice particle radius also shows the difference between the NH and SH. A comparison of the radius distributions for the PMC seasons from 2007 to 2010 in the NH and 2007/2008 to 2010/2011 in the SH is shown in the following result. Figure 6a shows the daily average of the particle radius for the NH, and 6b shows the daily average radius for the SH. It can be found that in the SH seasons, the variation in particle size was significantly larger than that in the NH. The maximum particle radius in the SH could reach 56.08 nm in 2010/2011, with a variation amplitude of 21.81 nm during the same season. In the NH, the particle radius peaked at 52.97 nm in 2013, and the largest difference in particle size between seasons was 17 nm. Compared with the distribution of GW activity in the NH and SH from Figure 1 and Figure 2, it can be seen that the variation of GW activity was small during the PMC seasons in the NH. The result indicates that under the inactive action of GW, the particle radius in the NH changed only very slightly. In contrast, the variation of GW activity in the SH was more obvious, which might have some influence on the particle size variations.

3.3. The Distributions of the Albedo of the PMCs

In this section, the cloud albedo data from CIPS is used to support our results. In the previous data versions, only three thresholds were used: 1, 2, and 5 G, with the symbol “G” denoting the base albedo unit from CIPS. In CIPS Level 3c v5.20 data, the albedo threshold was greatly expanded to cover the entire range from 1 to 35 G in the unit step of 1 G. Using a lower albedo threshold would lead to incomplete observational results and reduce the reliability of the results [7], while using higher thresholds could ensure that more reliable observations are obtained, with fainter clouds ignored. Therefore, the albedo of 10 G was selected, which allowed a complete mapping of the IWC distribution throughout the PMC seasons without missing too many signals.
Figure 7 and Figure 8 show the albedo distributions for the PMC seasons from 2007 to 2014 in the NH and 2007/2008 to 2014/2015 in the SH, respectively. Comparing the cloud albedo with the IWC distribution, it can be found that with the 10 G albedo threshold, the results are comprehensive for the cloud volume and cloud range. In the albedo plot in 2009 for the NH, observations from the ascending node exhibited cloud formation, with rapid growth around 20 and 35 days after the summer solstice. In addition, the descending node results showed that clouds were already present around 10 days after the summer solstice. During the PMC season of 2007/2008 in the SH, the observations of the ascending node show that 30–35 days after the summer solstice, the cloud grew rapidly in the range of 88°–92° for 5 days. The results of the descending node show that the cloud peaked 18 days before the summer solstice, distributed at 84°–85° for 40 days. In the 30–35 days after the summer solstice, the latitude distribution of clouds expanded, ranging from 81° to 84°.
In addition, the GW distribution is compared with the albedo plot annually. The GW in 2009 was the weakest among the eight PMCs in the NH, with a mean value of 32.23 J/kg. The results of IWC show that there were obvious clouds in the range of 82°–83°, with a peak content of more than 250 g/km2. The albedo observations show that there were prominent clouds in 2009, and the cloud amount and cloud distribution range were significantly different from other seasons in the NH.
For the SH, it can be seen from Figure 2 that the GW activity in 2008/2009 was the weakest among the eight seasons. In the case of weak GW activity, the cloud amount had a significant increase. At the same time, the albedo distribution shows that the clouds in the 2008/2009 season were more concentrated and pronounced than those in the 2010/2011, 2011/2012, 2013/2014, and 2014/2015 seasons.
It is worth noting that there are some inconsistencies between GW activity and PMC in individual years, especially in the 2009 PMC season in the NH and the 2007/2008 season in the SH. In both seasons, the intensity of GW activity was the lowest, while the cloud continued to peak with the longest duration of up to 40 days. The IWC and albedo observations show there was no obvious delayed time between the GW activity and PMC formation. For example, the GW in the NH in 2009 peaked 40 days after the summer solstice. In the observations during the declining node, the IWC increased rapidly and peaked 20 days before the GW peak. Furthermore, in 6/8 PMC seasons in the SH, the clouds started to increase ahead of GW activities. Additionally, the effect of GW activity on cloud formation and variation was inconsistent during these seasons. This discrepancy could be possibly explained by the mesosphere circulation. During the solar minimum, water vapor increased by about 30% around the PMC altitude, and the temperature decreased by about 5K, reaching the nucleation condition in the early stage of the PMC season [36]. It can be found from Figure 5 that the water vapor accumulated near 83° during the 2007/2008 PMC season in the SH. The average IWC content reached 241.166 g/km2 from 18 days before the summer solstice to 20 days after the solstice, which might meet the nucleation conditions in the early stage of the PMC season. Therefore, the formation of clouds could be observed in the distribution of albedo. In Figure 8, we can see that the average albedo of this season reached 39.73 × 10⁻⁶ sr−1 from 18 days before the summer solstice to 20 days after the solstice. The clouds existed and lasted for nearly 40 days. The average particle size was 40.46 nm during this period, which was significantly smaller than the average value for the eight seasons in the SH with 42.37 nm. In comparison, from Figure 3, the average content of IWC reached 252.60 g/km2 from 20 days to 60 days after the summer solstice in the 2009 PMC season in the NH. The albedo results showed that although a large amount of water vapor was accumulated in this season, only a small amount of cloud was observed. As we know, in the main stage of the sudden stratospheric warming event in 2008–2009, the zonal wind reversed and inhibited the upward propagation of gravity waves [37]. At the same time, the observation results of mean mesospheric temperature show that the polar stratospheric top of the NH increased significantly during the recovery of the polar vortex (19–20 February 2009) [38], while Figure 1 obviously shows that the GW activity in 2009 in the NH was weak. The inability of GW to propagate upward and the increase in the stratospheric top would prevent water vapor from reaching nucleation conditions during the 2009 PMC season. Therefore, in the albedo distribution of Figure 7, only a small amount of cloud existed in this season.

4. Conclusions and Outlook

In this research, we analyze the GW energy density, IWC distribution, particle radius, and cloud albedo data for a combined total of 16 PMC seasons in the NH from 2007 to 2014 and the SH from 2007/2008 to 2014/2015, based on observations from SOFIE and CIPS onboard the AIM satellite. The influence of GW activity on the formation of PMCs is studied by hemispheric contrast. In the NH, the IWC varies from 92.41 to 171.33 g/km2, with an average of 110.09 ± 26.08 g/km2. The radius of the PMCs is 42.3517 ± 0.92628 nm. The observed albedo results show that the latitudinal distribution of the PMC ranges from 75° to 85° and lasts 20–35 days. The GW energy density is on average 39.6 ± 6.6 J/kg. The GW flux generally starts to increase significantly around the summer solstice during the eight PMC seasons in the NH. In 6/8 of these seasons, e.g., in 2007, 2008, 2009, 2010, 2013, and 2014, the IWC content is positively correlated with the variation of GW. During these five seasons, when the GW activity is enhanced to reach the maximum, the IWC will start to increase and reach the peak after 0–23 days. In comparison, the IWC in the eight PMC seasons in the Southern Hemisphere (SH) ranges from 73.27 g/km2 to 165.22 g/km2, with an average of 101.68 ± 29.82 g/km2. The mean particle size is 42.37 ± 1.17 nm for the SH. The PMCs range more widely, with latitudes from 70° to 85° and a duration of 25–45 days. The GW energy density is 43.65 ± 4.56 J/kg, and the GW peaks around 55 days after the solstice. The timing of PMC appearance also varies, with the IWC starting to grow 20 days after the solstice and the GW increasing 55 days after the solstice. In particular, the IWC starts even earlier than the solstice in the seasons of 2012/2013 and 2013/2014. This study reveals the Northern and Southern Hemisphere differences in PMCs from the influence of GW, which is important for understanding the morphological characteristics of PMCs.
However, there is no in-depth study on the inconsistency of time scales between the PMC and GW activities. Subsequent studies can start with the time delay of cloud and GW variations in the SH, combined with more observational data such as temperature wind field results. Further study could possibly focus on the PMC formation in several seasons such as 2011/2012 to 2014/2015 in the SH.

Author Contributions

Conceptualization, S.Q. and X.D.; funding acquisition, S.Q.; methodology, N.W., W.S. and V.M.V.H.; project administration, S.Q., X.D. and C.Y.; software, W.S.; supervision, S.Q. and C.Y.; validation, N.W. and V.M.V.H.; visualization, N.W.; writing—original draft, S.Q., N.W. and W.S. All authors have read and agreed to the published version of the manuscript.

Funding

This work is supported by the National Natural Science Foundation of China (NO. 41974178), and the fund from the State Key Laboratory of Loess and Quaternary Geology, Institute of Earth Environment, CAS (NO. SKLLOG2007).

Institutional Review Board Statement

Not applicable.

Informed Consent Statement

Not applicable.

Data Availability Statement

The gravity wave (GW) data comes from the Solar Occultation For Ice Experiment (SOFIE) onboard the AIM satellite (http://sofie.gats-inc.com/getdata_gw), accessed on 10 February 2023. The ice water content (IWC), albedo and particle size data are from the Cloud Imaging and Particle Size (CIPS) observations (https://lasp.colorado.edu/aim/download/pmc/l3c), accessed on 10 February 2023.

Acknowledgments

We acknowledge the data usage from SOFIE and CIPS onboard AIM. The authors would like to thank Wuhu Feng from Leeds University for his useful suggestions on our manuscript.

Conflicts of Interest

The authors declare no conflict of interest.

References

  1. Leslie, R.C. Sky Glows. Nature 1885, 32, 245. [Google Scholar] [CrossRef] [Green Version]
  2. Thomas, G.E. Solar Mesosphere Explorer measurements of polar mesospheric clouds (noctilucent clouds). J. Atmos. Terr. Phys. 1984, 46, 819–824. [Google Scholar] [CrossRef]
  3. Balsley, B.; Ecklund, W.; Fritts, D. VHF echoes from the high-latitude mesosphere and lower thermosphere: Observations and interpretations. J. Atmos. Sci. 1983, 40, 2451–2466. [Google Scholar] [CrossRef]
  4. Gerrard, A.J.; Kane, T.J.; Thayer, J.P. Noctilucent clouds and wave dynamics: Observations at Sondrestrom, Greenland. Geophys. Res. Lett. 1998, 25, 2817–2820. [Google Scholar] [CrossRef]
  5. Kaifler, N.; Baumgarten, G.; Fiedler, J.; Latteck, R.; Lübken, F.-J.; Rapp, M. Coincident measurements of PMSE and NLC above ALOMAR (69° N, 16° E) by radar and lidar from 1999–2008. Atmos. Meas. Tech. 2011, 10, 1355–1366. [Google Scholar] [CrossRef] [Green Version]
  6. Stevens, M.H.; Deaver, L.E.; Hervig, M.E.; Russell, J.M.; Siskind, D.E.; Sheese, P.E.; Llewellyn, E.J.; Gattinger, R.L.; Höffner, J.; Marshall, B.T. Validation of upper mesospheric and lower thermospheric temperatures measured by the Solar Occultation for Ice Experiment. J. Geophys. Res. Atmos. 2012, 117, 304. [Google Scholar] [CrossRef] [Green Version]
  7. Thomas, G.E.; Lumpe, J.; Bardeen, C.; Randall, C.E. Albedo-Ice Regression method for determining ice water content of polar mesospheric clouds using ultraviolet observations from space. Atmos. Meas. Tech. 2019, 12, 1755–1766. [Google Scholar] [CrossRef] [Green Version]
  8. Thomas, G.E. Mesospheric clouds and the physics of the mesopause region. Rev. Geophys. 1991, 29, 553–575. [Google Scholar] [CrossRef]
  9. Bu, L.B.; Zhang, Z.Y.; Gao, H.Y. Characteristics of perturbations induced by small-scale gravity waves on ice particle size dis-tribution of noctilucent clouds. Chin. J. Geophys. 2016, 59, 12. [Google Scholar] [CrossRef]
  10. Thurairajah, B.; Sato, K.; Yue, J.; Nakamura, T.; Kohma, M.; Bailey, S.M.; Russell, J.M. Simultaneous observation of gravity waves at PMC altitude from AIM/CIPS experiment and PANSY radar over Syowa (69° S, 39° E). J. Atmos. Solar-Terr. Phys. 2017, 164, 324–331. [Google Scholar] [CrossRef]
  11. Chen, D.; Chen, Z.; Lü, D. Simulation of the stratospheric gravity waves generated by the Typhoon Matsa in 2005. Sci. China Earth Sci. 2011, 55, 602–610. [Google Scholar] [CrossRef]
  12. Chen, D.; Chen, Z.; Lu, D. Spatiotemporal spectrum and momentum flux of the stratospheric gravity waves generated by a typhoon. Sci. China Earth Sci. 2012, 56, 54–62. [Google Scholar] [CrossRef]
  13. Kirkwood, S.; Cho, J.; Hall, C.; Hoppe, U.-P.; Murtagh, D.; Stegman, J.; Swartz, W.; van Eyken, A.; Wannbergt, G.; Witt, G. A comparison of PMSE and other ground-based observations during the NLC-91 campaign. J. Atmos. Terr. Phys. 1995, 57, 35–44. [Google Scholar] [CrossRef]
  14. Rapp, M.; Lübken, F.; Müllemann, A.; Thomas, G.E.; Jensen, E.J. Small-scale temperature variations in the vicinity of NLC: Experimental and model results. J. Geophys. Res. Atmos. 2002, 107, AAC 11-1–AAC 11-20. [Google Scholar] [CrossRef]
  15. Gerrard; Andrew; Thayer, J.; Kane, T. Mesospheric clouds and the duality of gravity waves. Eos 2002, 83, 488. [Google Scholar] [CrossRef] [Green Version]
  16. Chandran, A.; Rusch, D.W.; Merkel, A.W.; Palo, S.E.; Thomas, G.E.; Taylor, M.J.; Bailey, S.M.; Russell, J.M. Polar mesospheric cloud structures observed from the cloud imaging and particle size experiment on the Aeronomy of Ice in the Mesosphere spacecraft: Atmospheric gravity waves as drivers for longitudinal variability in polar mesospheric cloud occurrence. J. Geophys. Res. Atmos. 2010, 115, D13102. [Google Scholar] [CrossRef] [Green Version]
  17. Czechowsky, P.; Rüster, R.; Schmidt, G. Variations of mesospheric structures in different seasons. Geophys. Res. Lett. 1979, 6, 459–462. [Google Scholar] [CrossRef]
  18. Ecklund, W.L.; Balsley, B.B. Long-term observations of the Arctic mesosphere with the MST radar at Poker Flat, Alaska. J. Geophys. Res. Atmos. 1981, 86, 7775–7780. [Google Scholar] [CrossRef]
  19. Dowdy, A.; Vincent, R.A.; Igarashi, K.; Murayama, Y.; Murphy, D.J. A comparison of mean winds and gravity wave activity in the northern and southern polar MLT. Geophys. Res. Lett. 2001, 28, 1475–1478. [Google Scholar] [CrossRef] [Green Version]
  20. Bailey, S.M.; Merkel, A.W.; Thomas, G.E.; Rusch, D.W. Hemispheric differences in Polar Mesospheric Cloud morphology observed by the Student Nitric Oxide Explorer. J. Atmos. Solar-Terr. Phys. 2007, 69, 1407–1418. [Google Scholar] [CrossRef]
  21. Gerrard, A.J.; Kane, T.J.; Thayer, J.P.; Eckermann, S. Concerning the upper stratospheric gravity wave and mesospheric cloud relationship over Sondrestrom, Greenland. J. Atmos. Solar-Terr. Phys. 2004, 66, 229–240. [Google Scholar] [CrossRef]
  22. Gerrard, A.J.; Kane, T.J.; Thayer, J.P.; Eckermann, S.D. Gravity waves and mesospheric clouds in the summer middle atmosphere: A comparison of lidar measurements and ray modeling of gravity waves over Sondrestrom, Greenland. J. Geophys. Res. Atmos. 2004, 109, 103. [Google Scholar] [CrossRef]
  23. Thayer, J.P.; Rapp, M.; Gerrard, A.J.; Gudmundsson, E.; Kane, T.J.; Rapp, M. Gravity-wave influences on Arctic mesospheric clouds as determined by a Rayleigh lidar at Sondrestrom, Greenland. J. Geophys. Res. Atmos. 2003, 108, 8449. [Google Scholar] [CrossRef]
  24. Innis, J.L.; Klekociuk, A.R.; Morris, R.J.; Cunningham, A.P.; Graham, A.D.; Murphy, D.J. A study of the relationship between stratospheric gravity waves and polar mesospheric clouds at Davis Antarctica. J. Geophys. Res. Atmos. 2008, 113, 102. [Google Scholar] [CrossRef] [Green Version]
  25. Russell, J.M.; Bailey, S.M.; Gordley, L.L.; Rusch, D.W.; Horányi, M.; Hervig, M.E.; Thomas, G.E.; Randall, C.E.; Siskind, D.E.; Stevens, M.H.; et al. The Aeronomy of Ice in the Mesosphere (AIM) mission: Overview and early science results. J. Atmos. Solar-Terr. Phys. 2009, 71, 289–299. [Google Scholar] [CrossRef]
  26. McClintock, W.; Rusch, D.W.; Thomas, G.; Merkel, A.; Lankton, M.; Drake, V.; Bailey, S.; Russell, J. The cloud imaging and particle size experiment on the Aeronomy of Ice in the mesosphere mission: Instrument concept, design, calibration, and on-orbit performance. J. Atmos. Solar-Terr. Phys. 2009, 71, 340–355. [Google Scholar] [CrossRef]
  27. Gordley, L.; Hervig, M.; Russell, J. The Solar Occultation for Ice Experiment (SOFIE): In-Orbit Performance and Initial Results. AGU Fall Meet. Abstr. 2007, 2007, SA14A-03. [Google Scholar]
  28. Lumpe, J.; Bailey, S.; Carstens, J.; Randall, C.; Rusch, D.; Thomas, G.; Nielsen, K.; Jeppesen, C.; McClintock, W.; Merkel, A.; et al. Retrieval of polar mesospheric cloud properties from CIPS: Algorithm description, error analysis and cloud detection sensitivity. J. Atmos. Solar-Terr. Phys. 2013, 104, 167–196. [Google Scholar] [CrossRef]
  29. Hervig, M.E.; Gordley, L.L.; Deaver, L.E.; Siskind, D.E.; Stevens, M.H.; Russell, J.M.; Bailey, S.M.; Megner, L.; Bardeen, C.G. First Satellite Observations of Meteoric Smoke in the Middle Atmosphere. Geophys. Res. Lett. 2009, 36, 805. [Google Scholar] [CrossRef]
  30. Hervig, M.E.; Stevens, M.H.; Gordley, L.L.; Deaver, L.E.; Russell, J.M.; Bailey, S.M. Relationships between polar mesospheric clouds, temperature, and water vapor from Solar Occultation for Ice Experiment (SOFIE) observations. J. Geophys. Res. Atmos. 2009, 114, 203. [Google Scholar] [CrossRef]
  31. Gao, H.; Shepherd, G.G.; Tang, Y.; Bu, L.; Wang, Z. Double-layer structure in polar mesospheric clouds observed from SOFIE/AIM. Ann. Geophys. 2017, 35, 295–309. [Google Scholar] [CrossRef] [Green Version]
  32. Tsuda, T.; Nishida, M.; Rocken, C.; Ware, R.H. A Global Morphology of Gravity Wave Activity in the Stratosphere Revealed by the GPS Occultation Data (GPS/MET). J. Geophys. Res. Atmos. 2000, 105, 7257–7273. [Google Scholar] [CrossRef]
  33. Wilson, R.; Chanin, M.L.; Hauchecorne, A. Gravity waves in the middle atmosphere observed by Rayleigh lidar: 2. Climatology. J. Geophys. Res. Atmos. 1991, 96, 5169. [Google Scholar] [CrossRef]
  34. Cai, X.; Yuan, T.; Liu, H.-L. Large-scale gravity wave perturbations in the mesopause region above Northern Hemisphere midlatitudes during autumnal equinox: A joint study by the USU Na lidar and Whole Atmosphere Community Climate Model. Ann. Geophys. 2017, 35, 181–188. [Google Scholar] [CrossRef] [Green Version]
  35. Zhao, W.; Hu, X.; Pan, W.; Yan, Z.; Guo, W. Mesospheric Gravity Wave Potential Energy Density Observed by Rayleigh Lidar above Golmud (36.25° N, 94.54° E), Tibetan Plateau. Atmosphere 2022, 13, 1084. [Google Scholar] [CrossRef]
  36. Hervig, M.; Siskind, D. Decadal and inter-hemispheric variability in polar mesospheric clouds, water vapor, and temperature. J. Atmos. Solar-Terr. Phys. 2006, 68, 30–41. [Google Scholar] [CrossRef]
  37. Liu, H.-L.; Roble, R.G. A study of a self-generated stratospheric sudden warming and its mesospheric-lower thermospheric impacts using the coupled TIME-GCM/CCM3. J. Geophys. Res. Atmos. 2002, 107, ACL 15-1–ACL 15-18. [Google Scholar] [CrossRef]
  38. Orsolini, Y.J.; Urban, J.; Murtagh, D.P.; Lossow, S.; Limpasuvan, V. Descent from the polar mesosphere and anomalously high stratopause observed in 8 years of water vapor and temperature satellite observations by the Odin Sub-Millimeter Radiometer. J. Geophys. Res. Atmos. 2010, 115, D12305. [Google Scholar] [CrossRef] [Green Version]
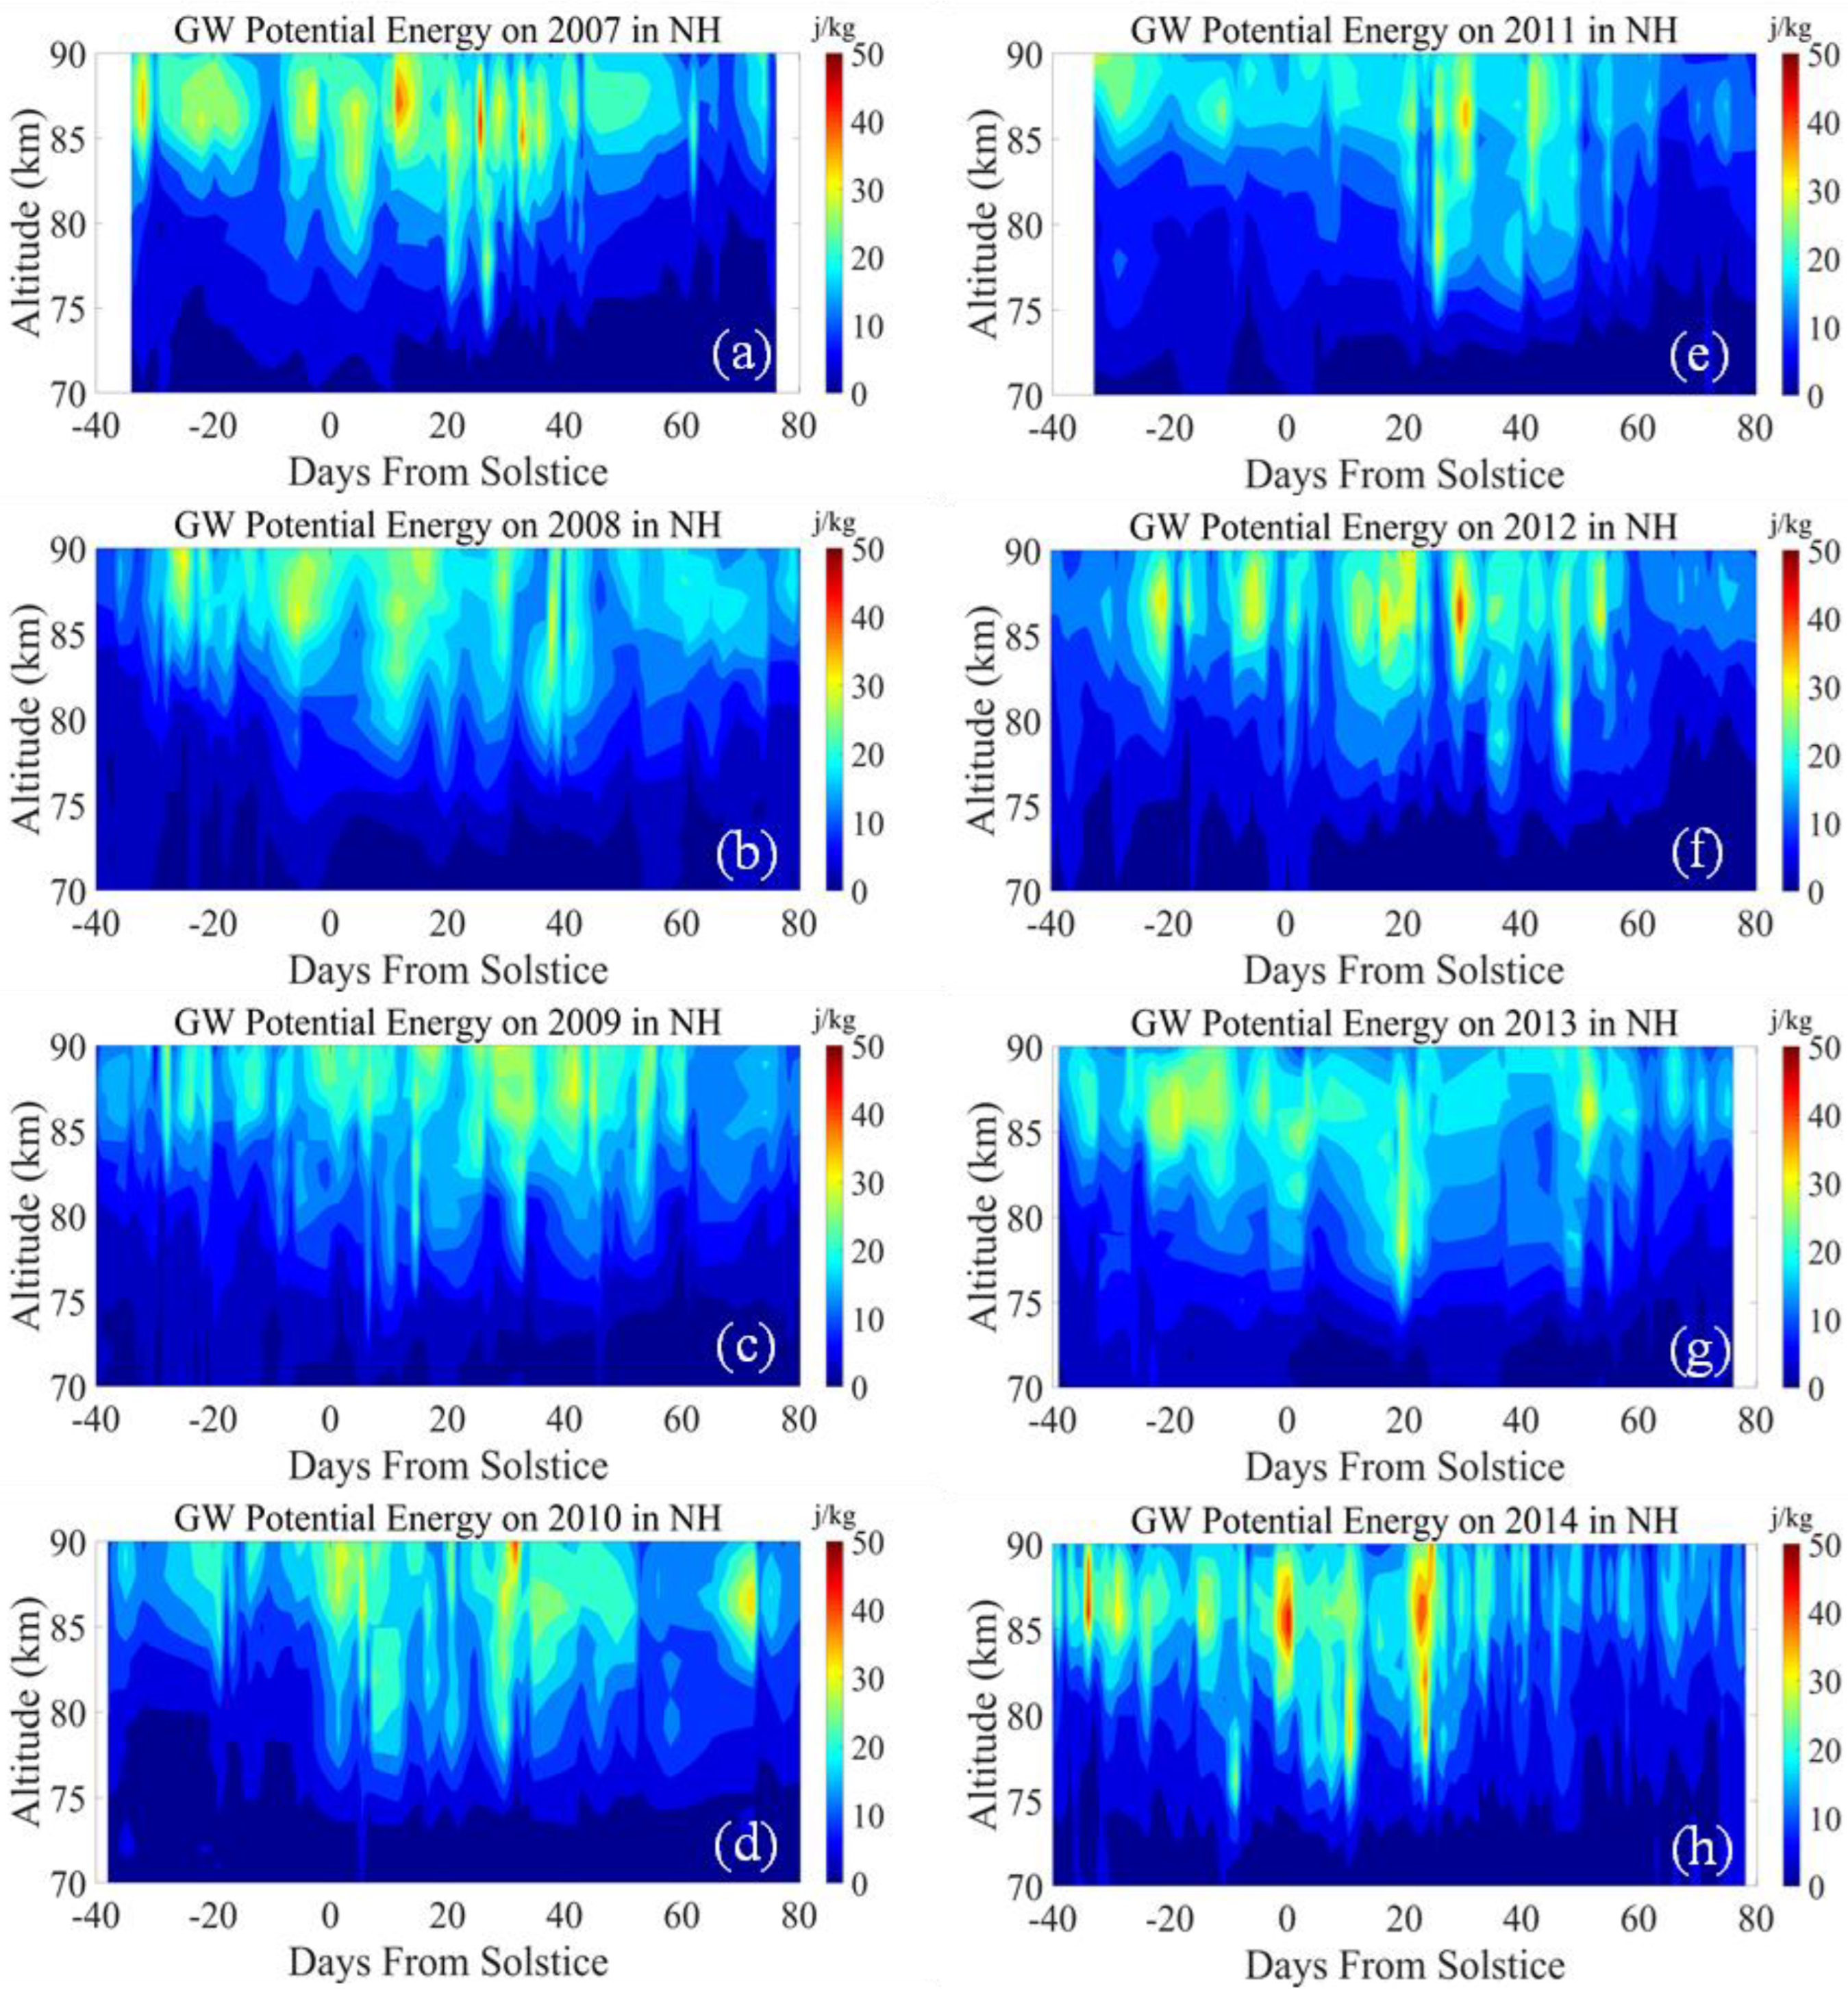
Figure 1. The GW potential energy distribution in the NH PMC seasons from 2007 to 2014. (a) GW potential energy on 2007 PMC season; (b) GW potential energy on 2008 PMC season; (c) GW potential energy on 2009 PMC season; (d) GW potential energy on 2010 PMC season; (e) GW potential energy on 2011 PMC season; (f) GW potential energy on 2012 PMC season; (g) GW potential energy on 2013 PMC season; (h) GW potential energy on 2014 PMC season.
Atmosphere 14 00419 g001
Figure 2. The GW potential energy distribution in the SH PMC seasons from 2007/2008 to 2014/2015. (a) GW potential energy on 2007/2008 PMC season; (b) GW potential energy on 2008/2009 PMC season; (c) GW potential energy on 2009/2010 PMC season; (d) GW potential energy on 2010/2011 PMC season; (e) GW potential energy on 2011/2012 PMC season; (f) GW potential energy on 2012/2013 PMC season; (g) GW potential energy on 2013/2014 PMC season; (h) GW potential energy on 2014/2015 PMC season.
Atmosphere 14 00419 g002
Figure 3. The distribution of daily averaged IWC during the PMC seasons from 2007 to 2014 in NH. (a) IWC on 2007 PMC season; (b) IWC on 2008 PMC season; (c) IWC on 2009 PMC season; (d) IWC on 2010 PMC season; (e) IWC on 2011 PMC season; (f) IWC on 2012 PMC season; (g) IWC on 2013 PMC season; (h) IWC on 2014 PMC season.
Atmosphere 14 00419 g003
Figure 4. The time delay of the peak time for GW and IWC on each PMC season in NH (blue line) and SH (red line). In 6/8 seasons of NH, when the GW activity reached its peak value, the IWC would increase and peak within 0–23 days. Yet in all 8 seasons of SH, the IWC started to increase ahead of GW activity.
Atmosphere 14 00419 g004
Figure 5. The distribution of daily averaged IWC during the PMC seasons from 2007/2008 to 2014/2015 in SH. (a) IWC on 2007/2008 PMC season; (b) IWC on 2008/2009 PMC season; (c) IWC on 2009/2010 PMC season; (d) IWC on 2010/2011 PMC season; (e) IWC on 2011/2012 PMC season; (f) IWC on 2012/2013 PMC season; (g) IWC on 2013/2014 PMC season; (h) IWC on 2014/2015 PMC season.
Atmosphere 14 00419 g005
Figure 6. The particle radius distributions for the PMC seasons from 2007 to 2010 in NH (a) and 2007/2008 to 2010/2011 in SH (b).
Atmosphere 14 00419 g006
Figure 7. The cloud albedo distributions of the PMC seasons from 2007 to 2014 in the NH. (a) Cloud albedo on 2007 PMC season; (b) Cloud albedo on 2008 PMC season; (c) Cloud albedo on 2009 PMC season; (d) Cloud albedo on 2010 PMC season; (e) Cloud albedo on 2011 PMC season; (f) Cloud albedo on 2012 PMC season; (g) Cloud albedo on 2013 PMC season; (h) Cloud albedo on 2014 PMC season.
Atmosphere 14 00419 g007
Figure 8. The cloud albedo distributions of the PMC seasons from 2007/2008 to 2014/2015 in the SH. (a) Cloud albedo on 2007/2008 PMC season; (b) Cloud albedo on 2008/2009 PMC season; (c) Cloud albedo on 2009/2010 PMC season; (d) Cloud albedo on 2010/2011 PMC season; (e) Cloud albedo on 2011/2012 PMC season; (f) Cloud albedo on 2012/2013 PMC season; (g) Cloud albedo on 2013/2014 PMC season; (h) Cloud albedo on 2014/2015 PMC season.
Atmosphere 14 00419 g008
Disclaimer/Publisher’s Note: The statements, opinions and data contained in all publications are solely those of the individual author(s) and contributor(s) and not of MDPI and/or the editor(s). MDPI and/or the editor(s) disclaim responsibility for any injury to people or property resulting from any ideas, methods, instructions or products referred to in the content.