Article

Key Factors of the Strong Cold Wave Event in the Winter of 2020/21 and Its Effects on the Predictability in CMA-GEPS

1
Guangdong Meteorological Observatory, Guangzhou 510080, China
2
Center for Earth System Modeling and Prediction of CMA (CEMC), Beijing 100081, China
3
Guangzhou Meteorological Observatory, Guangzhou 511430, China
4
Plateau Atmospheric and Environment Laboratory of Sichuan Province, School of Atmospheric Sciences, Chengdu University of Information Technology, Chengdu 610225, China
*
Author to whom correspondence should be addressed.
Atmosphere 2023, 14(3), 564; https://doi.org/10.3390/atmos14030564
Submission received: 12 February 2023 / Revised: 5 March 2023 / Accepted: 14 March 2023 / Published: 16 March 2023
(This article belongs to the Special Issue Extreme Weather Events and Atmospheric Circulation)

Abstract

:
During the 2020/2021 winter season, three nationwide cold waves took place from 28 to 31 December 2020, as well as from 5 to 8 January and 14 to 17 January 2021. These cold waves resulted in extreme cold weather in northern and eastern China. In this study, the common features of these cold waves were analyzed, and the key factors contributing to cold waves were illustrated, and the performance of the CMA-GEPS numerical model was evaluated in predicting the cooling effect of the cold waves, and its predictability source was discussed. The results indicated that the cold waves were caused by synergistic effects in the mid- to high-latitude atmospheric circulation of both the upper and lower atmosphere, including polar vortex splitting, enhancement of blocking high, and increased meridional circulation anomaly in the Siberian high area. During the time of cold waves, the mid- to high-latitude atmospheric circulation was undergoing low-frequency adjustment, with the Arctic oscillation continuously weakening, while the blocking high and Siberian high gradually increased to historically high-intensity states. The outbreaks of the three cold waves occurred at the peak and declining points of the blocking high and Siberian high, respectively, acting as short- to medium-term forecast factors. The CMA-GEPS model demonstrated high forecasting ability for the cooling of the cold waves due to its ability to accurately predict the evolution of the Siberian high and blocking high prior to and after the cold wave with a long lead time. Predictability analysis suggested the strong variability of key factors (such as the Siberian high and blocking) in cold wave events may benefit the model’s prediction of cold wave events. These findings contribute to the understanding of the physical mechanisms behind cold waves and the potential for improved forecasting of extreme cold weather events.

1. Introduction

As defined by Zhu et al. [1], a cold wave is a natural weather phenomenon that rapidly intensifies under certain weather conditions and causes widespread severe cooling, strong winds, snowfall, and freezing weather in mid to low latitude regions. The occurrence and spread of cold waves can result in significant losses along the way. For example, during the winter of 2020–2021, China was seriously affected by a cold air outbreak, and many regions experienced record-low temperatures. There were eight cold weather events in East Asia, three of which were the strong cold wave events from 28 December 2020 to 31 December 2020, 5 January to 8 January 2021, and 14 January to 17 January 2021, which resulted in severe cold weather in the region. Due to the cold wave, strong winds and cooling weather were experienced in most of the eastern regions of China, affecting a wide range of areas from North China to South China, accompanied by snowfall. The cold wave process caused varying degrees of frost damage to some open-field vegetables and economically-timbered fruit. The agricultural and pastoral production in northern Xinjiang, northeastern China, and eastern Inner Mongolia was also affected [2]. Thus, the study of the causes and forecasts of cold waves has always been an important topic in the field of weather services.
Cold waves affecting China originated from the mid to high latitudes and have been studied by many Chinese researchers. The Siberian High, the Ural Mountain blocking high, and the polar vortex have been identified as key factors in causing extreme cold events. Research shows that the intensity of the Siberian High and the winter temperature in China are negatively correlated [3,4,5,6], making it the most direct factor in cold wave outbreaks. The development and collapse of the Ural blocking high can impact the direction of the large-scale trough, as well as the development of the Siberian High, leading to low-level cold advection [7,8]. The Ural Mountains high ridge and its southeast low pressure trough can also contribute to the splitting of the polar vortex and the southward invasion of cold air [9]. Blocking high has the ability to block upstream fluctuations and maintain a stable situation for a long time, leading to severe weather anomalies and meteorological disasters [10]. Therefore, for a strong cold wave event, the synergistic effect of the upper and lower atmospheric layers is crucial, and extreme low temperature events usually occur in the context of combined anomalies of different layers of the atmosphere [11].
Several scholars have conducted comparisons on the differences in mid- and high-latitude atmospheric circulation anomalies, corresponding to the three cold wave events that took place during the winter of 2020/2021, obtaining some meaningful results [12,13,14,15,16,17]. These studies either compared several cold wave events to identify their differences in formation mechanisms [12,13,14], or they linked the cold wave events to external forcing factors, such as stratospheric sudden warming, La Nina sea surface temperature anomalies, and the KESS sea ice area [15,16,17]. However, few studies have explored the common features of high-latitude circulation in these events and identified long-term and short-term forecast focus from an operational forecasting. Moreover, few studies have focused on the sources of predictability of these events, such as the impact of differences in high-latitude atmospheric circulation on the predictability of each cold wave event, which warrants further exploration.
Accurately forecasting cold waves and providing accurate early warning to the public are crucial for disaster prevention and mitigation. This paper aims to sort out the long-term, short-, and medium-term predictors of the three major cold wave events from the perspective of operational forecasting. Moreover, recognizing the key role of numerical forecast products in cold wave forecasting [18,19], this paper utilizes the CMA-GEPS (China Meteorological Administration—Global Ensemble Prediction System) developed independently by China to analyze the predictability of cold wave events, with the goal of further improving the model and enhancing the quality of the ensemble forecast products for severe weather in East Asia, providing a scientific reference for their application.

2. Data and Methods

2.1. Datasets and Three Cold Wave Events

In this paper, the observational data used was the fifth-generation atmospheric reanalysis global climate data (ERA5) [20] released by the European Center for Medium-Range Weather Forecasts (ECMWF). The variables analyzed include geopotential height at 500 hPa, air temperature at 2 m above ground, and sea level pressure. The data used for the analysis range from 1 September 2020 to 21 February 2021, and the climate state was taken as a 30-year daily average from 1991 to 2020.
The study utilized CMA-GEPS real-time forecast data generated from 15 December 2020 to 17 January 2021. The model consists of 31 ensemble members (one control forecast and 30 perturbed forecasts) based on singular vector initial value ensemble perturbation technology to represent the uncertainty in model initial conditions [21,22], as well as stochastically perturbed physics tendency (SPPT) and stochastic kinetic energy backscatter (SKEB) scheme to account for model intrinsic uncertainty [21,23,24]. The forecast has a lead time of 15 days and a horizontal grid resolution of 0.5° latitude and longitude. The data are interpolated to match the latitude and longitude grid points of the reanalysis data for ease of calculation. Additionally, to assess Arctic circulation conditions, the study incorporates daily Arctic Oscillation (AO) indices from December 2020 to February 2021, obtained from the US Climate Prediction Center.
In this paper, the definition of cold waves in China, as formulated by the Central Meteorological Observatory in 2006, is used. A cold wave is defined as a period during which the temperature drops by more than 8 °C within 24 h, and the minimum temperature falls below 4 °C, or drops by more than 10 °C within 48 h with a minimum temperature below 4 °C, or drops continuously by more than 12 °C within 72 h with a minimum temperature below 4 °C. The study focuses on three cold wave events that occurred during the winter of 2020/2021: the “1228” event from 28–31 December 2020, the “0105” event from 5–8 January 2021, and the “0114” event from 14–17 January 2021. These events were selected based on the time when the China Meteorological Administration issued and released cold wave warnings. The intensity and extent of the influence of these three cold air activities are analyzed through the cooling rate and temperature negative anomalies. Negative anomalies are calculated as the difference between the daily minimum temperature and the 10-day average temperature of the previous decade during the period of cold air influence. In this paper, the daily average temperature is used instead of the daily minimum temperature to align with the output of the model forecast.

2.2. Statistics and Verification Methods

This paper defines and uses some circulation indices to reveal the circulation characteristics of the three cold wave events. The AO index in this paper is downloaded from the website of the US Climate Center. The index was constructed by projecting the daily (00Z) 1000 mb height anomalies poleward of 20° N onto the loading pattern of the AO. The loading pattern of the AO was defined as the leading mode of Empirical Orthogonal Function (EOF) analysis of monthly mean 1000 mb height during the period from 1979 to 2000. The blocking high intensity index is obtained by calculating the average 500 hPa geopotential height anomaly in the key region (5° N–85° N, 45° E–80° E). The intensity index of the Siberian High (SH for short) adopts the average sea level pressure defined by Cheung et al. [25] in the 40°–60° N, 80°–120° E region.
For the evaluation of 2 m temperature, blocking high, and Siberian high index, this paper selects the Temporal Correlation Coefficient (TCC) score. TCC can characterize the forecasting skill of the model at each grid point and obtain the spatial distribution of forecasting skills, which reflects the degree of consistency between the predicted anomaly and the actual anomaly, and the calculation formula is as follows:
T C C i = j = 1 N ( x j x ) ( f j f ) j = 1 N ( x j x ) 2 j = 1 N ( f j f ) 2
where, when taking the 2 m temperature as an example, x and f represent the time averages of the observed and predicted 2 m temperature during the cold wave, respectively. The value range of TCC is between −1 and 1, and the closer it is to 1, the higher the forecasting skill.
In order to assess the deviation of the model forecast for the two-meter temperature, this paper employs the extreme method of temperature forecast accuracy, as outlined in the “Medium and Short-term Weather Forecast Quality Inspection Method” issued by the China Meteorological Administration. The calculation formula is as formula (2), where N x K is the number of stations (times) that are correctly forecasted, N f K is the total number of stations (times) that are forecasted, and K is 1 and 2, that is, the model is compared with the actual situation by analyzing the accuracy of the model forecasts with absolute errors of ≤1 °C and ≤2 °C.
T T K = N x K N f K × 100 %
The actual meaning of temperature forecast accuracy is the percentage of temperature forecast error ≤ 1 °C (2 °C).

3. Key Factors and Predictors of Three Severe Cold Wave Events in the Winter of 2020/2021

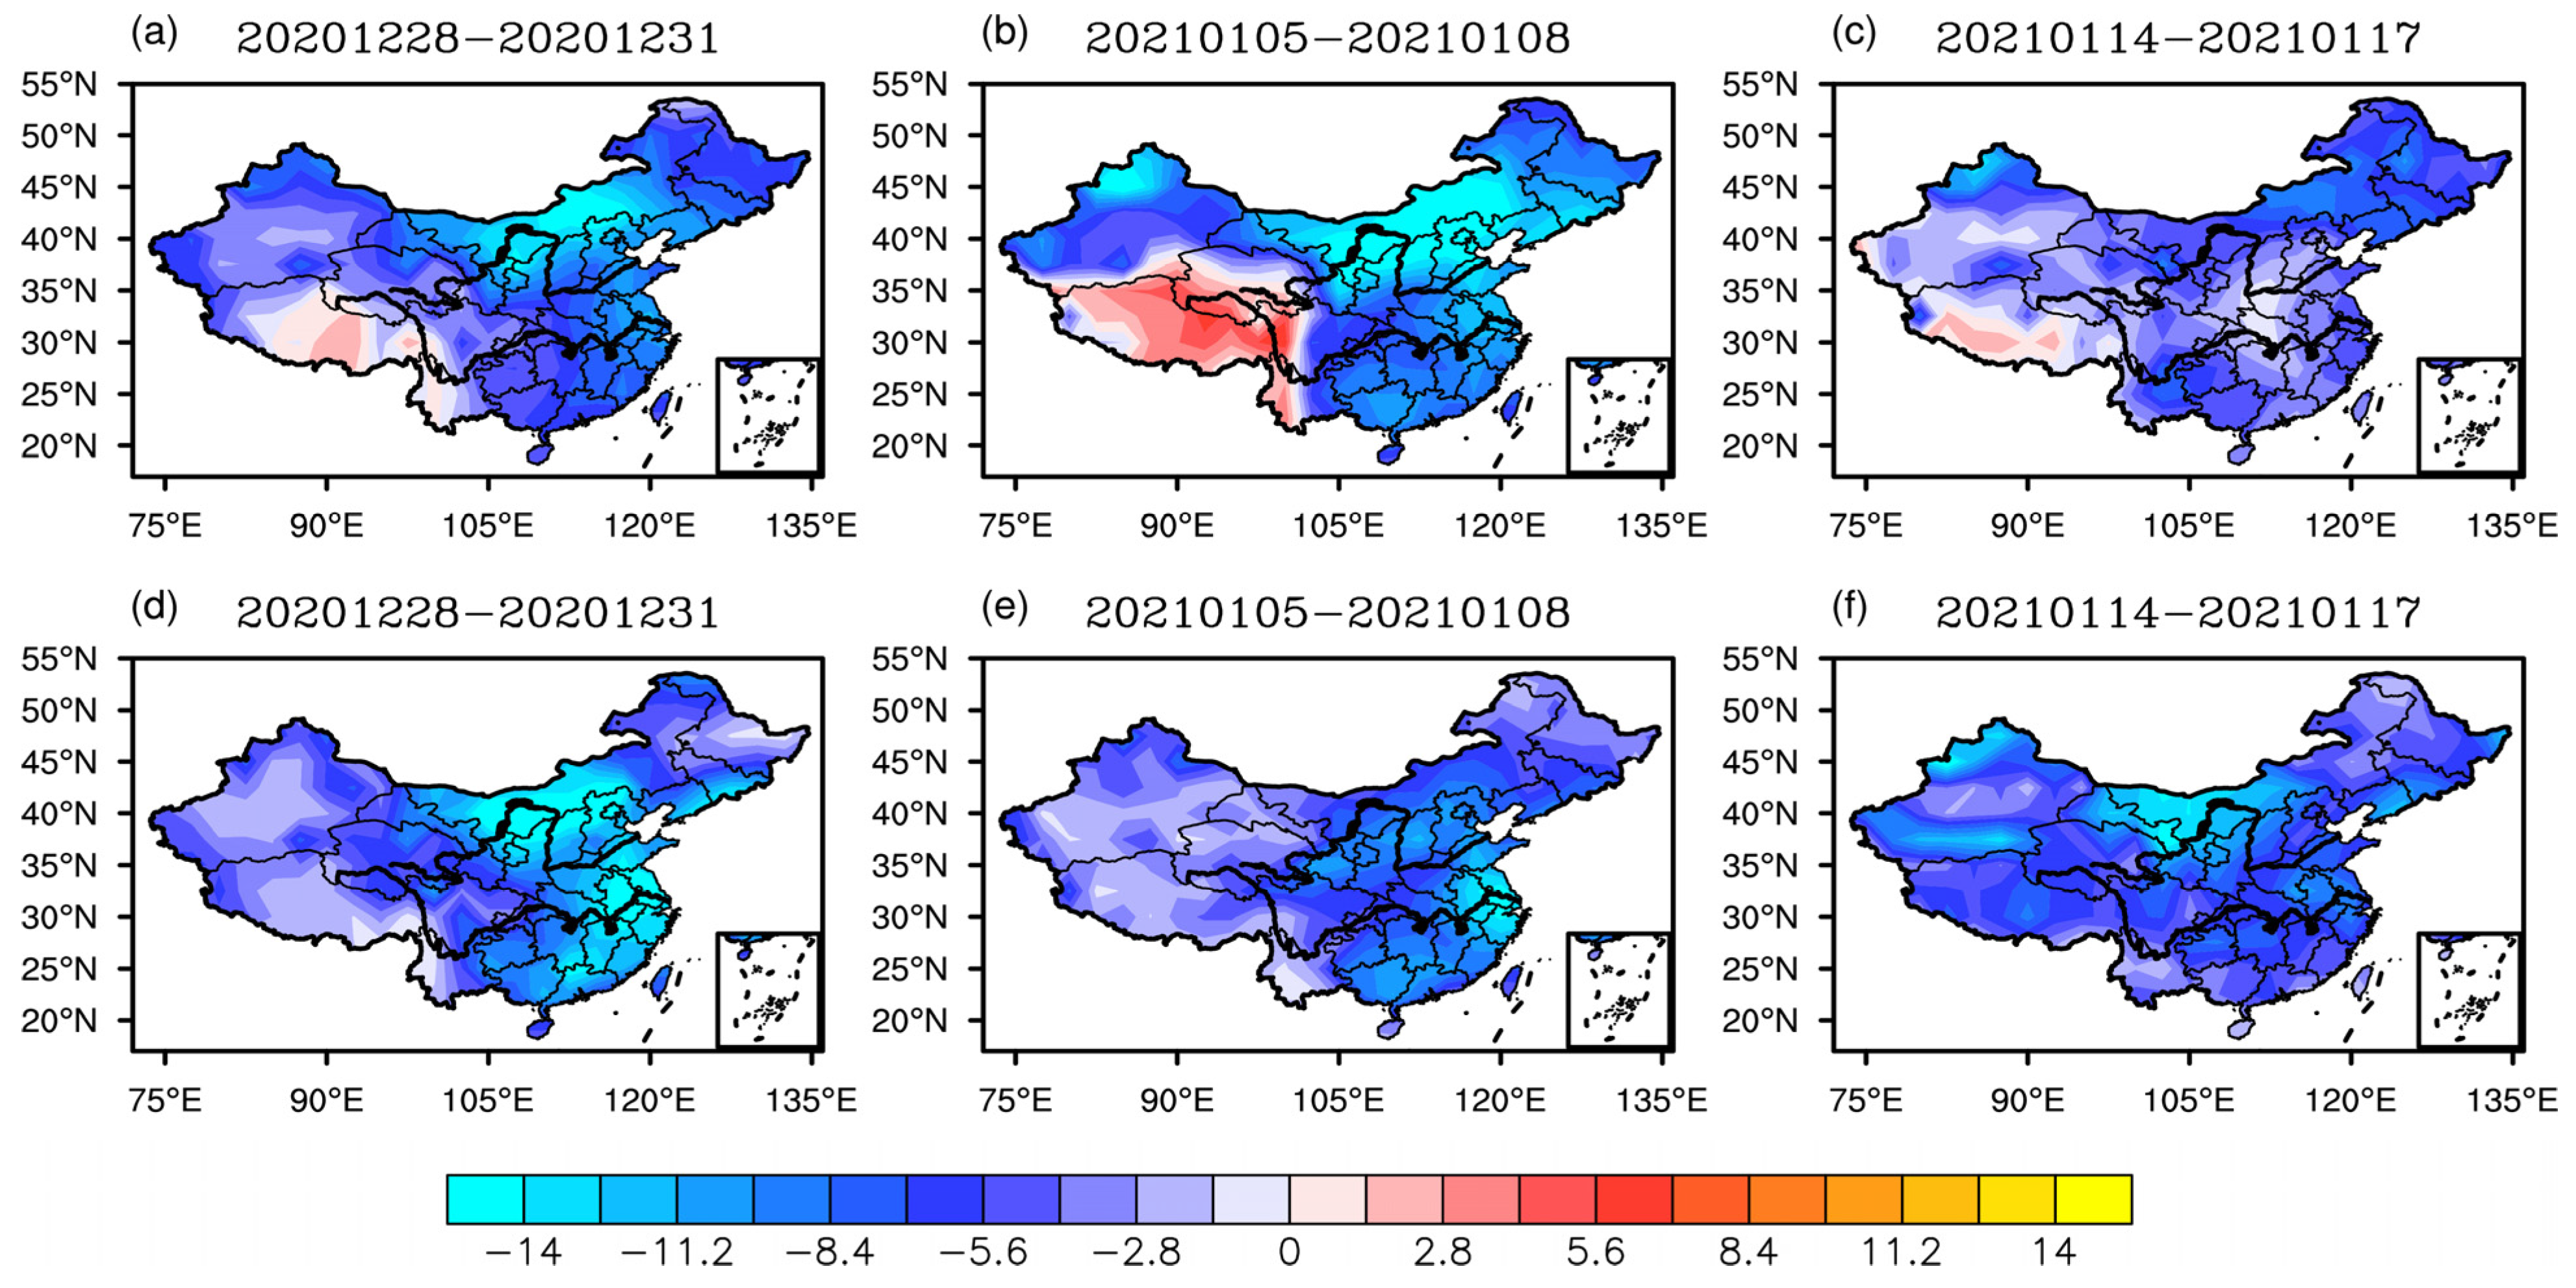
3.1. Key Factors of Cold Wave Events

During 28–31 December 2020, 5–8 January 2021, and 14–17 January 2021, three cold waves broke out successively, causing a severe drop in temperature in most parts of China, particularly in the central and eastern regions. Figure 1 shows the temperature anomaly and cooling rate during these three cold waves.
In terms of temperature anomalies, the three cold waves resulted in negative temperature anomalies across most parts of the country and can be considered as national cold wave events. The “1228” and “0105” events had temperature negative anomalies of over 14 °C in Inner Mongolia, while East China and South China experienced temperature negative anomalies of over 8 °C. Although the temperature negative anomaly caused by the “0114” event was not as severe as the previous two events, most parts of the country were still in a negative temperature anomaly state.
In terms of the cooling rate, all three events caused a significant drop in temperature nationwide, but the areas with the most significant temperature drop were still Inner Mongolia and the eastern regions of China. The “1228” event had the largest temperature drop, with a local drop of more than 14 °C in Inner Mongolia and eastern China. Although the cooling rate of the “0105” and “0114” events was not as large as that of “1228” temperature drops of over 10 °C were also observed in some parts of Inner Mongolia and eastern China, reaching the standard for cold wave. It should be noted that, although the cooling rate of the “0105” event was not as significant as that of the “1228” event (Figure 1e), the negative temperature anomaly of this event even exceeded that of the previous event due to the lower base temperature caused by the “1228” event (Figure 1b).
Cold air in China can be traced back to the Arctic Ocean and its surrounding areas. At the surface, it often appears as a shallow cold high pressure, but it is replaced by low pressure at 700 hPa, as well as a polar vortex at 500 hPa, which is often considered a symbol of extremely cold air. Research suggests that a stable and strong polar vortex in the high latitudes of Asia bodes well for the cold wave weather in China. Figure 2 shows the distribution of the average 100 hPa geopotential height of the above three cold wave processes, revealing that the polar vortex split into two centers during the events. The center in Northeast Asia remained strong, and it extended southward to Northeast China for the “0105” event. The other center was in North America, but the vortex in Asia was significantly stronger during the last two events, which resulted in a large-scale and persistent low temperature over China.
Polar vortex splitting is often caused by blocking high entering and maintaining the polar region at mid- and high-latitudes. To assess the impact of blocking high on polar vortex splitting during three cold waves, Figure 3 presents the average 500 hPa geopotential height and its anomaly distribution before and after the three events. The processes of the three cold waves exhibit great similarities, as indicated by the dotting area (the commonality of the three events). In the four to five days prior to the outbreak of the cold wave, the blocking high strengthened and expanded northward, and the high-pressure ridge remained near 60° E. A horizontal trough is formed in front of the high-pressure ridge (Figure 3a–c), and the northerly wind in front of the ridge guides the accumulation of polar cold air southward, providing conditions for the southward eruption of polar cold air. When the cold wave was on the brink of breaking out (Figure 3d), the blocking high showed signs of weakening and retreating, and it became wider, showing that the 530 dagpm line continued to press southward and retreat westward, but its intensity remained at a historically high level (positive anomaly). At this time, the horizontal trough in front of the ridge began to turn vertical, and the meridional anomaly of the circulation in the Siberian high area increased, driving the cold air southward. The cold nests gradually formed in the northeast China, leading to a large-scale cold wave in eastern China. The mid-high latitude circulation has been adjusted in the later period, that is, the positive anomaly of the height field in the Ural Mountains has weakened significantly, the height field in the Baikal-Balkhash region has changed from a negative anomaly to a positive anomaly, and the mid-high latitudes in Eurasia have been adjusted to be flat. The zonal circulation prevails, and the influence of cold air has diminished.
The polar vortex is a crucial component of atmospheric circulation in cold weather, originating in the upper troposphere and extending to the lower stratosphere as a source of cold air. The blocking high in the troposphere assists in directing the flow of cold air at the ground level, adding to its strength and thickness. However, these are not direct factors contributing to the cooling during cold waves. The intensity of winter’s cold air is primarily determined by the strength and evolution of the Siberian high. As shown in Figure 4, the distribution of mean sea level pressure and anomalies during three cold wave events are depicted. As a deep system of blocking high, a corresponding cold high-pressure formation forms at ground level (Figure 4c), known as the cold wave surface high pressure. The leading edge of the high pressure is typically marked by a strong cold front and signals the arrival of a cold wave. Before the onset of the cold wave (Figure 4a), there was no clear pattern of positive and negative signs in Siberia, but the polar high was evident. The Siberian high became more prominent as the cold wave approached (Figure 4b,c), with its front reaching Northeast China. Afterwards, the high-pressure center moved southward and weakened, leading to a widespread cooling in China (Figure 4d).

3.2. Long-Term, Medium- and Short-Term Predictors of Cold Wave Occurrences

The results from the research in the previous section show that the three cold wave events that took place in the winter of 2020–2021 happened under the background of the splitting of the polar vortex, the formation of a strong vortex center in Northeast Asia, and the blocking high pressure first extending northward and strengthening, followed by a weakening southward trend. The cold high pressure that formed in Siberia guided cold air to invade China and result in a widespread cooling weather across the country. The time series of the AO Index, Blocking High Index, Siberian High Index, and the national average temperature from November 2020 to February 2021 in Figure 5 depict the synergistic effect of this upper–lower system. During the three cold wave events, the polar vortex, blocking high, and Siberian high all presented combined anomalies, which Li et al. [26] claimed was a major factor in the 2008 low-temperature rain and snow disaster and the “Overlord” cold wave process in 2016.
It can be observed from the long-term sequence of the three circulation indices that the three cold wave events of the winter of 2020–2021 happened during the low-frequency adjustment period of atmospheric circulation. The AO index was declining in the early stage, gradually turned from positive to negative in early December, and all three cold wave events took place in the negative AO stage. This negative phase of the AO reflects a strengthened low-level polar high pressure, which creates a favorable environment for the accumulation of cold air. Meanwhile, the Blocking High Index fluctuated around 0 in the early stage, but it gradually increased in strength after late December, and all three cold wave events occurred during its relative historical high phase (indices greater than 0). The Siberian High Index displayed a similar evolution trend to the Blocking High Index, and all three cold wave cooling events also took place during its high value state, with the intensity changes of the Blocking High Index and the Siberian High Index being more typical in the first two events.
From the long-term evolution trend of atmospheric circulation, it seems that the continuous decline of the AO index, the gradual increase in the intensity of Blocking High Index, and Siberian High Index are potential predictors for long-term forecasting of cold wave cooling. Forecasters should take note of the seasonal evolution trends of these three indicators and, combined with the annual cycle characteristics of air temperature, use them as a crucial starting point for forecasting cold wave or strong cold air on the medium and long-term time scale.
However, while the long-term changes to the synoptic system provide a favorable large-scale circulation background for the cold wave outbreak, they are not direct influencing factors of the cold wave outbreak. Based on the hysteresis of the cold wave cooling relative to the three circulation indices, the AO index dropped significantly three to five days before the cold wave cooling, which has some indicative significance for the medium and short-term forecast of the cold wave cooling. The blocking high pressure had a certain lead in the “1228” and “0105” events, but it was synchronized with or slightly behind the cold wave cooling in the “0114” event, which may be due to the fact that the “0114” event only had a significant cooling in the Inner Mongolia region of China.
Overall, the cooling of the three cold waves all took place during the stage when the blocking (Siberian High) intensity reached its peak and began to weaken with its turning point of the transition occurred almost simultaneously with the cooling, which is a commonality of the three cold waves. The results of the study reveal that the blocking high and the Siberian high are not directly related to the cooling of cold waves in China in a simple negative correlation (as noted by Zhu [3]; Ma et al. [4]; Zhu et al. [5]; Zhi and Gao, [6]). Instead, when the high-pressure intensity reaches its peak and begins to recede in the middle and high latitudes, it represents an outbreak of cold air to the south, thus causing widespread cooling weather in downstream areas. Therefore, the blocking high and the Siberian high are the direct systems that drive the cold wave cooling and are important factors to consider when predicting the timing of the cold wave eruption and forecasting it in the short-term time scale.
In summary, the three cold wave events that occurred during the winter of 2020–2021 took place during a period of low-frequency time-scale adjustment of the polar vortex, blocking high, and Siberian high. The polar vortex was experiencing a high frequency of splitting incidents. The blocking high pressure reached a certain peak, and a horizontal trough formed in front of the high-pressure ridge. During this time, the Siberian high also developed and strengthened, leading to the complete accumulation of cold air.
From the sequence of the above factors relative to the occurrence of cold wave outbreaks, the synergistic mechanism of these three cold wave events seems to be as follows: the polar vortex first splits into two centers, and the blocking high develops and strengthens northward into the Arctic region, which, on one hand, promotes further southward displacement of the polar vortex on one side of Northeast Asia, and, on the other hand, the establishment of the Ural Mountain high-pressure ridge leads to the formation and strengthening of surface high pressure. Subsequently, the blocking high collapses and retreats southwestward, and the northward wind ahead of the ridge guides the Siberian high to move southeastward, carrying cold air and causing strong cooling weather in Eastern China.
The combination evolution of these large-scale circulation patterns may affect the predictability of cold waves, that is, if the models can accurately capture the evolution of circulation patterns, it may bring higher forecasting skills for the cold waves. We note that a cold wave event occurred in China from 12 to 15 December 2020 (hereafter called it “1212” event), which was compared to the latter two events in the study by Dai et al. [24]. However, this event had distinct formation mechanisms compared to the later events. On the one hand, the blocking high was not strong and did not extend deep into the Arctic region (Figures omitted). On the other hand, there was no obvious Siberian high formed on the ground and developed southward (Figures omitted), which can also be speculated in the blocking high and Siberian high indices in Figure 5. As the circulation pattern of the event from 12 to 15 December 2020 showed significant differences from the following events, the discussion of its impact on the predictability of this cold wave in the model is worth conducting. Later in this study, we will discuss the possible impact of mid-latitude circulation on the predictability of cold wave events, including the “1212” event and the three events of interest in this study. We use different colors to distinguish the “1212” event from the subsequent three events.

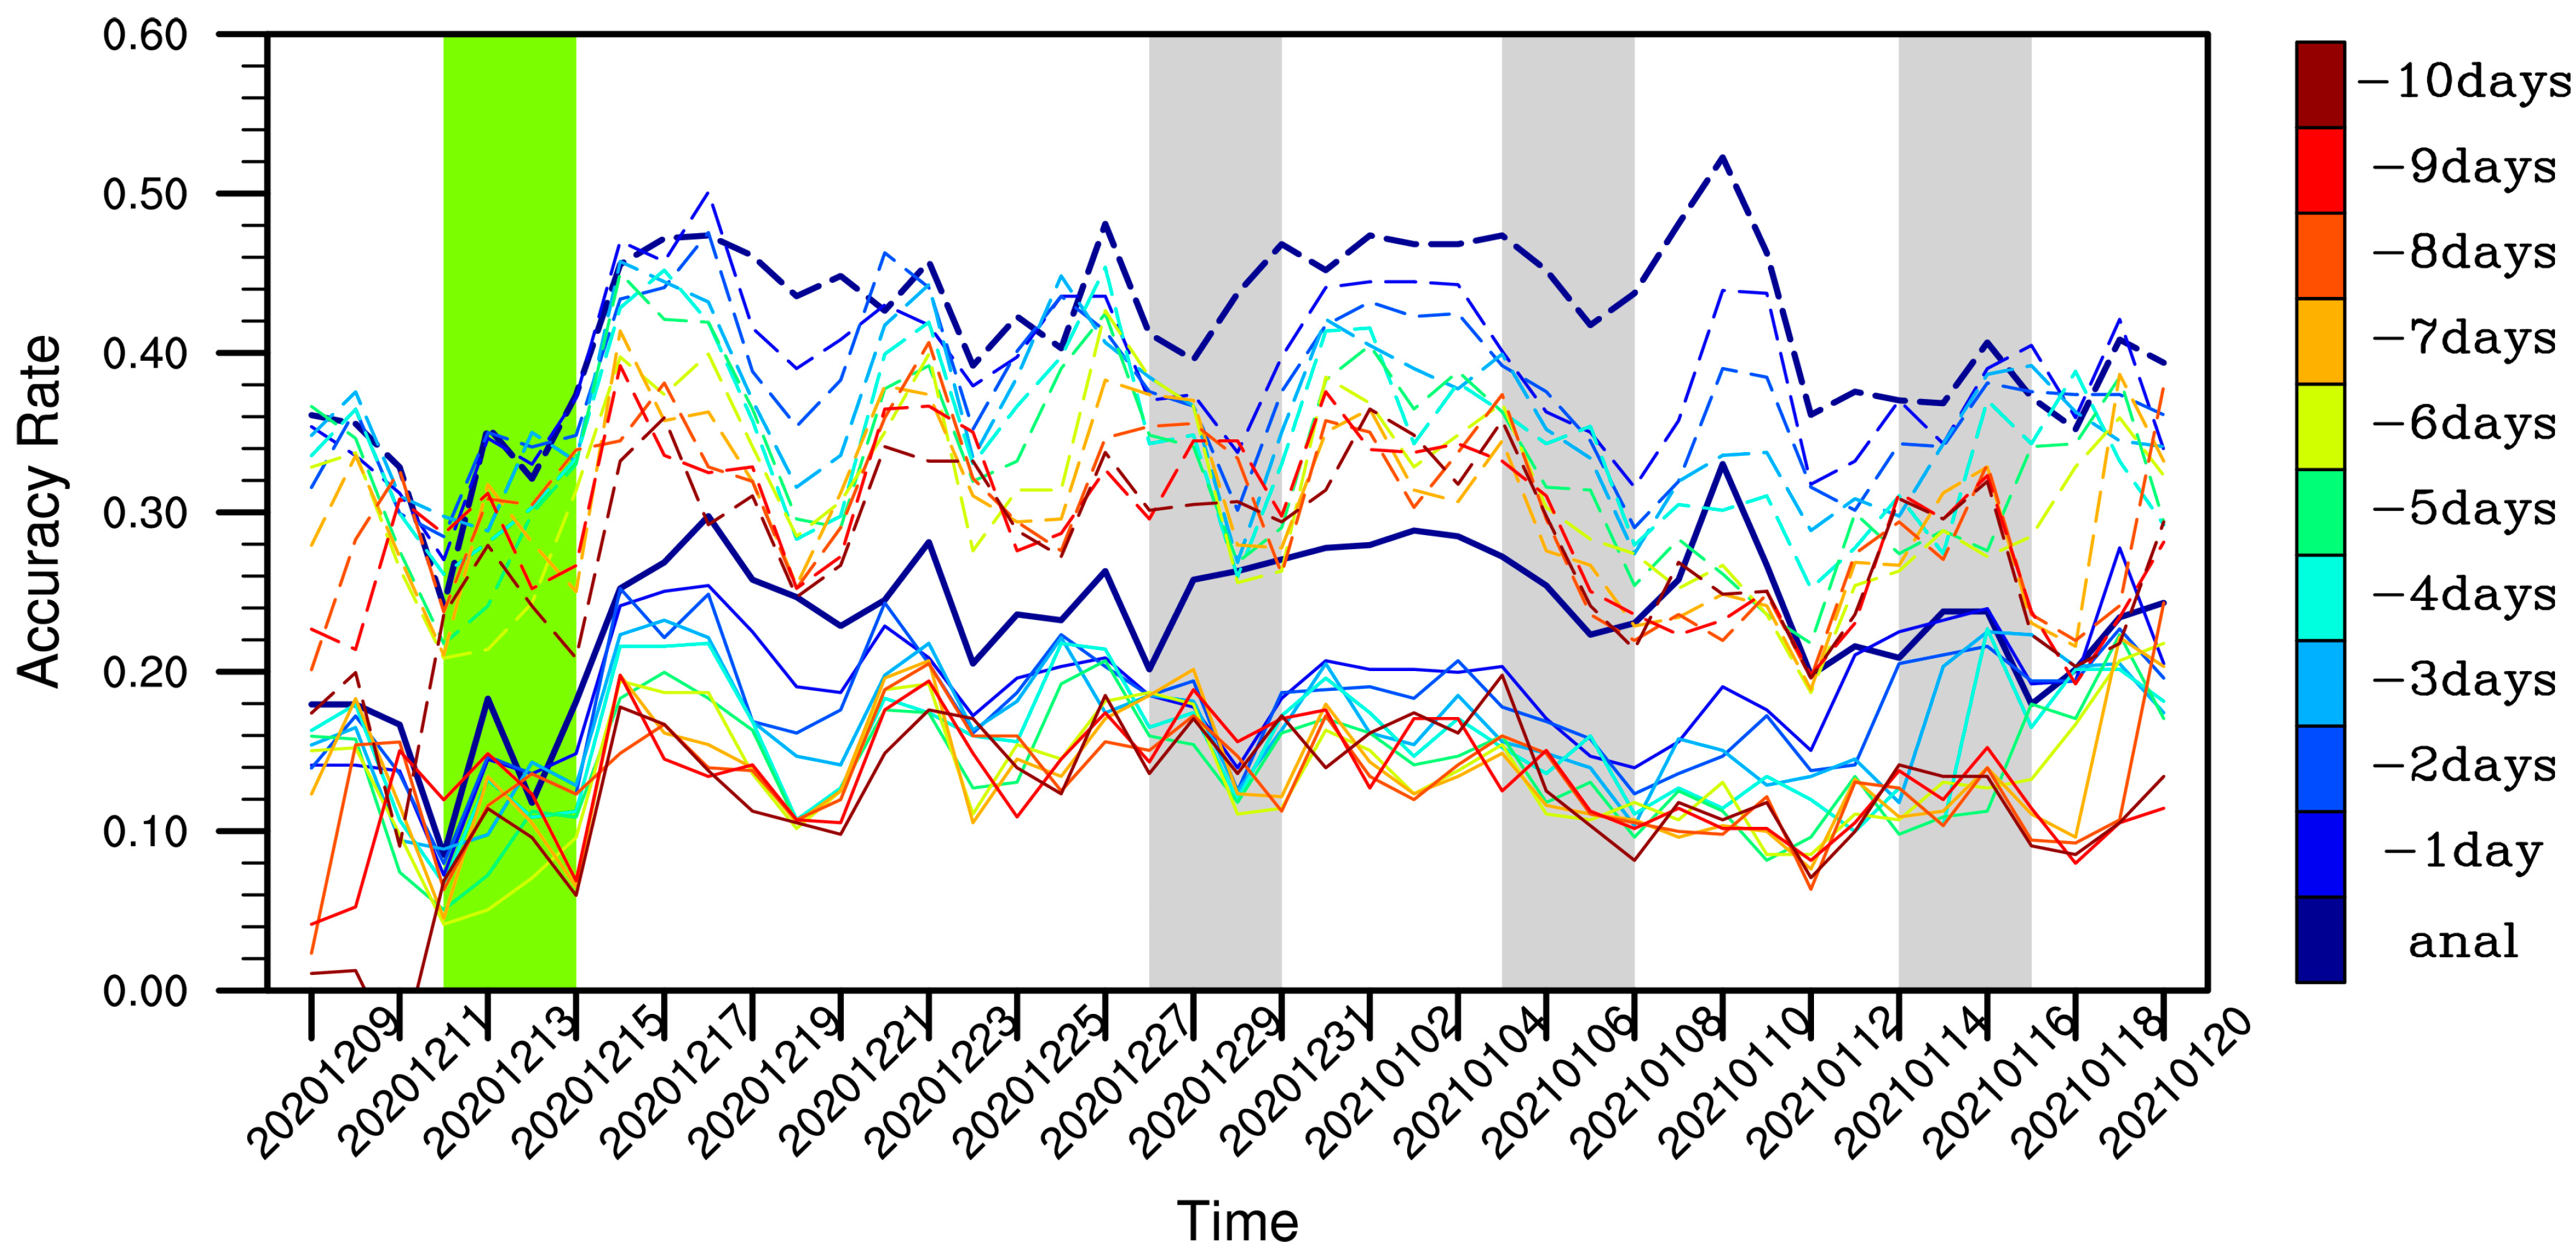
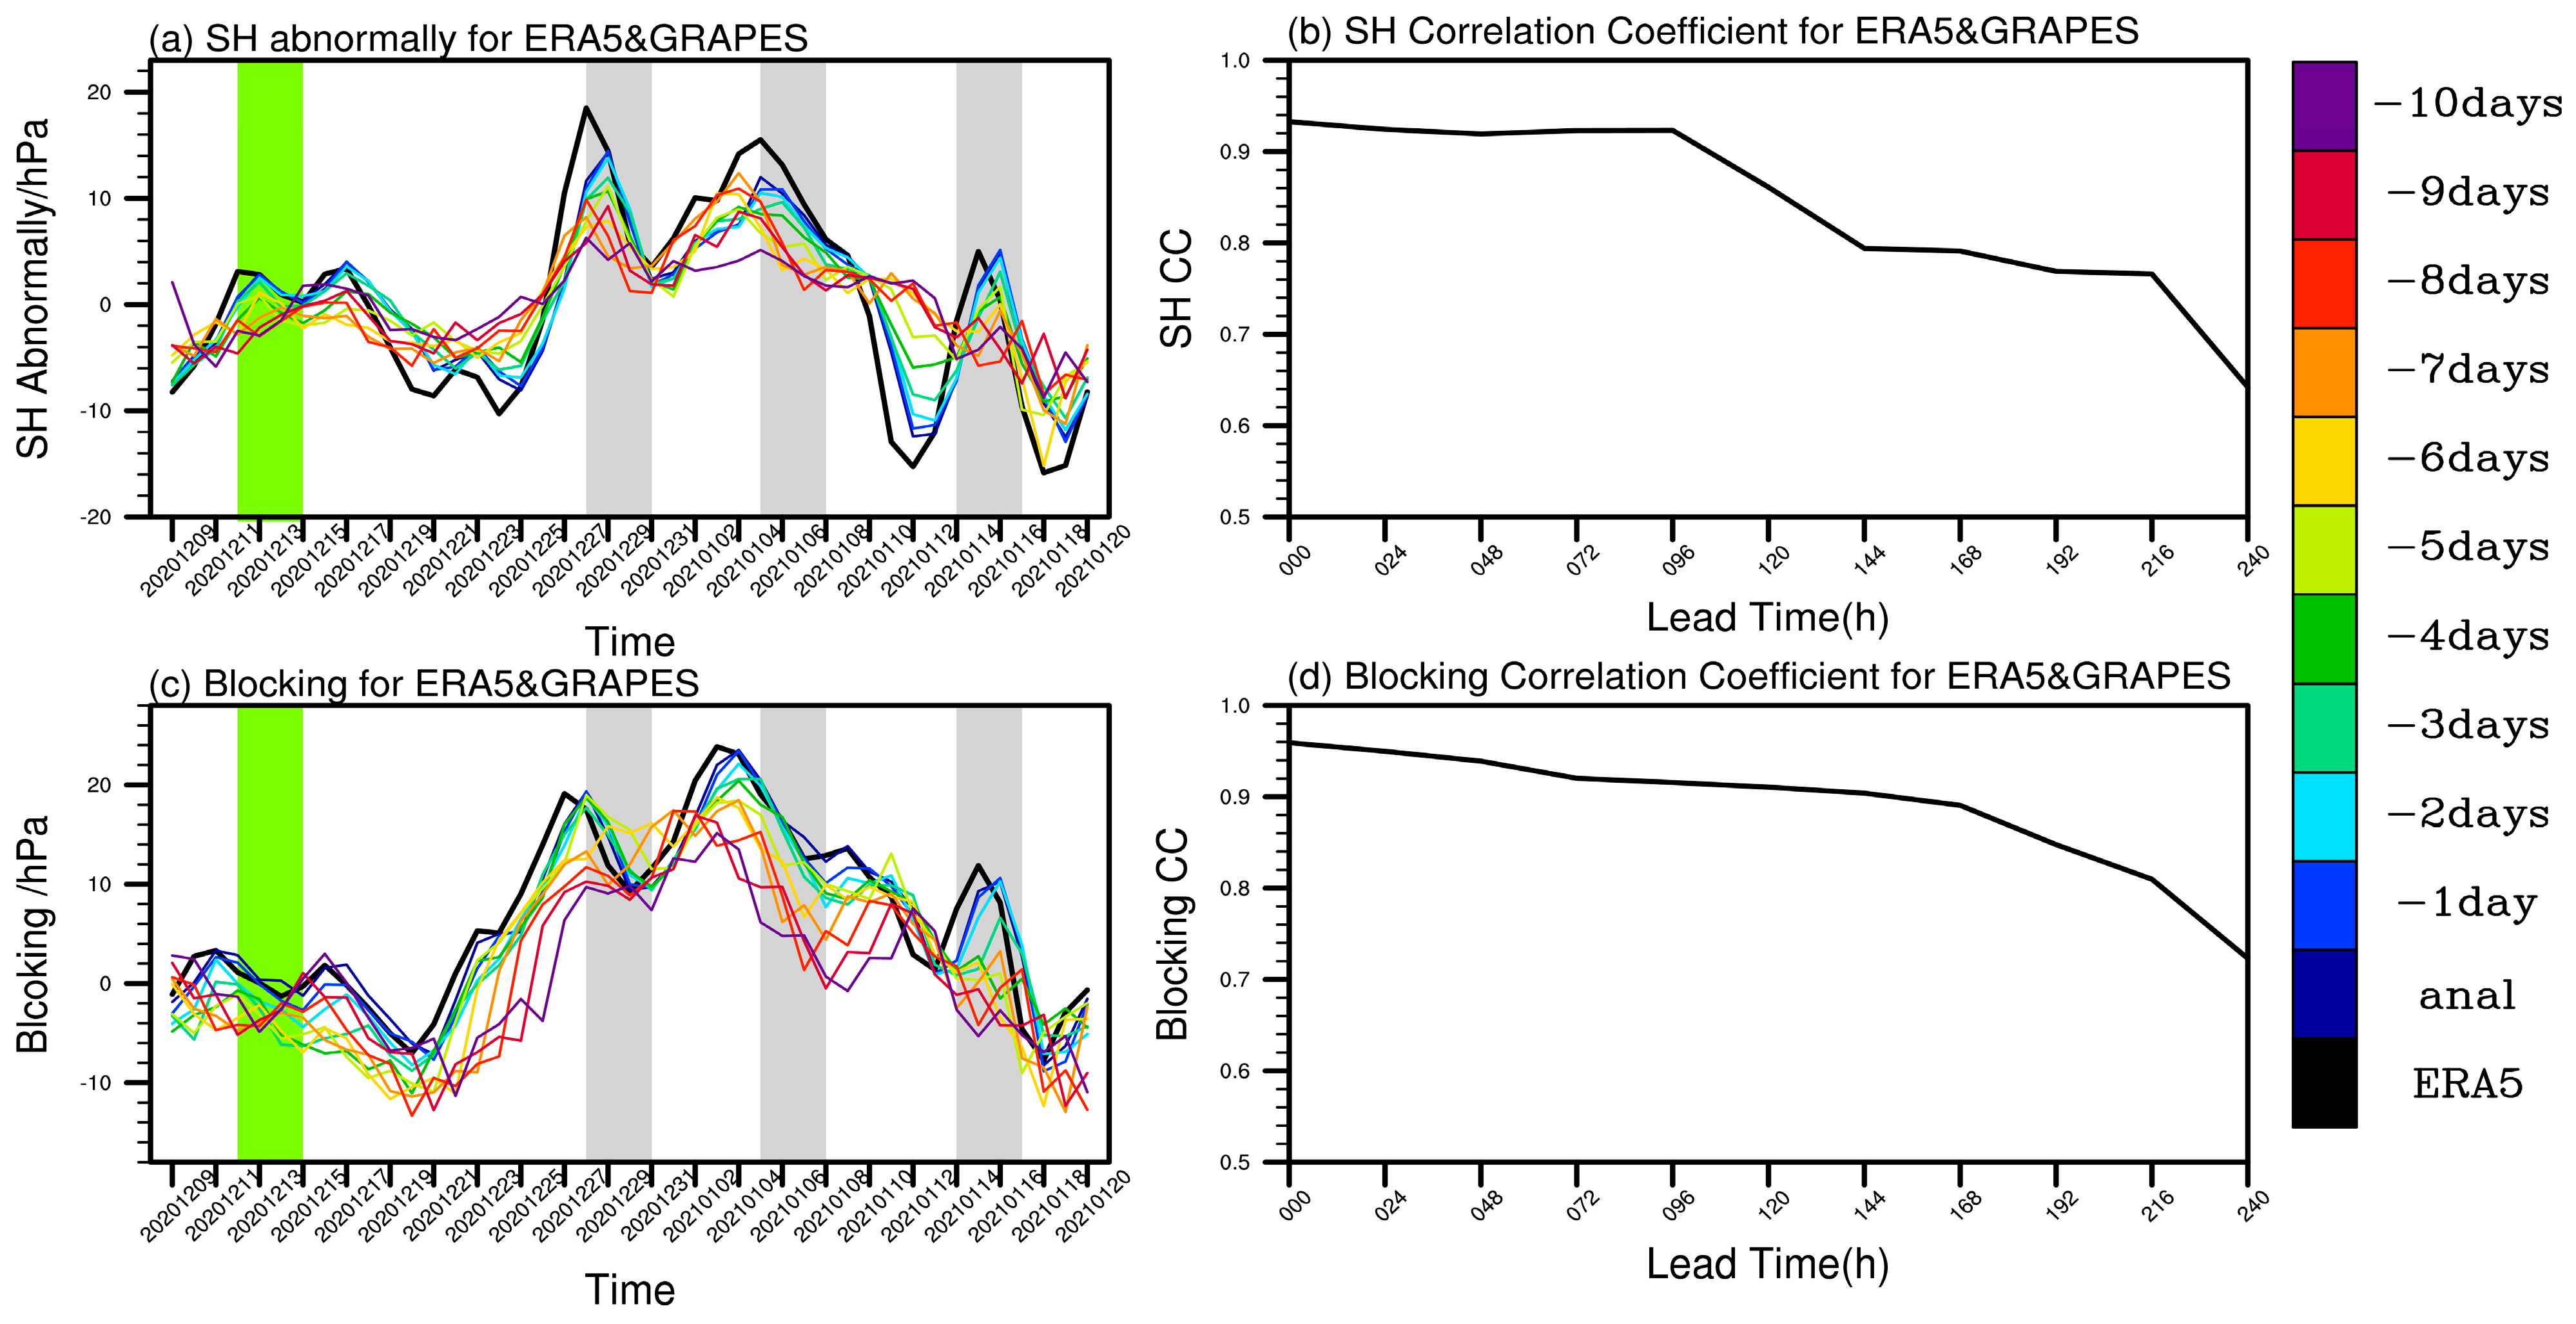
4. Predictability of Cold Wave Events during the Winter of 2020/2021

In the early 21st century, the China Meteorological Administration developed a new-generation, non-hydrostatic numerical forecasting model called GRAPES. This model marked the establishment and formation of a comprehensive numerical forecasting system in China. The Global Ensemble Prediction Operational Simulation System (CMA-GEPS) was completed and put into operation in late 2018. It is necessary to conduct an assessment of the forecasting capability of the CMA-GEPS data for the cold wave weather process, which will accumulate experience for the interpretation and application of numerical forecasting products, providing a certain reference for more accurate forecasting of cold wave weather in the future.
The ensemble mean method is a traditional method for extracting information from multiple model members, and Figure 6 shows the time series of t2m in observation and ensemble forecasts for different lead times. Comparing the temporal evolution of model and observed t2m, it can be seen that the model can accurately predict the cooling rhythm of the four cold wave events. However, compared to the three events studied in this paper (where the mid-to-upper-level circulation systems were relatively clear), there was a large forecast bias for the “1212” cold wave event. The forecast bias for this event was reflected in the smaller cooling rate compared to observations, with the model-predicted temperature being higher during the temperature trough on 14 December 2020, and this bias became more pronounced when the forecast lead time was extended. The three cold wave events studied in this paper were well predicted by the model, which accurately forecasted the cooling rate and the timing of the events eruption. However, as the forecast lead time increased, there were some deviations from the observed values. Overall, the model performed well in predicting these three events than “1212” event.
To illustrate the difference in forecasting skill of these events more intuitively, Figure 7 displays the distribution of the correlation coefficients between the ensemble mean 2 m temperature predicted by the model five days ahead and the observed values during the four cold wave events. To better illustrate the temperature changes before and after the occurrence of cold wave events, we selected temperatures from three days before and after the outbreak date of the cold wave events (a total of seven days) to evaluate the correlation coefficient. Overall, the large values of correlation coefficients for the cold air processes are concentrated in eastern and southeastern China (apart from “0114” event), while the correlation coefficients of the Tibetan Plateau and Xinjiang are relatively low. This indicates that the model system may have limited ability in forecasting winter temperature in the complex climate zones of plateau and desert. Among the four cold air events, the model performs better for the “1228” and “0105”events. Most eastern regions of China have correlation coefficients of basically above 0.8, which indicates that the model system can grasp the cooling rhythm of the area south of the Yellow River. Relatively speaking, the model’s forecast of the cooling during the “1212” and “0114”events are relatively poor. Taking into account the differences in mechanisms between the “1212” event and the subsequent three events, as well as the overall weakness of the blocking high and Siberian high during the “0114” event (Figure 5), our results suggest that the changes in mid-high latitude circulation may affect predictability for cold wave events.
In meteorological forecasting operations, it is common to evaluate the specific forecasting accuracy of the model system for temperature. This is performed by calculating the ratio of grid points for which the absolute error between the model forecast and the actual temperature is less than or equal to 2 °C and less than or equal to 1 °C. This metric is referred to as forecast accuracy.
Figure 8 shows the distribution of forecast accuracy for the ensemble mean 2 m temperature forecast by the model, at different lead times during four cold air outbreaks. As the number of forecast days increases, the accuracy of the model forecast decreases, suggesting that the short-term forecasts are to some extent dependent on the initial field. When the forecast error is set to within 2 °C, the forecast accuracy remains below 0.5, indicating that there is still significant room for improvement in the magnitude of temperature forecasting by the model system.
For the forecast with an absolute error of less than or equal to 1 °C, the forecast accuracy decreases significantly, but it does not show a clear decline as the number of forecast days increases, indicating a high degree of stability in the forecast. It is possible that the “stability” of the 1 °C accuracy with increasing lead times indicates a loss of predictability within one to two days of forecast lead times. As forecast length increases towards infinity, the skill would asymptote towards that of a climatological forecast. It appears that this asymptote is reached much more quickly at the 1 °C accuracy threshold than at the 2 °C accuracy threshold.
Based on the forecast accuracy, the model system still exhibits a large deviation in the forecast of 2 m temperature, which may be caused by a system bias (Figure 6). Except for the “1212” event, where the model underestimated the cooling amplitude leading to overestimation of temperatures in some time periods, the model had negative bias in surface temperature forecasts in other periods, which should be taken seriously by forecasters in operations. Similar to Figure 7, the model’s forecast accuracy for the “1212” and “0114” events was lower than that for the “1228” and “0105” events. Therefore, we obtained similar conclusions from the evolution of temperature and the forecast accuracy of specific temperature magnitudes.
As explained in the previous chapter, the cooling process of three cold waves in the winter of 2020/2021 is the result of the combined anomaly of the upper and lower circulation patterns at mid-high latitudes. To understand the source of the CMA-GEPS model’s ability to forecast cold wave weather, it is necessary to evaluate its forecasting skill on these synoptic systems. To do this, we look at its forecasting ability for the Siberian high and blocking height, which are direct impact systems of cold wave weather.
Figure 9 displays the model’s forecasting capabilities for the Siberian high (a, b) and blocking (c, d). It’s worth noting that the model’s output is in the form of surface pressure, so in order to compare it with the Siberian index calculated from sea level pressure, the indices of the model and observation in Figure 9a have been subtracted from their respective time averages. Despite some limitations in its forecast of the Siberian high amplitude, the model has a strong ability to predict the evolution trend of the Siberian high intensity index during the cold wave events.
The model accurately foresees that the later three cold waves occurred while the Siberian High was at a high intensity and starting to decline. The differences between the model forecasts of the three cold wave events are reflected in the following aspects. (1) The start of the “1228” cold wave event was synchronized with the start of the weakening of Siberian high pressure at high intensity, while the model forecasts of different lead times showed a lag effect, as reflected in the slow enhancement of Siberian high pressure forecast by the model. The peak of Siberian high pressure was not reached until about one day after the onset of the cold wave. (2) The forecast of the model one to four days in advance is more consistent with the observations during the “0105” cold wave event, but with the extension of the forecast time, the Siberian high peaked earlier than the observations. The correlation coefficient of the Siberian high intensity forecast made by the model in Figure 9b remains above 0.7 when the forecast extends up to 10 days ahead, indicating a high level of predictability. Figure 9c displays the observed and modeled forecast of the blocking high intensity index. Similarly, the model system has a good ability to forecast the trend of the blocking high, as evidenced by its ability to correctly forecast the occurrence of later three cold surge events during the stage when the blocking high was at its peak and then declining. From the forecast correlation coefficients of the blocking high intensity index (Figure 9d), the model’s forecasting skill gradually decreases with the extension of the forecast lead time, reflecting its dependence on the initial field. However, the model’s correlation coefficient remains above 0.7 even when the forecast extends 10 days ahead, indicating a high level of predictability of the blocking high by the model system.
As a comparison, Figure 9 also shows the model-predicted and observed Siberian high and blocking index during the “1212” event. The model is also able to accurately predict the weak fluctuations of these two circulation indices during this event. The results of this study suggest that the strong variability of key factors (such as the Siberian high and blocking) in cold wave events may benefit the model’s prediction of temperature drop, providing predictability for cold wave events.

5. Discussion and Conclusions

In December 2020 and January 2021, three cold wave events occurred successively from 28 to 31 December, 5 to 8 January, and 14 to 17 January. In contrast to previous studies that focused on differences in formation mechanisms [12,13,14] and external forcing factors [15,16,17] of these events, this study emphasizes the common characteristics of the three events. The study suggests that the low-frequency adjustment of mid-to-high-latitude circulation and synoptic-scale fluctuations play different roles in the occurrence of cold waves and discusses the sources of predictability of these events by using CMA-GEPS model data. The main findings are as follows.
(1) Three cold wave events significantly impacted the central and eastern regions of China. During the first cold wave event on 28 December, the most significant temperature drop was observed, with a decrease of over 14 °C in Inner Mongolia and eastern China. The temperature drops during the events on 5 and 14 January were slightly weaker, but they still met the criteria for a cold wave.
(2) The key factors for the occurrence of three cold wave events in mid-high latitudes are due to the synergistic effect of high and low-level atmospheric circulation. The polar vortex split into two centers, with two events on the Asian side having a stronger intensity. The blocking high guides the ground cold air, supplementing its intensity and thickness. Before the cold wave outbreak, the blocking high strengthened and expanded northward, guiding the Arctic cold air to accumulate southward. The Siberian high’s intensity and evolution is the most direct factor affecting the intensity of winter cold air. Before the cold wave event, the Arctic high pressure developed significantly, and the Siberian high was in the preparation stage. The Siberian high then expanded southward, causing a widespread cooling weather in China. In the later period, the positive anomaly of the height field in the Ural Mountains decreases, indicating that the cold wave cooling is tending to end.
(3) From a long-term perspective, the three cold wave events in the winter of 2020–2021 occurred during a low-frequency adjustment period in atmospheric circulation. Specifically, the Arctic Oscillation (AO) index showed a decline in the early stage, transitioning from a positive phase to a negative phase in early December. This was accompanied by the intensification of the blocking high and the Siberian high into high intensity in the second half of December. In terms of short-term forecasting, the onset of the three cold wave events coincided with the turning point of the blocking high and the Siberian high from peak to recession, which are direct indicators of cold wave cooling.
(4) The CMA-GEPS ensemble forecast system accurately predicts the timing and cooling patterns of the three cold waves, particularly in central and eastern regions, with a forecast correlation coefficient of over 0.8. However, the accuracy of the model decreases with the increasing number of days in advance, highlighting the dependence of its short-term forecast on the initial field. When the forecast error is set within 2 °C, the accuracy rate is below 0.5 and drops significantly within an error range of 1 °C, indicating a large deviation in the model’s forecast of 2 m air temperature. The deviation mainly stems from the model’s tendency to underestimate air temperature levels, which should be taken into consideration by forecasters during operations.
There are many aspects of our results that are worth discussing. Firstly, the findings of this study suggest that focusing on the low-frequency variability of mid- and high-latitude circulation is crucial for predicting the cooling associated with cold waves on extended time scales. The cold wave events during the 2020/2021 winter coincide with the low-frequency adjustment periods of the AO index, blocking high, and Siberian high. Therefore, these long-term factors may provide indicative implications for predicting the onset of cold waves. Secondly, our results show that the specific timing of the three cold wave outbreaks coincides with the transition of the blocking high and Siberian high from peak to decline. Since circulation is typically more predictable than temperature in models, accurately forecasting the time when the mid- and high-latitude circulation turns from peak to decline within a longer time period may significantly extend the forecast period of cold wave outbreaks. Additionally, our study suggests that, when the amplitude of mid- and high-latitude circulation is more pronounced, models tend to be more accurate in predicting the evolution and magnitude of temperature, which may indicate that mid- and high-latitude circulation provides predictability for cold waves. Nevertheless, the results presented in this paper are only preliminary, and further studies are required to provide additional evidence to support our speculations.

Author Contributions

Conceptualization, P.R. and J.Z.; Methodology, H.C.; Formal analysis, J.Z.; Investigation, J.Z.; Resources, L.G.; Writing—original draft, P.R.; Writing—review & editing, L.G. and H.C. All authors have read and agreed to the published version of the manuscript.

Funding

This study was jointly supported by the National Natural Science Foundation of China (U20A2097, 42075087), the National Key Research and Development Program of China (2021YFC3000902), the Guangdong Meteorological Society Science and Technology Research Project (202203), the Guangzhou Meteorological Society Science and Technology Research Project (M202205), and the Guangzhou Fundamental and Applied Basic Research Project (202201011093).

Institutional Review Board Statement

Not applicable.

Informed Consent Statement

Not applicable.

Data Availability Statement

Data sets for this research are publicly available. Archives of ERA5 data are available at: https://www.ecmwf.int/en/forecasts/datasets/reanalysis-datasets/era5 (accessed on 13 March 2023). CMA-GEPS data can be downloaded from CMA website: http://data.cma.cn (accessed on 13 March 2023). The AO index can be obtained from climate prediction center of USA: https://www.cpc.ncep.noaa.gov/products/precip/CWlink/daily_ao_index/ao.shtml (accessed on 13 March 2023).

Conflicts of Interest

The authors declare no conflict of interest.

References

  1. Zhu, Q.; Lin, J.; Shou, S. Principles and Methods of Meteorology; Meteorological Press: Beijing, China, 2000. (In Chinese) [Google Scholar]
  2. Zhao, X.; Zhang, Y.; Li, S.; Zhang, L.; Han, L. The impact of winter meteorological conditions on agricultural production in 2020/2021. Chin. J. Agrometeorol. 2021, 42, 3. (In Chinese) [Google Scholar]
  3. Zhu, Q.; Shi, N. The Long-Term Changes of Atmospheric active Centers in Northern Winter and Its Relationship with China climate in recent 100 years. Acta Meteorol. Sin. 1997, 55, 750–758. (In Chinese) [Google Scholar]
  4. Ma, X.; Ding, Y.; Xu, H.; He, J. The Relation between Strong Cold Waves and Low-Frequency Waves during the Winter of 2004/2005. Chin. J. Atmos. Sci. 2008, 32, 380–394. (In Chinese) [Google Scholar]
  5. Zhu, A.; Ma, M.; Yang, X.; Ning, G. Temporal and Spatial Distribution Characteristics of Winter Temperature Anomalies in Eastern China over the recent 63 Years. J. Lanzhou Univ. Nat. Sci. 2016, 52, 75–83. (In Chinese) [Google Scholar]
  6. Zhi, R.; Gao, H. Northern hemisphere atmospheric circulation characteristics in winter 2018/2019 and its impact on temperature anomalies in China. Meteorol. Mon. 2019, 45, 296–303. (In Chinese) [Google Scholar]
  7. Takaya, K.; Nakamura, H. Mechanisms of intraseasonal amplification of the cold Siberian high. J. Atmos. Sci. 2005, 62, 4423–4440. [Google Scholar] [CrossRef]
  8. Bueh, C.; Xie, Z.W. An objective technique for detecting large-scale tilted ridges and troughs and its application to an East Asian Cold Event. Mon. Weather. Rev. 2015, 143, 4765–4783. [Google Scholar] [CrossRef]
  9. Qiu, Y. Mid-Term Weather Forecast; Science Press: Beijing, China, 1985. (In Chinese) [Google Scholar]
  10. Buehler, T.; Raible, C.C.; Stocker, T.F. The relationship of winter season North Atlantic blocking frequencies to extreme cold or dry spells in the ERA-40. Tellus A Dyn. Meteorol. Oceanogr. 2011, 63, 174–187. [Google Scholar]
  11. Li, Y.; Ma, M.; Wang, S.; Jin, R.; Hou, J.; Chen, Y. Analysis of Relationship Between Blocking Highs and Consecutive Precipitation During the Durative Low Temperature, Snowfall and Freezing Period in China. J. Arid. Meteorol. 2012, 30, 539–545. (In Chinese) [Google Scholar]
  12. Bueh, C.; Peng, J.B.; Lin, D.W.; Chen, B.M. On the two successive supercold waves straddling the end of 2020 and the beginning of 2021. Adv. Atmos. Sci. 2022, 39, 591–608. [Google Scholar] [CrossRef]
  13. Zheng, F.; Yuan, Y.; Ding, Y.; Li, K.; Fang, X.; Zhao, Y.; Sun, Y.; Zhu, J.; Ke, Z.; Wang, J.; et al. The 2020/21 extremely cold winter in China influenced by the synergistic effect of La Niña and warm Arctic. Adv. Atmos. Sci. 2022, 39, 546–552. [Google Scholar] [CrossRef]
  14. Zhang, L.; Hou, S.; Zhao, S.; Xie, Z. On the Successiveness of the Two Extreme Cold Events in China during the 2020/21 Winter According to Cold Air Trajectories. Atmosphere 2022, 13, 1915. [Google Scholar] [CrossRef]
  15. Dai, G.; Li, C.; Han, Z.; Luo, D.; Yao, Y. The Nature and Predictability of the East Asian Extreme Cold Events of 2020/21. Adv. Atmos. Sci. 2022, 39, 566–575. [Google Scholar] [CrossRef]
  16. Yao, Y.; Zhang, W.Q.; Luo, D.H.; Zhong, L.H.; Pei, L. Seasonal cumulative effect of Ural blocking episodes on the frequent cold events in China during the early winter of 2020/2021. Adv. Atmos. Sci. 2021, 39, 609–624. [Google Scholar] [CrossRef]
  17. Zhang, Y.; Si, D.; Ding, Y.; Jiang, D.; Li, Q.; Wang, G. Influence of Major Stratospheric Sudden Warming on the Unprecedented Cold Wave in East Asia in January 2021. Adv. Atmos. Sci. 2022, 39, 576–590. [Google Scholar] [CrossRef]
  18. Tao, Y.; Dai, K.; Dong, Q. Extreme analysis and ensemble prediction verification on cold wave process in January 2016. Meteorol. Mon. 2017, 43, 1176–1185. (In Chinese) [Google Scholar]
  19. Qi, L.; Ma, Q.; Zhang, W. Verification of forecasting capability of cold wave process in the winter of 2011/2012 with GRAPES. Trans. Atmos. Sci. 2017, 40, 791–802. (In Chinese) [Google Scholar]
  20. Hersbach, H.; Bell, B.; Berrisford, P.; Horányi, A.J.; Sabater, J.M.; Nicolas, J.; Radu, R.; Schepers, D.; Simmons, A.; Soci, C.; et al. Global Reanalysis: Goodbye ERA-Interim, Hello ERA5; ECMWF Newsletter, No. 159; ECMWF: Reading, UK, 2019; pp. 17–24. [Google Scholar]
  21. Li, X.; Chen, J.; Liu, Y.; Peng, F.; Huo, Z. Representations of initial uncertainty and model uncertainty of GRAPES global ensemble forecasting. Trans. Atmos. Sci. 2019, 42, 348–359. (In Chinese) [Google Scholar]
  22. Huo, Z.; Liu, Y.; Chen, J.; Li, X.; Qu, A. The preliminary appliation of tropical cyclone targeted singular vectors in the GRAPES global ensemble forecasts. Acta Meteorol. Sin. 2020, 78, 48–59. (In Chinese) [Google Scholar]
  23. Peng, F.; Li, X.; Chen, J.; Li, H.Q. A stochastic kinetic energy backscatter scheme for model perturbations in the GRAPES global ensemble prediction system. Acta Meteorol. Sin. 2019, 77, 180–195. (In Chinese) [Google Scholar]
  24. Peng, F.; Li, X.; Chen, J. Impacts of different stochastic physics perturbation schemes on the GRAPES Global Ensemble Prediction System. Acta Meteorol. Sin. 2020, 78, 972–987. (In Chinese) [Google Scholar]
  25. Cheung, H.H.N.; Zhou, W. Implications of Ural blocking for East Asian winter climate in CMIP5 GCMs, Part 1: Biases in the historical scenario. J. Clim. 2014, 28, 2203–2216. (In Chinese) [Google Scholar] [CrossRef]
  26. Li, Y.; Wang, J.; Wang, S. The integrated circulation anomalies of polar vortex, blocking and the Siberian high over the extreme low-temperature events. J. Lanzhou Univ. Nat. Sci. 2019, 55, 51–63. (In Chinese) [Google Scholar]
Figure 1. (ac) Temperature anomaly and (df) cooling rate during the cold waves “1228”, “0105”, and “0114” (unit: degC).
Atmosphere 14 00564 g001
Figure 2. The mean potential height (100 hPa) distribution during the cold wave processes of (a) “1228”, (b) “0105”, and (c) “0114”. The red box represents the region between 40° N and 70° N and 105° E to 135° E.
Atmosphere 14 00564 g002
Figure 3. The composites of mean potential height (500 hPa, shown in contours) and anomaly (shaded, unit: dagpm) for the three cold wave events. The events are labeled as “1228”, “0105”, and “0114”, respectively, with their start dates marked. (af) Represent the four days prior to, three days prior to, two days prior to, one day prior to, the same day as, and one day after the start date, respectively. The dotted area indicates anomalies with the same sign among the three cold wave events. The purple box highlights the key area of blocking high, which is located between 45° N and 80° N, and 65° E and 85° E.
Atmosphere 14 00564 g003
Figure 4. Similar to Figure 3, but it depicts the distribution of sea level pressure. (ad) Represent two days prior to, one day prior to, the same day as, and one day after the start date, respectively. The dotted area indicates anomalies with same sign among the three cold wave events. The purple box highlights the key area of Siberian high, which is located between 40° N and 60° N, and 80° E and 120° E.
Atmosphere 14 00564 g004
Figure 5. The time series of the Arctic Oscillation (AO) index at the bottom, the blocking high intensity index in the middle and lower sections, the Siberian high (SH) index in the middle and upper sections, and the average temperature (T) in eastern China (14° N–45° N, 105° E–120° E) from November 2020 to February 2021. The gray fill in the figure indicates the occurrence times of the three cold wave events.
Atmosphere 14 00564 g005
Figure 6. Time series of t2m in observations and forecasts with different lead times. The green fill in the figure represents the “1212” event. The gray fills in the figure represent the “1228”, “0105”, and “0114” events.
Atmosphere 14 00564 g006
Figure 7. The correlation coefficient of CMA-GEPS in forecasting the temperature of 2 m ahead for five days and observations during the (a) “1212”, (b) “1228”, (c) “0105”, and (d) “0114” cold wave events.
Atmosphere 14 00564 g007
Figure 8. The accuracy rate of the CMA-GEPS forecast of the national 2-m temperature during the 2020/2021 cold wave. The dotted line represents the absolute error of less than or equal to 2 °C, while the solid line represents the absolute error of less than or equal to 1 °C. The green fill in the figure represents the “1212” event. The gray fills in the figure represent the “1228”, “0105”, and “0114” events.
Atmosphere 14 00564 g008
Figure 9. (a) Anomalies of Siberian high intensity index in CMA-GEPS system and observation and (b) correlation coefficients between model and observation during the 2020/2021 cold wave. (c,d) are similar to (a,b) but are blocking high intensity index. The green fill in the figure represents the “1212” event. The gray fill in the figure represents the timing of the three cold wave events.
Atmosphere 14 00564 g009
Disclaimer/Publisher’s Note: The statements, opinions and data contained in all publications are solely those of the individual author(s) and contributor(s) and not of MDPI and/or the editor(s). MDPI and/or the editor(s) disclaim responsibility for any injury to people or property resulting from any ideas, methods, instructions or products referred to in the content.

