Article

Radiation and Temperature of a Tropical Grassland in Summer Times: Experimental Observations

1
Guangxi Hualan Geotechincal Engineering Limited Company (Group Co., Ltd.), 38 Wangzhou Road Beierli, Xixiangtang District, Nanning 530001, China
2
College of Civil Engineering and Architecture, Guangxi University, 100 University Road, Nanning 530004, China
3
School of Civil Engineering and Architecture, Guangxi Minzu University, 188 University Road, Nanning 530006, China
*
Author to whom correspondence should be addressed.
Atmosphere 2023, 14(4), 649; https://doi.org/10.3390/atmos14040649
Submission received: 16 February 2023 / Revised: 8 March 2023 / Accepted: 13 March 2023 / Published: 30 March 2023
(This article belongs to the Special Issue Passive Techniques for Sustainable Buildings and Cities)

Abstract

:
The surface texture of urbanized regions is altered by the replacement of natural vegetated surfaces with hardened pavement surfaces, which have been described as a heat source for the formation of urban heat islands. Grasslands may store rainfall in their roots and leaves for later cooling, but this has received little attention. This study investigated the radiant flux and temperature of a tropical grassland throughout the summer in order to understand the albedo, long-wave radiation, short-wave radiation, and surface temperature of the grassland over 10 days. The grassland had an albedo of 0.13, which did not fluctuate during the day compared to the albedo of other surfaces in metropolitan areas. Even if the local weather changes considerably, this albedo does not alter significantly. The surface temperature and the air temperature above the grassland increase linearly with the upwelling reflectance, incident solar radiation, and upwelling long-wave radiation. These two temperatures do not correspond with downwelling long-wave radiation, which is influenced by cloud cover in the sky. However, the peaks of these temperatures lag behind the incident shortwave radiation and net radiation that reaches the grassland surface. The finding that the thermal properties of grasslands could be harnessed to reduce the heat absorbed by urban surfaces provides valuable insights into the grasslands’ potential to mitigate the impacts of urbanization on temperature.

1. Introduction

Urbanization has altered local environments by increasing impermeable surfaces, building artificial structures, fragmenting the landscape, and more [1,2,3,4]. These surfaces include pavements, parking lots, concrete roofing, and other hardened surfaces. In the summertime, when exposed to sunlight, these surfaces typically absorb more sunlight than they used to and thus stay hotter [5]. Without evaporation, the heat released from these surfaces is sensible heat. It has been reported that the replacement of natural ground surfaces by man-made surfaces has contributed to urban heat islands (UHIs) in metropolitan areas, where the local air is several degrees warmer than the surrounding rural areas [6,7]. Understanding the thermal conditions of these surfaces is greatly important to find engineering solutions that can alleviate the urban heat island.
UHIs are a growing concern in cities around the world. UHIs occur when a city’s buildings, roads, and other infrastructure absorb and retain heat from the sun, creating a bubble of warm air that can be several degrees warmer than the surrounding countryside. In recent decades, the thermal characteristics of urban surfaces have been well studied. Oke’s group [8,9,10] studied the energetic basis of the urban heat island by analyzing the inherent complexity of the city-atmosphere system. A group of studies has been devoted to understanding energy partitions on the surfaces of bald roofs, green roofs, and ventilation roofs [11,12,13,14,15,16,17,18,19]. At the same time, the temperatures of different paved surfaces have been simulated and measured in order to understand the sensible heat, temperature development, and heat storage of these surfaces and to conclude the development of urban heat islands [20,21,22,23]. On a small scale, the temperature and thermal flux of these surfaces has been logged by designed sensors. Qin et al. [24] found that the temperature of a paved surface increased linearly with the absorbed solar radiation. Santamouris and Fiorito [25] found that an increase in an urban albedo of 0.1 resulted in a decrease in the ambient temperature of 0.09 °C. Over the last decade, many studies have attempted to find effective engineered solutions to cool urban surface temperatures as a strategy to mitigate urban heat island effects [1,22,26,27]. In addition, the thermal properties of these surfaces have been studied using remote sensing [28,29,30,31]. While remote sensing can visualize the temperature of urban texture on large scale, the anisotropy of the urban textures cannot be well decoded by remote sensing [32,33,34].
While the thermal properties of hardened surfaces have been widely studied, few studies have reported radiation and the heat of surfaces such as lakes and grassland. As an important urban texture, grasslands can hold water in their grassroots and leaves for subsequent cooling via transpiration and evaporation [35,36]. These meadows are planted with low-lying native grasses and wildflowers that are designed to absorb and store heat during the day and release it back into the atmosphere at night. By providing shade and insulation from the sun’s rays, urban meadows can help keep the temperature in cities cooler and reduce the intensity of UHIs. In addition, by planting vegetation and providing water features, UHI meadows have the potential to reduce temperatures in the built environment and create a more pleasant urban environment for citizens. Understanding these benefits is important to estimate the contribution of grassland to the urban heat island. The reasons why the radiation and heat of these surfaces receive little attentions lie in the fact that the temperature of these surfaces is hard to measure precisely, and these surfaces are the natural heat sink for urban heat islands [37,38,39]. Since few studies have been reported on the radiation and heat of grassland, it remains unknown in the albedo, upwelling long-wave radiation, surface temperature, and near-surface air temperature of grasslands. Therefore, this study measures the radiation and temperature of tropical grassland in the summertime to fill this gap, further understand its contribution to the UHIs and explore potential solutions for mitigating this effect.

2. Methods

To measure the radiation and temperature of tropical grassland, a four-component net radiometer (CNR4) manufactured by Kipp & Zonen, a company based in Delft, the Netherlands, with a measurement range from −2000 to 2000 W/m2 for net radiation and 0 to 2000 W/m2 for solar radiation and accuracy of ±5%, was applied in the experiment. The solar radiation (I), reflective solar radiation (R), upwelling long-wave radiation (U), and downwelling long-wave radiation (D) from a typical grassland were logged. The grassland was located at the western campus of Guangxi Minzu University (E108.20°, N22.84°, Figure 1), Nanning, Guangxi. The grassland was a square shape, with a length of 200 m and a width of 150 m. The north sits a small hill (about 10 m in height) covered with shrubs, and to both the east and the south is a 7-story building. Around this site is the campus, which is surrounded by buildings with 7–10 stories. The grassland is trimmed monthly. At the measurement time, the grass had a height of 10 cm approximately.
A radiometer was leveled at 0.5 m above the grassland to log I, R, U, and D at the center of the grassland. The radiometer was cantilevered by a rod that extended 2.0 m from the supporting tripod to minimize the impact of the tripod on the readings of the radiometer. There was a temperature sensor with an accuracy of ±0.1 °C embedded in the radiometer to log the temperature of the air (Ta) around the radiometer sensor. This temperature represents the air temperature (Ta) at 0.6 m above the grassland. While grassland surface temperature of grassland is hard to measure directly, it can be back-calculated via the upwelling long-wave radiation (U) according to the Stefan-Boltzmann law:
T s = U ε σ 4
where ε (−) is the emissivity of the grassland, which is usually taken as ε = 0.94 [40]; σ = 5.67 × 10⁻⁸ W·m−2·K−4 is the Stefan-Boltzmann constant. It is noted that the Ts estimated from Equation (1) is the temperature of the composite of grassland stem, grassland root, grassland leaves, and the exposed substrate soil.
The observation spanned from 29 July to 10 August 2022, which was a time spell of about two weeks. During this time, most days were sunny days, with between one and two days being partly cloudy and with one day showing heavy showers on and off throughout the day. Electric wires connected to sensors were routed to a case, which was covered to prevent it from being overturned by wind, becoming wet by rain, and exposed to the sun. The signals of all sensors were logged at an interval of one minute by a Campbell CR3000 compliment with AM16/32B 32-Channel Relay Multiplexer, both of which are manufactured by Campbell Scientific, Inc., a company based in Logan, Utah, United States. While I, R, U, and D can be measured directly, the net radiation (Rn) is a useful parameter to the thermal balance of the grassland. Rn stands for the net radiation absorbed by a surface and can be calculated by:
R n = I + D U R
It was noted that the data were measured in Beijing time, but the plotted data are shown in local standard solar time. In this study, MATLAB software, developed by MathWorks based in Natick, Massachusetts, United States, was employed to assist in the analysis of the data, with Adobe Illustrator developed by Adobe Inc., based in San Jose, California, United States for image post-processing.

3. Results

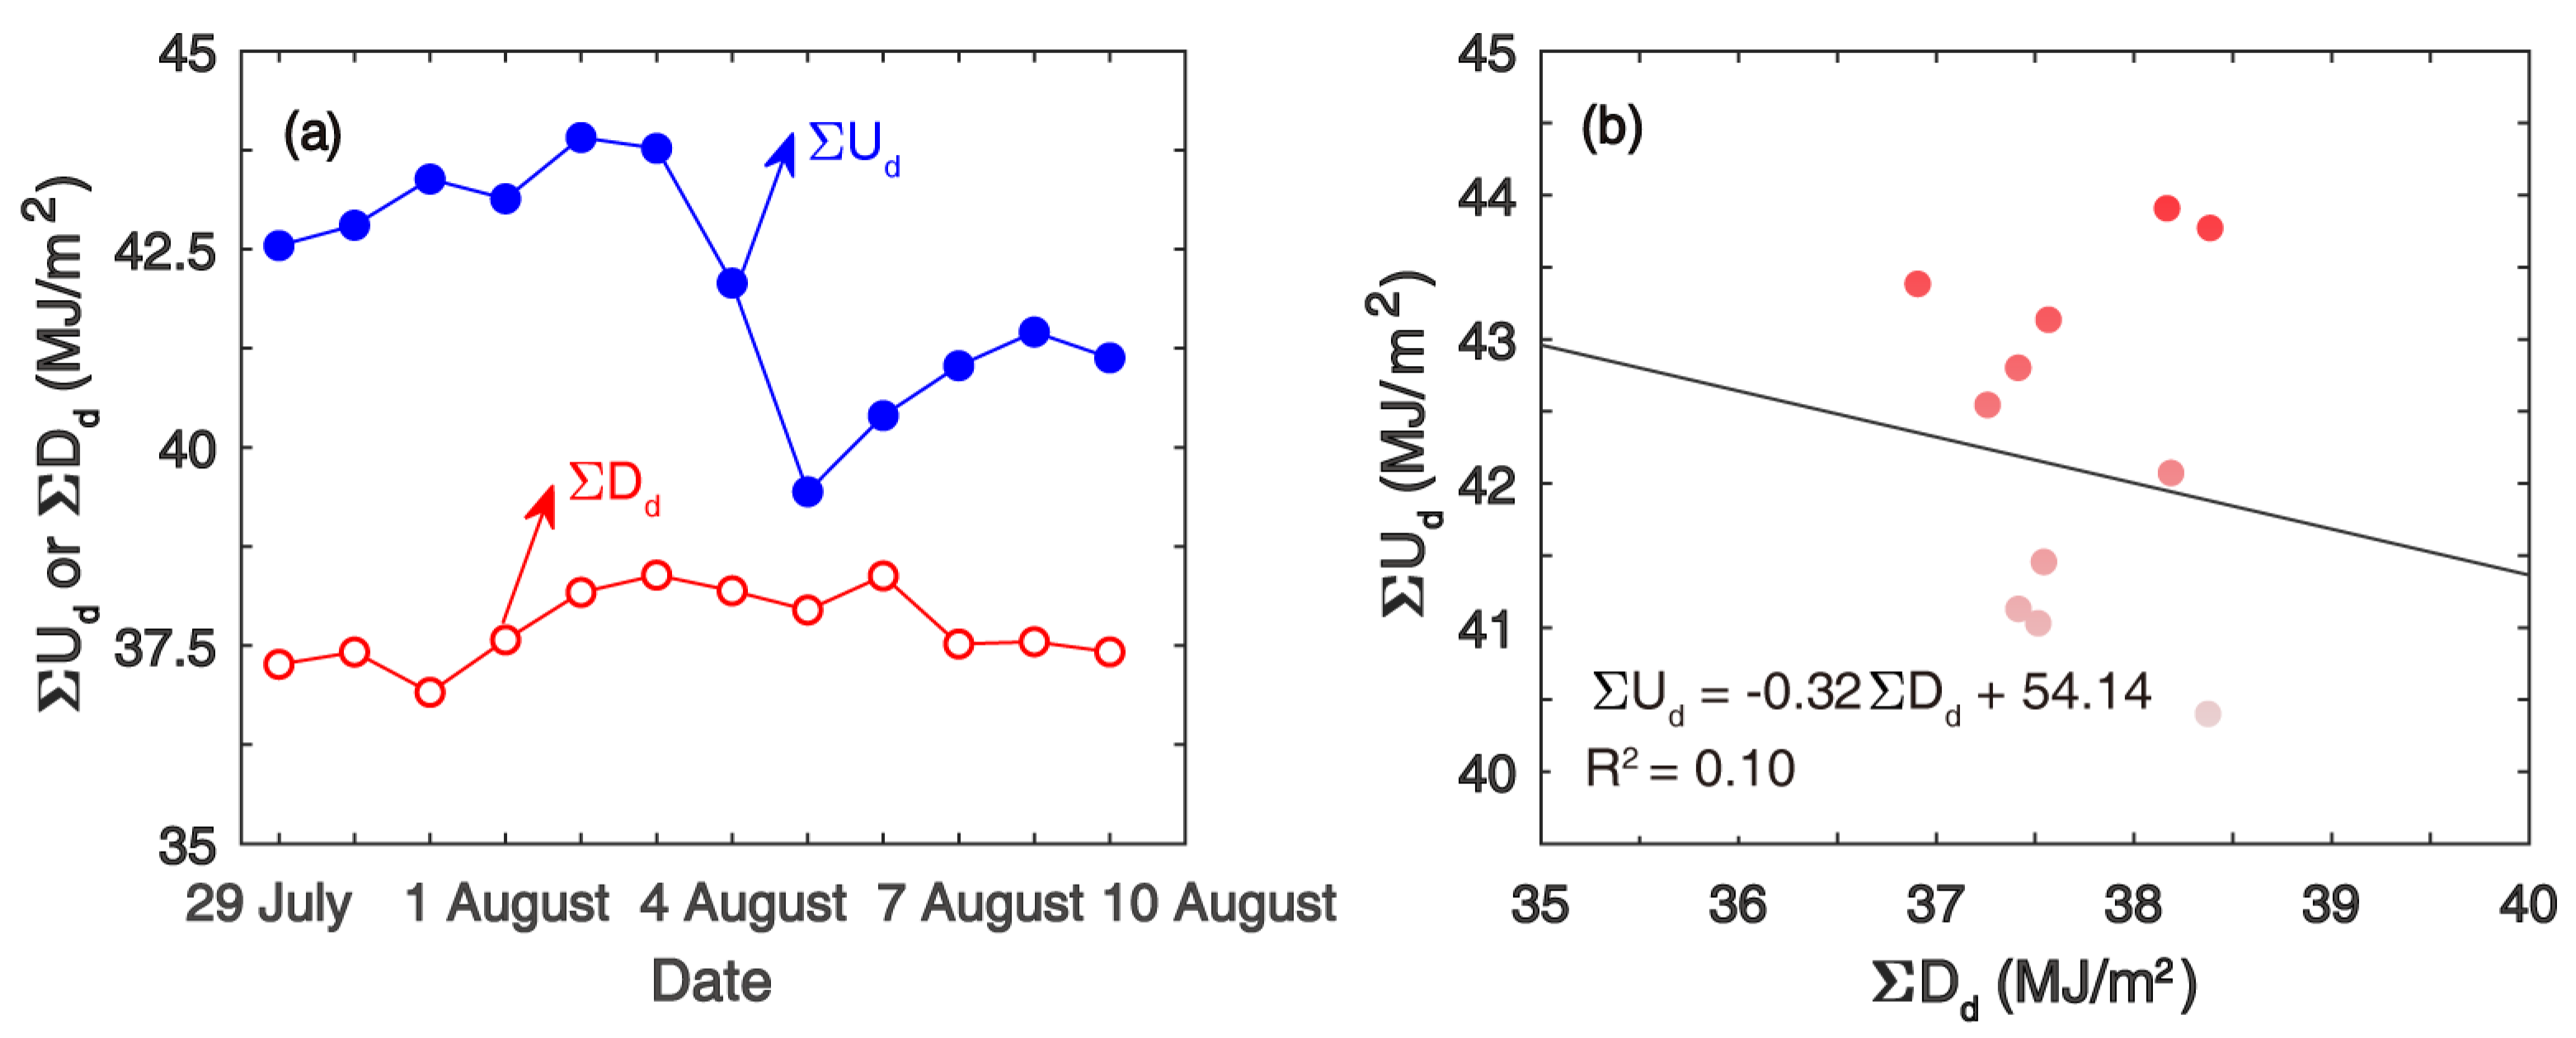
3.1. Upwelling and Downwelling Radiation of the Grassland

The observed variation in upwelling and downwelling short-wave radiation followed a distinct pattern. As can be seen in Figure 2a, the daily peak incident solar radiation varied significantly, ranging from 200 W/m2 on rainy days, 600 W/m2 on cloudy days, to 1000 W/m2 on sunny days. This reflects the typical weather conditions that are encountered. Similarly, the reflected radiation (R) follows a pattern similar to the incident radiation (I). The upwelling and downwelling long-wave radiations also exhibit a coincident variation, with a peak occurring in the afternoon, as shown in Figure 2b. It is noteworthy that the downwelling long-wave radiation (D) is smaller than the upwelling long-wave radiation due to the fact that the sky is consistently cooler than the grassland. Using the equation presented in Equation (2), the net radiation can be plotted, as shown in Figure 2c. The net radiation (Rn) shows a coincidental variation with the incident solar radiation. Additionally, the measured air temperature (Ta), shown in Figure 2d, seems to vary in conjunction with long-wave radiations.
In practice, the albedo of grassland is important to estimate the solar absorption of the ground texture. The albedo, on a scale of 0–1, is the ratio of the incident solar radiation to the reflected solar radiation. Usually, this ratio varies diurnally, with a low value at noon and a large value when the sun is in a low position. Due to these variations, it is hard to specify the albedo of a grassland. Here, we summated the daily incident solar radiation and the daily reflected solar radiation (Figure 3a) and found that the summated reflection (ΣRd) varied coincidently with the summated incident (ΣId). We then plotted ΣRd against ΣId and regressed them using a linear correlation of y = kx (Figure 3b). A correlation of ΣRd = 0.13 ΣId was found, with regression confidence of 0.99. Except for some small deviations when the ΣId was of high value, the line passed the original coordinate well. This correlation meant that the albedo of this grassland was about 0.13. This albedo was lower than the albedo measured by Takebayashi and Moriyama, who found that the albedo of the grassland varied from 0.19 to 0.24 [41]. Usually, the albedo of a surface varies over the course of days. However, in this grassland, the ΣRd varied just along the y = kx line, with very few deviations even on cloudy days (ΣId is a low value). As a result, it was concluded that the albedo of the grassland was insensitive to variations in the local weather.
ΣDd did not have a clear correlation with ΣUd. Similar to the short-wave radiation (I and R), it seemed that the upwelling and downwelling of long-wave radiations varied coincidently (Figure 4a). We thereby summated the daily downwelling long-wave radiation (ΣDd) and the daily upwelling long-wave radiation (ΣUd). It was found that ΣDd did not correlate with ΣUd clearly (Figure 4b). The reason for this is possible because the downwelling long-wave radiation was strongly affected by the clouds. During the measurement spell, the sky was occasionally full of clouds. This is especially the case when the summation on 31 July was viewed, as demonstrated by the ΣUd peaks and the ΣDd nadirs (Figure 4a). Revisiting the incident solar radiation on 31 July, one can find on this date, the incident solar radiation was seldom blocked by clouds, weather that has low downwelling long-wave radiation, and a great upwelling long-wave radiation. This correlation means that it is hard to model the downwelling radiation using the upwelling long-wave radiation.

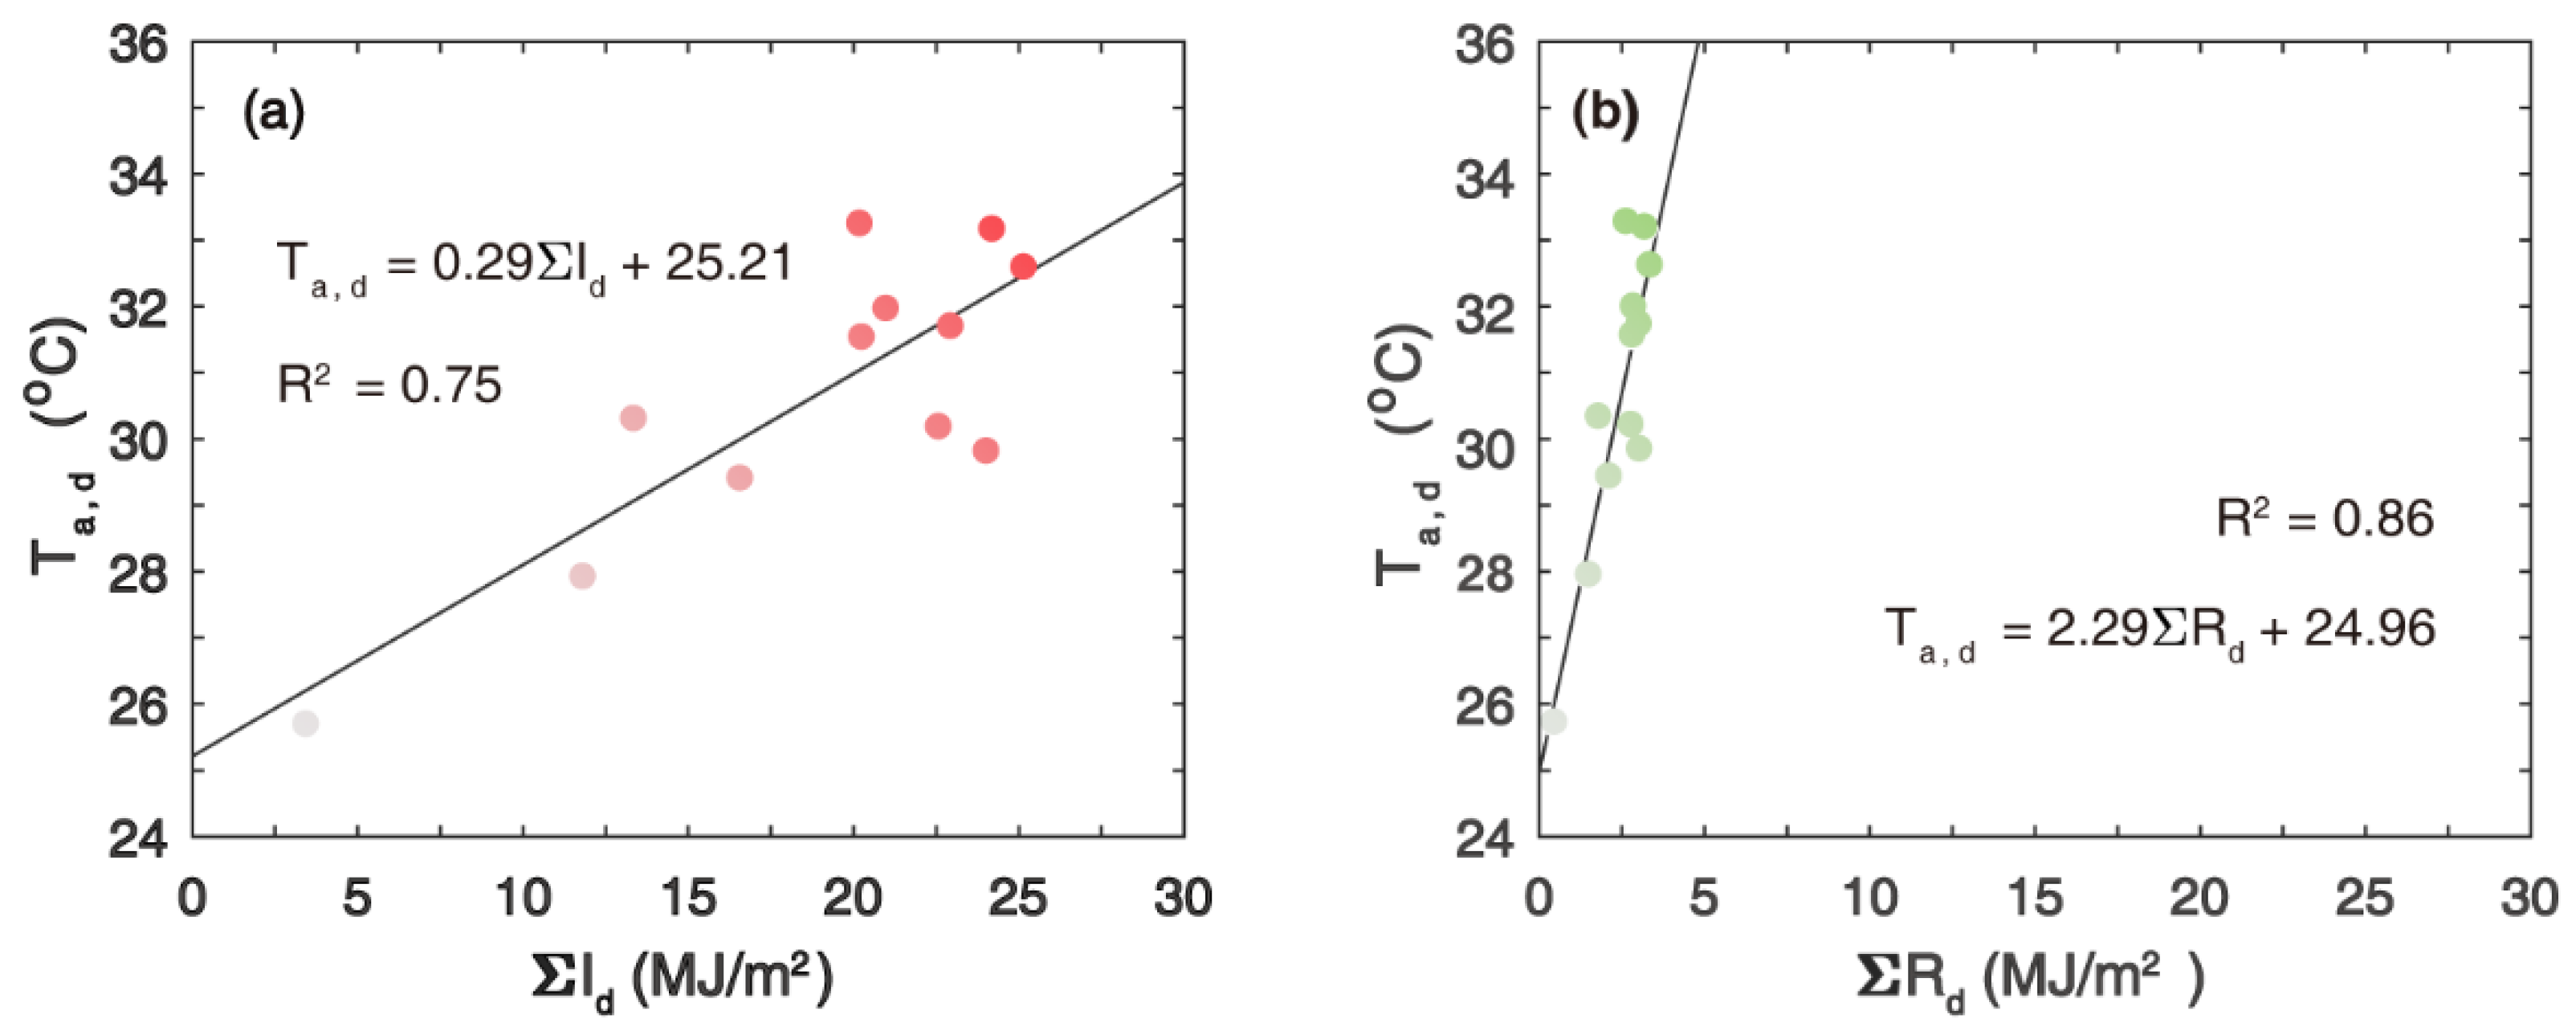
3.2. Radiation and Air Temperature of the Grassland

The daily mean near-ground air temperature (Ta,d) was corrected with ΣId and with ΣRd. It was found that Ta,d increased with ΣId, with a slope of 0.29 and a regression coefficient of 0.75 (Figure 5a). This is reasonable because the near-surface air temperature is heated up by the sensible heat from the ground. Similarly, Ta,d increased with ΣId, producing a slope of 2.29 and a regression coefficient of 0.86 (Figure 5b). This correlation means that the near-surface is heated up by the incident solar radiation. It is surprising that when the ΣId was of great value, the data deviated from the linear correlation. Intuitively, when the ΣId was higher, the impact of solar radiation on the near-ground air temperature was more apparent. In contrast, the impact of solar radiation weakens during the day with low ΣId. The reason for this pattern of deviation from linear correlation needs further investigation.
The daily mean near-ground air temperature (Ta,d) did not correlate with the cumulative downwelling long-wave radiation (ΣDd) but correlated to the cumulative upwelling long-wave radiation (ΣUd). As shown in Ta,d against the ΣDd (Figure 6a), the data are scattered, and it is hard to draw a confident correlation. The reason for this is that the ΣDd is primarily determined by the sky cloud cover but Ta,d, by the near-surface temperate. Figure 6b plotted the Ta,d against the ΣUd. It was found that the Ta,d correlated well with the ΣUd, with a slope of 1.76 (m2 K/MJ) and a coefficient of determination (R2) of 0.96. This correlation is reasonable because the air temperature measured in this study was 0.6 m above the ground, which is directly heated up by the sensible heat discharged from grassland.

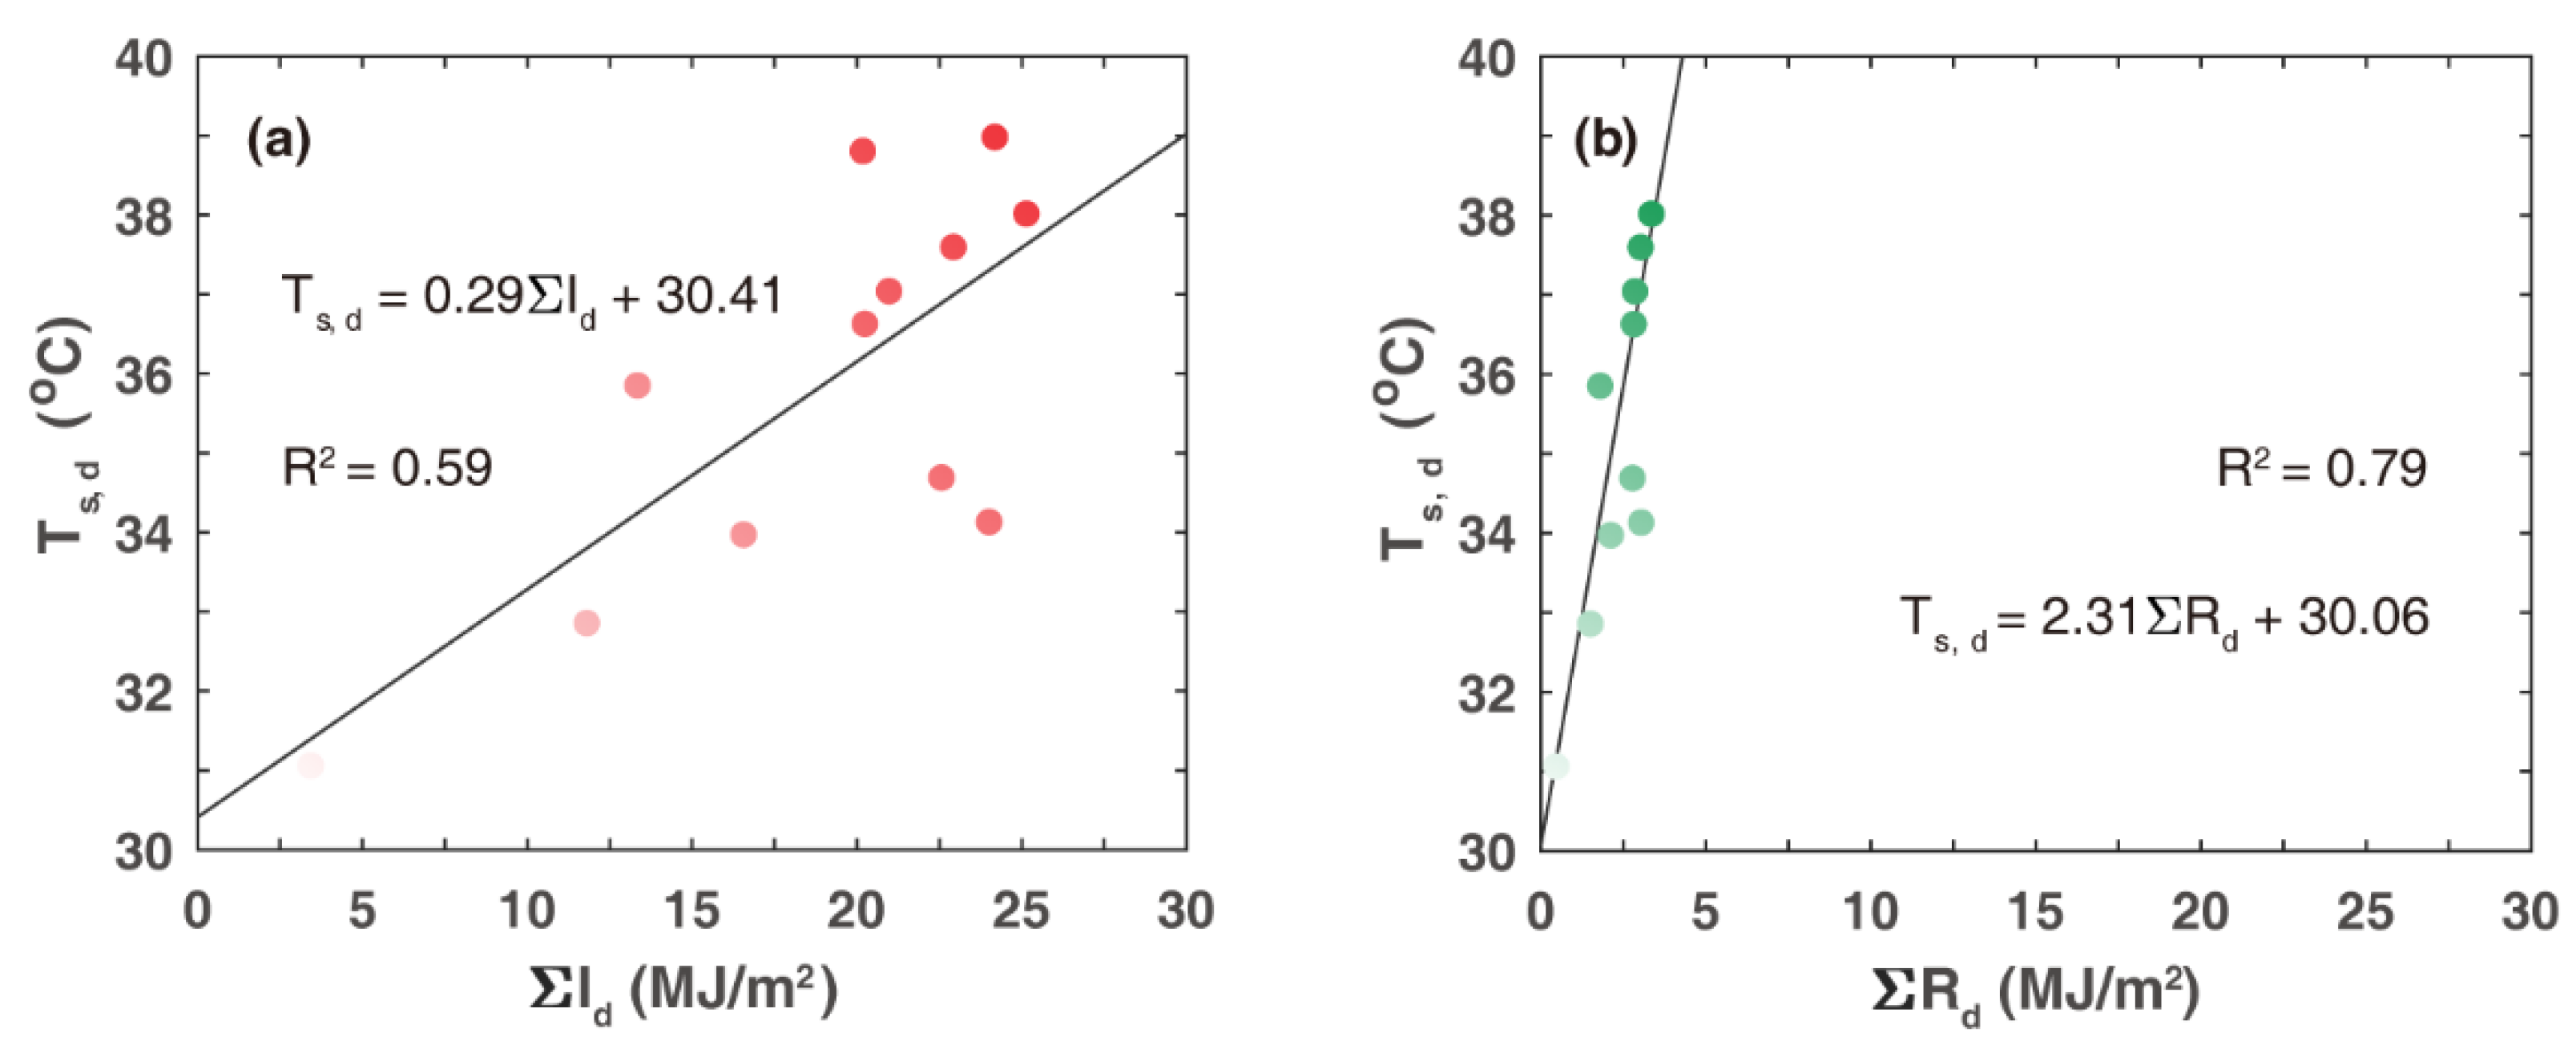
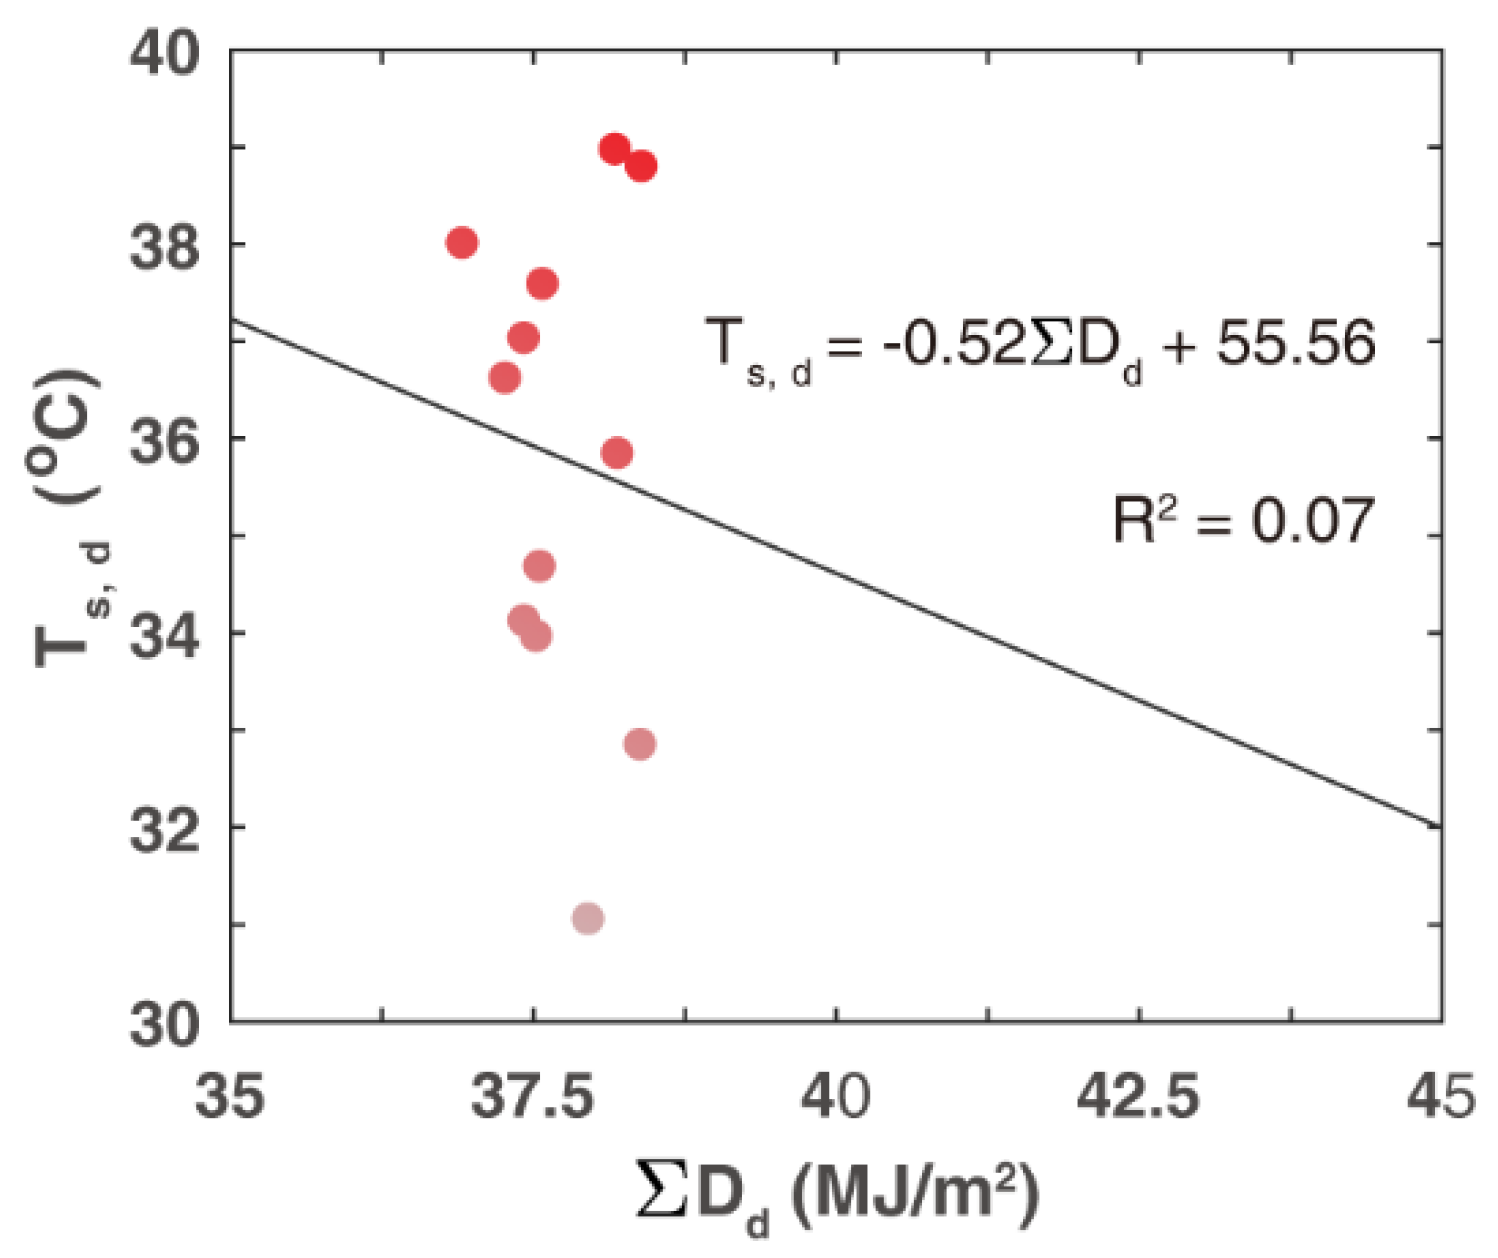
3.3. Radiation and Surface Temperature of the Grassland

Using the correlation in Equation (1), the grassland surface temperature corresponding to the upwelling long-wave radiation (U) can be computed. While U was logged in an interval of one minute, we averaged the U in the daily mean to reduce the randomness of the data. Figure 7a plots the daily surface temperature (Ts,d) against the daily downwelling solar radiation (ΣId). It was found that the ground Ts,d increased linearly with the ΣId. This is reasonable because the ground surface is heated up by solar radiation. The plot deviates somewhat from the linearity, meaning that other factors, such as air temperature and wind speed, also influence the ground surface temperature. Figure 7b further plots the daily reflected radiation (ΣRd) against the daily ground surface temperature (Ts,d). Geometrically, Ts,d also varies linearly with ΣRd except for some differences in the regression coefficient. The slope was 2.31, which is the production of 0.29 (Figure 7a) and the reflectance of the grassland (0.13, in Figure 3). Differently, in Figure 8, the daily grassland surface temperature (Ts,d) did not vary linearly with the daily downwelling long-wave radiation (ΣDd). This was expected because the downwelling long-wave radiation was not controlled by the cloud in the sky but by the grassland surface temperature by the incident solar radiation.

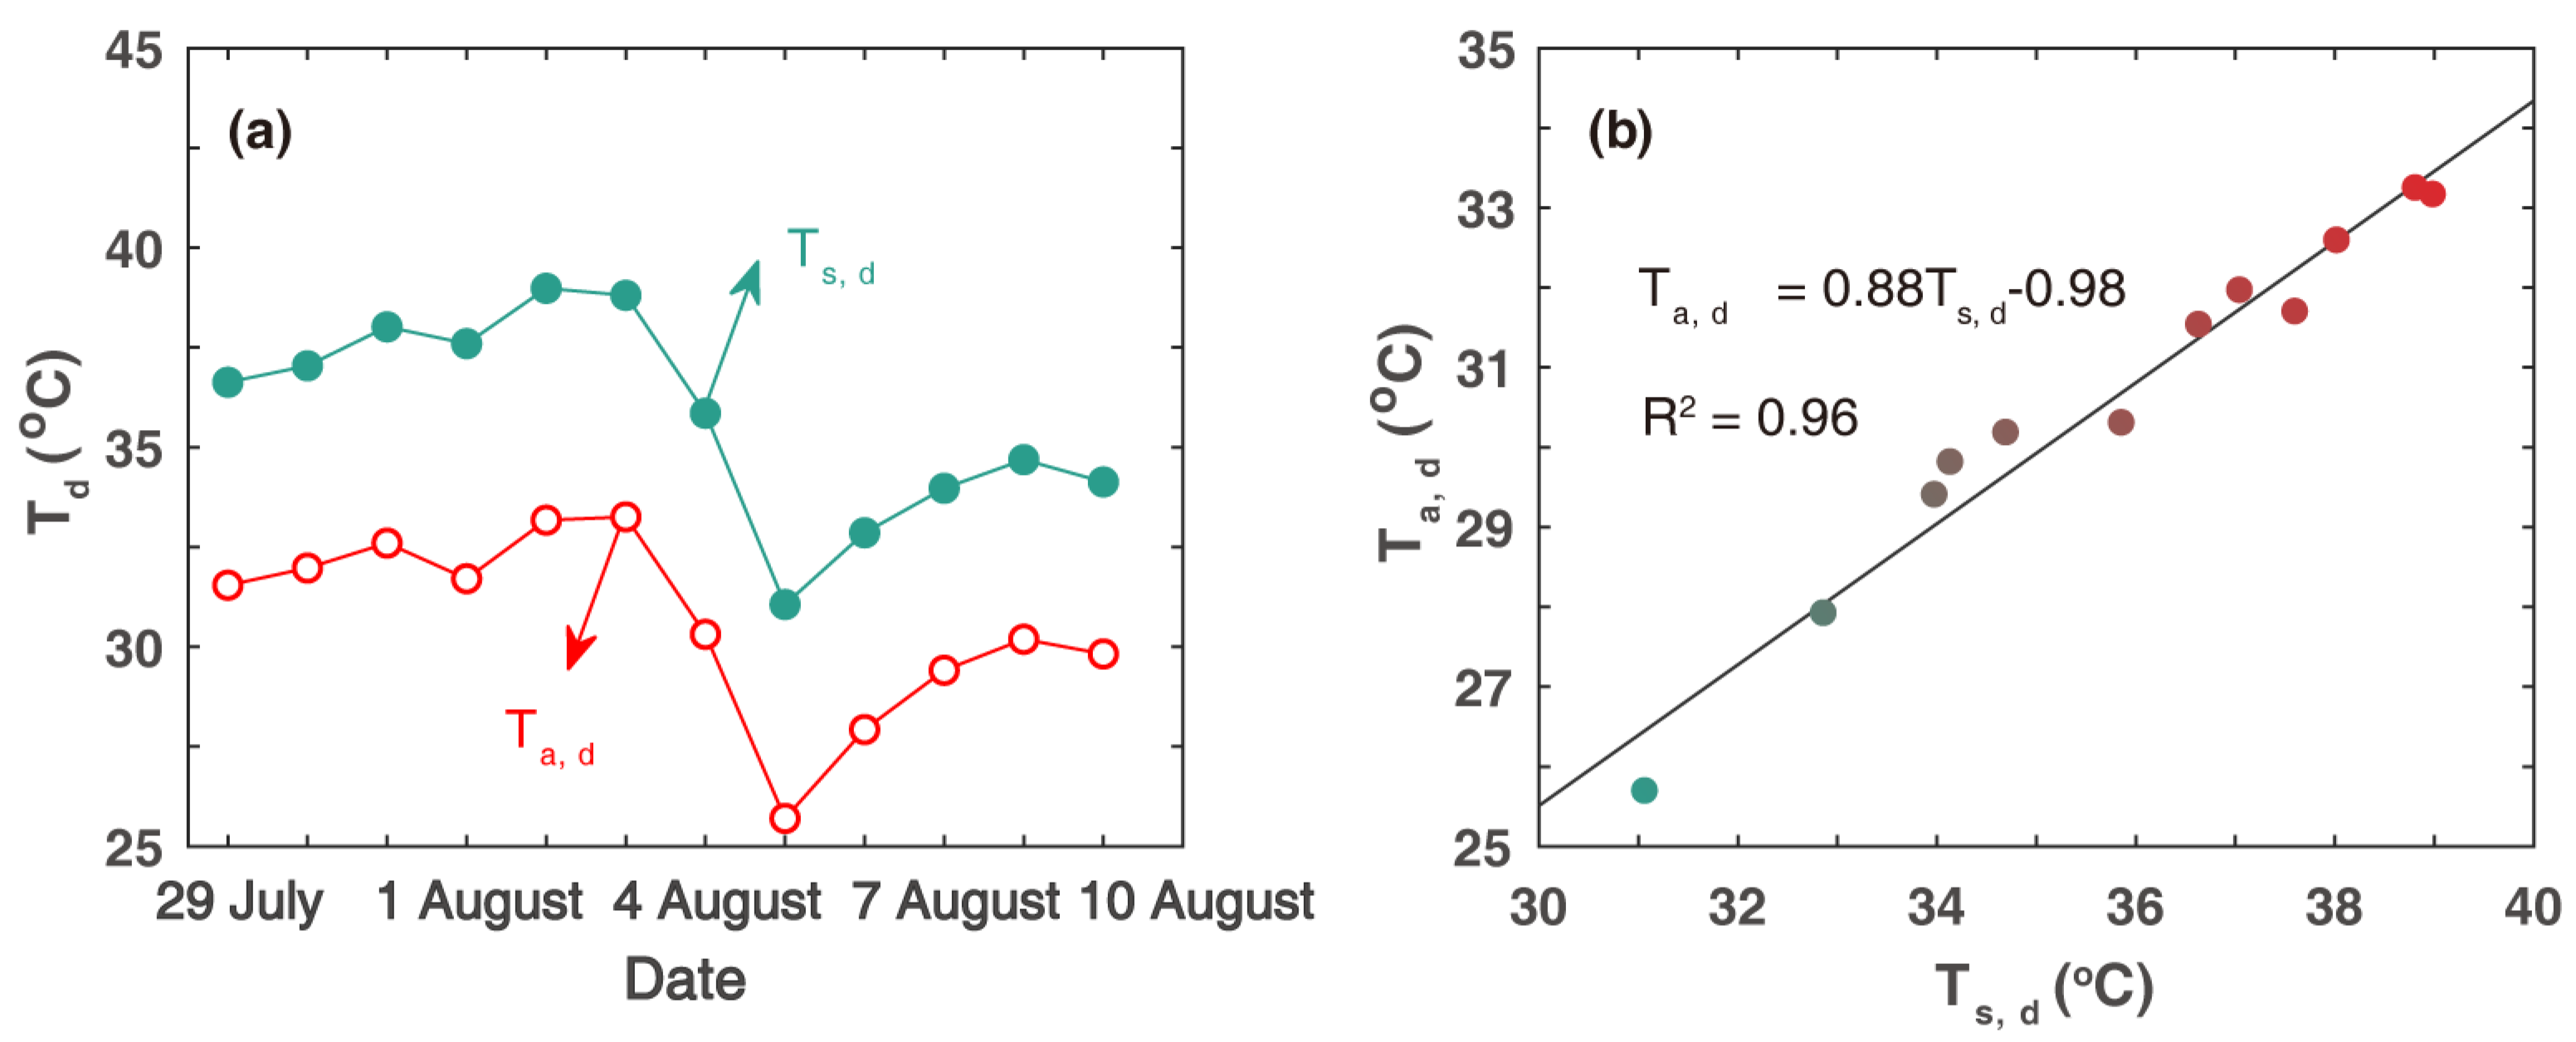
3.4. Ts,d Increases Linearly with Ta,d

The air at 0.5 m above the grassland was directly heated up by the grassland. Figure 9a shows the daily temperature of the grassland surface and of the air at 0.5 m above the grassland. It was found that Ts,d varied in the same pattern as the Ta,d (Figure 9a). The similarity meant that the Ta,d was directly heated by the heat released from the grassland as the air received sensible heat from the grassland. It further suggests that reducing the grassland surface temperature is critical when cooling the local air. As indicated in Figure 9b, Ta,d increased linearly with Ts,d, a slope of 0.88, and a regression coefficient of 0.96. The data do not deviate from the linearity even when the solar radiation is of high value. As indicated in Figure 7, Ts,d linearly increases the incident solar radiation, suggesting that reducing the solar absorption could effectively cool the air above the grassland.

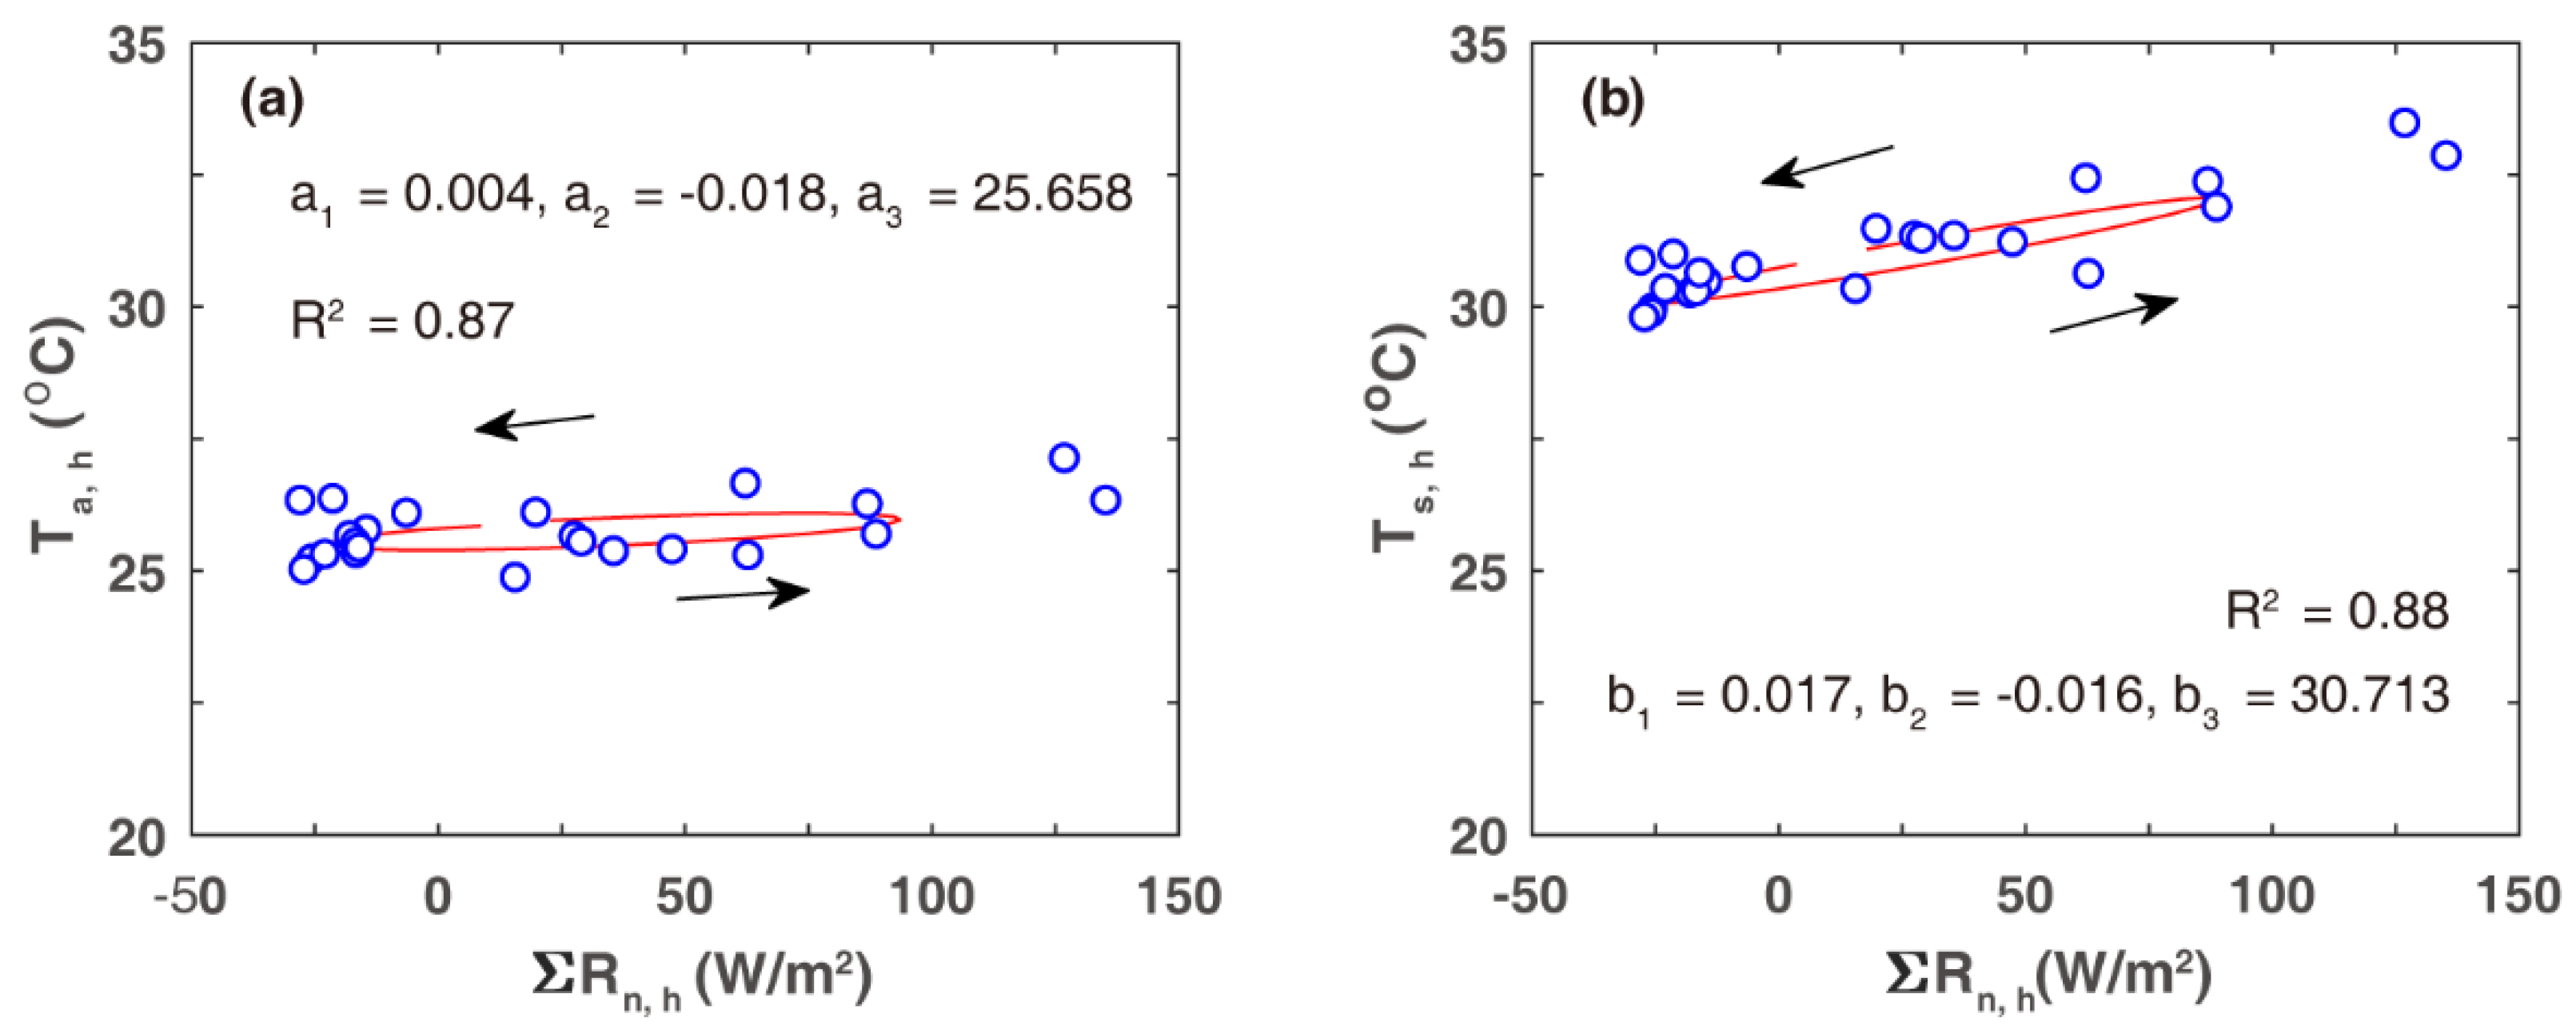
3.5. Temperature-Radiation Lag Effect of the Grassland

The correlation between the temperatures and the radiation of the grassland was further searched. Figure 10a plots the Rn,h against Ta,h on 29 July, which was a sunny day during the observations. It was found that the Ta,h did not vary linearly with the hourly net radiation; rather, the data were distributed elliptically along the major axis of an ellipse. Using the correlation of Equation (3), where a1, a2 and a3 are regressed coefficients, we found a lag effect coefficient of a2 = −0.03 and a regression coefficient of 0.91. Similarly, Figure 10b plots the Rn,h against Ts,h on 29 July, which obeys Equation (4), and a lag effect coefficient of b2 = −0.027 and a regression coefficient of 0.97 was found. These two regressions mean that both the grassland surface temperature and the above air temperature varied coincidently, without a notable lag effect. However, both these two temperatures varied by 0.03 behind the net radiation, which was about 3.0 h, according to Qin and Hiller [42]. The lag effect of temperature and net radiation on 5 August, which was a cloudy day, was further plotted (Figure 11). It was found that the lag-effect coefficient was a2 = −0.018 and b2 = −0.016, respectively. This is reasonable because, on a cloudy day, both the air temperature and the grassland temperature are controlled less by solar radiation and more by ground heat storage. Other parameters related to the temperature-radiation lag effect of the grassland can be found in Table 1.
T a , h = a 1 R n , h + a 2 R n , h t + a 3
T s , h = b 1 R n , h + b 2 R n , h t + b 3

4. Discussion

This study aimed to measure the radiation and temperature of a tropical grassland during summertime, with the goal of understanding its contribution to the urban heat island (UHI) effect and exploring potential solutions for mitigating this impact. The results of the study showed that the albedo of the grassland was about 0.13, which is lower than that measured by others [41]. The variation in the upwelling and downwelling of short-wave radiation followed a distinct pattern, with a daily peak incident solar radiation ranging from 200 W/m2 on rainy days to 1000 W/m2 on sunny days. The upwelling and downwelling long-wave radiations exhibited a coincidental variation, with a peak occurring in the afternoon. The downwelling long-wave radiation was smaller than the upwelling long-wave radiation, likely due to the fact that the sky was consistently cooler than the grassland. The net radiation coincided with the incident solar radiation, and the measured air temperature varied in conjunction with the long-wave radiations.
Our findings are consistent with previous research on grasslands and their potential role in mitigating UHIs [43,44]. The low albedo of the grassland suggests that it is an important absorber of solar radiation, which is essential for reducing the amount of heat absorbed by the surface. This supports the idea that grasslands can act as natural heat sinks for UHIs. By absorbing and storing heat during the day, grasslands can help to keep the temperature in cities cooler and reduce the intensity of UHIs.
Additionally, this study’s results suggest that grasslands may be a useful tool for reducing the impact of UHIs on the built environment. By planting vegetation and providing water features, UHI meadows have the potential to reduce temperatures in the built environment and create a more pleasant urban environment for citizens. These findings are consistent with previous research on green roofs and other green infrastructures that have been shown to reduce the impact of UHIs [45].
However, some limitations to this study should be noted. For instance, a specific grassland was focused on in this study, and thus, it would be interesting to investigate how different types of grassland, with varying vegetation density and water content, affect their thermal properties. Furthermore, studying the influence of cloud cover on the thermal properties of grassland and further shedding light on the mechanisms driving temperature variations in different weather conditions were not mentioned in this research. Another promising avenue for future research would be to explore the impact of anthropogenic activities, such as grazing or mowing, on the thermal properties of grasslands and their ability to store and release heat. Finally, employing more advanced measurement techniques, such as thermal imaging, would enable a more in-depth understanding of the spatial and temporal variability of grassland temperatures and their underlying processes.

5. Conclusions

A radiometer was placed 0.5 m above a grassland to log downwelling and upwelling radiation in order to better understand the thermal dynamics of a grassland. A temperature of 0.5 m above the grassland was also recorded. The grassland surface temperature was regressed by estimating upwelling long-wave radiation using the Stefan-Boltzmann formula. Based on the analysis of the relationship between solar radiation (I), reflective solar radiation (R), upwelling long-wave radiation (U), and downwelling long-wave radiation (D) from a typical grassland, the preliminary conclusions below were obtained.
(1)
The grassland has an albedo of around 0.13. While the albedo of a surface normally fluctuates with incoming radiation, the albedo of the grassland varies less over the course of a day.
(2)
The temperature of the air above the grassland changes linearly with downwelling short-wave radiation and upwelling long-wave radiation in this grassland but fluctuates arbitrarily with downwelling long-wave radiation. This is due to the fact that the cloud in the sky controls the downwelling long-wave radiation.
(3)
The grassland surface temperature and near-surface air temperature fluctuate concurrently, both of which lag behind incoming shortwave radiation and net radiation.

Author Contributions

Conceptualization, T.W.; Data curation, T.W.; Investigation, C.H. and Y.Q.; Methodology, C.H. and Y.Q.; Writing—original draft, Y.L.; Writing—review and editing, Y.L. All authors have read and agreed to the published version of the manuscript.

Funding

This research was funded by the 2022 Project of Scientific Research Basic Ability Improvement for Young and Middle-aged Teachers in Guangxi Universities, grant number 2022KYO161 (to C. Huang).

Institutional Review Board Statement

Not applicable.

Informed Consent Statement

Not applicable.

Data Availability Statement

The data that support the findings of this study are available from the corresponding author upon reasonable request.

Conflicts of Interest

The authors declare no conflict of interest.

Nomenclature

VariablesUnitPhysical Meanings
IW/m2Incident solar radiation
RW/m2Reflected solar radiation
UW/m2Upwelling long-wave radiation
DW/m2Downwelling long-wave radiation
RnW/m2Net radiation
T°CTemperature
Σx-The daily summation of variable x
Subscript
sGround surface
aAir
hHourly
dDaily

References

  1. Srikanth, K.; Swain, D. Urbanization and Land surface temperature changes over Hyderabad, a semi-arid mega city in India. Remote Sens. Appl. 2022, 28, 100858. [Google Scholar] [CrossRef]
  2. Nguyen, C.T.; Chidthaisong, A.; Limsakul, A.; Varnakovida, P.; Ekkawatpanit, C.; Diem, P.K.; Diep, N.T.H. How do disparate urbanization and climate change imprint on urban thermal variations? A comparison between two dynamic cities in Southeast Asia. Sustain. Cities. Soc. 2022, 82, 103882. [Google Scholar] [CrossRef]
  3. Mathew, A.; Sarwesh, P.; Khandelwal, S. Investigating the contrast diurnal relationship of land surface temperatures with various surface parameters represent vegetation, soil, water, and urbanization over Ahmedabad city in India. Energy Nexus 2022, 5, 100044. [Google Scholar] [CrossRef]
  4. Bayazıt, Y.; Koç, C.; Bakış, R. Urbanization impacts on flash urban floods in Bodrum Province, Turkey. Hydrolog. Sci. J. 2021, 66, 118–133. [Google Scholar] [CrossRef]
  5. Qin, Y. A review on the development of cool pavements to mitigate urban heat island effect. Renew. Sust. Energy Rev. 2015, 52, 445–459. [Google Scholar] [CrossRef]
  6. Wang, X.; Li, H.; Sodoudi, S. The effectiveness of cool and green roofs in mitigating urban heat island and improving human thermal comfort. Build. Environ. 2022, 217, 109082. [Google Scholar] [CrossRef]
  7. Li, D.; Bou-Zeid, E.; Oppenheimer, M. The effectiveness of cool and green roofs as urban heat island mitigation strategies. Environ. Res. Lett. 2014, 9, 055002. [Google Scholar] [CrossRef]
  8. Oke, T.R. The energetic basis of the urban heat island. Q. J. R. Meteor. Soc. 1982, 108, 1–24. [Google Scholar] [CrossRef]
  9. Oke, T.R. The distinction between canopy and boundary-layer urban heat islands. Atmosphere 1976, 14, 268–277. [Google Scholar] [CrossRef] [Green Version]
  10. Oke, T.R. The urban energy balance. Prog. Phys. Geog. 1988, 12, 471–508. [Google Scholar] [CrossRef]
  11. Sangkakool, T.; Techato, K.; Zaman, R.; Brudermann, T. Prospects of green roofs in urban Thailand—A multi-criteria decision analysis. J. Clean. Prod. 2018, 196, 400–410. [Google Scholar] [CrossRef]
  12. Meng, E.; Yang, J.; Zhou, B.; Wang, C.; Li, J. Preparation and thermal performance of phase change material (PCM) foamed cement used for the roof. J. Bulid. Eng. 2022, 53, 104579. [Google Scholar] [CrossRef]
  13. Sinsel, T.; Simon, H.; Broadbent, A.M.; Bruse, M.; Heusinger, J. Modeling impacts of super cool roofs on air temperature at pedestrian level in mesoscale and microscale climate models. Urban Clim. 2021, 40, 101001. [Google Scholar] [CrossRef]
  14. Kuang, W.; Li, Z.; Hamdi, R. Comparison of surface radiation and turbulent heat fluxes in Olympic Forest Park and on a building roof in Beijing, China. Urban Clim. 2020, 31, 100562. [Google Scholar] [CrossRef]
  15. Konopka, J.; Heusinger, J.; Weber, S. Extensive Urban Green Roof Shows Consistent Annual Net Uptake of Carbon as Documented by 5 Years of Eddy-Covariance Flux Measurements. J. Geophys. Res.-Biogeosci. 2021, 126, e2020JG005879. [Google Scholar] [CrossRef]
  16. De-Ville, S.; Menon, M.; Jia, X.; Reed, G.; Stovin, V. The impact of green roof ageing on substrate characteristics and hydrological performance. J. Hydrol. 2017, 547, 332–344. [Google Scholar] [CrossRef]
  17. Mastrapostoli, E.; Santamouris, M.; Kolokotsa, D.; Vassilis, P.; Venieri, D.; Gompakis, K. On the ageing of cool roofs: Measure of the optical degradation, chemical and biological analysis and assessment of the energy impact. Energy Build. 2016, 114, 191–199. [Google Scholar] [CrossRef]
  18. Alchapar, N.L.; Correa, E.N. Aging of roof coatings. Solar reflectance stability according to their morphological characteristics. Constr. Build. Mater. 2016, 102, 297–305. [Google Scholar] [CrossRef]
  19. Zingre, K.T.; Wan, M.P.; Wong, S.K.; Toh, W.B.T.; Lee, I.Y.L. Modelling of cool roof performance for double-skin roofs in tropical climate. Energy 2015, 82, 813–826. [Google Scholar] [CrossRef]
  20. Liu, M.; Zheng, H.; Niu, F.; Fang, J.; Lin, Z.; Luo, J.; Yin, G. Cooling performance enhancement of a new expressway embankment in the Tibetan Plateau permafrost zone. Cold Reg. Sci. Technol. 2021, 190, 103345. [Google Scholar] [CrossRef]
  21. Dong, Y.; Chen, J.; Yuan, K.; Jin, L.; Zhu, D.; Zhang, H.; Peng, H. A field embankment test along the Gonghe-Yushu Expressway in the permafrost regions of the Qinghai-Tibet Plateau. Cold Reg. Sci. Technol. 2020, 170, 102941. [Google Scholar] [CrossRef]
  22. Wang, J.; Meng, Q.; Zhang, L.; Zhang, Y.; He, B.-J.; Zheng, S.; Santamouris, M. Impacts of the water absorption capability on the evaporative cooling effect of pervious paving materials. Build. Environ. 2019, 151, 187–197. [Google Scholar] [CrossRef]
  23. Tan, K.; Qin, Y.; Wang, J. Evaluation of the properties and carbon sequestration potential of biochar-modified pervious concrete. Constr. Build. Mater. 2022, 314, 125648. [Google Scholar] [CrossRef]
  24. Qin, Y.; Liang, J.; Tan, K.; Li, F. The amplitude and maximum of daily pavement surface temperature increase linearly with solar absorption. Road Mater. Pavement 2017, 18, 440–452. [Google Scholar] [CrossRef]
  25. Santamouris, M.; Fiorito, F. On the impact of modified urban albedo on ambient temperature and heat related mortality. Sol. Energy 2021, 216, 493–507. [Google Scholar] [CrossRef]
  26. Fahed, J.; Kinab, E.; Ginestet, S.; Adolphe, L. Impact of urban heat island mitigation measures on microclimate and pedestrian comfort in a dense urban district of Lebanon. Sustain. Cities Soc. 2020, 61, 102375. [Google Scholar] [CrossRef]
  27. Zhang, L.; Pan, Z.; Zhang, Y.; Meng, Q. Impact of climatic factors on evaporative cooling of porous building materials. Energy Build. 2018, 173, 601–612. [Google Scholar] [CrossRef]
  28. Cecilia, A.; Casasanta, G.; Petenko, I.; Conidi, A.; Argentini, S. Measuring the urban heat island of Rome through a dense weather station network and remote sensing imperviousness data. Urban Clim. 2023, 47, 101355. [Google Scholar] [CrossRef]
  29. Kimothi, S.; Thapliyal, A.; Gehlot, A.; Aledaily, A.N.; Gupta, A.; Bilandi, N.; Singh, R.; Kumar Malik, P.; Vaseem Akram, S. Spatio-temporal fluctuations analysis of land surface temperature (LST) using Remote Sensing data (LANDSAT TM5/8) and multifractal technique to characterize the urban heat Islands (UHIs). Sustain. Energy Technol. 2023, 55, 102956. [Google Scholar] [CrossRef]
  30. Halder, B.; Bandyopadhyay, J.; Banik, P. Monitoring the effect of urban development on urban heat island based on remote sensing and geo-spatial approach in Kolkata and adjacent areas, India. Sustain. Cities Soc. 2021, 74, 103186. [Google Scholar] [CrossRef]
  31. Chatterjee, U.; Majumdar, S. Impact of land use change and rapid urbanization on urban heat island in Kolkata city: A remote sensing based perspective. J. Urban Manag. 2022, 11, 59–71. [Google Scholar] [CrossRef]
  32. Shatnawi, N.; Abu Qdais, H. Mapping urban land surface temperature using remote sensing techniques and artificial neural network modelling. Int. J. Remote Sens. 2019, 40, 3968–3983. [Google Scholar] [CrossRef]
  33. Logan, T.M.; Zaitchik, B.; Guikema, S.; Nisbet, A. Night and day: The influence and relative importance of urban characteristics on remotely sensed land surface temperature. Remote Sens. Environ. 2020, 247, 111861. [Google Scholar] [CrossRef]
  34. Almeida, C.R.; Teodoro, A.C.; Gonçalves, A. Study of the Urban Heat Island (UHI) Using Remote Sensing Data/Techniques: A Systematic Review. Environments 2021, 8, 105. [Google Scholar] [CrossRef]
  35. Shen, X.; Liu, Y.; Wu, L.; Ma, R.; Wang, Y.; Zhang, J.; Wang, L.; Liu, B.; Lu, X.; Jiang, M. Grassland greening impacts on global land surface temperature. Sci. Total Environ. 2022, 838, 155851. [Google Scholar] [CrossRef]
  36. Mohammad Harmay, N.S.; Kim, D.; Choi, M. Urban Heat Island associated with Land Use/Land Cover and climate variations in Melbourne, Australia. Sustain. Cities Soc. 2021, 69, 102861. [Google Scholar] [CrossRef]
  37. Lin, Y.; Wang, Z.; Jim, C.Y.; Li, J.; Deng, J.; Liu, J. Water as an urban heat sink: Blue infrastructure alleviates urban heat island effect in mega-city agglomeration. J. Clean. Prod. 2020, 262, 121411. [Google Scholar] [CrossRef]
  38. Zhu, D.; Zhou, X.; Cheng, W. Water effects on urban heat islands in summer using WRF-UCM with gridded urban canopy parameters—A case study of Wuhan. Build. Environ. 2022, 225, 109528. [Google Scholar] [CrossRef]
  39. Kwon, Y.J.; Lee, D.K.; Kim, J.-H.; Oh, K. Improving urban thermal environments by analysing sensible heat flux patterns in zoning districts. Cities 2021, 116, 103276. [Google Scholar] [CrossRef]
  40. Voogt, J.A.; Oke, T.R. Complete Urban Surface Temperatures. J. Appl. Meteorol. Clim. 1997, 36, 1117–1132. [Google Scholar] [CrossRef]
  41. Takebayashi, H.; Moriyama, M. Study on the urban heat island mitigation effect achieved by converting to grass-covered parking. Sol. Energy 2009, 83, 1211–1223. [Google Scholar] [CrossRef] [Green Version]
  42. Qin, Y.; Hiller, J.E. Understanding pavement-surface energy balance and its implications on cool pavement development. Energy Build. 2014, 85, 389–399. [Google Scholar] [CrossRef]
  43. Tiwari, A.; Kumar, P.; Kalaiarasan, G.; Ottosen, T.-B. The impacts of existing and hypothetical green infrastructure scenarios on urban heat island formation. Environ. Pollut. 2021, 274, 115898. [Google Scholar] [CrossRef] [PubMed]
  44. Imran, H.M.; Kala, J.; Ng, A.W.M.; Muthukumaran, S. Effectiveness of vegetated patches as Green Infrastructure in mitigating Urban Heat Island effects during a heatwave event in the city of Melbourne. Weather Clim. Extrem. 2019, 25, 100217. [Google Scholar] [CrossRef]
  45. Tan, K.; Wang, J. Substrate modified with biochar improves the hydrothermal properties of green roofs. Environ. Res. 2023, 216, 114405. [Google Scholar] [CrossRef] [PubMed]
Figure 1. The measuring site (a) Aerial view of the testing site, (b) Photo about the setting of the radiometers.
Atmosphere 14 00649 g001
Figure 2. Measured data for (a) I and U, (b) U and D, (c) Rn, (d) T.
Atmosphere 14 00649 g002
Figure 3. Id and ΣRd. (a) Daily cumulative solar radiation and reflected solar radiation, (b) ΣId correlates well with ΣRd, meaning that the grassland had an albedo of 0.13.
Atmosphere 14 00649 g003
Figure 4. Dd and ΣUd. (a) Daily cumulative long-wave radiation, (b) ΣDd does not correlate with ΣUd.
Atmosphere 14 00649 g004
Figure 5. The daily near-ground air temperature (Ta,d) corrected with (a) ΣId and with (b) ΣRd.
Atmosphere 14 00649 g005
Figure 6. The daily near-ground air temperature (Ta,d) uncorrected with (a) ΣDd, and (b) increasing linearly with ΣUd.
Atmosphere 14 00649 g006
Figure 7. The daily surface temperature (Ts, d) of the grassland corrected with (a) ΣId and with (b) ΣRd.
Atmosphere 14 00649 g007
Figure 8. The daily grassland surface temperature (Ts,d) did not vary linearly with daily downwelling long-wave radiation ΣDd.
Atmosphere 14 00649 g008
Figure 9. Grassland surface temperature (Ts,d) increases linearly with above-air temperature (Ta,d). (a) variation of daily average temperature, (b) relationship between Ts,d and Ta,d.
Atmosphere 14 00649 g009
Figure 10. Lag effect between Rn,h and Th on July 29. (a) Rn,h and Ta,h; (b) Rn,h and Ts,h.
Atmosphere 14 00649 g010
Figure 11. Lag effect between Rn,h and Th on August 5. (a) Rn,h and Ta,h; (b) Rn,h and Ts,h.
Atmosphere 14 00649 g011
Table 1. Regressed coefficients characterizing temperature-radiation lag effect of the grassland.
Date T a , h = a 1 R n , h + a 2 R n , h t + a 3 T s , h = b 1 R n , h + b 2 R n , h t + b 3
a 1 a 2 a 3 b 1 b 2 b 3
29 July0.020−0.04727.7530.027−0.03931.710
30 July0.021−0.04828.3880.028−0.03932.190
31 July0.021−0.03328.1820.029−0.02931.736
1 August0.023−0.03427.3580.031−0.03131.642
2 August0.023−0.04628.4710.032−0.00432.547
3 August0.024−0.06429.5570.032−0.05433.550
4 August0.016−0.01729.0240.025−0.01733.428
5 August0.004−0.01825.6580.017−0.01630.713
6 August0.013−0.00526.2220.016−0.00330.884
7 August0.025−0.02825.9550.023−0.02230.686
8 August0.022−0.01925.6790.020−0.01330.531
9 August0.019−0.03024.9630.017−0.01929.778
Disclaimer/Publisher’s Note: The statements, opinions and data contained in all publications are solely those of the individual author(s) and contributor(s) and not of MDPI and/or the editor(s). MDPI and/or the editor(s) disclaim responsibility for any injury to people or property resulting from any ideas, methods, instructions or products referred to in the content.

