Article

Parametric Enhancement of a Window-Windcatcher for Enhanced Thermal Comfort and Natural Ventilation

by
Laith M. Obeidat
1,
Odi Fawwaz Alrebei
2,
Shouib Nouh Ma’bdeh
1,
Tamer Al-Radaideh
1 and
Abdulkarem I. Amhamed
2,*
1
Department of Architecture, Jordan University of Science and Technology, Irbid 3030, Jordan
2
Qatar Environment and Energy Research Institute (QEERI), Hamad bin Khalifa University, Doha 34110, Qatar
*
Author to whom correspondence should be addressed.
Atmosphere 2023, 14(5), 844; https://doi.org/10.3390/atmos14050844
Submission received: 7 April 2023 / Revised: 29 April 2023 / Accepted: 3 May 2023 / Published: 9 May 2023
(This article belongs to the Special Issue Passive Techniques for Sustainable Buildings and Cities)

Abstract

:
Window-windcatchers, a passive ventilation method, have been shown to improve ventilation and enhance thermal comfort. Preliminary characterization of a novel window-windcatcher has been undertaken in a previous work, but no relationship had been identified between the actual ventilation rate ( Q a c t ), the wind velocity ( V T w ) and crucial design parameters such as the fins angle ( ϴ )). In this paper, the relationship that quantifies how the window-windcatcher’s performance depends on V T w and ϴ was determined. Additionally, for the first time, the ventilation performance of the window-windcatcher was optimized by studying the effects of ϴ and the fins-wall distance ( D W f ) through a Computational Fluid Dynamics parametric study (ANSYS)|. In this optimization approach, the angle ϴ and the distance D W f corresponding to the maximum actual-to-required ventilation rate were found to be 80° and 45 cm, respectively. The actual ventilation rate increased by approximately 13.2% compared with the baseline design of the windcatcher ( ϴ and D W f equal to 40° and 45 cm, respectively); this corresponds to an increase of approximately 8.6% in the actual-to-required ventilation rate, according to the ASHRAE standards.

1. Introduction

Global warming and climate change are critical issues that have become increasingly prevalent in recent years, as high energy consumption has been found to be a significant contributing factor [1,2,3]. The building sector is one of the main culprits, responsible for a staggering 40% of the world’s energy consumption [4,5]. Within this sector, a significant portion of the energy consumed by buildings is devoted to maintaining thermal comfort, with heating, cooling, and ventilation accounting for roughly 60% of total energy usage [4]. In residential buildings, cooling and ventilation demands are particularly significant, with estimates indicating that the amount of energy consumed for cooling alone can reach up to 17% of total energy consumption using active systems such as air-conditioner units [6]. Along with the high energy consumption, these active systems have several side effects on human health and well-being [7]. For example, studies have shown that occupants of actively air-conditioned buildings are more at risk of suffering from diseases such as sick building syndrome (SBS), metabolic diseases, and COVID-19 than occupants of passively ventilated buildings [8]. Since people may spend up to 90% of their time indoors, providing high indoor air quality (IAQ) is critical for people’s health, well-being, and productivity [7]. However, incorporating passive design strategies could significantly reduce the energy used in residential buildings by up to 50% in some cases [9]. Applying passive design strategies such as passive heating, passive cooling, passive ventilation, and daylighting is a multifold approach in the built environment. Passive design strategies reduce energy consumption and GHG emissions, therefore slowing down or mitigating the impacts on the environment and human health, well-being, and productivity. Additionally, applying a passive strategy has economic and other benefits, including savings energy, and reducing building maintenance and healthcare bills [10].
Any passive cooling strategy, especially natural ventilation, is important among existing passive design strategies. A successfully designed and implemented ventilation strategy can significantly improve indoor environmental comfort [8,10]. Since natural ventilation controls several related environmental factors, including humidity, air temperature, air velocity, and ventilation rates, natural ventilation can improve both indoor air quality and thermal comfort [8,10]. The natural air pressure or temperature difference can achieve these effects without mechanical assistance/energy consumption. Moreover, natural ventilation can be more effective if night ventilation (night flushing) is achievable [11]. Night flushing clears out hot air at night and cools off internal thermal masses for delayed heat gain during the day. (This technique is effective during the summertime in semi-arid climates with high air temperature fluctuations up to 15 °C between day and night, such as Amman city [12,13], Jordan).
Natural ventilation occurs when fresh air flows into a building and used air flows outside the building [14]. Natural ventilation is driven by the air pressure difference between the inside and outside (momentum-induced airflow) or by the air density difference (buoyancy effect) [10,15]. Implementing adequate natural ventilation in multi-family residential buildings is challenging because the conditions necessary for natural ventilation, such as the air inlet and outlet, might be limited or non-existent. This challenge arises mainly due to the generic spatial typology of residential buildings, which generally involves few or no opposite exterior walls in the residential unit [11]. Several design strategies have been used to achieve natural ventilation and passive cooling such as windcatchers, atriums, courts, and solar chimneys. Windcatchers are among the most common natural ventilation systems used [16]. Numerous studies have been conducted to investigate how the performance of windcatchers is affected by different configurations and components, utilizing CFD modelling, analytical techniques, and experimental approaches [16]. Recently, researchers have begun to explore the impact of external parameters on windcatchers, including building roof shapes, the effect of other structures, and upstream objects such as other windcatchers [17,18,19]. Efforts have also been made to enhance windcatcher ventilation efficiency by modifying its geometry [20], such as optimizing the windcatchers cross-section [21], their height [22], internal partitions and openings [23,24]. Moreover, studies have been conducted to integrate windcatchers with other natural ventilation systems, such as courtyards, wing walls, and solar chimneys [25,26,27].
Windcatchers are categorized into three main types [28,29]: vernacular or conventional windcatchers, modern or commercial windcatchers, and super-modern windcatchers [29], as shown in Figure 1. All windcatchers share several attributes, including an architectural component that looks like a tower mounted on the roof to bring fresh air to interior spaces [29]. However, some limitations and disadvantages hinder the effective use of windcatchers in contemporary architecture. These limitations stem from the characteristics of the common windcatchers’ typology, such as the size, centrality of the mounting location, and geometry. In turn, these characteristics cause several limitations and disadvantages, as discussed below:
  • The central location (extended to the roof) and large size impose restrictions on building form, geometry, future vertical expansion, or any spatial use of the building’s roof [30].
  • If the wind velocity falls below the minimum operating wind velocity, the extended system that runs from the roof to the interior spaces, with varying angles, may not be effective [17,31].
  • Regulating the volumetric airflow rate that enters the designated area is challenging [31]
  • The inaccessibility of the system’s components makes it challenging to clean and remove dust and insects, negatively impacting indoor air quality and the safety of occupants [26,32].
Figure 1. Schematic function of windcatchers [33].
Atmosphere 14 00844 g001
Alrebei et al. [30] proposed a novel window-windcatcher system that overcomes the identified limitations of the typical windcatcher systems. This system was based on breaking the centrality of the conventional windcatcher and dividing it into small windcatcher devices mounted on exterior walls integrated into the window assembly. This system could overcome the identified issues of the typical windcatcher, as discussed below.
  • The proposed window-windcatcher system, by virtue of its small size and integration into the building envelope as a constituent of the window assembly, enhances the utilization potential of the building roof, while concurrently freeing it from design and spatial limitations, including potential vertical expansion or roof garden
  • The proposed windcatcher’s diminutive size could surmount the minimum wind velocity requirement, as the air’s path from outside to inside the building through the system is considerably shorter compared to conventional windcatchers.
  • As the proposed system is affixed to the window, it can regulate the volumetric airflow entering the room by adjusting the window opening ratio.
  • Due to the system’s design, small size, and installation location, all its components are easily accessible, making it easy to clean and impervious to dust and insects.
This study aims to optimize the design of a novel window-windcatcher system for natural ventilation, and to evaluate its effectiveness in enhancing indoor air quality (IAQ) and thermal comfort using computational fluid dynamics (CFD) simulations. The study investigates the ability of the system to capture and redirect prevailing winds into interior spaces in three cities with varying climate conditions (Cardiff, Amman, and Doha). According to Koppen’s classification, Doha has a hot, dry climate that is classified as a hot desert climate (BWh), whereas Amman has a warm Mediterranean climate (Csa). In a previous study (by Alrebei et al., 2022 [30]), the proposed window-windcatcher system increases the actual-to-required ventilation ratio by 9% compared to the scenario where no windcatcher is used. The calculations were conducted in accordance with the standards of the American Society of Heating, Refrigerating, and Air-Conditioning Engineers (ASHRAE). However, although the preliminary characterization of the window-windcatcher has been completed [25], a relationship between the actual ventilation rate ( Q a c t ) and wind velocity ( V T w ) or the fins angle ( ϴ ) had not been identified (i.e., Q a c t ( V T w , ϴ )). Here, such a relationship was driven, thus fully characterizing the performance of the window-windcatcher in terms of any V T w or ϴ . Additionally, the ventilation performance of the window-windcatcher was optimized by studying the effects of ϴ and fins-wall distance ( D W f ) in a CFD-based parametric study. In our optimization approach, the values of ϴ and D W f , which correspond to the maximum actual-to-required ventilation rate ( θ n Q m a x and D W f n Q m a x ) have been identified, respectively. θ n Q m a x and D W f n Q m a x are found to be 80° and 45 cm, respectively. The actual ventilation rate increases by approximately 13.2% from that of the baseline design ( ϴ and D W f equal to 40° and 45 cm, respectively). This 13.2% increase, according to the ASHRAE standards 62.1 corresponds to an increase of approximately 8.6% in the actual-to-required ventilation rate.
Preliminary characterization of a novel window-windcatcher has been undertaken in a previous work, but no relationship had been identified between the actual ventilation rate ( Q a c t ), the wind velocity ( V T w ), and crucial design parameters such as the fins angle ( ϴ )). In this paper, the relationship that quantifies how the window-windcatcher’s performance depends on V T w and ϴ was determined. Additionally, for the first time, the ventilation performance of the window-windcatcher was optimized by studying the effects of ϴ and the fins-wall distance ( D W f ) through a Computational Fluid Dynamics parametric study (ANSYS). In this optimization approach, the angle ϴ and the distance D W f corresponding to the maximum actual-to-required ventilation rate were found to be 80° and 45 cm, respectively.

2. Materials and Methods

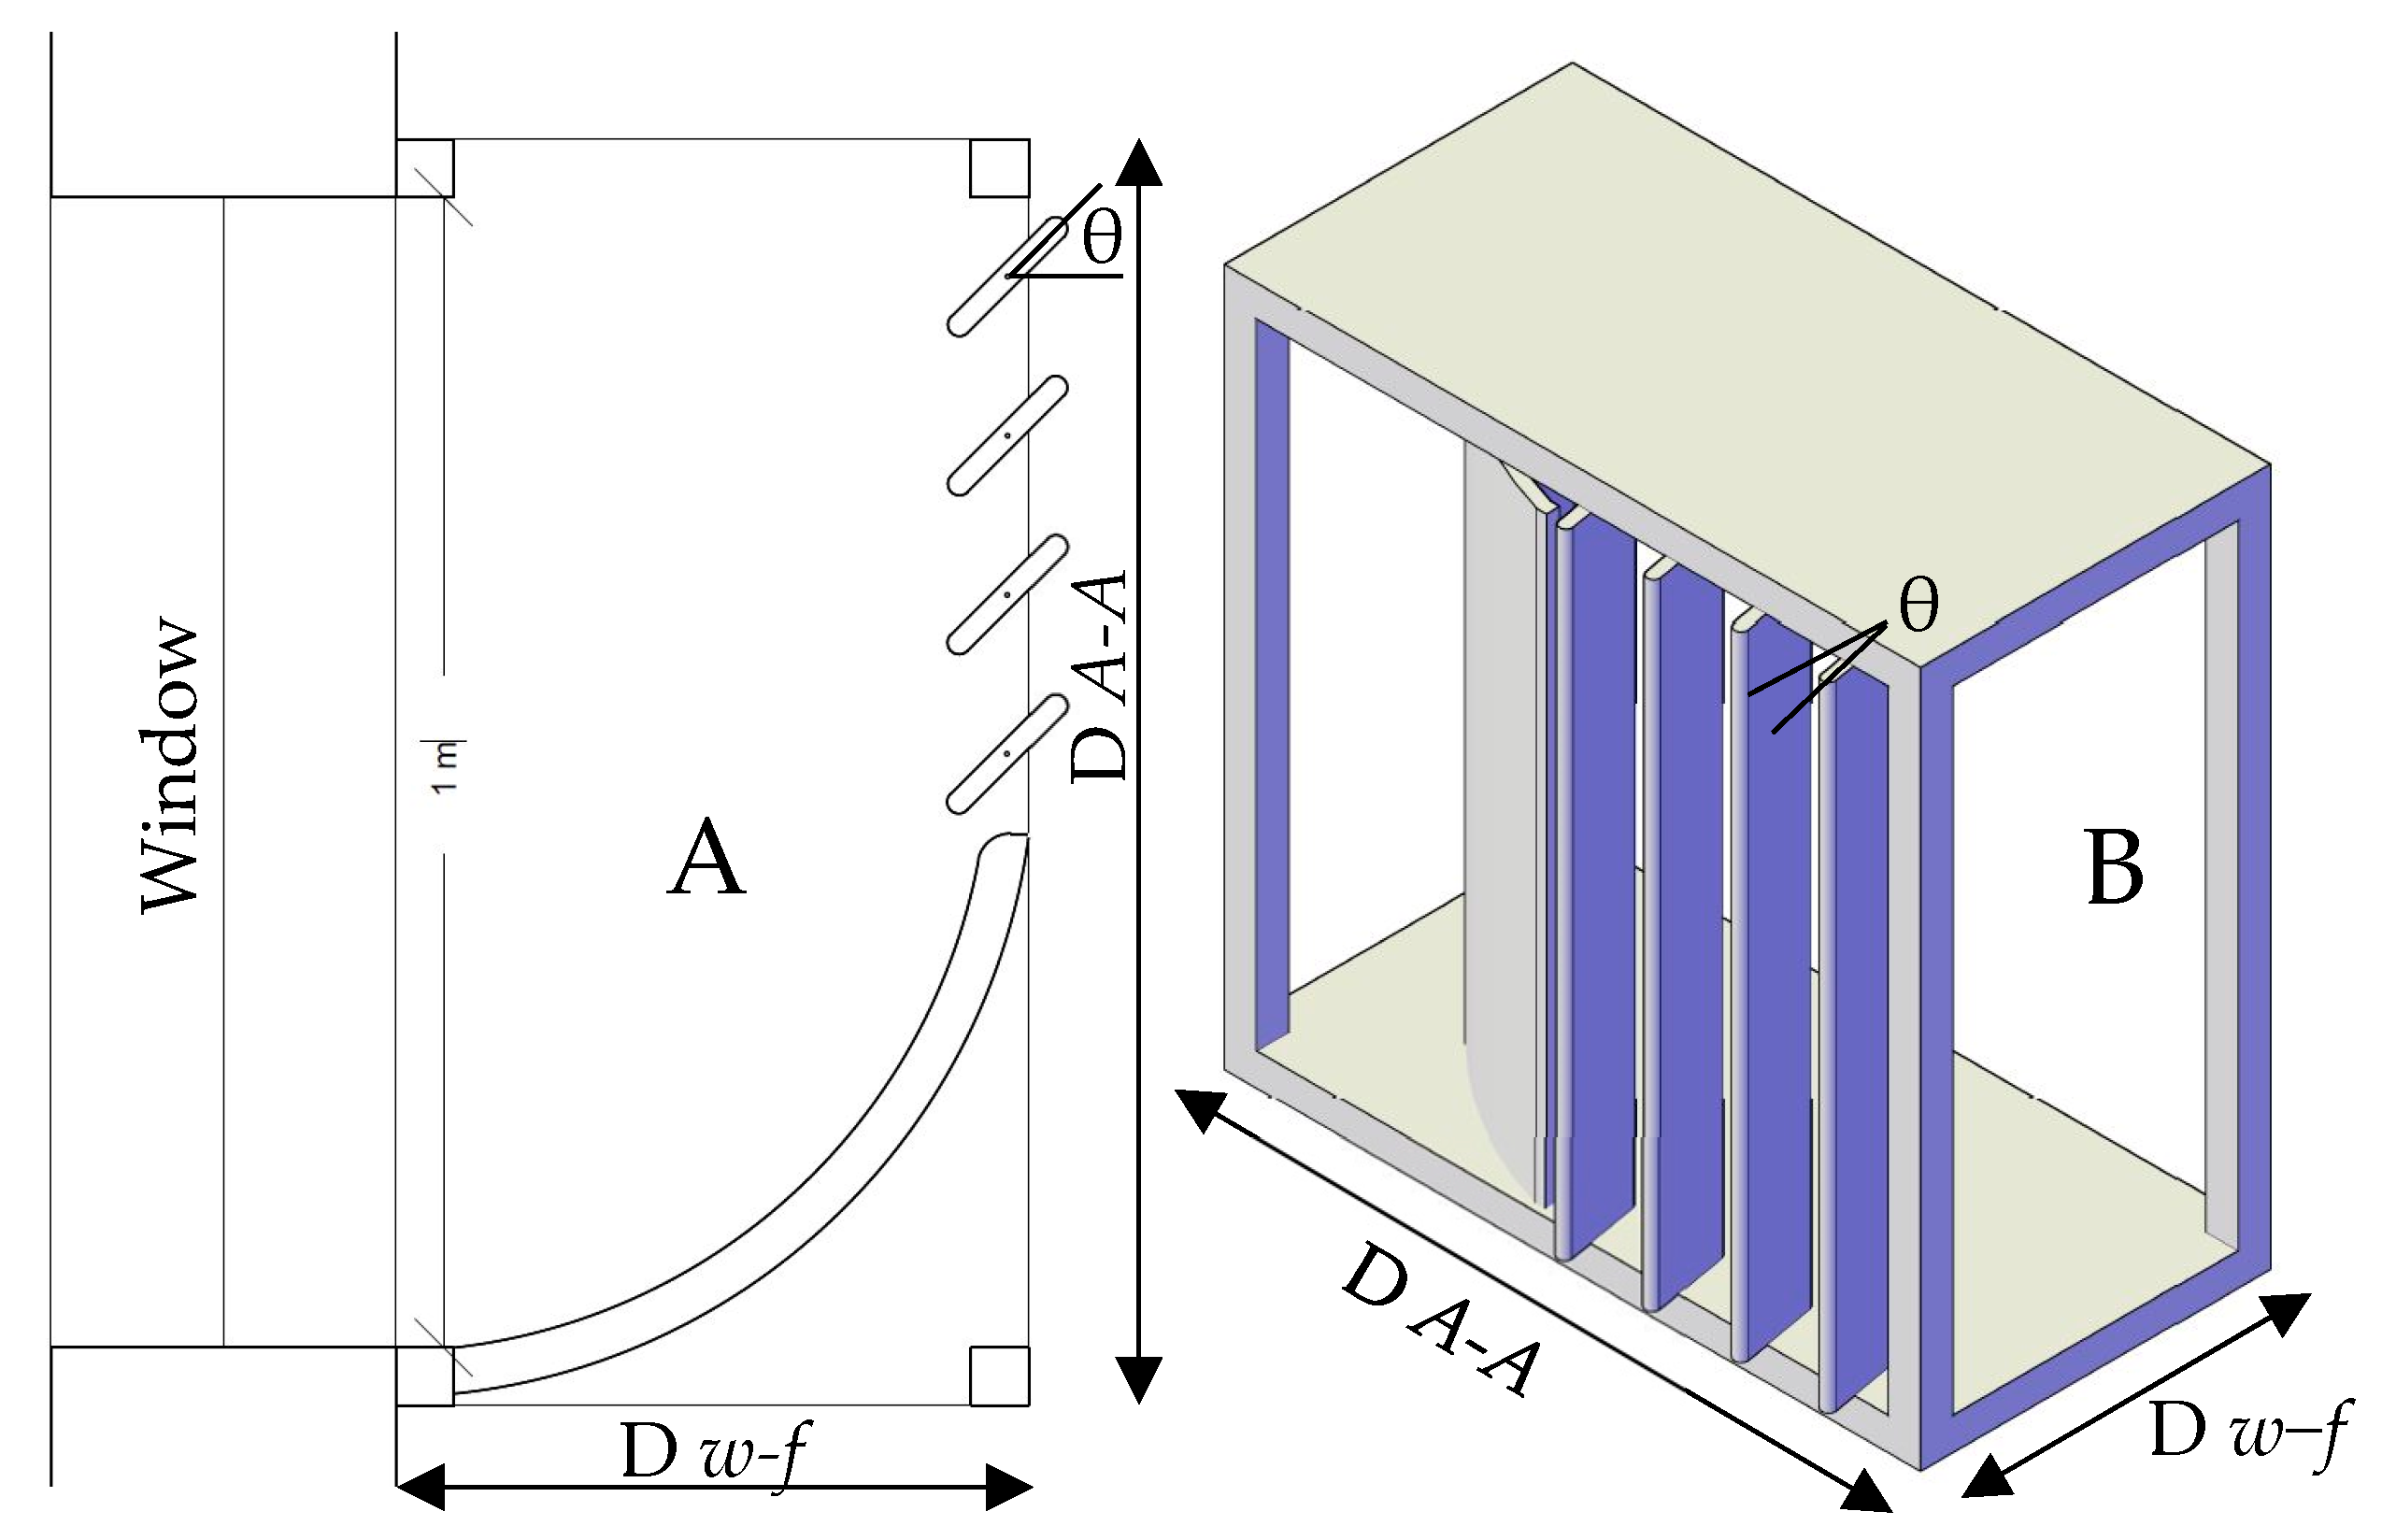
2.1. The Baseline Design of the Proposed Window-Windcatcher

The baseline design of the window-windcatcher (Figure 2) studied herein can improve thermal comfort and indoor air quality. This system increases the actual-to-required ventilation ratio by approximately 8.6% compared with the control case (without a window-windcatcher) [30]. In this study, the window-windcatcher consisted of vertical elements connecting two separate horizontal planes, one upper and one lower. The distance between these two planes, D A A , is equal to the length of the window opening (1 m, Section 2.2). The window-windcatcher consisted of four fins tilted by θ = 40 ° . The outward distance between the building’s wall and the fins was D W f = 45   c m . However, although the choice of D A A is restricted by the window dimensions (as described in Section 2.2), the selection of D W f and θ of the window-windcatcher was made empirically [30].
Therefore, an optimization methodology through a parametric Computational Fluid Dynamic (CFD) study was performed to identify the values of D W f and θ that maximize the ventilation rate to reduce the effect of overheating (i.e., H l o s s = c p m ˙ T ) and improve thermal comfort (while maintaining turbulence levels low (further discussed in Section 2.4 and Section 2.5.

2.2. Building Description

To examine the efficiency of the proposed window-windcatcher, this study uses a generic building model representing a typical family house, as demonstrated in Figure 3. This model was adopted in [30,34] to study the performance of the baseline design of the window-windcatcher. Therefore, to ensure that this study’s results are comparable with those of the baseline design of the window-windcatcher, this work adopted the building model, ensuring a controlled optimization methodology. Additionally, several previous studies used this building model to investigate environmental questions such as improving natural ventilation and passive cooling [34]. For example, this model was used to examine the efficiency of the solar-wall system (a combination of the Trombe wall and a solar chimney) to enhance indoor thermal comfort [34]. The selected room dimensions are 4 m × 3 m × 2.7 m (length × width × height), giving a floor area of 12 m 2 and a volume of 32.4 m 2 . Beyond this, the external eastern, western, and northern sides of the building have a 1-by-1 m2 window, with a total window-to-wall ratio of 18%.
The eastern side of the room has an internal door 1 m wide and 2 m high. The southern side of the building has an external door (1 m wide and 2 m high). The window-windcatcher is fitted on the window on the western side. These dimensions and the windcatcher are illustrated in Figure 3.

2.3. Study Cases

The performance of the baseline design of the window-windcatcher was evaluated by Alrebei et al. [30] in two geographical locations, Doha and Amman. The corresponding monthly atmospheric conditions of the total wind velocity ( V T W ) and the temperature of each city during 2021 were obtained [35], as shown in Figure 4. The monthly atmospheric conditions are plotted, and the average temperature ( T a v g ) and the total wind velocity ( V T W ) were evaluated (Doha [27.8 °C, 4.2 m/s] and Amman [22.3 °C, 3.6 m/s], Figure 4). The total average wind velocity represents the average value of the wind velocities obtained throughout the entire year from the weather data [35].
Therefore, to ensure that our results here can be compared to those for the baseline design of the window-windcatcher in [30], the same locations were adopted, ensuring a controlled optimization methodology. Similarly, by adopting the same modeling approach as in [25], reporting the evaluated performance of the baseline design of the window-windcatcher, as shown in Figure 5, the orientation of the building with respect to the direction of the average total wind velocity ( V T W ) is simulated for equal shear ( V S W ) and normal ( V N W ) wind velocity components (i.e., 2.97 m/s and 2.55 m/s for Doha, Amman, respectively). The orientation of the building has been chosen to ensure equal normal and shear wind components. The velocity components were estimated using Equation (1) [35,36].
V S W = V N W = V T W 2 2

2.4. CFD Setup

To ensure that the results in this study are comparable to those of the baseline design of the window-windcatcher, the CFD simulation performed herein followed the exact approach (i.e., the mesh quality, governing equations, k − ε turbulence model, and Boolean technique) adopted in [30,37,38]. In these previous works the baseline design of the window-windcatcher was modelled. The geometry of the building was modeled using Autodesk AutoCAD and loaded into ANSYS.
In this study, the building model was created using the Boolean algorithm, where the solid domain is subtracted from the fluid domain [30,38]. The mesh sensitivity results show that the results are independent of the mesh size, the mesh quality, the modeling technique (Boolean), the boundary conditions, the computational capacity, the turbulence model, the analysis type, and the results convergence. Mesh sensitivity analysis was conducted to guarantee that the findings were independent of the mesh size. An average velocity across an interior plane with an offset of 1.7 m from the floor was taking as a measurement variable to judge on the mesh quality. Five scenarios for the mesh number were conducted, 4.4 × 10⁵, 6.9 × 10⁵, 9.4 × 10⁵, 1.4 × 10⁶, and 1.9 × 10⁶. At around 9.4 × 10⁵ elements, the results start to be steady reaching the independently at 1.9 × 10⁶. Nevertheless, a much finer mesh with 2.19 × 10⁶ elements was chosen to obtain a high level of confidence and accuracy.
Here, these factors are all set to match the simulation of the baseline design of the window-windcatcher, as in [30]. An open boundary condition is a computational boundary that allows phenomena generated in the interior domain to pass through the artificial boundary without distortion and without affecting the interior solution. Additionally, this domain and technique have been used in [30,37,38].
Figure 6A and Table 1 display the mesh quality of the model. Figure 6B and Table 1 demonstrate how the number of elements was determined following mesh sensitivity analysis to guarantee that the findings were independent of the mesh size. Finally, Table 1 provides a summary of the simulation setups.

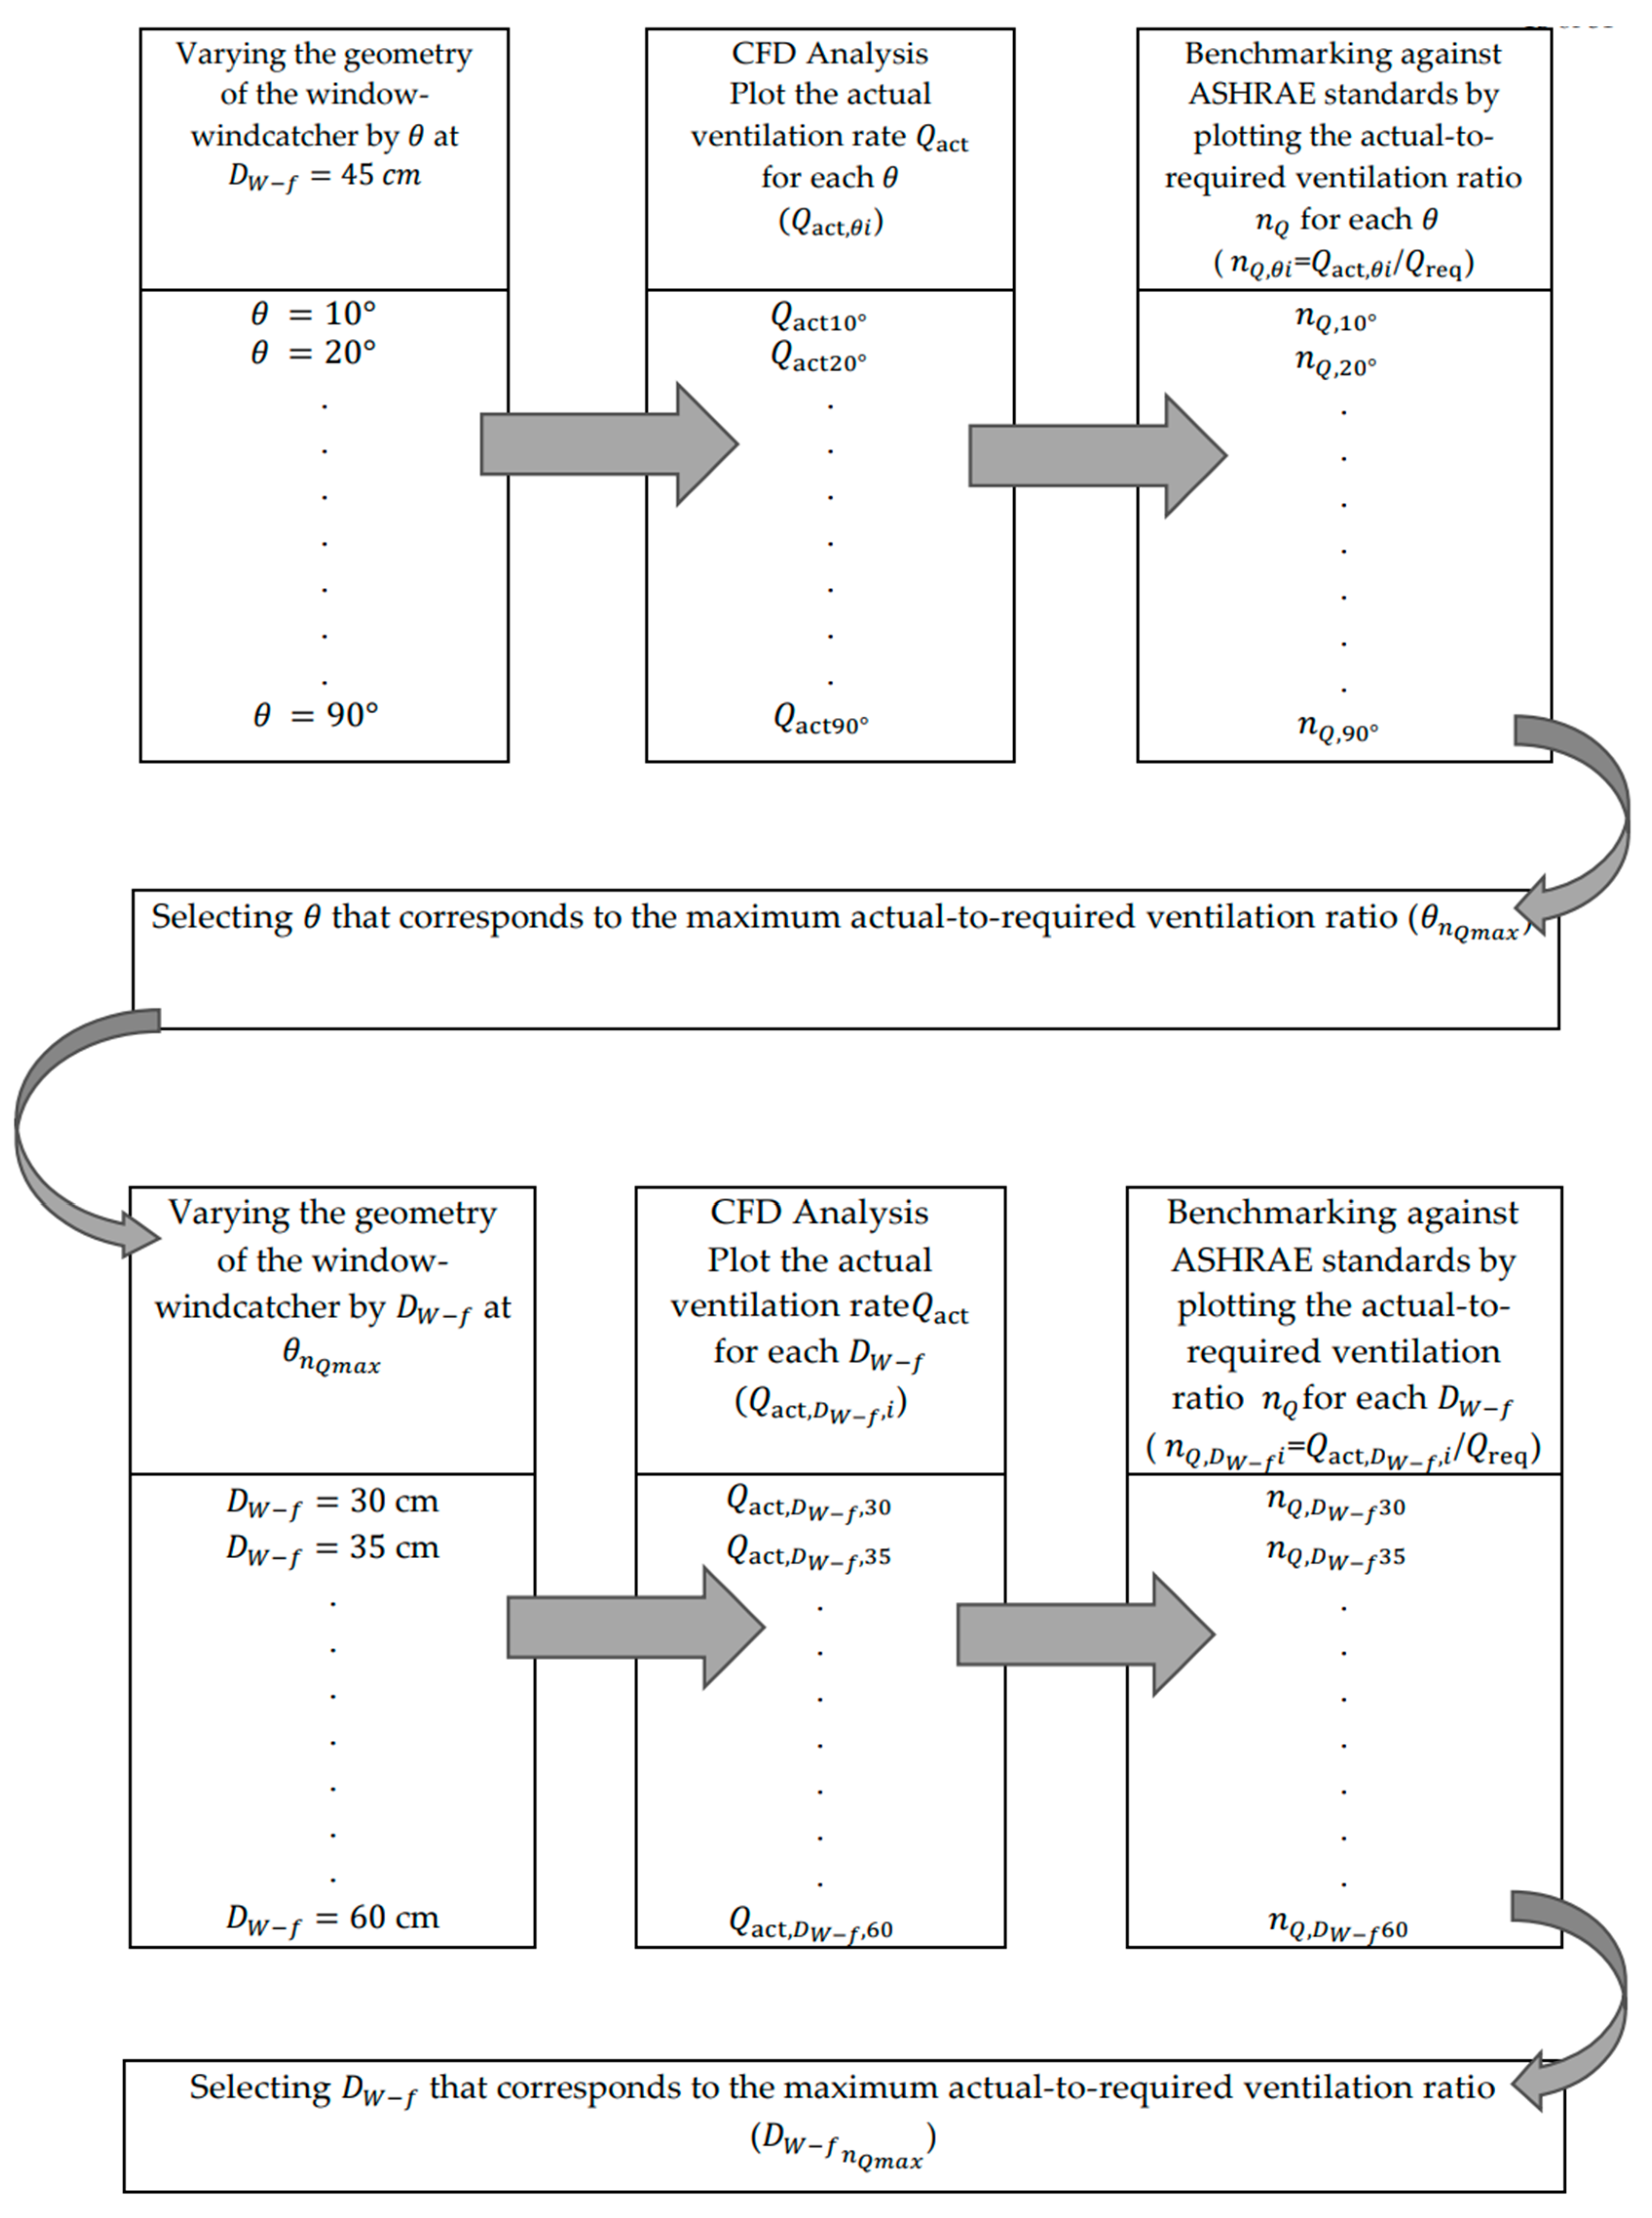
2.5. Optimization Criteria and Parametric Intervals

As discussed in Section 2.1, a parametric study for the dimensional parameters D W f and θ was performed in this study to select the corresponding values to optimize the window-windcatcher performance, ensuring the highest ventilation rate while maintaining low turbulence levels.
Subsequently, the optimization process was initiated by varying the fins angle θ within the interval of [ 10 90 ° ] with a step size of 10 ° , whereas the outward distance between the building’s wall and the fins was D W f = 45   c m . Beyond 90°, the fins will be aligned to the flow direction, thus become less effective to capture the flow into the building. Once the fins angle θ corresponding to the highest ventilation rate was selected, θ n Q m a x , as discussed in Section 3), the effect of varying D W f within the interval of [30–60 cm] with a step size of 5 cm was studied while maintaining the fins angle at θ n Q m a x .
Note that the maximum allowable D W f is 60 cm based on the regulations of the National Building Codes [43].
The performance selection criteria adopted here follow the required ventilation rate ( Q r e q ) standards defined by ASHRAE standard 62.1 [44], as demonstrated in Equation (2) (i.e., N b r corresponds to number of bedrooms). ( Q r e q ) is the minimum ventilation value required according to ASHRAE based on type of building, area, and number of occupants. ( Q a c t ) is the measured ventilation rate through the simulation. ( n Q ) is the actual-to-required ventilation ratio to evaluate the impact of using windcatcher on the building. The actual effect of the parameters D W f and θ on the ventilation performance ( Q a c t ) of each parameter was benchmarked against the required ventilation rate ( Q r e q ) through the actual-to-required ventilation ratio ( n Q ), as shown in Equation (3) [44]. Figure 7 summarizes the optimization methodology followed.
Q r e q = 0.15 A f l o o r + 3.5 ( N b r + 1 )
n Q = Q a c t / Q r e q
SQ (θ) = −0.029θ3 + 1.78θ2 − 53.09θ + 641.61
SQ,avg=16 L/s
Qact,D = −0.12θ3 + 7.14θ2 − 205.49 + 2490
Q a c t . g ( ϴ ) = Q a c t , D S Q ( ϴ )
Q a c t . g , a v g = Q a c t , D S Q a v g
S Q , a v g = 49.68 V S W 144.8
S Q , a v g = 49.68 V T W 2 2 144.8
Figure 7. Optimization methodology for determining the optimal window-windcatcher geometrical parameters D W f and θ .
Atmosphere 14 00844 g007

3. Results

3.1. Fins Angle for the Maximum Actual-to-Required Ventilation Ratio ( θ n Q m a x )

The optimization process for the window-windcatcher, as shown in Figure 8, involved altering the fins angle in increments of 10° to modify the shape of the window-windcatcher.
The corresponding geometry for each case was exported to ANSYS-CFX to generate the mesh and run the CFD analysis, as demonstrated in Table 1. Once the solution is generated using the software, the actual ventilation rate Q a c t for each θ ( Q a c t , θ i ) was estimated using ANSYS-CFX-POST, Figure 8A. Next, the benchmarking against ASHRAE standards was performed by plotting the actual-to-required ventilation ratio n Q for each θ —see Figure 8B. The corresponding velocity contours are in Figure 8C.
At the fins angle of the baseline design ( 40 ° ), the actual ventilation rates were 130 L/s and 113 L/s for Doha and Amman, respectively. Thus, for the adopted optimization practice in this paper, the actual ventilation rate was increased by approximately 11.5% and 13.2% for Doha and Amman, respectively.
As shown in Figure 8B, at θ n Q m a x = 80 ° , the ventilation rate for the Doha case study fulfilled 86% of the required ventilation rate based on the ASHRAE standard (i.e., the actual-to-required ventilation rate at θ n Q m a x = 80 ° ( n Q , 80 ° ) was approximately 86%), which was approximately 9% (absolute percentage) higher than the baseline design (i.e., 77%). Similarly, the corresponding actual-to-required ventilation rate at θ n Q m a x = 80 for the Amman case study was 76.1%, higher than the baseline design by approximately 8.6% (absolute percentage).
As shown in Figure 8, for the Amman case study, the actual ventilation rate through the entire studied interval of the fins angle [ 10 90 ° ] was shifted by the S Q coefficient from the Doha case study. The S Q (shift coefficient) was estimated as shown in Figure 9. By plotting S Q with respect to the fins angle θ and using the curve-fitting tool of Matlab “cftool”(© 1994–2023 The MathWorks, Inc., Natick, MA, USA) (Figure 9), a generic third-order polynomial correlation of S Q with respect to θ can be obtained, as shown in Equations (4) and (5).
By plotting Q a c t for the Doha case study with respect to the fins angle θ and using the curve-fitting tool of Matlab “cftool” (Figure 10), a generic sixth-order polynomial correlation of Q a c t with respect to θ can be obtained, as shown in Equation (6).
As shown in Figure 8, the Q a c t data points of Amman are essentially the data points of Q a c t of Doha data points (Qact,D) subtracted by the S Q coefficient, and then Q a c t for Amman can be described using Equations (7) and (8). Inserting Equations (4)–(6) into Equation (7) yields a generic formula that approximates the Q a c t of the window-windcatcher for the fins angle.
To validate Equation (7), the equation was benchmarked against the CFD generated dataset, Figure 11. As shown in Figure 11A, the mathematically generated dataset for Q a c t for Amman through Equation (7) perfectly matched the CFD-generated dataset, as shown in Figure 11B. This corresponds to an estimated average error of 1.2 × 10 3 .
As reported in [30], increasing or decreasing the actual ventilation rate was directly proportional to the magnitude of the wind velocity. For example, the actual ventilation rate for the Amman case study was lower than that of the Doha case study because the wind velocity was lower in Amman than in Doha. This could be used to establish a hypothesis that could generate a generic governing equation describing the performance of the windcatcher regarding fins angle regardless of the geographical location. Therefore, at θ n Q m a x = 80 ° , S Q , a v g was estimated for the wind velocity components ( V S W   o r   V N W ) within the interval [2.25–3.15 m/s] with a step size of 0.15 m/s, as displayed in Figure 12. Additionally, by plotting the wind velocity components with respect to S Q , a v g and using the curve-fitting tool of Matlab “cftool” (Figure 11), one could obtain a generic first-order polynomial correlation of S Q , a v g with respect to V S W , as shown in Equation (9). Subsequently, inserting Equation (3) into Equation (9) yielded a second-order polynomial correlation of S Q , a v g with respect to V T W , as demonstrated in Equation (10).
Integrating Equation (10) into Equation (8) yielded a generic formula approximating the Q a c t of the window-windcatcher in terms of the fins angle and the wind velocity (i.e., Q a c t ( V T W , ϴ )). This paper presents, for the first time, this set of equations characterizing the performance of the window-windcatcher. Although the preliminary characterization of the window-windcatcher was reported in [30], no generic formula was identified for the Q a c t ( V T w , ϴ ). The performance for a wider interval of geographical locations was identified, if V T w was the geographical-dependent parameter with a significant impact on Q a c t [30]. That is, the set of Equations (7)–(9) anticipated the Q a c t for the window-windcatcher for any V T w and ϴ (within the intervals of [3.6–5.45 m/s] and [ 40 90 ° ], respectively), regardless of the geographical location. In this way, the study resolved a significant gap that had not been addressed in [30].

3.2. D W f That Corresponds to the Maximum Actual-to-Required Ventilation Ratio ( D W f n Q m a x )

At this stage, θ n Q m a x had been identified as 80 ° (Figure 8); however, this was achieved for D W f = 45   cm . Therefore, it is crucial to justify this choice of D W f . To justify this choice, the geometry of the window-wind catcher was varied by D W f within the interval of [30–60 cm] with a step size of 10 cm at θ n Q m a x = 80 ° . Next, the corresponding geometry for each case was exported to ANSYS-CFX to generate the mesh and run the CFD analysis according to the description in Table 1. Once the solution was generated using the software, the actual ventilation rate Q a c t for each D W f ( Q a c t , D W f , i ) was estimated using ANSYS-CFX-POST, as shown in Figure 13A. Subsequently, the benchmarking against (ASHRAE) standards by plotting the actual-to-required ventilation ratio n Q for each D W f , as Figure 13B displays.
As demonstrated in Figure 13, the maximum ventilation rate occurred at D W f = 45 cm, which was been used when selecting θ n Q m a x = 80 ° . That is, selecting θ n Q m a x (Figure 8) while maintaining D W f at 45 cm was justified because this value corresponded to the maximum ventilation rate, Figure 13.

3.3. Turbulence Conditions for the Optimized Dimensional Parameters

As discussed in Section 3.1 and Section 3.2, the optimized dimensional parameters θ n Q m a x and D W f n Q m a x were found to be 80 ° and 45 cm, respectively. However, as reported in [30], it is crucial that turbulence conditions corresponding to those parameters are maintained relatively low, such as to avoid the transmission of airborne disease (an issue that must be carefully monitored because of the COVID-19 pandemic) [30]. Therefore, the turbulence kinetic energy was plotted in this study (Figure 14) at two-level planes (namely, 1 m and 1.7 m, as shown in Figure 5) as those corresponding to the breathing levels of the average-height person in the setting and standing conditions, respectively [30].
As displayed in Figure 14, the average kinetic energy levels at θ n Q m a x and D W f n Q m a x (i.e., 80 ° and 45 cm, respectively) were reduced compared with the baseline design (i.e., 40 ° and 45 cm, respectively) at both planes by approximately 7% and 13% relative to the baseline conditions for the 1 m and 1.7 m planes, respectively. In fact, at the 1.7 m plane, the average kinetic energy corresponding to θ n Q m a x and D W f n Q m a x were among the lowest within the θ interval tested. Notably, at θ = 10 ° , the average kinetic energy was measured at the lowest levels for both planes. However, the corresponding ventilation rates for this condition were among the lowest, as shown in Figure 8.

3.4. Qualitative Characterization

Since the work is to analyze and develop a system to improve natural ventilation, and TKE is one of the key parameters related to that, Figure 14 and Figure 15 were added to examine TKE to avoid creating a high TKE zone inside the rooms, and to make sure that this variable did not increase significantly. In addition, Figure 14 and Figure 15 show results for three different configurations and what will be the expected average TKE to two heights, which correspond to the height of a standing (1.7 m) and a sitting person (1.0 m).
As discussed in Section 3.1, Section 3.2 and Section 3.3, the optimized geometrical parameters ensuring the highest ventilation rate ( θ n Q m a x and D W f n Q m a x ) while maintaining relatively low turbulence and low levels of turbulence were 80 ° and 45 cm, respectively.
Therefore, it was crucial to plot the flow patterns of those conditions, which have been compared with the baseline-design conditions (i.e., θ = 40 ° and D W f = 45 cm, respectively). Additionally, the flow patterns have been compared to the conditions ensuring the lowest levels of turbulence (i.e., θ = 10 ° and D W f = 45 cm). Furthermore, Figure 14 and Figure 15 demonstrated turbulence kinetic energy patterns at the 1 m and 1.7 m planes, respectively, for θ n Q m a x = 80 ° , θ = 40 ° , and θ = 10 ° , at D W f n Q m a x = 45 cm.
As displayed in Figure 15, the turbulence kinetic energy patterns for both case studies followed the same patterns. However, for the Amman case study, the turbulence levels were lower than those for Doha because the airflow velocity was lower for Amman (i.e., k U 2 ). Notably, Regions A, B, and C had high turbulence levels because these regions encounter a high level of flow mixing between the internal domain and external domain (inner flow interaction with external flow interaction). Figure 16 shows the average turbulence kinetic energy at the 1.7 m plane for θ n Q m a x = 80 ° , θ = 40 ° , and θ = 10 ° , at D W f n Q m a x = 45 cm.
By comparing the turbulence patterns corresponding to θ n Q m a x = 80 ° to those of the baseline design ( θ = 40 ° ), one can observe that the turbulence concentration zone of θ n Q m a x = 80 ° (C’) has been relatively reduced compared with the turbulence concentration zone of the baseline design case (i.e., B’). On the other hand, for θ = 10 ° (the case with the minimal turbulence levels, as described in Section 3.3), the size of the turbulence concentration zone (A’) is relatively less than B’. However, higher levels of turbulence occupy larger spaces for θ = 10 , compared with θ n Q m a x = 80 ° (i.e., regions A and B, respectively). Additionally, the same observation that could be made for turbulence patterns of the 1 m plane could be reported for the 1.7 m plane.

3.5. Thermal Comfort

One can reduce the effect of overheating and improve thermal comfort in a building mainly using two methods: building elements and ventilation. The heat conductivity (k-value) of the building elements (such as walls and windows) can be reduced by selecting appropriate building elements. Ventilation is enhanced through increased air circulation, using devices such as window-windcatchers. Heat reduction is defined as H l o s s = c p m ˙ T , where c p is the specific capacity of the working fluid, m ˙ is the air mass flow rate, and T is the temperature difference between the internal and external domains. Additionally, the window-windcatcher can increase H l o s s by increasing m ˙ . The number of discomfort hours have been estimated using Designbuilder (Version 6, DesignBuilder Software Ltd., Gloucester, UK) [45,46,47]. This building is a fully natural ventilated building, indicating that no HVAC system was used and there is no setpoint to be added. The discomfort hours are the time when the zone is occupied that the combination of humidity ratio and operative temperature is out of ASHRAE 55 standards for adaptive model (adaptive model for fully natural ventilated building). See Figure 17. Table 2 shows the investigated space (living room) parameters. Table 3 shows investigated space construction specification.
Professionals, including architects and building service engineers, choose DesignBuilder as the preferred sophisticated user interface for EnergyPlus, the program that is considered to be the industry standard for Building Energy Simulation [45,46,47]. Additionally, DesignBuilder [45,46,47] provides users with the ability to conduct detailed energy simulations with a user interface that is three-dimensional. The International Energy Agency’s BESTest certifies DesignBuilder’s energy modeling accuracy [45,46,47].
As shown in Figure 18, the number of discomfort hours has been reduced using the window-windcatcher for both summer and winter clothing regions. As shown in Figure 17A, the window-windcatcher significantly reduced the number of discomfort hours using for summer clothing in June and August by approximately 100 h compared to the case without the window-windcatcher. For winter clothing, the window-windcatcher significantly reduced the number of discomfort hours in January and February by approximately 30 h and 35 h, respectively, compared the case without the window-windcatcher. The total annual number of discomfort hours for the summer clothing using the window-windcatcher was found to be 6679 h, showing a reduction of 470 discomfort hours, compared to the case without the window-windcatcher. The total annual number of discomfort hours for the winter clothing using the window-windcatcher was found to be 4475 h, showing a reduction of 201 discomfort hours, compared to the case without the window-windcatcher.

4. Discussion

This study presents an optimization methodology by varying the fins angle θ of the proposed window-windcatcher in the interval of [10–90°] with a step size of 10°, whereas the outward distance between the building’s wall and the fins was D W f = 45   cm , as highlighted in Figure 7. After selecting the fins angle with the highest ventilation rate, θ n Q m a x , the study investigated the effect of varying D W f within the interval of [30–60 cm] with a step size of 5 cm while maintaining the fins angle at θ n Q m a x .
As discussed in Section 3.1, Section 3.2 and Section 3.3, the optimized geometrical parameters ensuring the highest ventilation rate ( θ n Q m a x and D W f n Q m a x ) while maintaining relatively low turbulence and low levels of turbulence were 80 ° and 45 cm, respectively.
Therefore, it was crucial to plot the flow patterns of those conditions, which have been compared with the baseline-design conditions (i.e., θ = 40 ° and D W f = 45 cm, respectively). Additionally, the flow patterns have been compared to the conditions ensuring the lowest levels of turbulence (i.e., θ = 10 ° and D W f = 45 cm). Furthermore, Figure 14 and Figure 15 demonstrated turbulence kinetic energy patterns at the 1 m and 1.7 m planes, respectively, for θ n Q m a x = 80 ° , θ = 40 ° , and θ = 10 ° , at D W f n Q m a x = 45 cm.
As displayed in Figure 14, the turbulence kinetic energy patterns for both case studies followed the same patterns. However, for the Amman case study, the turbulence levels were lower than those for Doha because the airflow velocity was lower for Amman (i.e., k U 2 ). Notably, Regions A, B, and C had high turbulence levels, because these regions encounter a high level of flow mixing between the internal domain and external domain (inner flow interaction with external flow interaction).
For both case studies (Doha and Amman), the fins angle with the maximum ventilation rate ( θ n Q m a x ) was 80°. At 80°, the actual ventilation rates in Doha and Amman were approximately 145 L/s and 128 L/s, respectively. On the other hand, the actual ventilation rates for Doha and Amman were 130 L/s and 113 L/s, respectively, at the fins angle of the baseline design (40°). Thus, the actual ventilation rates in Doha and Amman were increased by approximately 11.5% and 13.2%, respectively, when the optimal values are used.
The ventilation rate for the Doha case study meets 86% of the required ventilation rate, according to ASHRAE standards (i.e., the actual-to-required ventilation rate at θ n Q m a x = 80 ° ( n Q , 80 ° ) is approximately 86%). This rate was approximately 9% (absolute percentage) higher than the baseline design (i.e., 77%). Similarly, the corresponding actual-to-required ventilation rate at θ n Q m a x = 80 for the Amman case study is 76.1%, which was approximately 8.6% higher than the baseline design (absolute percentage).
Furthermore, θ n Q m a x was 80° at this stage, but this was achieved for D W f = 45 cm. Consequently, one must justify the selection of D W f . Beyond this, the geometry of the window-windcatcher was varied by D W f within the interval [30–60 cm] with a step size of 10 cm at θ n Q m a x = 80 ° to justify this choice. Moreover, D W f = 45 cm ensured the highest ventilation rate, which was used in selecting θ n Q m a x = 80 ° . Thus, choosing θ n Q m a x = 80 ° while maintaining D W f at 45 cm was justified because it corresponded to the maximum ventilation rate.
Additionally, Equations (7)–(9) were presented that characterize the performance of the window-windcatcher. Although the preliminary characterization of the window-windcatcher was undertaken in [30], no generic formula had been identified for Q a c t ( V T w , ϴ ). Thus, the performance was identified regardless of geographical locations, assuming that V T w is the geographical-dependent parameter with a significant impact on Q a c t [31]. That is, the set of Equations (7)–(9) predicts Q a c t for the window-windcatcher for any V T w and ϴ (within the intervals of [3.6–5.45 m/s] and [ 40 ° 90 ° ], respectively) regardless of the geographical location. One can reduce the effect of overheating and improve thermal comfort in a building mainly using two methods: building elements and ventilation. The heat conductivity (k-value) of the building elements (such as walls and windows) can be reduced by selecting appropriate building elements. Ventilation is enhanced through increased air circulation, using devices like window-windcatchers. Heat reduction is defined as H l o s s = c p m ˙ T , where c p is the specific capacity of the working fluid, m ˙ is the air mass flow rate, and T is the temperature difference between the internal and external domains. Additionally, the window-windcatcher can increase H l o s s by increasing m ˙ .

5. Conclusions

The preliminary characterization of the window-windcatcher has been reported in [30], but a generic formula ( Q a c t ( V T w , ϴ )) relating the actual ventilation rate to the wind velocity ( V T w ) and crucial design parameters has not been derived. In this study, a generic formula has been provided. This paper is the first to optimize window-windcatcher ventilation performance using a CFD-based parametric study. The optimization methodology shows that ϴ = 80° and D W f = 45 cm correspond to the maximum actual-to-required ventilation rate. According to ASHRAE standards, the actual ventilation rate increased by 13.2% compared to the baseline design, resulting in an 8.6% increase in actual-to-required ventilation. A further investigation for typical and extreme values during different seasons is recommended in a further study. A further development of the study could be to find the optimum angle of the fin in function of the wind incidence angle.

Author Contributions

Conceptualization, L.M.O., O.F.A., S.N.M., T.A.-R. and A.I.A.; methodology, L.M.O., O.F.A., S.N.M., T.A.-R. and A.I.A.; software, L.M.O., O.F.A., S.N.M., T.A.-R. and A.I.A.; validation, L.M.O., O.F.A., S.N.M., T.A.-R. and A.I.A.; formal analysis, L.M.O., O.F.A., S.N.M., T.A.-R. and A.I.A.; investigation, L.M.O., O.F.A., S.N.M., T.A.-R. and A.I.A.; resources, L.M.O., O.F.A., S.N.M., T.A.-R. and A.I.A.; data curation, L.M.O., O.F.A., S.N.M., T.A.-R. and A.I.A.; writing—original draft preparation, L.M.O., O.F.A., S.N.M., T.A.-R. and A.I.A.; writing—review and editing, L.M.O., O.F.A., S.N.M., T.A.-R. and A.I.A.; visualization, L.M.O., O.F.A., S.N.M., T.A.-R. and A.I.A.; supervision, L.M.O., O.F.A., S.N.M., T.A.-R. and A.I.A.; project administration, L.M.O., O.F.A., S.N.M., T.A.-R. and A.I.A.; funding acquisition, L.M.O., O.F.A., S.N.M., T.A.-R. and A.I.A. All authors have read and agreed to the published version of the manuscript.

Funding

This publication was made possible by NPRP 13 grant # (NPRP13S-0203-200243) from the Qatar National Research Fund (a member of the Qatar Foundation). The findings herein are the sole work of the authors. Open access funding provided by the Qatar National Library.

Institutional Review Board Statement

Not applicable.

Informed Consent Statement

Not applicable.

Data Availability Statement

Data is unavailable due to privacy.

Conflicts of Interest

The authors declare no conflict of interest.

Nomenclature

A f l o o r Floor area ( m 2 )
c μ k–ε model parameter
D A A Width of the window-windcatcher [cm]
D W f Fins-wall distance [cm]
D W f n Q m a x Fins-wall distance with the maximum actual-to-required ventilation ratio [cm]
I Initial turbulence intensity
k Turbulence kinetic energy (J/kg)
l Turbulence or eddy length scale
N b r Number of bedrooms
n Q Actual-to-required ventilation ratio
n Q , θ i Actual-to-required ventilation ratio for each ith θ
n Q , D W f i Actual to required ventilation rate for ith
Q a c t . g Generic actual ventilation rate (mathematically obtained) [L/s]
Q a c t . g , a v g Average generic actual ventilation rate (mathematically obtained) [L/s]
Q a c t Actual ventilation rate [L/s]
Qact,D Q a c t for the Doha case study [L/s]
Q a c t , D W f , i Actual ventilation rate for ith [L/s]
Q a c t , θ i Actual ventilation rate Q a c t for each ith θ [L/s]
Q r e q Required ventilation rate (ASHRAE standards) [L/s]
R e Reynolds number
SQavgAverage actual ventilation rate shift [L/s]
S Q Actual ventilation rate shift from one case study to another [L/s]
T a v g Average annual temperature [ ]
U Initial velocity magnitude (m/s)
V N W Normal component of wind velocity [m/s]
V S W Shear component of wind velocity [m/s]
V T w The total wind velocity [m/s]
ε Turbulence Kinetic Energy Dissipation (J/kg)
ϴ Fins angle [ ° ]
θ n Q m a x Fins angle θ with the highest ventilation rate [ ° ]

References

  1. Eionet. Energy and Climate Change; European Environment Agency: Copenhagen, Denmark, 2017. [Google Scholar]
  2. Jomehzadeh, F.; Nejat, P.; Calautit, J.K.; Yusof, M.B.M.; Zaki, S.A.; Hughes, B.R.; Yazid, M.N.A.W.M. A review on windcatcher for passive cooling and natural ventilation in buildings, Part 1: Indoor air quality and thermal comfort assessment. Renew. Sustain. Energy Rev. 2017, 70, 736–756. [Google Scholar] [CrossRef]
  3. Santamouris, M. Cooling the buildings—Past, present and future. Energy Build. 2016, 128, 617–638. [Google Scholar] [CrossRef]
  4. Wu, J.; Lian, Z.; Zheng, Z.; Zhang, H. A method to evaluate building energy consumption based on energy use index of different functional sectors. Sustain. Cities Soc. 2020, 53, 101893. [Google Scholar] [CrossRef]
  5. Wang, T.; Foliente, G.; Song, X.; Xue, J.; Fang, D. Implications and future direction of greenhouse gas emission mitigation policies in the building sector of China. Renew. Sustain. Energy Rev. 2014, 31, 520–530. [Google Scholar] [CrossRef]
  6. Al-mudhafar, A.H.N.; Hamzah, M.T.; Tarish, A.L. Potential of integrating PCMs in residential building envelope to reduce cooling energy consumption. Case Stud. Therm. Eng. 2021, 27, 101360. [Google Scholar] [CrossRef]
  7. Chenari, B.; Carrilho, J.D.; da Silva, M.G. Towards sustainable, energy-efficient and healthy ventilation strategies in buildings: A review. Renew. Sustain. Energy Rev. 2016, 59, 1426–1447. [Google Scholar] [CrossRef]
  8. Ma'Bdeh, S.N.; Al-Zghoul, A.; Alradaideh, T.; Bataineh, A.; Ahmad, S. Simulation study for natural ventilation retrofitting techniques in educational classrooms—A case study. Heliyon 2020, 6, e05171. [Google Scholar] [CrossRef]
  9. Belmonte, M.-V.; Díaz-López, C.; Gavilanes, J.; Millán, E. Introducing passive strategies in the initial stage of the design to reduce the energy demand in single-family dwellings. Build. Environ. 2021, 197, 107832. [Google Scholar] [CrossRef]
  10. Zhang, H.; Yang, D.; Tam, V.W.; Tao, Y.; Zhang, G.; Setunge, S.; Shi, L. A critical review of combined natural ventilation techniques in sustainable buildings. Renew. Sustain. Energy Rev. 2021, 141, 110795. [Google Scholar] [CrossRef]
  11. Al-Hemiddi, N.A.; Al-Saud, K.A.M. The effect of a ventilated interior courtyard on the thermal performance of a house in a hot–arid region. Renew. Energy 2001, 24, 581–595. [Google Scholar] [CrossRef]
  12. Ababsa, M. Atlas of Jordan: History, Territories and Society; Contemporain Publications; Presses de l’Ifpo: Beirut, Lebanon, 2014; p. 485. [Google Scholar]
  13. Geros, V.; Santamouris, M.; Tsangrasoulis, A.; Guarracino, G. Experimental evaluation of night ventilation phenomena. Energy Build. 1999, 29, 141–154. [Google Scholar] [CrossRef]
  14. Reyes, V.; Moya, S.; Morales, J.; Sierra-Espinosa, F. A study of air flow and heat transfer in building-wind tower passive cooling systems applied to arid and semi-arid regions of Mexico. Energy Build. 2013, 66, 211–221. [Google Scholar] [CrossRef]
  15. Ahmed, T.; Kumar, P.; Mottet, L. Natural ventilation in warm climates: The challenges of thermal comfort, heatwave resilience and indoor air quality. Renew. Sustain. Energy Rev. 2021, 138, 110669. [Google Scholar] [CrossRef]
  16. Jomehzadeh, F.; Hussen, H.M.; Calautit, J.K.; Nejat, P.; Ferwati, M.S. Natural ventilation by windcatcher (Badgir): A review on the impacts of geometry, microclimate and macroclimate. Energy Build. 2020, 226, 110396. [Google Scholar] [CrossRef]
  17. Esfeh, M.K.; Sohankar, A.; Shahsavari, A.; Rastan, M.; Ghodrat, M.; Nili, M. Experimental and numerical evaluation of wind-driven natural ventilation of a curved roof for various wind angles. Build. Environ. 2021, 205, 108275. [Google Scholar] [CrossRef]
  18. Hirose, C.; Ikegaya, N.; Hagishima, A.; Tanimoto, J. Indoor airflow and thermal comfort in a cross-ventilated building within an urban-like block array using large-eddy simulations. Build. Environ. 2021, 196, 107811. [Google Scholar] [CrossRef]
  19. Zheng, X.; Montazeri, H.; Blocken, B. CFD analysis of the impact of geometrical characteristics of building balconies on near-façade wind flow and surface pressure. Build. Environ. 2021, 200, 107904. [Google Scholar] [CrossRef]
  20. Alsailani, M.; Montazeri, H.; Rezaeiha, A. Towards optimal aerodynamic design of wind catchers: Impact of geometrical characteristics. Renew. Energy 2021, 168, 1344–1363. [Google Scholar] [CrossRef]
  21. Bahadori, M.N.; Dehghani-Sanij, A.; Sayigh, A. Wind Towers; Springer: Berlin/Heidelberg, Germany, 2016. [Google Scholar]
  22. Ghadiri, M.H.; Ibrahim, N.L.N.; Dehnavi, M. The effect of tower height in square plan wind catcher on its thermal behavior. Aust. J. Basic Appl. Sci. 2011, 5, 381–385. [Google Scholar]
  23. Hughes, B.R.; Calautit, J.K.; Ghani, S.A. The development of commercial wind towers for natural ventilation: A review. Appl. Energy 2012, 92, 606–627. [Google Scholar] [CrossRef]
  24. Abdo, P.; Taghipour, R.; Huynh, B.P. Three-Dimensional Simulation of Wind-Driven Ventilation through a Windcatcher with Different Inlet Designs. J. Therm. Sci. Eng. Appl. 2019, 12, 041008. [Google Scholar] [CrossRef]
  25. Abdullah, A.; Bin Said, I.; Ossen, D.R. A sustainable bio-inspired cooling unit for hot arid regions: Integrated evaporative cooling system in wind tower. Appl. Therm. Eng. 2019, 161, 114201. [Google Scholar] [CrossRef]
  26. Saadatian, O.; Haw, L.C.; Sopian, K.; Sulaiman, M.Y. Review of windcatcher technologies. Renew. Sustain. Energy Rev. 2012, 16, 1477–1495. [Google Scholar] [CrossRef]
  27. Abdo, P.; Huynh, B.P. Effect of Combining Buoyancy Driven and Winddriven Ventilation in a Two Dimensional Room Fitted with a Windcatcher. In ASME International Mechanical Engineering Congress and Exposition; American Society of Mechanical Engineers: New York, NY, USA, 2017; p. V007T09A016. [Google Scholar]
  28. Bahadori, M.N. Passive Cooling Systems in Iranian Architecture. Sci. Am. 1978, 238, 144–155. [Google Scholar] [CrossRef]
  29. Sangdeh, P.K.; Nasrollahi, N. Windcatchers and their applications in contemporary architecture. Energy Built Environ. 2022, 3, 56–72. [Google Scholar] [CrossRef]
  30. Alrebei, O.F.; Obeidat, L.M.; Ma’bdeh, S.N.; Kaouri, K.; Al-Radaideh, T.; Amhamed, A.I. Window-Windcatcher for Enhanced Thermal Comfort, Natural Ventilation and Reduced COVID-19 Transmission. Buildings 2022, 12, 791. [Google Scholar] [CrossRef]
  31. Karakatsanis, C.; Bahadori, M.; Vickery, B. Evaluation of pressure coefficients and estimation of air flow rates in buildings employing wind towers. Sol. Energy 1986, 37, 363–374. [Google Scholar] [CrossRef]
  32. Omer, A.M. Renewable building energy systems and passive human comfort solutions. Renew. Sustain. Energy Rev. 2008, 12, 1562–1587. [Google Scholar] [CrossRef]
  33. Hashemian, M. Reverse Analysis of Wind-Catchers of Ab-Anbars in Iran for Coming to Innovations in Sustainable Architecture. In Proceedings of the 6th International Conference on Civil, Architectural and Environmental Science, Stockholm, Sweden, 19 June 2019. [Google Scholar]
  34. Mabdeh, S.; Al Radaideh, T.; Hiyari, M. Enhancing Thermal Comfort of Residential Buildings through Dual Functional Passive System (Solar-Wall). J. Green Build. 2020, 16, 155–177. [Google Scholar] [CrossRef]
  35. Weatherspark. Climate and Average Weather Year Round in Amman; Weatherspark: Amman, Jordan, 2022. [Google Scholar]
  36. Toivanen, P.K.; Janhunen, P. Spin Plane Control and Thrust Vectoring of Electric Solar Wind Sail. J. Propuls. Power 2013, 29, 178–185. [Google Scholar] [CrossRef]
  37. Obeidat, B.; Alrebei, O.F.; Abdallah, I.A.; Darwish, E.F.; Amhamed, A. CFD Analyses: The Effect of Pressure Suction and Airflow Velocity on Coronavirus Dispersal. Appl. Sci. 2021, 11, 7450. [Google Scholar] [CrossRef]
  38. Alrebi, O.F.; Obeidat, B.; Abdallah, I.A.; Darwish, E.F.; Amhamed, A. Airflow dynamics in an emergency department: A CFD simulation study to analyse COVID-19 dispersion. Alex. Eng. J. 2022, 61, 3435–3445. [Google Scholar] [CrossRef]
  39. de Roode, S.R.; Jonker, H.J.; van de Wiel, B.J.; Vertregt, V.; Perrin, V. A Diagnosis of Excessive Mixing in Smagorinsky Subfilter-Scale Turbulent Kinetic Energy Models. J. Atmos. Sci. 2017, 74, 1495–1511. [Google Scholar] [CrossRef]
  40. Dimotakis, P.E. Turbulent Mixing. Annu. Rev. Fluid Mech. 2005, 37, 329–356. [Google Scholar] [CrossRef]
  41. Lee, S.C.; Harsha, P.T. Use of turbulent kinetic energy in free mixing studies. AIAA J. 1970, 8, 1026–1032. [Google Scholar] [CrossRef]
  42. Morales, X.; Sierra-Espinosa, F.; Moya, S.; Carrillo, F. Thermal effectiveness of wind-tower with heated exit-wall and inlet-air humidification: Effects of winter and summertime. Build. Environ. 2021, 204, 108110. [Google Scholar] [CrossRef]
  43. Awadallah, T.; Adas, H.; Obaidat, Y.; Jarrar, I. Energy Efficient Building Code for Jordan. Energy 2009, 1, 1–4. [Google Scholar]
  44. Standards 62.1 & 62.2; Ventilation for Acceptable Indoor Air Quality. American Society of Heating Refrigerating and Air-Conditioning Engineers: Atlanta, GA, USA, 2016.
  45. Al-Hafith, O.; Satish, B.K.; Bradbury, S.; de Wilde, P. Simulation of courtyard spaces in a desert climate. Energy Procedia 2017, 142, 1997–2002. [Google Scholar] [CrossRef]
  46. DesignBuilder Software. DesignBuilder 2.1 User’s Manual. 21 October 2009. 2021. Available online: http://www.designbuildersoftware.com/docs/designbuilder/DesignBuilder_2.1_Users-Manual_Ltr.pdf (accessed on 15 May 2022).
  47. DesignBuilder Software. ASHRAE 140-2017/BESTEST Results for DesignBuilder v6.1. 28 March 2021. 2022. Available online: https://designbuilder.co.uk/download/documents (accessed on 15 May 2022).
Figure 2. Baseline design of the window-windcatcher. (A) Top section; (B) 3D perspective.
Atmosphere 14 00844 g002
Figure 3. Dimensions of the studied residential building (m) and the proposed window-windcatcher.
Atmosphere 14 00844 g003
Figure 4. (Left): average temperature ( T a v g ); (Right): total wind velocity ( V T W ) in 2021 in Amman and Doha.
Atmosphere 14 00844 g004
Figure 5. (Left): Result planes at 1 m and 1.7 m; (Right): Simulated temperature and wind velocity setups.
Atmosphere 14 00844 g005
Figure 6. (A) CFX mesh of the model; (B) Mesh sensitivity analysis to the average velocity at 1.7 m offset (internal plane); (C) the velocity contours at three mesh sizes (9.4 ×   10 5 elements, 1.4 ×   10 5 elements, and 1.9 ×   10 6 elements); (D) Three-dimensional computational domain clarifies boundary types (Inlet, Outlet, green surface is the open boundary condition).
Atmosphere 14 00844 g006
Figure 8. (A) Actual ventilation rate with respect to a variable fins angle ( Q a c t , θ i ) ; (B) actual-to-required ventilation ratio with respect to a variable fins angle ( n Q , θ i ) ′; (C) The velocity contours at the 1 m and 1.7 planes for θ n Q m a x = 80 ° , θ = 40 ° and θ = 10 ° , at D W f n Q m a x = 45 cm.
Atmosphere 14 00844 g008
Figure 9. SQ with respect to θ.
Atmosphere 14 00844 g009
Figure 10. Q a c t with respect to θ (Doha case study).
Atmosphere 14 00844 g010
Figure 11. (A) Actual ventilation rate through the mathematical estimation; (B) CFD-generated actual ventilation rate for Amman. (The estimated average error between (A) and (B) was approximately 1.2 × 10 3 ).
Atmosphere 14 00844 g011
Figure 12. S Q , a v g with respect to the wind velocity component.
Atmosphere 14 00844 g012
Figure 13. (A) Actual ventilation rate with respect to D W f . (B) Actual-to-required ventilation ratio. The vertical lines correspond to the conditions at D W f n Q m a x .
Atmosphere 14 00844 g013
Figure 14. The average turbulence kinetic energy with respect to θ at D W f n Q m a x = 45 cm for (A) the 1 m plane and (B) the 1.7 plane.
Atmosphere 14 00844 g014
Figure 15. The Average turbulence kinetic energy at the 1 m plane for θ n Q m a x = 80 ° , θ = 40 ° , and θ = 10 ° , at D W f n Q m a x = 45 cm. (A) High–turbulence regions for θ = 10 (B) High–turbulence region for θ = 40 (C) High–turbulence region for θ n Q m a x = 80 .
Atmosphere 14 00844 g015
Figure 16. Average turbulence kinetic energy at the 1.7 m plane for θ n Q m a x = 80 ° , θ = 40 ° , and θ = 10 ° , at D W f n Q m a x = 45 cm. Black box is a high–turbulence region.
Atmosphere 14 00844 g016
Figure 17. The model analyzed in Designbuilder.
Atmosphere 14 00844 g017aAtmosphere 14 00844 g017b
Figure 18. Number of Discomfort hours for (A) summer clothing and (B) winter clothing.
Atmosphere 14 00844 g018
Table 1. Simulation assumptions and setups.
CategoryPropertySpecificationConsistent with
Reference
Mesh QualityElements maximum size (mm)500[30,39,40,41]
Number of elements2,190,000
Growth rate1.2
Defeature size (mm)2.5
Curvature minimum size (mm)5
Curvature normal angle (degree)18
Skewness0.21188
Orthogonal quality0.78694
Inflation transition ratio0.75
Inflation number of layers5
The mesh sensitivity study was conducted in the Amman case study using average velocity across an interior plane with an offset of 1.7 m from the floor, which is approximately the average person’s height in the Middle East Region [42]. The velocity results converged with a relative error margin of 1%.
Turbulence modelk −  ε k = 3 2 U I 2 [30,39,40,41]
ε = c μ 3 4 k 3 2 l 1
I = 0.16 R e 1 8
l = 0.07 L
Solid ModelingDomainBoolean[30]
Solid-fluidNo-Slip Walls
Inlet conditionsVelocity inlets; as per Figure 5, with a turbulence intensity of 5%
Fluid Modeling and Boundary ConditionsOutlet conditionPressure outlets of 1 bar[30,37,38]
The external surfaces of the computational domainOpenings
An open boundary condition is a computational boundary that allows phenomena generated in the interior domain to pass through the artificial boundary without distortion and without affecting the interior solution.
Computational performanceComputational performanceComputational performance[30]
Computational time12 h/case
SoftwareAnsys CFX
Residual targets1 × 10−3
Achieved residual levelApproximately 1 × 10⁻⁶
Boundary WallNo slip wallSmooth
SimulationSteady state
Table 2. Investigated space (living room) parameters.
ParameterDescription
Building area100 m2
ShapeSquare, 10 × 10 m
Living space area12 m2
Building height3 m
Parapet height1 m
Living space shapeRectangular 3 × 4 m
Orientation of living spaceLong axis east-west
WindowsTwo windows. South, West
Windows sizeFour windows
Windows sizeTwo windows: Width = 1.5 Height = 1
Two windows: Width = 1.0 Height = 1
Airtightness0.05 ac/h
LightingFluorescent25 mm diam
Power density10.20 W/m2
ControlStepped = 1 step
ON/OFF dimming day lighting control
HVAC SystemHeatingOff
CoolingOff
Natural VentilationOn within ASHRAE limitations
OccupancyPerson5
Table 3. Investigated space construction specification.
ComponentThicknessU-ValueLayersThickness
External wall0.26 m1.736Cement Plaster0.03
Block0.20
Cement Plaster0.03
Internal wall0.16 m1.690Cement Plaster0.03
Block0.10
Cement Plaster0.03
Roof0.28 m2.004Cast Reinforced concrete0.10
Block + cast reinforced concrete0.15
Cement Plaster0.03
Floor0.35 m1.4Gravel-based Soil0.20
Sand0.05
Cast Reinforced concrete0.10
WindowsN/A1.4Sliding, Single clear glazing0.06
5.881Aluminum Framing 0.05
Disclaimer/Publisher’s Note: The statements, opinions and data contained in all publications are solely those of the individual author(s) and contributor(s) and not of MDPI and/or the editor(s). MDPI and/or the editor(s) disclaim responsibility for any injury to people or property resulting from any ideas, methods, instructions or products referred to in the content.

