Article

Runoff Response to Climate in Two River Basins Supplied by Small Glacier Meltwater in Southern and Northern Tibetan Plateau

1
Regional Climate Group, Department of Eearth Sciences, University of Gothenburg, 405 30 Gothenburg, Sweden
2
State Key Laboratory of Tibetan Plateau Earth System, Environment and Resources (TPESRE), Institute of Tibetan Plateau Research, Chinese Academy of Sciences, Beijing 100101, China
*
Authors to whom correspondence should be addressed.
Atmosphere 2023, 14(4), 711; https://doi.org/10.3390/atmos14040711
Submission received: 19 December 2022 / Revised: 26 March 2023 / Accepted: 9 April 2023 / Published: 13 April 2023
(This article belongs to the Special Issue Glaciers Mass Balance Sensitivity to Meteorological Variability)

Abstract

:
The Tibetan Plateau (TP) has experienced amplified warming in recent decades, causing glaciers to melt and affecting river runoff. It is well established that the southern and northern areas of the TP have responded to climate changes differently, with the north dominated by a westerly climate and the south by the Indian monsoon. While there are more glaciers in the TP than in any other region outside the polar areas, most of these glaciers are tiny, and only a limited number of them have been monitored to study mass balance and downward runoff. This study used the mass balance measured at two glaciers along with in situ and satellite data to drive a hydrological model called the Alpine Runoff Predictor that includes glacier melt to simulate glacial melting and the accompanying hydrological processes of the two glacierized basins, analyze their contributions to the river runoffs, and investigate their responses to local climate changes. The results show that the glacier meltwater in both river basins showed an increasing trend, with values of 0.001 × 10⁸ m3 a−1 in the Kyanjing River basin and 0.0095 × 10⁸ m3 a−1 in the Tuole River basin. However, their multi-year average contributions to the runoff were 12.5% and 5.6%, respectively. In contrast to the Tuole River basin, where runoff is increasing (0.0617 × 10⁸ m3 a−1), the Kyanjing River basin has decreasing runoff (−0.0216 × 10⁸ m3 a−1) as a result of decreasing precipitation. This result highlights the dominant role played by precipitation changes in the two basins under study, which are characterized by small glacier meltwater contributions.

1. Introduction

The Tibetan Plateau (TP) or Third Pole is referred to as Asia’s water tower [1,2]. Outside the polar areas, it has the most glaciers (95,500) and the greatest ice volume (7.02 ± 1.82 × 10³ km3) [3,4,5]. The 13 major river systems in eastern, southern, and central Asia are nourished by precipitation, glaciers, and snowmelt water and provide water for 1.4 billion downstream residents in the region to fulfill their industry, irrigation, sanitation, energy, and drinking water needs [2]. Owing to climate change, the TP is experiencing amplified warming [6,7,8,9]; the annual temperature across the TP grew by about 0.44 °C per decade between 1979 and 2020, which was double the worldwide average rate of increase (0.19 °C per decade). Amplified climate warming has resulted in glacier melting, which is becoming increasingly intensive [10,11,12,13,14]. The overall glacier mass in the TP shrank by around 340 Gt from 2000 to 2018 [15], and the glacier melt significantly contributed to the imbalanced Asian Water Tower [15,16]. Thus, concern is growing over the TP’s water supply and security [17].
Understanding the current status of runoff in the upper river regions and its changes in the past and future represent an important foundation for water resource management. Many researchers have evaluated the effects of changing climatic factors on water resources in the TP’s sub-regions [18,19,20,21,22,23,24]. According to earlier research, the Indian monsoon climate, with higher runoff mostly related to rivers in the Indian monsoon domain, and the westerly climate, with lower runoff in the westerly domain, are the key factors underlying the differences in the availability of water resources [24]. Moreover, glacier meltwater’s contribution to downward runoff is critical to the modulated hydrological regime. This factor is particularly important in river basins populated by small glaciers since many rivers related to the Asian Water Tower are characterized by small glaciers. In comparison to the monsoon-dominated region, glacier melting is more important in the arid and semi-arid westerly-controlled regions [25]. Unlike the Brahmaputra and Upper Ganges basin, where the contributions of glacier and snow meltwater were only 16% and 22%, the Tarim and the Upper Indus basins had values of 42% and 33% [26,27].
With the exception of the Tarim, Indus, and Amudarya basins, where snow and glacier meltwater appear to dominate, rainfall runoff is the most significant factor for all major basins in the TP [26,27]. Thus, precipitation has had a large impact on the trajectory of river runoff in the TP during the past few decades, with ice and snow meltwater coming in second [26]. Mountain runoff at the southern slope of the Tianshan Mountain in the north of the basin grew over the previous 50 years, but runoff from the Tarim River’s main stream shows an aggravating downward trend from the upper to lower reach [28,29,30]. The runoff of the upstream Yellow river decreased during past decades due to a decrease in precipitation [31]. The runoff from the upstream Yangtze River increased due to increased precipitation and melted glacier water [32,33]. However, runoff in the upper parts of the Ganges and Brahmaputra basins, influenced by monsoon precipitation, recently decreased [34,35,36]. There are obvious differences in runoff changes between the southern and northern Tibetan Plateau. However, although many researchers have evaluated how climate changes have affected the TP sub-region’s water supplies, it is difficult to compare the changes and causes of runoff between different regions due to the differences in study periods, modeling approaches, and input data [26].
Glacier melting has increased for several decades and is driving an increase in summer meltwater release that is already reaching its peak in some catchments [24,37]. Hydrological projections considering future climate warming suggested that the runoffs in most headwaters in the TP would rise, coupled with a rise in precipitation and an increase in ice/snow melt [38,39]. For example, in all four of the Himalayan–Karakoram River basins (the Tarim, Ganges, Indus, and Brahmaputra basins), peak water will be achieved by 2050 under the representative concentration pathway (RCP) 4.5 scenario [40]. To date, the trends based on observed runoff have not been fully consistent with simulation predictions for the runoff, at least in the Ganges and Brahmaputra river basins [35,36,38], mainly because the significant uncertainty resulting from the various outputs of different climate models is a large issue in future projection studies [39]. This factor illustrates the importance of research based on in situ observational data to study hydrological regimes.
Glacier changes differ significantly between monsoon- and westerly-dominated regions. However, comparative studies of the corresponding hydrological processes are lacking. Thus, in this study we make full use of in situ observations and remote sensing data, combined with an Alpine Runoff Model, to analyze the contributions of glacier melting to runoff, and to investigate runoff responses to climate in two river basins supplied by small amounts of glacier meltwater in the southern and northern Tibetan Plateau.

2. Study Area

We chose the two most intensively observed river basins, the Kyanjing River basin, which is dominated by the Indian monsoon, and the Tuole River basin, which is dominated by the westerlies. There are 77 glaciers in the Kyanjing River basin, covering an area of 87.2 km2 and containing a total ice volume of 7.42 km3 [4,5]. The Kyanjing River basin has a total area of 351 km2, whereas the Tuole River basin has a total size of 6910 km2 (Table 1 and Figure 1). According to glacier change research in Heihe [41], there are 321 glaciers in Tuole River basin, with a total area of 154.0 km2 and a total ice volume of 2.79 km3 [4,5]. Based on the Simple Biosphere 2 Model [42], the land is mainly covered by shrubs with bare soil (57.5%), ice/snow (34.1%), C3 grassland (4.2%), and dwarf trees and shrubs (4.2%) in the Kyanjing river basin and covered by C3 grassland (50.5%), shrubs with bare soil (49%), and ice/snow in the Tuole river basin (Figure S1).
The Yala Glacier in Langtang Valley is a small glacier with no debris. This glacier is approximately 1.4 km long and 1.61 km2 in size and flows from 5661 to 5168 m a.s.l [43], respectively (Figure 1b). Since 1981, the Yala Glacier has been the subject of several glaciological investigations [44,45,46,47]. The Yala Glacier terminus has retreated drastically since the 1990s [48], and the speed of the glacier’s surface movement has slowed [49]. The Yala Glacier’s mass balance in 2011/12 was –0.89 m w.e. [50]. The directly measured average annual mass-balance rate of the Yala Glacier was −0.80 ± 0.28 from 2011 to 2017 [51]. Based on digital elevation models from 2000 and 2012, the geodetically determined annual mass-balance rate of the Yala Glacier was 0.74 ± 0.53 m w.e. [43]. All studies showed that the summer balance determined the annual balance.
Qiyi Glacier has an area of approximately 2.87 km2 and flows northward from an altitude of 5160 to 4305 m a.s.l. [11] (Figure 1c). The Qiyi Glacier’s mass balance has been monitored since 1974 but not continuously. There are, in total, 25 years of mass balance observations from 1974 to the present. With the exception of Urumqi glacier No. 1 and the Xiaodongkemadi, Qiyi is the glacier in the TP with the longest mass balance observation [52]. A statistical model relating the Equilibrium-Line Altitude (ELA) of the Qiyi Glacier and its main driving forces, i.e., warm-season air temperature and cold-season precipitation, was established [53]. When the warm season air temperature increased (decreased) by 1 °C, the glacier ELA climbed (descended) by 172 m and ascended (descended) 62 m when cold season precipitation decreased (increased) by 10%. Because air temperature is the primary element affecting mass balance, the Qiyi Glacier’s mass balance was observed to be extremely sensitive to changes in air temperature [52]. Variations in the ablation season’s air temperature (June to September), which affects albedo and melt by modifying snowfall and incoming longwave radiation, were found to be the primary factors driving interannual changes in glacier mass balance in the Qilian Mountains [54].

3. Data and Methods

3.1. Data

3.1.1. In Situ Data

(1)
Meteorological and hydrological data
The in situ temperature and precipitation at the Kyanjing Station were measured by the Department of Hydrology and Meteorology (DHM) in Nepal before 2010 and observed by the Institute of Tibetan Plateau Research, Chinese Academy of Sciences (ITPCAS) after May 2010. These data are available through the Tibetan Plateau Science Data Center (https://data.tpdc.ac.cn/home, accessed on 19 December 2022). The in situ meteorological data from the Tuole River basin were obtained from the Tuole Station of China Meteorological Administration (CMA) and downloaded from the National Meteorological Data Center (http://data.cma.cn/ accessed on 19 December 2022). The data for the Binggou Hydrological Station in the Tuole River basin were published in the Hydrological Yearbook of the People’s Republic of China—Inland River basin Hydrological Data, and are also available from the Western China Environmental and Ecological Science Data Center (https://data.tpdc.ac.cn/home accessed on 19 December 2022). The location information of the meteorological-hydrological stations is outlined in Table 1.
(2)
Mass balance data
The mass balance data for Yala Glacier were mainly observed via ITPCAS. In addition, we collected the published mass balance data from ICIMOD [43,51] and the World Glacier Monitoring Service [55]. The mass balance data of the Qiyi Glacier were also observed by ITPCAS [52,54].

3.1.2. Satellite Data

(1)
Temperature
We adopted MOD11A1 (from Terra) and MYD11A1 (from Aqua) land surface temperature products to derive the temperature data. The main procedures for MODIS data processing were as follows. First, we used the MODIS Reprojection Tool (MRT) to preprocess the satellite data through projection conversion, mosaics, and resampling, such that all data had the same projection system, geographic coordinates, and spatial and temporal resolution. The missing data were supplemented by methods such as interpolation to ensure the completeness and consistency of the data. The data sampling frequency was four times a day. The consistency of the multi-year time series of MODIS-retrieved temperature was verified to determine the reliability and applicability of the satellite data based on seasonal and interannual variation characteristics [56].
The calculated monthly temperature lapse rates for different months in the Kyanjing basin are shown in Figure S2. The monthly mean temperature lapse rate in summer was small, but the absolute value of the winter temperature lapse rate was large. Figure S3 shows the monthly average values for the temperature lapse rate in the Tuole River basin. The maximum absolute value of the monthly temperature lapse rate appeared in June (−0.83 °C/100 m), while the lowest absolute value appeared in January (−0.46 °C/100 m). The annual average temperature lapse rate was −0.68 °C/100 m.
(2)
Precipitation
We used TRMM 3B43 and GPM precipitation, which offered a geographical resolution of 0.25 degrees and a temporal resolution of 1 day. We evaluated the accuracy of precipitation data from TRMM and GPM based on the total amount of precipitation and the number of total precipitation occurrences (Figures S4 and S5). In the Kyanjing River basin, the monthly TRMM precipitation was close to the observed precipitation. Since the station represented a single point, and the TRMM grid covered a certain spatial range, we could not conclusively determine whether the precipitation observed at the Kyanjing station was better than the TRMM data. In the Tuole River basin, precipitation was obviously underestimated before 2005 and after 2013. This difference might have affected the TRMM-based runoff simulation in the Tuole River basin. Our results revealed that TRMM performed better than GPM for the Kyanjing and Tuole River basins, which is consistent with the results found by Sun et al. [57]. Our study found that although the precipitation from TRMM was underestimated in the Tuole River basin, TRMM data were more reliable than GPM data. We, therefore, used TRMM data in our study.
(3)
Evaporation
Evaporation is an important parameter in hydrological processes. Today, the MODIS ET datasets from NASA are widely utilized. We used evaporation data from MOD16A2GF/MYD16A2GF directly in our ARP model with geographical and temporal resolutions of 500 m and 8 days, respectively [58]. The data processing was the same as described in Section 1 for temperature.
The daily evaporation data at the grid locations containing the Kyanjing and Tuole meteorological stations are shown in Figures S6 and S7. Here, there are obvious seasonal changes in evaporation, with high levels in summer and low levels in winter, which are related to the high temperatures in summer and the large amount of precipitation. At Kyanjing meteorological station (Figure S6a), the daily evaporation varied between 0.5 and 4.0 mm. By comparing the multi-year monthly average data of evaporation and precipitation, we found that the precipitation values in April and June to September were significantly higher than the evaporation levels (Figure S6b), especially from July to August, while the evaporation levels in other months were higher than those of precipitation. At the Tuole station, the daily evaporation was between 0.5 and 3.0 mm (Figure S7a). By comparing the multi-year monthly average data for evaporation and precipitation, we found that the precipitation from June to August was significantly higher than the evaporation (Figure S7b), with levels close to those of evaporation in June and September, while the evaporation levels in other months were higher than the corresponding precipitation levels.
(4)
Snow cover
Snow cover data were processed from MOD10A2 and MYD10A2 products with a spatial resolution of 500 m and a time resolution of 8 days. Snow cover data are widely used to drive or validate hydrology models. In our study, snow cover data were also used to validate our model. Figures S8 and S9 show the annual and monthly mean snow cover in the Kyanjing and Tuole River basins.
In the Kyanjing River basin, the annual snow cover area was large, with a multi-year mean value of 90%. The maximum of monthly snow cover occurred in March and April, and the minimum value appeared in July. The mean snow cover between June and August reached 80%. The maximum snow cover area was observed in 2014, and the minimum was observed in 2000. The interannual variation of snow cover area was small, with a weak decreasing trend. The seasonal change in snow cover area was, likewise, not apparent.
In the Tuole River basin, the annual snow cover area was small, with a multi-year mean value of 39.5%. The maximum monthly snow cover occurred in November, and the minimum value appeared in July. Snow cover was smaller before 2003, and two peaks occurred in 2008 and 2015. The interannual variation of snow cover in the Tuole River basin was larger than that in the Kyanjing basin. The snow cover area was large in spring and autumn but small in summer; Liang et al. [59] called this an M-shaped pattern.
Notably, due to the influence of the South Asian monsoon in the study areas during summer, there are many records with cloud-contamination. Therefore, in model calibration, only data from the MODIS snow cover data under cloud-free conditions were used for comparison with the simulated values.

3.2. The Alpine Runoff Predictor

The river runoff was modeled by using the Alpine Runoff Predictor (ARP), which integrated the degree-day factor model and the HYMOD model [60,61]. The model divided the entire watershed into two parts: areas with and without glaciers. The runoff model included three parts: snow/ice ablation, runoff production, and confluence:
M i c e / s n o w = D D F i c e / s n o w T a T m
where M i c e / s n o w is the meltwater (mm w.e./day), D D F s n o w / i c e is the degree-day factor for ice or snow melting, T a is the temperature, and T m is the temperature threshold for ice or snow melting. When T a > T m , melting is considered to have started.
The calculation of runoff produced in the non-glacier region is based on the HYMOD:
F C = 1 1 C C m a x B e x p
where F is the cumulative rate of water storage capacity at a grid point in the watershed; C is water storage capacity; and C m a x and B e x p represent the maximum water storage capacity and spatial change index of water storage capacity, respectively. When the non-glacial area experiences precipitation, water volume greater than C m a x cannot seep, and the super-seepage part flows directly into the high-flow tank in the model; part of the other water exceeding the storage capacity based on the model parameters flows into the high-flow water tank, and another part flows into the low-flow tank. The retention factor determines the catchment velocity through the high-flow tank and the low-flow tank, and the sum of the final flow of the two parts of the tank forms the total flow.
The following is a list of the primary inputs for the model. (1) Glacier outlines in the Kyanjing and Tuole River basins were taken from the Randolph glacier Inventory V6.0 (RGI6.0) and the second glacier inventory dataset of China [4,62], and the surface elevations were taken from the SRTM DEM (90 m). (2) Daily data collected at the two AWSs were used as forcing data to drive the model. Additionally, the MODIS temperature lapse rates were computed based on MOD11A1 and MYD11A1. Precipitation was derived from TRMM and GPM, and T a and P r e c were linearly interpolated to each grid cell utilizing their vertical gradients. (3) We directly used evaporation derived from MOD16A2/MYD16A2 in the HYMOD. (4) Utilizing the linear relationship between observed snow depths and altitudes, the initial snow depth was calculated. (5) Fresh snowfall and ice were given assumed densities of 200 and 900 kg m−3, respectively.
To test the performance of different data and select the best option, we used multiple combinations of in situ and satellite data to drive the model, forming a total of four model configurations in each basin. For configuration 1, temperature and precipitation data collected at the Kyanjing and Tuole stations were input as forcing data. For configuration 2, the TLR derived from MOD11A1/MYD11A1 was added. For configuration 3, TRMM precipitation was used. For configuration 4, both TLR derived from MOD11A1/MYD11A1 and TRMM precipitation were used to drive the model.
The possible parameter ranges of the ARP model are summarized in Table S1. For the simulation of glacier mass balance, runoff, and snow cover, the Monte Carlo simulation approach was employed to find the ideal combination of parameters. These parameters produced the lowest root mean square error (RMSE) between simulated glacier-wide mean mass balance and observed ones. The Nash–Sutcliffe coefficient between the modeled runoff at stations and observed runoff, and the bias between the modeled 8 day snow cover and MODIS snow cover were considered the optimal combination of parameters. Model performance was assessed using the squared Pearson correlation coefficient (r2), the root mean square error (RMSE), and bias. For runoff, the Nash–Sutcliffe coefficient ( N S E ) and volume deviation ( D v [%]) were also used to assess the results of the model simulation. The calculation formula was as follows:
R M S E = 1 n M B o b s M B s i m 2
where M B o b s and M B s i m are the observed and simulated glacier mass balance (mm w.e.) values, and n represents the years.
B i a s = 1 n S o b s S s i m S o b s
where S obs and S sim are, respectively, the observed and simulated snow cover.
N S E = 1 i = 1 n Q s i m Q o b s 2 i = 1 n Q o b s Q ¯ o b s
where Q o b s and Q s i m are, respectively, the observed and simulated runoff; Q ¯ o b s is the mean value of the observed runoff; and n is the number of runoff observations.
D v = V obs V sim V obs
where V obs and V sim represent the observed and simulated runoff volume, respectively.

4. Results and Discussions

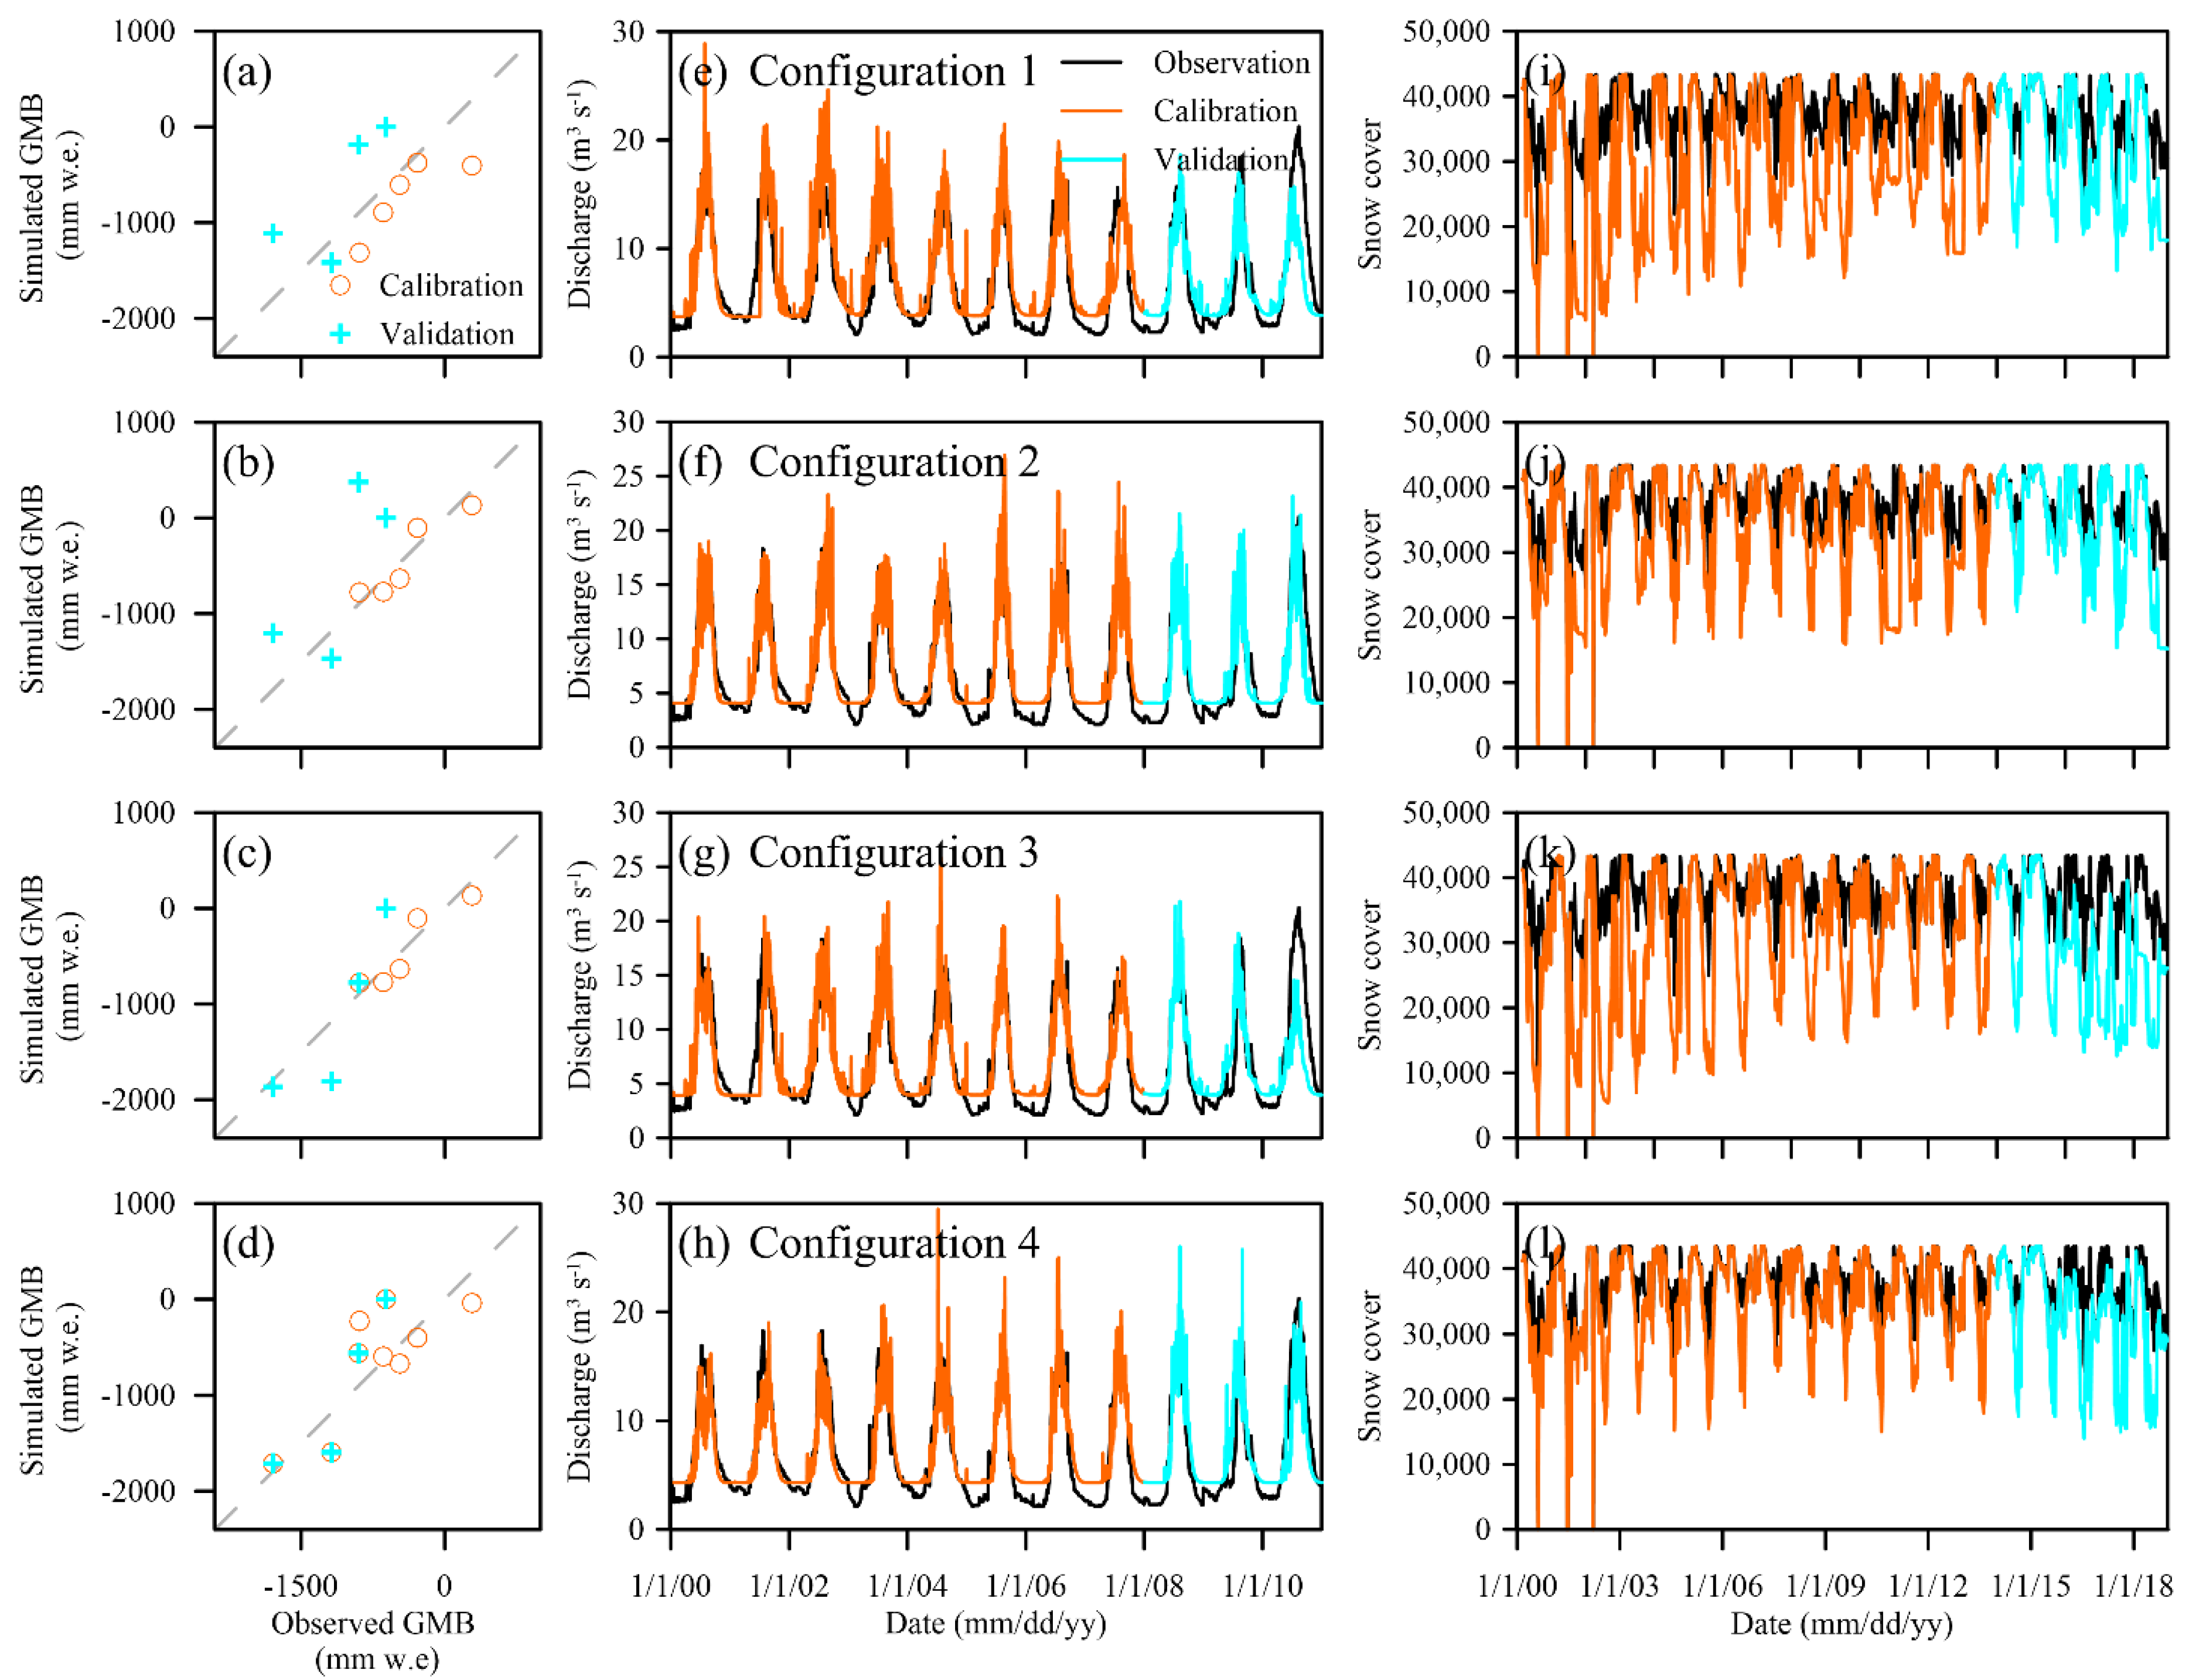
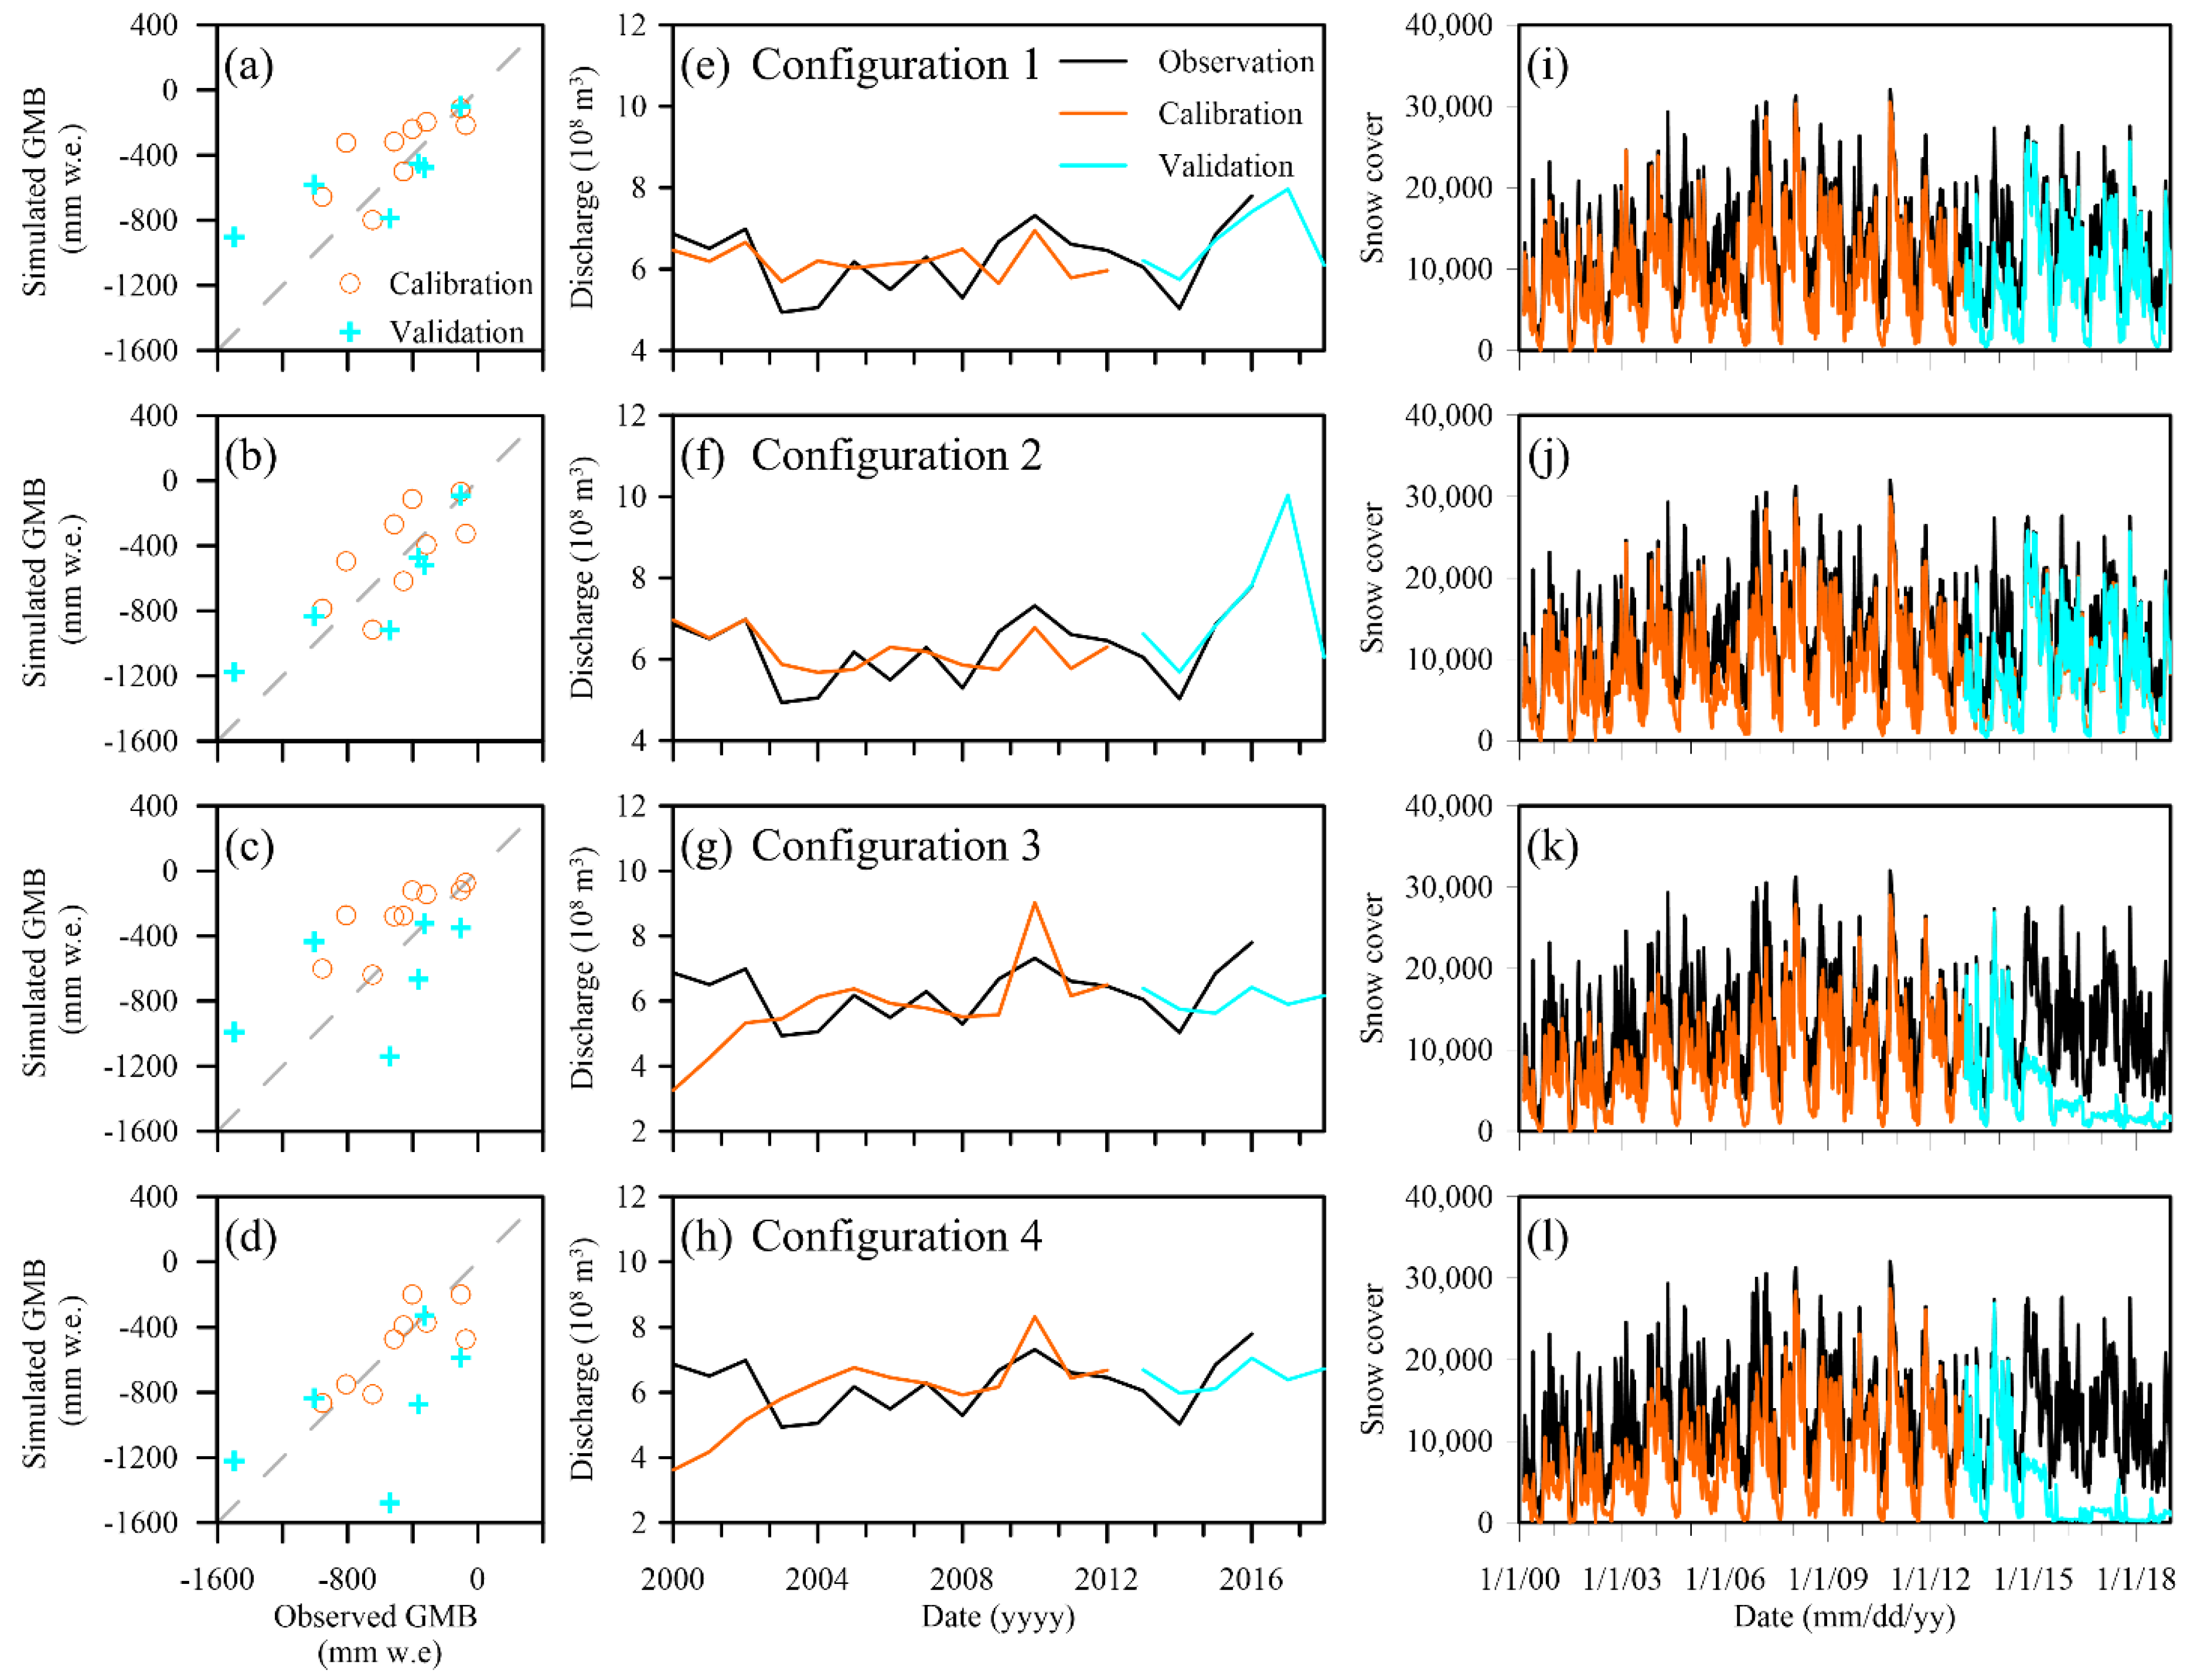
4.1. Model Calibration and Validation

We split the observations into two periods. Periods of 2001–2012 for the Qiyi Glacier and 2010–2015 for the Yala Glacier were used to calibrate the model, and periods of 2013–2018 for the Qiyi Glacier and 2016–2019 for Yala Glacier were used to validate the models. The optimal parameter combinations for the configurations are shown in Tables S2 and S3. The statistical results of model performances during calibration, validation, and the whole period are shown in Table 2 and Table 3.

4.2. The Influence of Adding Satellite Data on Model Performance

The simulated results of the four configurations for the Kyanging River are presented in Figure 2. For the glacier mass balance, configuration 3 was found to be the best, with the smallest R M S E value, followed by configuration 4. During the calibration and verification period, runoff from configurations 2 and 4 was generally comparable to the in situ observed runoff, and the peak values for each year were consistent overall. For snow cover, both configuration 2 and configuration 4 performed better, with relative bias values of 11.4% and 9.0%, respectively. In summary, the comprehensive performance of configuration 4 was the best, and its simulated results were used for subsequent analysis. In addition, the simulation results of the configurations showed that using MODIS temperature products and TRMM precipitation products in the ARP helped improve the performance of model simulations in the southern TP.
The simulated runoff of four configurations for the Tuole River are shown in Figure 3. For mass balance, runoff, and snow cover at the Tuole River basin, the comprehensive performance of configuration 2 performed the best, followed by configuration 1 (Table 3). Based on a comparison of the results between configuration 1 and configuration 2, using temperature lapse rates computed from satellite remote sensing production significantly improved the simulation results. During the whole period, the RMSE between the observed and modelled mass balance decreased from 266.9 to 235 mm w.e.; the NSE between the observed and modelled runoff increased from 0.39 to 0.61; and the relative bias of the modelled snow cover decreased from 26.1% to 0.27%. However, the simulation results of configurations 3 and 4, which both used TRMM precipitation, were poor, especially the simulated runoff. The yearly runoff was underestimated by configurations 3 and 4 before 2003 and after 2015, and the yearly runoff in 2009 was overestimated (Figure 3g,h). The underestimated and overestimated yearly runoffs were consistent with the features of TRMM precipitation (See Section 3.1.1). That is, the simulated runoff reflected the characteristics of TRMM precipitation. Although TRMM data were previously used to study precipitation distribution and gradients in mountainous areas, this study showed that TRMM precipitation can lead to large runoff errors and must be used with care in watershed runoff simulations for the study region.

4.3. Interannual Variation and Trends of Runoffs

The annual runoff changes are divided into two parts: those caused by ice and snow meltwater and those induced by rainfall. According to previous studies, both the Yala and Qiyi Glaciers had a negative glacial mass balance [11,16], that is to say, they were observed to be in a state of ice loss, which would cause an increase in runoff. However, because the glaciers only occupy a small portion of the two river basins, the influence of the glaciers melting on the runoff of the river basins might not be dominant. Therefore, we created a simulation using the ARP and assessed the contribution of glacier meltwater (including precipitation, snow, and ice meltwater) to the runoff of the two river basins.
Figure 4a shows that the glacier meltwater in both river basins presents an increasing trend, with values of 0.001 × 10⁸ m3 a−1 in the Kyanjing River basin and 0.0095 × 10⁸ m3 a−1 in the Tuole River basin. However, the difference between the two river basins was significant. The runoff values at the Kyanjing hydrological station in the Kyanjing River and the Binggou station in the Tole River are compared in Figure 4b. From 2000 to 2018, the runoff in the Kyanjing River showed a decreasing trend of −0.0216 × 10⁸ m3 a−1, and the Tuole River exhibited an increasing trend of 0.0617 × 10⁸ m3 a−1. The runoff changes in the two rivers have accelerated in opposite directions since 2014, reflecting a declining trend in the Kyanjing River and a rising trend in the Tuole River. Since 2014, the contribution of glacier meltwater has increased. Nevertheless, discharge in the Kyanjing River has decreased, while that in the Tuole River has increased. Thus, the abrupt change in runoff was not mainly due to the influence of glacial meltwater but rather the influence of precipitation changes. Consequently, the decrease in precipitation in the monsoon precipitation-dominated Kyanging River and the increased precipitation in the westerly-dominated Tuole River caused long-term opposite runoff trends in the two basins.
The total area of glaciers in the Kyanjing River accounts for 24.8% of the basin area, and the annual contribution of glacial meltwater to the runoff was observed to be between 9.4% (2012) and 16.1% (2016) (Figure 4c). The multi-year average contribution was 12.5%. Only 2.0% of the Tuole River basin is covered by glaciers, and the multi-year average amount of glacier meltwater that contributed to the runoff was minimal. The contribution of glacial meltwater to runoff ranged from 1.8% in 2008 to 11.7% in 2018, with a multi-year average contribution rate of 5.6%. Thus, the contribution of glacial meltwater to the runoff was greater for basins in which the area of glaciers makes up a significant fraction of the basin area. In addition, the time series for the long-term contribution of meltwater (Figure 4c) shows that the proportion of glacial meltwater in the annual runoff experienced an increasing trend in both rivers.
The melting period of the Yala Glacier in the Kyanjing River extends from April to October, while the melting period of the Qiyi Glacier in the Tuole River extends from May to September (Figure 4d). Every year, however, the melting of the Yala Glacier starts earlier and ends later. This factor is closely related to the negative state of glacier balance in the Yala Glacier and Qiyi Glacier. The contribution of glacier meltwater to the runoff of the two river basins was found to vary seasonally and notably increased during the ablation period. For the Kyanjing River, the largest amount of glacial meltwater that contributed to the runoff was observed in August, reaching a maximum of 24.6%, followed by July, which reached 24.1%. In June and September, the contribution of glacial meltwater reached 21.7% and 15.8%, respectively. However, the Tuole River glacier meltwater’s contribution to runoff was at its highest in July (18.1%), followed by August (14.5%), and then June (6.8%) and September (3.5%).

4.4. The Atmospheric Circulation Differences behind the Two River Basins

The Indian monsoon is weakening, and the overall patterns of mass balance over the Tibetan Plateau follow an atmospheric circulation pattern [11]. Recent studies in the southern Tibetan Plateau found that the more intensive glacier melting in the area is a result of rising temperature and declining precipitation [63]. In the middle and west Himalayas, the stronger negative mass loss compared to that of the 2010s was also caused by rising temperatures and decreasing precipitation during the melt season [64]. The same pattern of climate change was responsible for the retreat of the Yala Glacier. Different areas of the Qilian Mountains showed comparable interannual fluctuations in glacier mass balance. Interannual variations were predominately driven by changes in air temperature during the melt season [54,65]. Between 1970–1994 and 1995–2005, the glacier mass loss throughout the Qilian Mountains accelerated due to high temperatures during the ablation season.
Overall, the Tibetan Plateau experienced a warming and humidification trend in recent decades, but the regional differences in precipitation variability were significant. Annual precipitation was observed to decrease in the eastern, southern, and northwestern parts of the Tibetan Plateau and increase in the northeastern and central parts [66,67]. Since there was a strong association found between the interannual variation of runoff and precipitation in several rivers on the TP, interannual variation in precipitation appears to be the most influential factor affecting interannual variation in runoff. For runoff, due to the small area of the glaciers in the Kyanjing River basin, the amount of glacier meltwater was insufficient to compensate for the reduction in precipitation, leading to a decrease in runoff. A similar situation also occurred in the Brahmaputra River basin [35]. Due to the fast glacier melting and increased precipitation in the area [54], the total discharge in the Tuole River basin increased.

4.5. TP Glaciers’ Impacts on Rivers under Climate Change

Using various modeling techniques, the total runoff and its different components (rainfall, ice and snow meltwater, and baseflow) in the major river basins of the TP were investigated [6,23,24,28,68], as summarized by Tang et al. [25], Zhang et al. [26], and Nie et al. [27]. In terms of contributions to overall runoff, glacier melting was more important in the arid and semi-arid westerly-controlled Tarim basin (35.8% to 41.5%) [28,29] and upper Indus basin (3% to 40.6%) [6,23,68] than in the monsoon-dominated upper Brahmaputra (1.0% to 15.9%) [6,18,23] and upper Ganges basins (1.0% to 11.5%) [6,23]. For the upstream basins, including the Yellow, Yangtze, Mekong, and Salween basins, the contributions of melting glacier water were relatively moderate, with values of 0.8% [18], 5.2% to 11.0% [26,32,33], 0.9% to 1.4% [6,18], and 4.8% to 8.3% [6,18], respectively. The multi-year average contribution of melting glacier water in the Kyanjin River basin was 12.5%, which was within the range for the upper Brahmaputra. The multi-year average contribution rate of 5.6% in the Tuole River basin was close to the values for the upstream Yangtze River.
The change trend of river runoff in the TP in recent decades has thus been mainly affected by precipitation, followed by ice and snow melting. Additionally, some regional runoff changes relate to changes in evapotranspiration and soil storage [25]. Since the 1990s, mountain discharge in the north of the Tarim basin has grown, with 85.7% of additional river flow coming from increased glacier runoff [28,29,30]. The significant positive trend in precipitation also contributed to increased runoff to some extent [30]. However, the Tarim River’s main stream showed an aggravated declining tendency from the upper to lower reach [30]. The runoff of the upstream Yellow River decreased during the last fifty decades (1960–2009). The increase in evapotranspiration and the decrease in precipitation above the Tang Naihai Station are thought to be the primary causes for this decrease in runoff [31]. Although glacier and snow meltwater only contributed 7% and 5%, respectively, the runoff of the upstream Yangtze River increased due to increased precipitation and melting glacier water [32,33]. However, monsoon precipitation had the greatest impact on runoff in the Brahmaputra and Ganges basins. The increased downstream runoff helped to somewhat offset the decreased upstream runoff, with shrinking glaciers making a negligible contribution [34,35,36]. The runoff in the Kyanjing River basin decreased mainly due to decreased precipitation; this variation was similar to that in the Brahmaputra basins. The runoff in the Tuole River basin increased primarily due to increased precipitation and glacier melting; this variation was similar to that observed in the upper Tarim and Yangtze River basins.

5. Conclusions

Many rivers related to the Asian Water Tower are characterized by small glaciers. Understanding the current status of runoff in the upper river regions in the TP and its changes provide an important foundation for water resource management, especially in arid and semi-arid regions. Glacier changes differ significantly between monsoon- and westerly- dominated regions. However, comparative studies of hydrological processes in these two types of regions are lacking, especially studies covering the last two decades. Based on in situ glacier mass balance, hydrometeorology, and satellite data in the Kyanjing and Tuole River basins, combined with ARP, we analyzed glacier contributions to river runoff and investigated the effects of local climate changes.
We found that using TLR calculated from MOD11A1/MYD11A1 improved simulations of glacier melting and runoff in both the Kyanjing and Tuole River basins because the temperature distribution was better. However, the impact of TRMM precipitation on glacier and runoff modeling varied significantly by area. The simulation performance of glacier melting and runoff in the Kyanjing River basin was improved by using precipitation calculated from the TRMM. However, poor runoff modeling results were obtained in the Tuole River basin as a result of the inclusion of TRMM precipitation. The inter-annual variation of TRMM precipitation, moreover, did not match in situ observations at the Tuole station. Precipitation was underestimated in the TRMM for certain years and overestimated for others. TRMM precipitation, however, leads to large runoff errors and must be used with caution in the study area.
In terms of small glacier meltwater contributions, although the Indian monsoon-dominated southern Tibetan Plateau was characterized by more intensive glacier melting compared to that of the westerly-dominated northern Tibetan Plateau, small glacier meltwater did not offset the dominant effect of the decreased precipitation on runoff in the Kyanjing River basin. In contrast, the increased precipitation and glacier melting in the westerly-dominated Tuole River caused the river runoff to increase. The small glacier response to the climate emphasizes that precipitation in such areas contributes more to runoff than does glacier meltwater.
Alterations in rainfall induced by future atmospheric circulation changes, snow and ice melting, and permafrost ablation may increase water security in the Third Pole. Because glacier and runoff observations are extremely limited, especially due to the lack of meteorological observations at high altitudes, there are still large challenges in the evaluation and forecasting of water resources in different river basins. Thus, the systematic monitoring of climate–glacier–snow–permafrost–runoff and the development of coupled modeling based on remote sensing data are urgently needed to accurately assess water resource status and its impact, as well as to develop water management policies and adaptation strategies.

Supplementary Materials

The following supporting information can be downloaded at: https://www.mdpi.com/article/10.3390/atmos14040711/s1, Figure S1: Land use in the Kyanjing River and Tuole River basins (7: Shrubs with Bare Soil; 8: Dwarf Trees and Shrubs; 9: Agriculture or C3 Grassland; 11: Ice/Snow); Figure S2: Temperature lapse rate computed from MOD11A2 and MYD11A2 (°C/100m) for the Kyanjing River; Figure S3: Temperature lapse rate computed from MOD11A2 and MYD11A2 (°C/100m) for the Tuole Reiver River; Figure S4: The daily precipitation of observation (a), TRMM (b) and GMP (c), the yearly precipitation computed from observation, TRMM and GPM (d), the monthly mean precipitation of observation, TRMM and GPM at Kyanjing station; Figure S5: The daily precipitation of observation (a), TRMM (b) and GMP (c), the yearly precipitation computed from observation, TRMM and GPM (d), the monthly mean precipitation of observation, TRMM and GPM at Tuole station; Figure S6: The mean evaporation from MODIS products (a) and the comparison between monthly mean evaporation at Kyanjing station (b); Figure S7: The mean evaporation from MODIS products (a) and the comparison between monthly mean evaporation at Tuole station (b); Figure S8: The annual mean snow cover (a) and monthly mean snow cover (b) at Kyanjing River basin; Figure S9: The annual mean snow cover (a) and monthly mean snow cover (b) in the Tuole River station; Table S1: List of model parameters and their initial ranges; Table S2: The optimal model parameter combinations for the configurations in the Kyanjing River basin; Table S3: The optimal model parameter combinations for the configurations in the Tuole River basin.

Author Contributions

R.Y. organized all the material of the paper and wrote the original draft; S.L. provided in situ mass balance data for the Yala Glacier and D.C. guided the key scientific framework of the paper and revised the draft. All authors have read and agreed to the published version of the manuscript.

Funding

This study was supported by the Swedish Strategic Research Area MERGE (ModElling the Regional and Global Earth system) and Swedish VR (253061039) and Formas (2019-01520), and the Youth Innovation Promotion Association CAS (2019072).

Institutional Review Board Statement

Not applicable.

Informed Consent Statement

Not applicable.

Data Availability Statement

Data will be made available on request.

Conflicts of Interest

The authors declare no conflict of interest.

References

  1. Dyhrenfurth, G.O. To the Third Pole: The History of the High Himalaya, 1st ed.; Ex Libris; Werner Laurie: London, UK, 1955. [Google Scholar]
  2. Immerzeel, W.W.; van Beek, L.P.H.; Bierkens, M.F.P. Climate change will affect the Asian water towers. Science 2010, 328, 1382–1385. [Google Scholar] [CrossRef] [PubMed]
  3. Pfeffer, W.; Arendt, A.; Bliss, A.; Bolch, T.; Cogley, J.; Gardner, A.; Hagen, J.; Hock, R.; Kaser, G.; Kienholz, C.; et al. The Randolph Glacier Inventory: A globally complete inventory of glaciers. J. Glaci. 2014, 60, 537–552. [Google Scholar] [CrossRef] [Green Version]
  4. RGI Consortium. Randolph Glacier Inventory–A Dataset of Global Glacier Outlines, Version 6 [Dataset]; National Snow and Ice Data Center: Boulder, CO, USA, 2017. [Google Scholar] [CrossRef]
  5. Farinotti, D.; Huss, M.; Fürst, J.J.; Landmann, J.; Machguth, H.; Maussion, F.; Pandit, A. A consensus estimate for the ice thickness distribution of all glaciers on Earth. Nat. Geosci. 2019, 12, 168–173. [Google Scholar] [CrossRef] [Green Version]
  6. Lutz, A.; Immerzeel, W.W.; Shrestha, A.B.; Bierkens, M.F.P. Consistent increase in High Asia’s runoff due to increasing glacier melt and precipitation. Nat. Clim. Chang. 2014, 4, 587–592. [Google Scholar] [CrossRef] [Green Version]
  7. Stocker, T.F. Climate Change 2013: The Physical Science Basis. In Contribution of Working Group I to the Fifth Assessment Report of the Intergovernmental Panel on Climate Change; Cambridge University Press: Cambridge, UK, 2014. [Google Scholar]
  8. Pepin, N.; Bradley, R.S.; Diaz, H.F.; Baraer, M.; Caceres, E.B.; Forsythe, N.; Fowler, H.; Greenwood, G.; Hashmi, M.Z.; Liu, X.D.; et al. Elevation-dependent warming in mountain regions of the world. Nat. Clim. Chang. 2015, 5, 424–430. [Google Scholar]
  9. You, Q.; Cai, Z.; Pepin, N.; Chen, D.; Ahrens, B.; Jiang, Z.; Wu, F.; Kang, S.; Zhang, R.; Wu, T.; et al. Warming amplification over the Arctic Pole and Third Pole: Trends, mechanisms and consequences. Earth-Sci. Rev. 2021, 217, 103625. [Google Scholar] [CrossRef]
  10. Bolch, T.; Kulkarni, A.; Kääb, A.; Huggel, C.; Paul, F.; Cogley, J.G.; Frey, H.; Kargel, J.S.; Fujita, K.; Scheel, M.; et al. The state and fate of Himalayan glaciers. Science 2012, 336, 310–314. [Google Scholar] [CrossRef] [Green Version]
  11. Yao, T.; Thompson, L.; Yang, W.; Yu, W.; Gao, Y.; Guo, X.; Yang, X.; Duan, K.; Zhao, H.; Xu, B.; et al. Different glacier status with atmospheric circulations in Tibetan Plateau and surroundings. Nat. Clim. Chang. 2012, 2, 663–667. [Google Scholar] [CrossRef]
  12. Brun, F.; Berthier, E.; Wagnon, P.; Kääb, A.; Treichler, D. A spatially resolved estimate of High Mountain Asia glacier mass balances from 2000 to 2016. Nat. Geosci. 2017, 10, 668–673. [Google Scholar] [CrossRef] [PubMed] [Green Version]
  13. Maurer, J.M.; Schaefer, J.M.; Rupper, S.; Corley, A. Acceleration of ice loss across the Himalayas over the past 40 years. Sci. Adv. 2019, 5, v7266. [Google Scholar] [CrossRef] [Green Version]
  14. Shean, D.E.; Bhushan, S.; Montesano, P.; Rounce, D.; Arendt, A.; Osmanoglu, B. A systematic, regional assessment of High Mountain Asia glacier mass balance. Front. Earth Sci. 2020, 7, 363. [Google Scholar] [CrossRef] [Green Version]
  15. Kraaijenbrink, P.D.A.; Bierkens, M.F.P.; Lutz, A. Impact of a global temperature rise of 1.5 degrees Celsius on Asia’s glaciers. Nature 2017, 549, 257–260. [Google Scholar] [CrossRef] [PubMed]
  16. Yao, T.; Bolch, T.; Chen, D.; Gao, J.; Immerzeel, W.; Piao, S.; Su, F.; Thompson, L.; Wada, Y.; Wang, L.; et al. The imbalance of the Asian water tower. Nat. Rev. Earth. Environ. 2022, 3, 618–632. [Google Scholar] [CrossRef]
  17. Pritchard, H.D. Asia’s shrinking glaciers protect large populations from drought stress. Nature 2019, 569, 649–654. [Google Scholar] [CrossRef] [PubMed]
  18. Zhang, L.; Su, F.; Yang, D.; Hao, Z.; Tong, K. Discharge regime and simulation for the upstream of major rivers over Tibetan Plateau. J. Geophys. Res. Atmos. 2013, 118, 8500–8518. [Google Scholar] [CrossRef]
  19. Lan, C.; Zhang, Y.; Zhu, F.; Liang, L. Characteristics and changes of streamflow on the Tibetan Plateau: A review. J. Hydrol. Reg. Stud. 2014, 2, 49–68. [Google Scholar]
  20. Bibi, S.; Wang, L.; Li, X.; Zhou, J.; Chen, D.; Yao, T. Climatic and associated cryospheric, biospheric, and hydrological changes on the Tibetan Plateau: A review. Int. J. Climatol. 2018, 38, e1–e17. [Google Scholar] [CrossRef] [Green Version]
  21. Yao, T.; Wu, G.; Xu, B.; Wang, W.; Gao, J.; An, B. Asian water tower change and its impacts. Bull. Chin. Acad. Sci. 2019, 34, 1203–1209. [Google Scholar]
  22. Kamp, U.; Pan, C. Assessment of the Role of Glaciers in Streamflow from Pamir and Tienshan Mountains: The Role of Glaciers in the Hydrologic Regime of the Amu Darya and Syr Darya Basins; World Bank: Washington, DC, USA, 2015. [Google Scholar]
  23. Armstrong, R.L.; Rittger, K.; Brodzik, M.J.; Racoviteanu, A.; Barrett, A.P.; Khalsa, S.S.; Raup, B.; Hill, A.F.; Khan, A.L.; Wilson, A.M.; et al. Runoff from glacier ice and seasonal snow in High Asia: Separating melt water sources in river flow. Reg. Environ. Chang. 2019, 19, 1249–1261. [Google Scholar] [CrossRef] [Green Version]
  24. Su, F.; Zhang, L.; Ou, T.; Chen, D.; Yao, T.; Tong, K.; Qi, Y. Hydrological response to future climate changes for the major upstream river basins in the Tibetan Plateau. Glob. Planet. Chang. 2016, 136, 82–95. [Google Scholar] [CrossRef]
  25. Tang, Q.; Lan, C.; Su, F.; Liu, X.; Sun, H.; Wang, L.; Leng, G.; Zhang, Y.; Sang, Y.; Fang, H.; et al. Streamflow change on the Qinghai-Tibet Plateau and its impacts (in Chinese). Chi. Sci. Bull. 2019, 64, 2807–2821. [Google Scholar]
  26. Zhang, F.; Thapa, S.; Immerzeel, W.; Zhang, H.; Lutz, A. Water availability on the Third Pole: A review. Water Secur. 2019, 7, 100033. [Google Scholar] [CrossRef]
  27. Nie, Y.; Pritchard, H.D.; Liu, Q.; Hennig, T.; Wang, W.; Wang, X.; Liu, S.; Nepal, S.; Samyn, D.; Hweitt, K.; et al. Glacial change and hydrological implications in the Himalaya and Karakoram. Nat. Rev. Earth Environ. 2021, 2, 91–106. [Google Scholar] [CrossRef]
  28. Gao, X.; Ye, B.; Zhang, S.; Qiao, C.; Zhang, X. Glacier runoff variation and its influence on river runoff during 1961–2006 in the Tarim River Basin. Sci. China 2010, 53, 880–891. [Google Scholar] [CrossRef]
  29. Luo, Y.; Wang, X.; Piao, S.; Sun, L.; Ciais, P.; Zhang, Y.; Ma, C.; Gan, R.; He, C. Contrasting streamflow regimes induced by melting glaciers across the Tien Shan–Pamir–North Karakoram. Sci. Rep. 2018, 8, 2–10. [Google Scholar] [CrossRef] [PubMed] [Green Version]
  30. Tao, H.; Gemmer, M.; Bai, Y.; Su, B.; Mao, W. Trends of streamflow in the Tarim River Basin during the past 50years: Human impact or climate change? J. Hydrol. 2011, 400, 1–9. [Google Scholar] [CrossRef]
  31. Lan, C.; Zhang, Y.; Gao, Y.; Hao, Z.; Cairang, L. The impacts of climate change and land cover/use transition on the hydrology in the upper Yellow River Basin, China. J. Hydrol. 2013, 502, 37–52. [Google Scholar]
  32. Han, P.; Long, D.; Han, Z.; Du, M.; Dai, L.; Hao, X. Improved understanding of snowmelt runoff from the headwaters of China’s Yangtze River using remotely sensed snow products and hydrological modeling. Remote Sens. Environ. 2019, 224, 44–59. [Google Scholar] [CrossRef]
  33. Liu, S.Z.; Yong, Z.; Yingsong, D.; Yong, J. Estimation of glacier runoff and future trends in the Yangtze River source region. J. Glaciol. 2009, 55, 353–362. [Google Scholar]
  34. Lan, C.; Li, N.; Liu, Z.; Ding, J.; Liang, L.; Zhang, Y.; Gong, T. Warming and human activities induced changes in the Yarlung Tsangpo basin of the Tibetan plateau and their influences on streamflow. J. Hydrol. Reg. Stud. 2019, 25, 100625. [Google Scholar]
  35. Wang, Y.; Wang, L.; Zhou, J.; Yao, T.; Yang, W.; Zhong, X.; Liu, R.; Hu, Z.; Luo, L.; Ye, Q.; et al. Vanishing glaciers at southeast Tibetan Plateau have not offset the declining runoff at Yarlung Zangbo. Geophys. Res. Lett. 2021, 48, e2021GL094651. [Google Scholar] [CrossRef]
  36. Anand, J.; Gosain, A.K.; Khosa, R.; Srinivasan, R. Regional scale hydrologic modeling for prediction of water balance, analysis of trends in streamflow and variations in streamflow: The case study of the Ganga River basin. J. Hydrol. Reg. Stud. 2018, 16, 32–53. [Google Scholar] [CrossRef]
  37. Huss, M.; Hock, R. Global-scale hydrological response to future glacier mass loss. Nat. Clim. Chang. 2018, 8, 135–140. [Google Scholar] [CrossRef] [Green Version]
  38. Immerzeel, W.W.; van Beek, L.P.H.; Konz, M.; Shrestha, A.B.; Bierkens, M.F.P. Hydrological response to climate change in a glacierized catchment in the Himalayas. Clim. Change 2012, 110, 721–736. [Google Scholar] [CrossRef] [Green Version]
  39. Immerzeel, W.W.; Pellicciotti, F.; Bierkens, M.F.P. Rising river flows throughout the twenty-first century in two Himalayan glacierized watersheds. Nat. Geosci. 2013, 6, 742. [Google Scholar] [CrossRef]
  40. Rounce, D.R.; Hock, R.; Shean, D.E. Glacier mass change in high mountain Asia through 2100 using the open-source Python Glacier Evolution Model (PyGEM). Front. Earth Sci. 2020, 7, 331. [Google Scholar] [CrossRef] [Green Version]
  41. Huai, B.; Li, Z.; Wang, S.; Sun, M.; Zhou, P.; Xiao, Y. Remote sensing analysis of glacial changes in the Heihe River Basin in the past 50 years. J. Geolog. Sci. 2014, 69, 365–377. [Google Scholar]
  42. Defries, R.S.; Los, S.O. Implications of land-cover misclassification for parameter estimates in global land-surface models: An example from the Simple Biosphere Model (SiB2). Photogramm. Eng. Remote Sens. 1999, 65, 1083–1088. [Google Scholar]
  43. Stumm, D.; Joshi, S.P.; Gurung, T.R.; Silwal, G. Mass balances of Yala and Rikha Samba glaciers, Nepal, from 2000 to 2017. Earth Syst. Sci. Data. 2021, 13, 3791–3818. [Google Scholar] [CrossRef]
  44. Ageta, Y.; Iida, H.; Watanabe, O. Glaciological studies on Yala Glacier in Langtang Himal. In Glacial Studies in Langtang Valley—Report of the Glacier Boring Project 1981–1982 in the Nepal Himalaya; Higuchi, K., Ed.; Data Center for Glacier Research, Japanese Society of Snow and Ice: Tokyo, Japan, 1984; pp. 41–47. [Google Scholar]
  45. Higuchi, K. Outline of the Glaciological Expedition of Nepal: Boring Project 1981 and 1982. Bull. Glacier Res. 1984, 2, 1–5. [Google Scholar]
  46. Takahashi, S.; Motoyama, H.; Kawashima, K.; Morinaga, Y.; Seko, K.; Iida, H.; Kubota, H.; Naven, R.T. Meteorological features in Langtang valley, Nepal Himalayas, 1985–1986. Bull. Glacier Res. 1987, 5, 35–40. [Google Scholar]
  47. Yamada, T. An outline of Glaciological Expedition of Nepal: Langtang Himal Project 1987–88. Bull. Glacier Res. 1989, 7, 191–193. [Google Scholar]
  48. Fujita, K.; Takeuchi, Y.; and Seko, K. Glaciological observations of Yala Glacier in Langtang Valley, Nepal Himalaya, 1994 and 1996. Bull. Glacier Res. 1998, 16, 75–81. [Google Scholar]
  49. Sugiyama, S.; Fukui, K.; Fujita, K.; Tone, K.; Yamaguchi, S. Changes in ice thickness and flow velocity of Yala Glacier, Langtang Himal, Nepal, from 1982 to 2009. Ann. Glaciol. 2013, 54, 157–162. [Google Scholar] [CrossRef] [Green Version]
  50. Baral, P.; Kayastha, R.B.; Immerzeel, W.W.; Pradhananga, N.S.; Bhattarai, B.C.; Shahi, S.; Galos, S.; Springer, C.; Joshi, S.P.; Mool, P.K. Preliminary results of mass-balance observations of Yala Glacier and analysis of temperature and precipitation gradients in Langtang Valley, Nepal. Ann. Glaciol. 2014, 55, 9–14. [Google Scholar] [CrossRef] [Green Version]
  51. Acharya, A.; Kayastha, R.B. Mass and Energy Balance Estimation of Yala Glacier (2011–2017), Langtang Valley, Nepal. Water 2019, 11, 6. [Google Scholar] [CrossRef] [Green Version]
  52. Wang, S.; Pu, J.; Wang, N. Study on mass balance and sensitivity to climate change in summer on the Qiyi Glacier, Qilian Mountains. Sci. Cold Arid Regions. 2012, 4, 281–287. [Google Scholar]
  53. Wang, N.; He, J.; Pu, J.; Jiang, X.; Jing, Z. Variations in equilibrium line altitude of the Qiyi Glacier, Qilian Mountains, over the past 50 years. Chin. Sci. Bull. 2010, 55, 3810–3817. [Google Scholar] [CrossRef]
  54. Zhu, M.; Yao, T.; Thompson, L.G.; Wang, S.; Yang, W.; Zhao, H. What induces the spatiotemporal variability of glacier mass balance across the Qilian Mountains. Clim. Dyn. 2022, 59, 3555–3577. [Google Scholar] [CrossRef]
  55. Zemp, M.; Nussbaumer, S.U.; Gärtner-Roer, I.; Bannwart, J.; Paul, F.; Hoelzle, M. (Eds.) WGMS 2021. Global Glacier Change Bulletin No. 4 (2018–2019). ISC(WDS)/IUGG(IACS)/UNEP/UNESCO/WMO; World Glacier Monitoring Service: Zurich, Switzerland, 2021; p. 278. [Google Scholar]
  56. Zhou, W.; Peng, B.; Shi, J.; Wang, T.; Dhital, Y.P.; Yao, R.; Yu, Y.; Lei, Z.; Zhao, R. Estimating high resolution daily air temperature based on remote sensing products and climate reanalysis datasets over glacierized basins: A case study in the langtang valley, Nepal. Remote Sens. 2017, 9, 959. [Google Scholar] [CrossRef] [Green Version]
  57. Sun, W.; Chen, R.; Wang, L.; Wang, Y.; Han, C.; Huai, B. How do GPM and TRMM precipitation products perform in alpine regions? J. Geogr. Sci. 2022, 32, 913–931. [Google Scholar] [CrossRef]
  58. Running, S.W.; Mu, Q.; Zhao, M.; Moreno, A. MODIS Global Terrestrial Evapotranspiration (ET) Product (MOD16A2/A3 and Year-End Gap-Filled MOD16A2GF/A3GF) NASA Earth Observing System MODIS Land Algorithm (for Collection 6); National Aeronautics and Space Administration: Washington, DC, USA, 2019. Available online: https://modis-land.gsfc.nasa.gov/pdf/MOD16UsersGuideV2.022019.pdf (accessed on 19 December 2022).
  59. Liang, P.; Li, Z.; Zhang, H. Spatial-temporal variation characteristics of snow cover area in Qilian Mountains from 2001 to 2017. Arid Land Geogr. 2019, 42, 56–66. [Google Scholar]
  60. Hock, R. Glacier melt: A review of processes and their modelling. Progr. Phys. Geogr. 2005, 29, 362–391. [Google Scholar] [CrossRef]
  61. Moore, R.J. The probability-distributed principle and runoff production at point and basin scales. Hydrol. Sci. J. 1985, 30, 273–297. [Google Scholar] [CrossRef] [Green Version]
  62. Guo, W.; Liu, S.; Xu, J.; Wu, L.; Shangguan, D.; Yao, X.; Wei, J.; Bao, W.; Yu, P.; Liu, Q.; et al. The second Chinese glacier inventory: Data, methods and results. J. Glaciol. 2015, 61, 357–372. [Google Scholar] [CrossRef] [Green Version]
  63. Yang, W.; Guo, X.; Yao, T.; Zhu, M.; Wang, Y. Recent accelerating mass loss of southeast Tibetan glaciers and the relationship with changes in macroscale atmospheric circulations. Clim Dyn. 2016, 47, 805–815. [Google Scholar] [CrossRef]
  64. Zhu, M.; Yang, W.; Yao, T.; Tian, L.; Thompson, L.G.; Zhao, H. The influence of key climate variables on mass balance of Naimona’nyi glacier on a north-facing slope in the western Himalayas. J. Geophys. Res.-Atmos. 2021, 126, e2020JD033956. [Google Scholar] [CrossRef]
  65. Zhang, H.; Li, Z.; Zhou, P. Mass balance reconstruction for Shiyi Glacier in the Qilian Mountains, Northeastern Tibetan Plateau, and its climatic drivers. Clim. Dyn. 2021, 56, 969–984. [Google Scholar] [CrossRef]
  66. Yang, K.; Ye, B.; Zhou, D. Response of hydrological cycle to recent climate changes in the Tibetan Plateau. Clim. Change 2011, 109, 517–534. [Google Scholar] [CrossRef]
  67. Lan, C.; Zhang, Y.; Wang, Q. Climate change on the northern Tibetan Plateau during 1957–2009: Spatial patterns and possible mechanisms. J. Clim. 2013, 26, 85–109. [Google Scholar]
  68. Immerzeel, W.W.; Droogers, P.; Jong, S.M.; Bierkens, M. Satellite derived snow and runoff dynamics in the upper Indus river basin. Environ. Sci. 2010, 45, 303–312. [Google Scholar]
Figure 1. The location of the Kyanjing and Tuole River basins in the Tibetan Plateau (a). While the Yala Glacier is located in the Kyanjing basin (b), the Qiyi Glacier is located in the Tuole basin (c). The red and black squares in (b,c) show the locations of meteorological and hydrological stations.
Atmosphere 14 00711 g001
Figure 2. Simulated glacier mass balance (ad), runoff (eh) and snow cover (il) using the four configurations in the Kyanjing basins compared to observations; the model results in the four rows correspond to Configurations 1–4, respectively.
Atmosphere 14 00711 g002
Figure 3. Simulated glacier mass balance (ad), runoff (eh) and snow cover (il) using the four configurations in the Toule basins compared with observations, where the model results in the four rows correspond to Configurations 1–4, respectively.
Atmosphere 14 00711 g003
Figure 4. Comparison between annual glacier meltwater (a) and runoff (b) from the Kyanjing basin and the Touhe River basin; the annual (c) and the monthly (d) contribution of meltwater from the glacier region to the runoff of the Kyanjing basin and the Tuole River basin.
Atmosphere 14 00711 g004
Table 1. The location information for meteorological and hydrological stations at the Tuole River and Kyanjing River.
BasinStationLongitude
(°E)
Latitude
(°N)
Elevation (m a.s.l)
Kyanjing
River
Kyanjing Gompa (ITPCAS)85.5728.21 3831
DHM hydrological station85.5528.20 3730
Tuole
River
Tuole (CMA station)98.2538.48 3367
Binggou hydrological station98.0039.60 2100
Table 2. Statistical results of model performance during model calibration, validation, and the whole period at the Kyanjing River basin.
PeriodItemCriteriaConfiguration 1Configuration 2Configuration 3Configuration 4
CalibrationMass balancer20.39 0.46 0.93 0.56
RMSE (mm w.e.)458.3 772.4 147.4 346.1
Runoffr20.87 0.89 0.88 0.89
NSE0.67 0.78 0.77 0.78
Dv (%) 13.3 5.0 5.1 3.4
Snow coverRelative bias (%)23.7 11.8 19.27.2
ValidationMass balancer20.73 0.76 0.87 0.89
RMSE (mm w.e.)545.4 516.3 505.9 428.5
Runoffr20.81 0.84 0.77 0.84
NSE0.63 0.70 0.580.71
Dv (%) 6.24 2.68 6.29 2.64
Snow coverRelative bias (%)15.1 10.13 26.65 14.27
WholeMass balancer20.55 0.19 0.89 0.79
RMSE (mm w.e.)489.1 697.6 315.9 375.6
Runoffr20.83 0.87 0.84 0.87
NSE0.74 0.75 0.71 0.75
Dv (%) 7.7 2.8 1.9 3.2
Snow coverRelative bias (%)21.4 11.4 21.2 9.0
Table 3. Statistical results of model performance during model calibration, validation, and the whole period at the Tuole River basin.
PeriodItemCriteriaConfiguration 1Configuration 2Configuration 3Configuration 4
CalibrationMass balancer20.71 0.69 0.79 0.80
RMSE (mm w.e.)223.6 220.8 260.3169.1
Runoffr20.40 0.62 0.11 −0.03
NSE0.15 0.39 −2.85 −2.51
Dv (%) −0.28 −0.30 7.31 3.76
Snow coverRelative bias (%)25.43 25.02 0.29 0.35
ValidationMass balancer20.80 0.88 0.47 0.51
RMSE (mm w.e.)321.2 232.2 426.3 495.7
Runoffr20.92 0.95 0.37 −0.10
NSE0.44 0.81 0.03 0.41
Dv (%) 0.46 −3.35 4.66 −1.02
Snow coverRelative bias (%)27.58 0.27 0.63 0.70
WholeMass balancer20.76 0.78 0.59 0.62
RMSE (mm w.e.)266.9 235.0 336.6 339.7
Runoffr20.63 0.78 0.15 0.10
NSE0.39 0.61−1.73 −1.38
Dv (%) 0.06 7.2 16.37 15.70
Snow coverRelative bias (%)26.11 0.27 0.40 0.46
Disclaimer/Publisher’s Note: The statements, opinions and data contained in all publications are solely those of the individual author(s) and contributor(s) and not of MDPI and/or the editor(s). MDPI and/or the editor(s) disclaim responsibility for any injury to people or property resulting from any ideas, methods, instructions or products referred to in the content.

