Article

Study on the Impact of Typhoon Maria (2018) on Suspended Sediment in Hangzhou Bay, China

1
Marine Science and Technology College, Zhejiang Ocean University, Zhoushan 316022, China
2
State Key Laboratory of Hydroscience and Engineering, Tsinghua University, Beijing 100084, China
*
Authors to whom correspondence should be addressed.
Atmosphere 2023, 14(4), 721; https://doi.org/10.3390/atmos14040721
Submission received: 1 March 2023 / Revised: 10 April 2023 / Accepted: 13 April 2023 / Published: 16 April 2023
(This article belongs to the Special Issue Air-Sea Interaction: Modeling and Dynamics)

Abstract

:
Sediment transport in coastal waters has an important impact on the siltation of port channels and changes in the estuary ecological environment. The southeast coast of China is often hit by typhoons, which can affect the suspended sediment concentration (SSC) in coastal waters. In this study, we used Geostationary Ocean Color Imager (GOCI) data to analyze SSC variations in Hangzhou Bay during Typhoon Maria (2018), and the influencing factors were also analyzed. The results showed that: (1) During the typhoon’s transit, the SSC in Hangzhou Bay (HZB) increased by 200–800 mg/L, which was one-fold higher than the day before the typhoon. The variation of SSC on the south bank was noticeable, and the typhoon effect on SSC lasted for 2–3 days; (2) The wind speed and significant wave height (SWH) increased during the typhoon. In general, in the early stage of the typhoon, the SSC in HZB was affected by the wind, and in the interim and late period, SSC was influenced by the effect of wind and wave height; (3) Typhoon “Maria” accelerated the transport of sediment and land-based pollutants from land to sea; the effect of residual current and wind stress are the driving mechanisms for seaward sediment transport. However, mechanisms and driving factors of sediment transport in coast water are complex and diverse. The results of this study can help to understand the processes of riverbed erosion and deposition in Hangzhou Bay and adjacent waters. They are also significant for the study of nearshore hydrodynamic characteristics of typhoons and channel engineering.

1. Introduction

Suspended sediment concentration (SSC) is a vital parameter for assessing the nearshore and estuarine ecological and sediment-dynamic environments of water bodies. Suspended sediment alters optical properties, such as water transparency and light transmission, affects phytoplankton photosynthesis and material cycling in marine ecosystems, and has important implications for aquatic ecological environment [1,2,3,4]. SSC is affected by a combination of tidal currents, runoff, wind, and waves, it reflects the sediment transport, deposition, and resuspension processes in the nearshore of the estuary, and is indicative of siltation and erosion in nearshore estuaries [5,6,7]. Its spatial distribution and transport characteristics represent a significant basis for analyzing estuarine morphology and shoreline evolution [8,9,10].
A typhoon is a strong tropical weather system that occurs in tropical or subtropical oceans. It is one of the most common natural disasters on the southeast coast of China. Due to the strong air–sea interaction, typhoons often cause strong wind and waves, heavy rains, and storm surges, bringing huge losses to the coastal areas. During the passage of a typhoon, the hydrodynamic conditions in the nearshore change dramatically, and SSC increased significantly in the short term [11,12]. The increase in bottom shear stress is the main reason for the increase in SSC during typhoon [11,13]. During the typhoon period, suspended sediment was transported across the continental shelf driven by different dynamic factors, causing sediment deposition in coastal areas. This strengthened the exchange of suspended sediment between the estuary and the ocean [14]. Typhoons enhance the vertical mixing of water bodies, resuspension of seabed sediment, which increases the erosion of coasts and islands, and shoreline shifting [15,16,17]. Li et al. [14] found that the contribution of wind stress to the surface and bottom layers of the water body is different during the typhoon process. The wave energy dissipation caused by shallow water topography is the main reason for the change in the nearshore wave dynamic field. Typhoon waves and the nonlinear effects of wave-current are the main driving forces for the increase of bottom shear stress and SSC [14,18]. In addition, the variation of tidal currents during different periods of flood tide and ebb tide, as well as the spring and neap tides, has a significant influence on the SSC during typhoon [19,20,21].
Hangzhou Bay has a higher tidal range along the coast of China. The historical maximum tidal range is 9 m, and the SSC is up to 5000 mg/L during the turbidity period [22,23]. Hangzhou Bay is frequently affected by typhoons. According to statistics, typhoons land on the southeast coast of China on average 6.5 times a year, and about 50% of typhoons have a significant influence on Hangzhou Bay [11,24]. Typhoons and strong winter storms cause dramatic changes in hydrodynamic conditions in coastal estuarine areas and changes in SSC and pollutant transport in a short time [21,25,26]. Changes in wind speed and wave height during typhoons will lead to storm surges, resulting in sea flooding and coastal erosion, resulting in changes in the concentration of suspended sediment on the ocean surface [27]. Typhoons will trigger violent wind waves, affecting estuarine erosion and siltation, causing coastal erosion and sudden siltation of waterways [18,28,29,30]. In this process, rainfall-runoff increased the input of land-based pollutants and changed the ecological environment and material circulation [17,20,31,32].
During the typhoon, the sea conditions were harsh, complicating on-site observation [33]. Remote sensing technology has the characteristics of a short repetition period, high timeliness, and a wide field of vision. It is an effective method to observe sea surface meteorological and dynamic factors during a typhoon [12,34]. Based on the GOCI image and the suspended sediment inversion algorithm, this study analyzed the temporal and spatial distribution characteristics of SSC in Hangzhou Bay and adjacent waters before and after the transit of Typhoon “Maria” in 2018 and combined them with the coastal marine dynamic factors to study its impact on SSC changes and suspended sediment transport.

2. Materials and Methods

2.1. Study Area

Hangzhou Bay (29.5°–31° N, 120.5°–122.5° E, Figure 1b) is located in the East China Sea (Figure 1a). It extends from Ganpu–Cixi in the west to Zhenhai–Nanhui in the east. It is adjacent to the Yangtze River estuary, and the width of the section from the bay mouth to the top of the bay is gradually narrowed. It is a typical horn-shaped estuary [35]. The average water depth is approximately 10 m. The tidal type is regular semidiurnal tide, and the maximum velocity during the flood tide can reach up to 3 m/s [13]. Affected by strong tidal action and topography, the turbidity of seawater in Hangzhou Bay is high, and the temporal and spatial variation is significant [19,36].

2.2. Typhoon “Maria”

Typhoon “Maria,” the ninth typhoon of 2018, was generated at 2:00 p.m. (local time) on 5 July and developed into a super typhoon at 5:00 a.m. on 6 July. Since then, it has moved northwestward at a speed of about 30 km/h. It made landfall on the coast of the Huangqi Peninsula in Lianjiang, Fujian Province, at about 8 a.m. on 11 July 2018 (its track is shown in Figure 1a; the red dots on the line represent “typhoon”; the pink dots represent “strong tropical storm”; and the yellow dots represent “tropical storm”). After landing, “Maria” continued to move northwestward at a speed of about 30 km/h and weakened to a tropical storm at 1:00 p.m. on 11 July. (Typhoon track, maximum wind speed, and air pressure are from the Tropical Cyclone Data Center of the China Meteorological Administration (https://tcdata.typhoon.org.cn/ (accessed on 16 November 2022)) and the Zhejiang Provincial Department of Water Resources (https://typhoon.slt.zj.gov.cn/ (accessed on 16 November 2022)).).

2.3. Data

2.3.1. Wave and Current

The significant wave height (SWH) is obtained from the third generation Météo France Wave Model (MFWAM) from 0:00 on 8 July to 23:00 on 15 July. The global ocean sea surface waves produce 3-hourly outputs through the global wave system of Météo-France with a resolution of 1/5 degree. (https://data.marine.copernicus.eu/product/GLOBAL_MULTIYEAR_WAV_001_032/ (accessed on 20 November 2022)).The daily average sea surface current data (from 0 m to 5 m below the sea surface) with a resolution of 1/12 degree is obtained from Copernicus Marine Environment Monitoring Service (CMEMS). (https://data.marine.copernicus.eu/product/GLOBAL_MULTIYEAR_PHY_001_030/ (accessed on 20 November 2022)).

2.3.2. Wind and Rainfall

The wind and rainfall are from the fifth-generation global atmospheric reanalysis products (ERA-5) provided by the European Centre for Medium-Range Weather Forecasts (ECMWF). Replacing the ERA-Interim reanalysis, ERA5 is the latest ECMWF reanalysis database for the global climate and weather for the past 4–7 decades. The wind vector at 10 m above the sea surface data and total precipitation are from 0:00 on 8 July to 11:00 p.m. on 15 July. The temporal and spatial resolution is 1 h and 0.25 degrees. (https://cds.climate.copernicus.eu/cdsapp#!/dataset/reanalysis-era5-single-levels?tab=overview (accessed on 20 November 2022)).

2.3.3. GOCI Image

The Geostationary Ocean Color Imager (GOCI, 2010 to present) is the first geostationary-orbiting ocean-color instrument in the world to be mounted on the Communication Ocean and Meteorological Satellite (COMS) and has a spatial resolution of 500 m [37]. GOCI provides hourly multi-spectral images of 8 bands from 00:00 UTC to 07:00 UTC, covering the East China Sea. GOCI Level-1B data were downloaded from the Korea Ocean Satellite Center (KOSC, https://kosc.kiost.ac.kr/index.nm (accessed on 20 November 2022)).
In this study, the GOCI images from 8 to 15 July 2018 were obtained. The images cover the daily high tide, flood tide (ebb tide), and low tide periods. Due to the influence of weather conditions, the GOCI image data for July 9 and July 11 was removed. The detailed information for GOCI images and the tide ranges is given in Table 1. GOCI L1-B images were preprocessed by the GOCI Data Processing System (GDPS) provided by the Korea Ocean Satellite Center (KOSC), and then the Quick Atmosphere Correction (QUAC) method was used for image atmospheric correction. QUAC uses the sequential maximum angle convex cone (SMACC) method to find pure pixels and determines the appropriate correction model to calculate remote sensing reflectance by referring to the average endmember spectrum [38,39].

2.4. Methods

2.4.1. Remote Sensing Inversion Method of Suspended Sediment

Hangzhou Bay is a higher tidal bay along the southeast coast of China. The historical maximum tidal range can reach up to 9 m, and the SSC is up to 5000 mg/L during the turbid period. He et al. [40] established a SSC remote sensing inversion model suitable for Hangzhou Bay based on the ratio of red (745 nm) and blue bands (490 nm) in a GOCI image. The method used in this study and the model are given below:
S S C = 10 1 . 0758 + 1 . 1230 R a t i o ,   R a t i o = R r s   ( 745 ) / R r s   ( 490 )
where SSC is the suspended sediment concentration, the unit of the SSC mg/L, and Rrs (490) and Rrs (745) represent the remote sensing reflectance of the central band of GOCI blue band and red band, respectively. The SSC algorithm is available for suspended sediments concentration ranging from 8 mg/L to 5275 mg/L, the average relative bias of it is 13.3% for SSC ≤ 300 mg/L and 14.2% for SSC > 300 mg/L [40,41].

2.4.2. Study Methods of Current

In coastal waters, the sea surface current is influenced by sea surface wind, runoff, tides, and temperature and salinity changes in seawater [42,43,44]. The sea surface current shows the path and direction of water flow. Residual current refers to the residual flow after filtering the periodic tidal current from the current, which plays an important role in the transport of suspended sediment in seawater [45]. To analyze the effect of current caused by the typhoon, the current data in different time periods on the same lunar date were selected (Typhoon period: 7–13 July 2018; under normal weather conditions: 2–8 July 2013; 21–27 June 2014; 10–16 July 2015; 28 June–4 July 2016; 18–24 June 2017). To compare the difference in the currents, daily velocity anomaly was calculated before and after the typhoon moved. The calculation method was as follows:
V r = V T V ¯ N
A i = V r i V ¯ 7 9
where V T and V ¯ N are the daily average current of 7–13 July 2018 (Typhoon period) and the mean value of five years, respectively (2014–2017, under normal weather conditions). A i and V r i are the velocity anomaly and daily average residual current, respectively, and V ¯ 7 9 is the average velocity before the typhoon (7 July–9 July 2018). The velocity anomaly is positive, indicating that the flow velocity increases; the anomaly is negative, indicating that the flow velocity decreases.

2.4.3. Study Methods of Wind Stress

The horizontal transport or sedimentation of suspended sediment will lead to changes in the spatial distribution of SSC. This study considered the horizontal transport mechanism of surface suspended sediment based on higher shear wind stress during the typhoon process. The wind stress calculation formula is as follows [46]:
τ = ρ a C d U | U |    
where τ is the wind stress, the unit of wind stress is N/m2, U is the wind speed at 10 m above the sea surface, the unit of wind speed is m/s. ρ a is the air density at 10m, and C d is the drag coefficient. Usually, the change of C d with wind speed is considered, which is generally specified in the form of piecewise function.

3. Result and Analysis

3.1. The Distribution of SSC in HZB Induced by Typhoon Maria

Considering the influence of tide on SSC in Hangzhou Bay, GOCI images of high tide, low tide, and flood tide (ebb tide) before and after the typhoon (8–13 July) were selected. Detailed information on images and tidal ranges is displayed in Table 1. Because of the weather during the typhoon, the cloud cover of remote sensing images increased, but it is still effective for monitoring the large-scale SSC changes induced by the typhoon. The spatial distribution of SSC in Hangzhou Bay before and after the typhoon was calculated using GOCI images and a suspended sediment remote sensing inversion model (Equation (1)).
From Figure 2a, Figure 3a and Figure 4a, it can be seen that the SSC in Hangzhou Bay was low and the distribution of surface suspended sediment was uniform three days before the typhoon landed (8 July). One day before the typhoon (11 July), the SSC in the northern part of the south bank of Hangzhou Bay increased significantly (Figure 2b, Figure 3b and Figure 4b). There was a significant increase in SSC during the high and low tides of the day, and the maximum SSC exceeded 1000 mg/L. The SSC segmentation zone is discovered near the coast (Figure 3b and Figure 4b). Within one day of the typhoon landing (12 July), the turbidity area in the central and southern Hangzhou Bay increased, especially in the periods of high tide and flood tide. The turbidity area showed a zonal distribution during the flood tide, and the distribution of the turbidity area was more concentrated during the high tide (Figure 2c and Figure 3c), and the SSC was lower at low tide (Figure 4c). The SSC on the second day after typhoon landfall was lower than that on the first day (Figure 2d, Figure 3d and Figure 4d).
To better understand the effect of typhoons on the distribution and variation of SSC in Hangzhou Bay, the SSC of four sections was measured before (10 July) and after (12 July) the passage of “Maria” (P1 to P4 in Figure 5, from north to south, with lengths of 20 and 60 km, respectively). Figure 6 is the SSC of the four sections before and after the typhoon (10 July and 12 July). The black and red lines in the figure are the SSC changes from north to south of the four sections before (10 July) and after (12 July) the typhoon in the period of the flood tide. After the typhoon (12 July), the SSC of the four sections increased by 200–900 mg/L. The increase of SSC in Section 3 was the most obvious, and the increase of SSC in Section 1 was not prominent. This may be due to differences in wind speed and wave intensity. In Section 1, near the estuary area, the change in SSC is affected by land sediment transport. Lower SSC is found in Section 4 which is close to the open sea.
To quantitatively analyze the influence of “Maria” on SSC in Hangzhou Bay, the average SSC in Hangzhou Bay was calculated and given in Figure 7. The orange, green and blue dots in Figure 7 represent the SSC in high tide, low tide and flood tide/ebb tide during the typhoon-influenced period (8–15 July 2018). After the typhoon landfall (12 July), the average SSC reached 800 mg/L, which was twice as high as before the typhoon (10 July). With the typhoon moving away, the average SSC of Hangzhou Bay showed an exponential decline (from 12 to 15 July; the equation shown in Figure 7). The SSC on the second day after the typhoon (13 July) landfall returned to the level of the day before the typhoon (10 July). On the fourth day after the typhoon landfall (14 July), typhoon control weakened, and SSC slowly increased.

3.2. The Response of SSC to Wind and Wave Height during “Maria”

The typhoon process in coastal waters accompanied by wind and wave. Figure 8 shows the variation of average SSC with wind speed and significant wave height in the coastal waters of Hangzhou Bay during the “Maria” transit. The area with the highest SSC is on the south bank, followed by the middle, and the lowest is on the north bank. On 9 July 2018, the offshore wind speed in Hangzhou Bay increased, decreased slightly on 10 July, and then continued to increase, reaching a maximum of 17 m/s. On the day of the typhoon’s landfall (11 July), the wind speed decreased rapidly. As the typhoon passed (13 July), the wind speed reduced to 5 m/s.
Before the typhoon landed, the SWH was 1 m. The wave height reached up to 4 m after the typhoon landed (11 July), whereas three times higher than before the typhoon. Two days after the typhoon landed, the wave height dropped below 2 m and returned to the level before the typhoon. The changing trend of wind speed and significant wave height in this process is similar. However, significant wave height has a time lag of less than one day when compared to wind speed, and wave height recovery time under typhoon modulation is less than two days.
From Figure 8, the SSC in Hangzhou Bay increases first and then decreases during the typhoon. In the early stages before the typhoon’s landfall (8–10 July), SSC was mainly affected by wind. SSC rises as wind speed rises, and SSC increased by 600 mg/L, 75 mg/L, and 250 mg/L in the southern, northern, and central seas, respectively. In the middle and late stages of the typhoon (11 July to 15 July), the trends of SSC and SWH were consistent. After the typhoon’s landfall (after 15 July), SSC began to increase slowly, which was related to the change in wind speed.
Five observation points were chosen to analyze the response of different regions of Hangzhou Bay to Typhoon Maria. The distribution of the stations is given in Table 2 and Figure 9. S1 locates on the South bank of Hangzhou Bay with a shallow depth (depth < 7m) and strong resuspension ability. S2 locates on the North bank with deep water and weak resuspension ability. S3 and S4 locate on the tidal channel of Hangzhou Bay. S5 locates outside of Hangzhou Bay where the SSC is low.
Figure 10 displays the variation of SSC, wind, and SWH during typhoons at stations 1–5 (S1–S5). In the figure, a–e represent S1–S5, the red point is the daily average of SSC at each station, the blue line represents SWH, and the black arrow represents the wind vector. The SSC varied across five stations. The SSC at S1 increased on the day before the typhoon transit (10 July). The increase of SSC continued on 12 July (the value was 1000 mg/L) and decreased on 13 July (the value was below 500 mg/L). The SSC variation trend was similar at S2 and S3 stations. One day after the typhoon (12 July), SSC exceeded 500 mg/L. The SSC at S4 station was higher one day before the typhoon’s landfall (800 mg/L). With the increase in wind speed, the value gradually increased and decreased on the third day after the typhoon. The average wind speed of S1–S5 reached 8.4–10.7 m/s on the day of the typhoon’s landfall. The wind direction changing trend at stations S1–S5 is similar. The wind speed shifted from southeast to east the day before typhoon’s landfall (10 July) and then back to southeast the next day (11 July). The SWH of S1–S4 stations in Hangzhou Bay is about 1 m, which has the characteristics of surge. The S5 station is located in the sea (east of the Zhoushan Islands), with the maximum wind speed and maximum SWH reaching 12 m/s and 3.8 m, respectively.

3.3. The Impact of Rainfall on SSC

Figure 11 illustrates the variation of SSC with rainfall in the coastal waters of Hangzhou Bay during the “Maria” transit period (8 July 2018–15 July 2018). During typhoon Maria, the precipitation in Hangzhou Bay was not significant, and the daily cumulative precipitation was 0.4–1.6 mm. The rainfall and SSC began to increase one day before the typhoon landed (July 10) and began to decrease one day after the typhoon’s landfall (12 July). The SSC decreased day by day, indicating a similar trend, which may be due to storm surge and rainfall. These factors changed the runoff and estuarine terrestrial pollutant transport, altering the state of SSC. The heavy precipitation occurred on 8 July, and the SSC was low, indicating that the change in SSC needed a certain amount of time.

3.4. Influence of “Maria” on the Suspended Sediment Transport

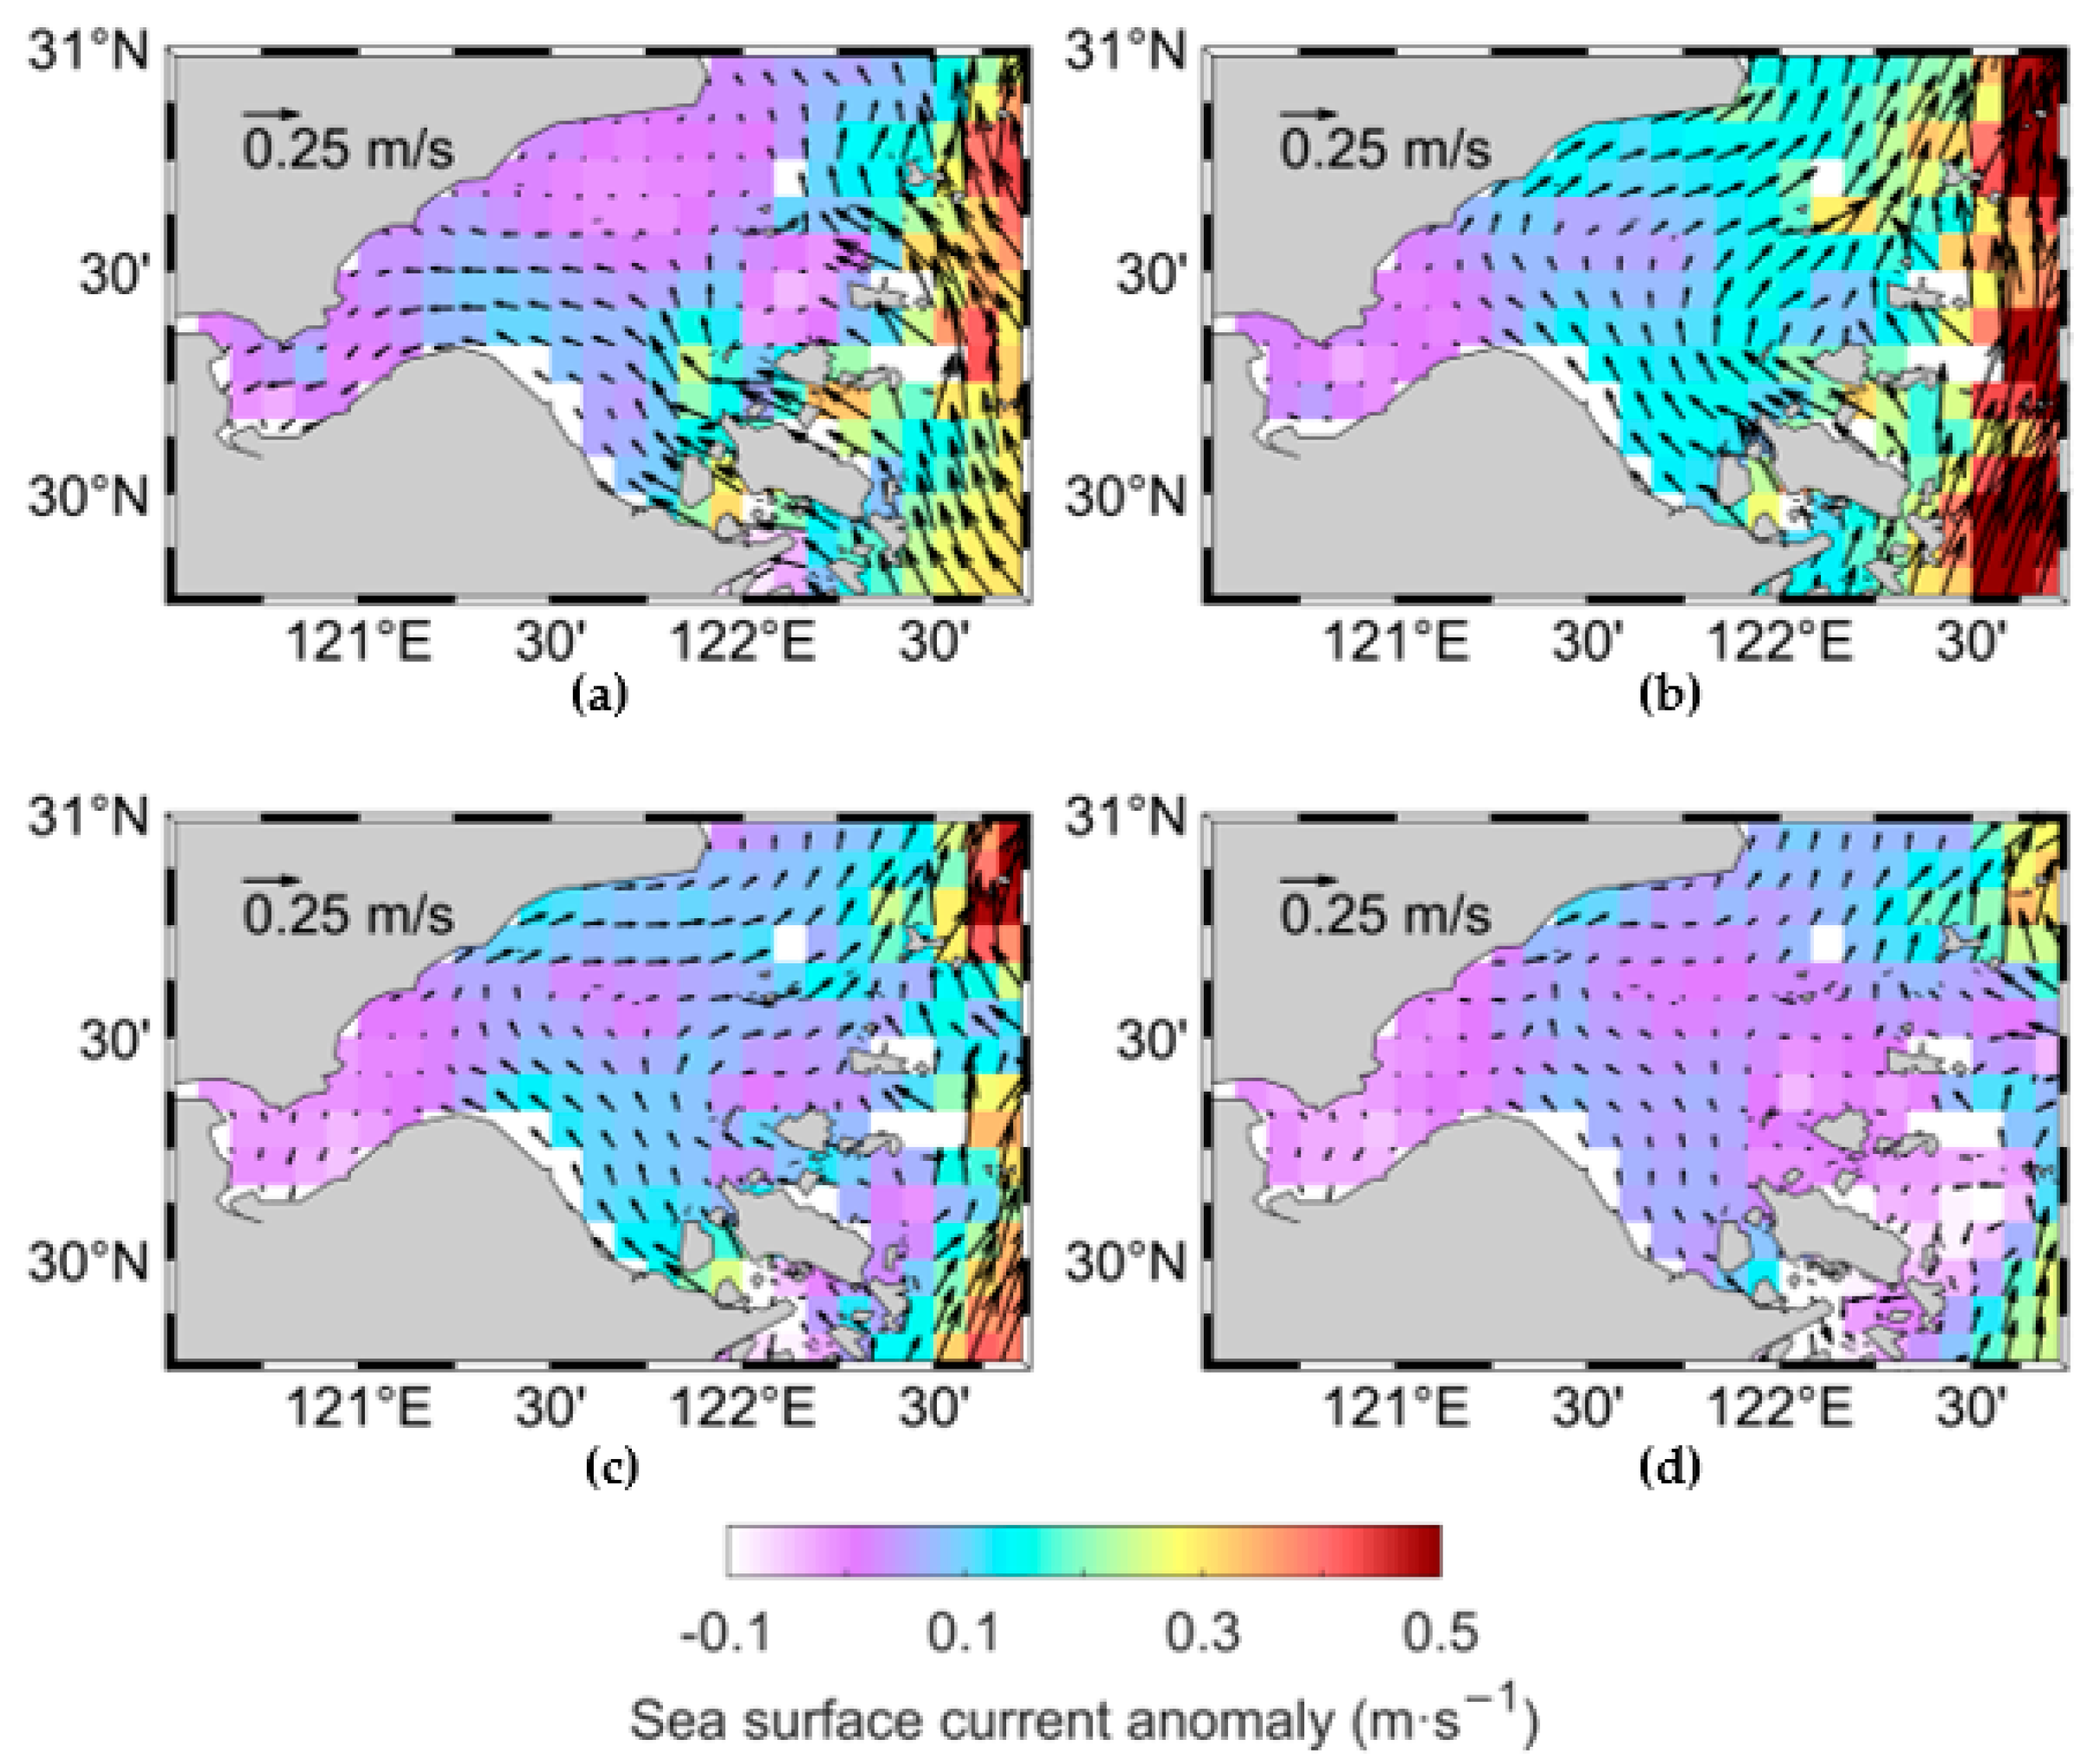
3.4.1. Influence of Residual Current

The distribution of the residual flow field in Hangzhou Bay is compared over four days (10 July to 13 July) during the typhoon. The results are revealed in Figure 12 and Figure 13. The surface current velocity refers to the vertical average velocity from 5 m below the sea surface to the sea surface. The arrow in Figure 12 and Figure 13 is the current vector, whose direction represents the direction of the current, and the length represents the velocity. The residual current velocity in the southeast of Hangzhou Bay was higher than that in the northeast before the typhoon landed, which was mainly manifested as the flow from the outside to inner of the bay (Figure 13a). On the day of typhoon landfall (11 July), the velocity anomaly in the eastern and outer seas of Hangzhou Bay was positive, and the maximum velocity in the bay reached up to 0.3 m/s, which was 0.4 times higher than that before the typhoon, indicating that the advection transport of surface suspended sediment was enhanced. During typhoon Maria, the direction of the residual current in Hangzhou Bay also changed. The residual current in the south flows to the northwest, and the residual current in the north flows to the northeast. The velocity in the northeast increased, showing a path of water flow from the inner bay to the outer bay, which helps to change the net transport direction of suspended sediment. (Figure 12b and Figure 13b). Two days after the typhoon passed (12–13 July), the velocity anomaly became lower while the flow velocity in Hangzhou Bay did not change much and was maintained at a certain level.

3.4.2. Influence of Wind Stress

Based on the sea surface wind speed data, the distribution of daily mean wind stress in the coastal waters of Hangzhou Bay during the transit period of typhoon “Maria” (10 July to 13 July) was calculated using Formula (4) (see Figure 14). The color change from white to red represents the change in wind stress from low to high. The arrow indicates its direction, and the length indicates its magnitude. Wind stress provides vital atmospheric forcing for the flow of sea surface currents during a typhoon, and changes in wind stress are related to changes in sea current velocity (Figure 13 and Figure 14). From Figure 14, the maximum wind stress was on 11 July, and the minimum was on 13 July; the wind stress in the estuary and nearshore area was low; the high-value area was located in the central part of Hangzhou Bay, indicating that it is greatly affected by wind speed. The day before the typhoon (10 July) was affected by southeast wind, and the wind stress pointed to the northwest. When the typhoon landed (11 July), the wind stress increased significantly, and the wind stress in the central sea area reached up to 0.08 N · m 2 . Later the wind direction deflected northward, and the wind stress gradually decreased. Figure 2c,d show that after the typhoon, the SSC in the northeast of Hangzhou Bay increased significantly and was higher than that in the southeast, indicating that the suspended sediment may have undergone northeastward advection transport. The Ekman transport mechanism indicates that in the Northern Hemisphere, the transport direction of the surface water body points in a direction of less than 90° on the right side of the wind stress [46]. The wind stress pointing to the northwest side of Hangzhou Bay caused the surface water carrying sediment to move to the northeast side, promoting surface suspended sediment transport to the seaside in Hangzhou Bay.

4. Discussion

During the typhoon, wind and waves had a significant impact on SSC in Hangzhou Bay (Figure 8). However, the response of different regions to the typhoon presents spatial variability (Figure 10). The SSC of S1–S4 is higher, the amplitude of variation is higher, and the S1 on the south bank of Hangzhou Bay is the most significant (Figure 10a–c). The spatial variability of SSC is mainly determined by topography and location [21]. Cai et al. [47] found that SSC has a negative correlation with bathymetry in Hangzhou Bay. Compared to other stations, S1 on the south bank of Hangzhou Bay has a shallower depth and stronger resuspension ability (Table 2). With the shallow depth, the stir effect by the wind helps to enhance the resuspension of the sediment and SSC at S1–S4. Variations in wind direction may affect the transport of surface sediment, resulting in changes in SSC. Studies show that bed shear stress is modulated by wind waves only in strong wind and wave conditions (SWH > 1 m) [48]. This indicates that only the S5 in Zhoushan was significantly affected by waves among the five stations during the typhoon event. The variation of SSC was not evident at S5 because it is located outside of Hangzhou Bay, far from the coast, and in deep water.
The variation of SSC distribution and suspended sediment transport in Hangzhou Bay is modulated by various dynamic factors [13,19,40]. Influenced by the wind, the transport direction of the sediment-laden flow pointed to the northeast from the inner bay to the sea during Typhoon Maria. This change lasted for 2–3 days (Figure 13). In addition, tidal current is an important factor affecting the SSC in Hangzhou Bay [39]. Two days after the typhoon (12–13 July), the velocity anomaly became lower while the flow velocity in the bay did not change much and was maintained at a certain level. Tidal ranges in Table 1 indicate that the tidal residual current was strong during 12–13 July. By combining the effects of typhoon and tide, the ability of sediment to move to the sea was enhanced insignificantly. The distribution of SSC in Figure 2c, c and Figure 4c shows this trend.
The variation of SSC in the eastern part of Hangzhou Bay during the spring tide is mainly influenced by sediment resuspension and horizontal advection [49]. The bottom sediment is resuspended under the strong shear stress of waves and currents during typhoons and migrates to the surface through turbulent mixing and diffusion [21]. Li and Li [20] used Delft3D to simulate the SSC change of super typhoon Saomai and revealed the dynamic mechanism of SSC variation and suspended sediment transport. Due to the increase of turbulent energy in the pre-typhoon stage, the stratification of the water column is gradually destroyed and the depth of the mixing layer is increased, resulting in strong vertical mixing of the water body. Therefore, the vertical transport of suspended sediment is strengthened. Li et al. [14] used FVCOM to study the impact of Typhoon Chan-hom on SSC in Hangzhou Bay and found that the sediment flux at the mouth and south bank of Hangzhou Bay was higher. However, we only discuss the influence of advection and wind on the transport of suspended sediment in the upper water near the coast, and the vertical transport process of sediment was not considered in this study. We consider using the hydrodynamic model with sediment module and the typhoon model to further study the influence of typhoons on SSC and sediment transport in Hangzhou Bay in the future.

5. Conclusions

This study assessed the variation of SSC in Hangzhou Bay during the passage of Typhoon Maria based on GOCI images and the SSC retrieval algorithm. Combined with the wind field, sea surface current, and the significant wave height (SWH), the response mechanism of suspended sediment distribution and transport to Typhoon Maria was analyzed. The main conclusions of this study are as follows:
(1) Influenced by Typhoon Maria, SSC in Hangzhou Bay increased, and that on the south bank changed more significantly. The average SSC in Hangzhou Bay increased twice as much as the day before the typhoon by 200–800 mg/L. SSC decreased exponentially when the Maria typhoon passed away. The response of SSC to the typhoon lasted for 2–3 days, and SSC increased slowly on the 4th day of the typhoon’s landfall.
(2) During the typhoon process, the wind speed and the SWH in Hangzhou Bay increased. In the outer bay, the average wind speed increased from 5 m/s to 17 m/s, and SWH increased from 1 m to 4 m. The SWH lagged behind the wind speed by one day. In the early stages of the typhoon, the variation of SSC was affected by wind. In the middle and late stages of typhoon, it was affected by wind speed and wave height.
(3) The effects of the typhoon differ in different parts of Hangzhou Bay. The wind stress in the central sea area of Hangzhou Bay was higher than that near the shore. The SWH in the bay was less than 2 m, which had the characteristics of surge. The SSC on the south bank is more sensitive to changes in wind speed, probably because the water depth is shallow and the resuspension ability of wind and waves is strong in this area.
(4) The residual current and wind stress during the typhoon strengthened the sediment transport capacity in Hangzhou Bay, indicating that the typhoon plays an important role in the seaward transport of suspended sediment and terrestrial pollutants.
The research results can provide a reference for typhoon disaster prevention and channel engineering management and construction in coastal waters.

Author Contributions

Conceptualization, Z.J., B.G., J.W. and Y.C.; methodology, Z.J.; software, Z.J.; validation, Z.J., B.G. and V.S.M.; formal analysis, Z.J.; investigation, Z.J.; resources, B.G.; data curation, Z.J.; writing—original draft preparation, Z.J.; writing—review and editing, B.G. and V.S.M.; visualization, Z.J.; supervision, B.G.; project administration, B.G.; funding acquisition, B.G. All authors have read and agreed to the published version of the manuscript.

Funding

This work was mainly supported by the open research fund program of State Key Laboratory of Hydroscience and Engineering, Tsinghua University (sklhse-2021-B-01); the National Natural Science Foundation of China (Grant No. 51979264 and 51479179); Consultation and Evaluation Program of the Department of Chinese Academy of Science (2020-ZW11-A-023); Zhejiang Provincial Virtual Simulation Experiment Projects (Virtual simulation experiment project of monitoring of suspended sediment in coastal waters using remote sensing).

Institutional Review Board Statement

Not applicable.

Informed Consent Statement

Not applicable.

Data Availability Statement

Not applicable.

Conflicts of Interest

The authors declare no conflict of interest.

References

  1. Byun, D.S.; Wang, X.H.; Zavatarelli, M.; Cho, Y.K. Effects of resuspended sediments and vertical mixing on phytoplankton spring bloom dynamics in a tidal estuarine embayment. J. Mar. Syst. 2007, 67, 102–118. [Google Scholar] [CrossRef]
  2. Doxaran, D.; Froidefond, J.M.; Castaing, P.; Babin, M. Dynamics of the turbidity maximum zone in a macrotidal estuary (the Gironde, France): Observations from field and MODIS satellite data. Estuar. Coast. Shelf Sci. 2009, 81, 321–332. [Google Scholar] [CrossRef]
  3. Mao, Z.; Chen, J.; Pan, D.; Tao, B.; Zhu, Q. A regional remote sensing algorithm for total suspended matter in the East China Sea. Remote Sens. Environ. 2012, 124, 819–831. [Google Scholar] [CrossRef]
  4. Chalov, S.; Prokopeva, K.; Habel, M. North to South Variations in the Suspended Sediment Transport Budget within Large Siberian River Deltas Revealed by Remote Sensing Data. Remote Sens. 2021, 13, 4549. [Google Scholar] [CrossRef]
  5. Chen, S.L.; Zhang, G.A.; Yang, S.L.; Yu, Z.Y. Temporal and spatial changes of suspended sediment concentration and resuspension in the Yangtze River estuary and its adjacent waters. Acta Geogr. Sin. 2004, 59, 260–266. [Google Scholar] [CrossRef]
  6. Zhu, Y.H. Spatiotemporal Dynamics and Driving Factors of Suspended Sediment Concentration in the Yellow River Eatuary and Its Adjacent Waters Based on GOCI Images. Master’s Thesis, East China Normal University, Shanghai, China, 2022. [Google Scholar]
  7. Yang, S.; Fan, J.; Shi, B.; Bouma, T.; Shi, F. Remote impacts of typhoons on the hydrodynamics, sediment transport and bed stability of an intertidal wetland in the Yangtze Delta. J. Hydrol. 2019, 575, 755–766. [Google Scholar] [CrossRef]
  8. Liu, H.; He, Q.; Wang, Z.; Weltje, G.; Zhang, J. Dynamics and spatial variability of near-bottom sediment exchange in the Yangtze Estuary, China. Estuar. Coast. Shelf Sci. 2010, 86, 322–330. [Google Scholar] [CrossRef]
  9. Thompson, C.; Kassem, H.; Williams, J. Nearshore sediment resuspension and bed morphology. J. Coast. Res. 2013, 65, 1593–1598. [Google Scholar] [CrossRef]
  10. Green, M.; Coco, G. Review of wave-driven sediment resuspension and transport in estuaries. Rev. Geophys. 2014, 52, 77–117. [Google Scholar] [CrossRef]
  11. Tang, R.; Shen, F.; Ge, J.Z.; Yang, S.L.; Gao, W.L. Investigating typhoon impact on SSC through hourly satellite and real-time field observations: A case study of the Yangtze Estuary. Cont. Shelf Res. 2021, 224, 104475. [Google Scholar] [CrossRef]
  12. Chau, P.M.; Wang, C.-K.; Huang, A.-T. The Spatial-Temporal Distribution of GOCI-Derived Suspended Sediment in Taiwan Coastal Water Induced by Typhoon Soudelor. Remote Sens. 2021, 13, 194. [Google Scholar] [CrossRef]
  13. Liu, Y.; Huang, J.; Xie, D. Impact of SSC distribution in Hangzhou Bay after 1307 typhoon through satellite images. Hydro-Sci. Eng. 2021, 6, 9–16. [Google Scholar] [CrossRef]
  14. Li, L.; Shen, F.; He, Z.; Yu, Z. Suspended sediment dynamics in macrotidal turbid Hangzhou Bay during Typhoon Chan-hom. Front. Earth Sci. 2022, 10, 932149. [Google Scholar] [CrossRef]
  15. Rankey, E.C.; Enos, P.; Steffen, K.; Druke, D. Lack of impact of hurricane Michelle on tidal flats, Andros Island, Bahamas: Integrated remote sensing and field observations. J. Sediment. Res. 2004, 74, 654–661. [Google Scholar] [CrossRef]
  16. Xie, W.M.; He, Q.; Zhang, K.Q.; Guo, L.C.; Wang, X.Y.; Shen, J.; Cui, Z. Application of terrestrial laser scanner on tidal flat morphology at a typhoon event timescale. Geomorphology 2017, 292, 47–58. [Google Scholar] [CrossRef]
  17. Li, P.; Yang, S.L.; Milliman, J.D.; Xu, K.H.; Qin, W.H.; Wu, C.S.; Chen, Y.P.; Shi, B.W. Spatial, temporal, and human-induced variations in suspended sediment concentration in the surface waters of the Yangtze Estuary and adjacent coastal areas. Estuaries Coasts 2012, 35, 1316–1327. [Google Scholar] [CrossRef]
  18. Ren, J.B. Wave Dynamics and Its Impact on Sediment Transport under Typhoons in the Changjiang Estuary. Ph.D. Thesis, East China Normal University, Shanghai, China, 2020. [Google Scholar]
  19. Hu, Y.; Yu, Z.; Zhou, B.; Li, Y.; Yin, S.; He, X.; Peng, X.; Shum, C.K. Tidal-driven variation of suspended sediment in Hangzhou Bay based on GOCI data. Int. J. Appl. Earth Obs. Geoinf. 2019, 82, 101920. [Google Scholar] [CrossRef]
  20. Li, Y.D.; Li, X.F. Remote sensing observations and numerical studies of a super typhoon-induced suspended sediment concentration variation in the East China Sea. Ocean Model. 2016, 104, 187–202. [Google Scholar] [CrossRef]
  21. Zhou, Y.; Xuan, J.; Huang, D. Tidal variation of total suspended solids over the Yangtze Bank based on the geostationary ocean color imager. Sci. China Earth Sci. 2020, 63, 1381–1389. [Google Scholar] [CrossRef]
  22. Su, J.; Wang, K. Changjiang River plume and suspended sediment transport in Hangzhou. Cont. Shelf Res. 1989, 9, 93–111. [Google Scholar] [CrossRef]
  23. Xie, D.; Wang, Z.; Gao, S.; De Vriend, H.J. Modeling the tidal channel morphodynamics in a macro-tidal embayment, Hangzhou Bay, China. Cont. Shelf Res. 2009, 29, 1757–1767. [Google Scholar] [CrossRef]
  24. Ding, P.X.; Hu, K.L.; Kong, Y.Z. Numerical simulation of storm induced erosion/ deposition in Changjiang estuary—A case study of typhoon Jelawat. J. Sediment Res. 2003, 6, 18–24. [Google Scholar] [CrossRef]
  25. Bian, C.W.; Jiang, W.S.; Song, D.H. Terrigenous transportation to the Okinawa Trough and the influence of typhoons on suspended sediment concentration. Cont. Shelf Res. 2010, 30, 1189–1199. [Google Scholar] [CrossRef]
  26. Achman, D.; Brownawell, B.; Zhang, L. Exchange of Polychlorinated Biphenyls between Sediment and Water in the Hudson River Estuary. Estuaries 1996, 19, 950–965. [Google Scholar] [CrossRef]
  27. Wang, H.B.; Yang, S.L.; Yang, H.F. A study of the surficial suspended sediment concertration in response to typhoons in the Yangtze Estuary. J. East China Norm. Univ. (Nat. Sci. Ed.) 2019, 2, 195–208. [Google Scholar]
  28. Lu, C.; Jia, X.; Han, Y.; Bai, Y. Numerical simulation of sudden silting in the Yangtze Estuary deepwater channel by the wave of typhoon. Adv. Water Sci. 2018, 29, 697–705. [Google Scholar]
  29. Christie, M.; Dyer, K.; Turner, P. Sediment Flux and Bed Level Measurements from a Macro Tidal Mudflat. Estuar. Coast. Shelf Sci. 1990, 49, 667–688. [Google Scholar] [CrossRef]
  30. Shen, Q.; Huang, W.; Qi, D. Integrated Modeling of Typhoon Damrey’s Effects on Sediment Resuspension and Transport in the North Passage of Changjiang Estuary, China. J. Waterw. Port Coast. Ocean. Eng. 2018, 144, 04018015. [Google Scholar] [CrossRef]
  31. Brand, A.; Lacy, J.; Hsu, K.; Hoover, D.; Gladding, S.; Stacey, M. Wind-enhanced resuspension in the shallow waters of South San Francisco Bay: Mechanisms and potential implications for cohesive sediment transport. J. Geophys. Res. 2010, 115, C11024. [Google Scholar] [CrossRef]
  32. Lawson, S.; Wiberg, P.; McGlathery, K.; Fugate, D. Wind-driven sediment suspension controls light availability in a shallow coastal lagoon. Estuaries Coasts 2007, 30, 102–112. [Google Scholar] [CrossRef]
  33. Miao, L.; Yang, S.; Zhu, Q. Variation of suspended sediment concentrations and transport in response to a storm and its dynamic mechanism—A study case of Nanhui tidal flat of the Yangtze River Delta. Haiyang Xuebao 2016, 38, 158–167. [Google Scholar]
  34. Zhang, M.C.; Guo, B.Y. Retrieval of Suspended Sediment Concentration in Zhoushan Coastal Area Satellite Based on GF-1. Ocean development and management. Ocean. Dev. Manag. 2018, 35, 126–131. [Google Scholar]
  35. Wang, K. Study on the Spatial-Temporal Features of Disastrous Marine Dynamic Process and Its Effects on Hazard-Bearing Body under the Influence of Typhoon. Ph.D. Thesis, University of Chinese Academy of Sciences, Beijing, China, 2020. [Google Scholar]
  36. Xu, S. Sediment Dynamical Processes in the South Passage of the Yangtze Estuary during the Typhoon Lan. Master’s Thesis, East China Normal University, Shanghai, China, 2020. [Google Scholar]
  37. Choi, J.K.; Park, Y.J.; Ahn, J.H.; Lim, H.S.; Eom, J.; Ryu, J.H. GOCI, the world’s first geostationary ocean color observation satellite, for the monitoring of temporal variability in coastal water turbidity. J. Geophys. Res. Oceans 2012, 117, 4357–4360. [Google Scholar] [CrossRef]
  38. Deng, S.B.; Chen, Q.J.; Du, H.J.; Xu, H. Image Processing Method in ENVI (Second Edition); Higher Education Press: Beijing, China, 2014; pp. 308–310. [Google Scholar]
  39. Jiang, B.B.; Zhang, X.Y.; Huang, D.S. Retrieving high concentration of suspended sediments based on GOCI: An example of coastal water around Hangzhou Bay, China. J. Zhejiang Univ. (Sci. Ed.) 2015, 42, 213–220. [Google Scholar]
  40. He, X.; Bai, Y.; Pan, D.; Huang, N.; Dong, X.; Chen, J. Using geostationary satellite ocean color data to map the diurnal dynamics of suspended particulate matter in coastal waters. Remote Sens. Environ. 2013, 133, 225–239. [Google Scholar] [CrossRef]
  41. He, X.; Bai, Y.; Pan, D.; Tang, J.; Wang, D. Atmospheric correction of satellite ocean color imagery using the ultraviolet wavelength for highly turbid waters. Opt. Express 2012, 20, 20754. [Google Scholar] [CrossRef]
  42. Robinson, I.S. Chapter 7 Tidally Induced Residual Flows. In Oceanography; Elsevier: Amsterdam, The Netherlands, 1983; pp. 321–356. [Google Scholar]
  43. Kurt, J.; George, L.; Marlene, A. Strongly-sheared wind-forced currents in the nearshore regions of the central Southern California Bight. Cont. Shelf Res. 2015, 106, 1–16. [Google Scholar] [CrossRef]
  44. Chen, Y.J.; Cheng, P. Characteristics and dynamics of tidal residual circulations in the eastern China seas. Mar. Sci. Bull. 2021, 40, 398. [Google Scholar]
  45. Zhao, B.R.; Fang, G.H.; Cao, D.M. Characteristics of tidal residual currents and their relations with coastal current transports in the Bohai Sea, Yellow Sea and East China Sea. Stud. Mar. Sin. 1995, 36, 1–11. [Google Scholar]
  46. Talley, L.D.; Pickard, G.L.; Emery, W.J.; Swift, J.H. Descriptive Physical Oceanography (Sixth Edition); Academic Press: London, UK, 2011; pp. 197–200. [Google Scholar]
  47. Cai, L.; Tang, D.; Li, X.; Zheng, H.; Shao, W. Remote sensing of spatial-temporal distribution of suspended sediment and analysis of related environmental factors in Hangzhou Bay, China. Remote Sens. Lett. 2015, 6, 597–603. [Google Scholar] [CrossRef]
  48. Zhao, G.B.; Bian, C.W.; Xu, J.P. A field study of shear stress and suspended sediment concentration in the bottom boundary layer under the influences of tidal currents and wind waves. Period. Ocean. Univ. China 2019, 49, 83–91. [Google Scholar]
  49. Du, Y.; Lin, H.; He, S.; Wang, D.; Wang, Y.P.; Zhang, J. Tide-Induced Variability and Mechanisms of Surface Suspended Sediment in the Zhoushan Archipelago along the Southeastern Coast of China Based on GOCI Data. Remote Sens. 2021, 13, 929. [Google Scholar] [CrossRef]
Figure 1. Study area and the distribution of observation stations: (a) The straight line with dots is the track of Typhoon Maria. The red dots on the straight line represent Typhoon, the pink dots represent Strong Tropical Storm, and the yellow dots represent Tropical Storm; (b) The red dot represents the Tide gauge station.
Atmosphere 14 00721 g001
Figure 2. The SSC distribution of the Hangzhou Bay at high tide during the period of Typhoon Maria in 2018. ((ad) show SSC on 8 July, 10 July, 12 July and 13 July, respectively).
Atmosphere 14 00721 g002
Figure 3. The SSC distribution of the Hangzhou Bay at flood tide (ebb tide) during the period of Typhoon Maria in 2018. ((ad) show SSC on 8 July, 10 July, 12 July and 13 July, respectively).
Atmosphere 14 00721 g003
Figure 4. The SSC distribution of the Hangzhou Bay at low tide during the period of Typhoon Maria in 2018. ((ad) show SSC on 8 July, 10 July, 12 July and 13 July, respectively).
Atmosphere 14 00721 g004
Figure 5. The distribution of profiles in Hangzhou Bay. (P1–4 are the four sections selected in the study. Among them, P1 is northwest-southeast, with a length of 20 km, and P2–4 are north-south, with a length of 60 km).
Atmosphere 14 00721 g005
Figure 6. SSC change of 4 profiles in Hangzhou Bay before and after Typhoon Maria. ((ad) represents Section 1, Section 2, Section 3 and Section 4. The black and red solid lines represent SSC variations during flood tide before (10 July) and after (12 July) typhoon transit, respectively, while the dotted line represents the average SSC of each section. The horizontal coordinate is the distance from north to south, and the vertical coordinate is the suspended sediment concentration (SSC); 10T08 represents 8:00 a.m. on 10 July, and 12T09 represents 9:00 a.m. on 12 July).
Atmosphere 14 00721 g006
Figure 7. The average SSC variation in Hangzhou Bay from 8 to 15 July 2018. (The horizontal coordinate is the time, and the orange, green and blue dots represent the SSC in high tide (HT), low tide(LT) and flood tide/ebb tide (FT/ET). Due to the cloud coverage, there was no data on 9 and 11 July. The time period is from 0:00 on 8 July to 23:00 on 15 July, expressed as 0–200 h. The dotted line is a statistical equation in which x represents time (hours) and y represents SSC (mg/L)).
Atmosphere 14 00721 g007
Figure 8. The variation of SSC with wind speed and significant wave height (SWH) in HZB during Maria’s transit. (The orange and green lines represent the wind speed and SWH, respectively. The blue dots, triangles, and diamonds represent the SSC on the south bank, north bank, and central part of Hangzhou Bay, respectively. The sampling areas of wind and SWH is from 122° E to 124° E longitude and 29.5° N to 31° N latitude).
Atmosphere 14 00721 g008
Figure 9. Distribution of the Observation stations of Hangzhou Bay. (The yellow boxes represent five observation points).
Atmosphere 14 00721 g009
Figure 10. The variations of significant wave height (SWH), wind field, and SSC at stations from 8 to 15 July 2018. ((ae) represent Stations 1–5. The red points represent the daily mean SSC at each station, the blue solid line represents SWH, and the black arrows represent wind vectors).
Atmosphere 14 00721 g010
Figure 11. The variation of SSC with daily mean accumulated precipitation in Hangzhou Bay. (The solid blue circle represents the daily mean accumulated precipitation, and the orange, green, and purple histograms represent the SSC in the south bank, north bank, and central sea area of Hangzhou Bay, respectively).
Atmosphere 14 00721 g011
Figure 12. The daily average sea surface current distribution in Hangzhou Bay. ((ad) respectively represent the surface current in HZB from 10 to 13 July 2018, where (b) is on the day of typhoon landing. The surface current velocity refers to the vertical average velocity from 5 m below the sea surface to the sea surface. The arrow is the current vector, and its direction represents the direction of the current. The length represents the current velocity, and the color map from white to red indicates that the current velocity increases.
Atmosphere 14 00721 g012
Figure 13. Daily sea surface current anomaly ( A i ) in Hangzhou Bay. ((ad) represent the daily sea surface current anomaly from 10 to 13 July 2018. The anomaly is based on the three-day mean current from 7 to 9 July before the typhoon. The arrow is the current vector, and its direction represents the direction of the current. The length represents the flow velocity).
Atmosphere 14 00721 g013
Figure 14. Distribution of wind stress in Hangzhou Bay before and after Typhoon Maria. ((ad) represent the daily mean wind stress from 10 to 13 July 2018, respectively; the color from white to red represents the wind stress from low to high; the arrow indicates its direction, and the length indicates its magnitude).
Atmosphere 14 00721 g014
Table 1. GOCI image time and tidal range.
TimeImage NameTidal Range/cm
8/7/2018
(3 days before typhoon)
8:00COMS_GOCI_L1B_GA_20180708001640356
11:00COMS_GOCI_L1B_GA_20180708031640
15:00COMS_GOCI_L1B_GA_20180708071640
10/7/2018
(1 day before typhoon)
8:00COMS_GOCI_L1B_GA_20180710001643450
10:00COMS_GOCI_L1B_GA_20180710021642
15:00COMS_GOCI_L1B_GA_20180710071642
12/7/2018
(1 day after typhoon)
8:00COMS_GOCI_L1B_GA_20180712001640535
9:00COMS_GOCI_L1B_GA_20180712011640
12:00COMS_GOCI_L1B_GA_20180712041640
13/7/2018
(2 days after typhoon)
8:00COMS_GOCI_L1B_GA_20180713001643630
11:00COMS_GOCI_L1B_GA_20180713031643
13:00COMS_GOCI_L1B_GA_20180713051643
Table 2. The locations and depths of Observation station.
StationLocationRegionDepth
S1 121.43 °   E ,   30.37 °   N South bank<7 m
S2 121.27 °   E ,   30.63 °   N North bank<14 m
S3 121.85 °   E ,   30.78 °   N North bank<8 m
S4 121.97 °   E ,   30.65 °   N Yangshan<9 m
S5 122.35 °   E ,   30.13 °   N Zhoushan<14m
Disclaimer/Publisher’s Note: The statements, opinions and data contained in all publications are solely those of the individual author(s) and contributor(s) and not of MDPI and/or the editor(s). MDPI and/or the editor(s) disclaim responsibility for any injury to people or property resulting from any ideas, methods, instructions or products referred to in the content.

