Article

Research on the Evaluation of Air Quality in Underground Coal Mines Based on a Generalized Contrastive Weighted Comprehensive Scale Index Method

1
Jiangsu Key Laboratory of Coal-Based Greenhouse Gas Control and Utilization, Carbon Neutrality Institute, China University of Mining and Technology, Xuzhou 221008, China
2
Jiangsu Engineering Research Center of Dust Control and Occupational Protection, School of Safety Engineering, China University of Mining and Technology, Xuzhou 221116, China
3
School of Environment and Spatial Informatics, China University of Mining and Technology, Xuzhou 221116, China
*
Author to whom correspondence should be addressed.
Atmosphere 2023, 14(6), 1021; https://doi.org/10.3390/atmos14061021
Submission received: 27 April 2023 / Revised: 9 June 2023 / Accepted: 12 June 2023 / Published: 14 June 2023

Abstract

:
In this study, an optimization model was established based on the generalized contrastive weighted comprehensive scale index method. This model gives the evaluation indicators of SO2, NOx, CO, and TSP. It also innovatively introduces gas, the most harmful substance in underground coal mines, into the evaluation indicators. Moreover, the obvious hazardous concentration limit is used as the third standard concentration of the model. The scale sub-indices and the weights of SO2, NOx, CO, TSP, and gas are calculated, leading to the comprehensive scale index. Finally, the classification standard of the underground air quality is determined. An underground excavation face in Shaanxi Province is used as an example for air quality assessment. The air quality is generally poor at the points close to the working face, while that at the points far away from the working face is generally better. Furthermore, air quality optimization measures are given for areas with poor air quality.

Graphical Abstract

1. Introduction

Coal accounts for a large proportion of the primary energy production and consumption structure, with an important role in driving economic development [1,2]. In recent years, coal mine accidents have declined, but many coal mines are still plagued by gas, dust, and toxic and harmful substances. With the deepening of coal mine mechanization, mining scale, and mining depth in China, the amount of dust produced during the operation has increased dramatically. In addition, the increased dumping of gas and toxic and harmful gases in the coal seam has led to a harsh environment for underground coal mine operations. In order to create a favorable working environment for underground mining, there is an urgent need to accurately evaluate the air quality in underground coal mines.
Gas is a common substance in coal mines. Its main component is CH4, which usually accounts for more than 90%, followed by ethane and carbon dioxide. In different coal seams or mines, the composition and content of gas vary, with significant differences in some cases [3]. During the coal mining process, the broken coal releases gas, increasing the gas concentration in the coal mine. The gas concentration is expected to increase continuously as the depth of coal mining increases [4,5,6]. The increase in gas concentration can dilute the O2 concentration. When the concentration exceeds 40%, death can occur due to hypoxia and suffocation. Therefore, it is necessary to introduce gas into the evaluation model of underground air quality in coal mines.
The dust produced during coal mining seriously affects the underground air quality and the safety of coal production. At present, the development of coal mine dust prevention and control and occupational safety and health in China is still in its infancy, and it is difficult to adapt the current technology and equipment to the complex and changeable working conditions of coal mines [7,8,9]. The high dust concentration in coal mines increases the probability of workers suffering from pneumoconiosis and reduces the service life of equipment in coal mines [10,11,12]. Therefore, dust concentration is an important indicator for the evaluation of air quality in coal mines. In addition, the underground air of coal mines contains a large amount of toxic and harmful gases (such as CO, H2S, SO2, NO, NO2) during the coal mining process. These toxic and harmful gases threaten the health of underground workers and are the main evaluation indicators in most air quality evaluations [13,14,15,16].
SO2, NOx, CO, TSP (total suspended particulates), and gas jointly affect the air quality in coal mines. In addition to strengthening mine ventilation and diluting harmful gases and fumes, it is necessary to monitor toxic and harmful substances in real time and evaluate air quality, thus ensuring that the air quality under the coal mine meets the safety requirements. At present, there are many evaluation methods for ambient air quality, such as matter-element analysis, fuzzy comprehensive evaluation, the analytic hierarchy process, the pollution loss rate method, and the gray system theory method [17,18]. Compared with the atmosphere, the underground air in coal mines has special characteristics, with a higher concentration of gas and combustibles. However, most scholars tend to ignore the evaluation of air quality in underground coal mines by only evaluating and predicting atmospheric air quality. For example, Chen et al. [19] evaluated the ambient air quality of a site based on the matter-element analysis method. The feasibility and rationality of this method in air quality evaluation were confirmed. Lv et al. [20] evaluated the air quality in the Beijing–Tianjin–Hebei region using the fuzzy comprehensive evaluation method and established a comprehensive rating factor set. Based on the ambient air quality standard, they supplemented the ambient air quality standard evaluation set, obtained the air quality evaluation level, and listed the most important pollution factors for each city. Li et al. [21] used the evaluation factor as the criterion layer based on the AHP and added the observation station as the sub-criteria layer for the first time. A hierarchical structure model was constructed to assess the air quality in Shandong Province for 12 months. Based on gray theory, Meng et al. [22] used the gray clustering method, gray relational degree method, and gray situation decision-making method to evaluate the air quality of Jiamusi City, Heilongjiang Province. However, the evaluation results for the same sample were significantly different. After improving the weighting method and air quality classification principle, the final results were more consistent and had higher discrimination.
Compared with the evaluations of atmospheric air quality, fewer evaluations have been conducted on the air quality in underground mining areas. Only a few scholars have applied these methods to evaluate the air quality in underground mines, while a few of them evaluate the air quality in coal mines. The evaluation of underground air quality is primarily to ensure that the concentrations of harmful gas and dust do not exceed their maximum allowable concentrations. For example, Liu et al. [23] used the matter-element theory to establish a matter-element model to evaluate the underground air quality in metal mines. The classic domain matrix, node domain matrix, and weights were determined, and the evaluation levels were finally obtained, providing a new method for underground air quality evaluation. Despite the simplicity and standardization of this method, it often leads to low discrimination of multiple influencing factors. Yang et al. [24] established the factor set, comment set, evaluation matrix of each factor, and the weight of each layer using the fuzzy comprehensive evaluation method from the four aspects of water environment, atmospheric environment, ecological environment, and geological disasters. These results were applied to the environmental assessment of the western mines. However, the fuzzy comprehensive evaluation method has many influencing factors, and the relationship between each factor and the safety level is relatively vague. Shi et al. [18] used the pollution loss rate method and the principle of the exponential relationship between pollutants’ concentrations and their effects on air quality to evaluate the air quality in metal mines. This method is simple and intuitive, but the synergistic effect between evaluation indicators is neglected. Du et al. [25] established a comprehensive evaluation model of the coal mine environment based on generalized linear theory and the fuzzy analytic hierarchy process. The importance of each index factor was obtained by analyzing air, water, soil, and ecological compensation indicators using generalized linear theory. Afterward, the logarithmic fuzzy preference programming method was used to construct a comparison matrix to obtain weight values. The results also showed that this model overcomes the shortcomings of manual weighting. Although this method can effectively reveal the relationship between various factors, it is not convincing because of the low quantitative data and high qualitative components. Jiao [26] developed an evaluation model for the environmental quality of mining areas using gray cluster analysis. A triangular whitening weight function was constructed to calculate the gray membership degree of measured values, and the degree of different pollution factors was obtained through the threshold inverse method. Then, the sampled data were evaluated by gray clustering. Finally, the evaluation results were consistent with the actual survey results. Despite the convenience and practicality of the gray theory model, its theoretical system is not perfect and its scope of application is small. Ye et al. [27] used the generalized contrastive weighted comprehensive scale index method to evaluate the underground air quality of uranium mines. However, due to the long time interval, the reference standard became invalid for a long time. It is no longer applicable to the current evaluation of mine air quality.
The evaluation methods above only consider the impact of harmful gases on air quality. In addition, gas cannot be ignored in evaluating underground air quality in coal mines. Gas is a common toxic and harmful substance in underground mines, which always affects the air quality in coal mines. In order to avoid the shortcomings of the above methods, a relatively comprehensive evaluation method is needed to evaluate the air quality of underground coal mines.
In this study, gas was determined as an evaluation indicator for underground air quality in coal mines. Based on the generalized contrastive weighted comprehensive scale index method, an optimization model for evaluating the air quality of coal mine was established. In this model, the weight value is obtained using the generalized contrast weighted method, and then the comprehensive scale index is derived. Finally, the air quality classification standard for coal mines is identified. The air quality evaluation was carried out on a coal mine underground tunneling working face in Shaanxi, and the validity and generality of the model were confirmed.

2. Evaluation Model of the Generalized Contrastive Weighted Comprehensive Scale Index

To date, various comprehensive index equations expressing environmental quality have been proposed. These calculation equations have their specific characteristics. Their purpose is to reflect the degree of environmental pollution resulting from the comprehensive action of various pollutants. Accordingly, appropriate methods are adopted to synthesize the sub-indices of pollutants.
Based on the Weber-Fisher Law, the principle of equal ratio assignment of harmful atmospheric concentrations and equal difference classification of hazard degrees is proposed. The harm level of the I-th pollutant is usually expressed as a sub-index:
Δ Ii = Δ Cix/Sij
where Cix is the measured concentration of the i-th pollutant; and Sij is the j-th standard concentration limit for the i-th pollutant. From the above equation, it can be concluded that a change in sub-index Δ Ii and concentration changes Δ Cix exhibit a linear relationship. Research has pointed out that within the range of the background concentration limit Ci0 to the obvious hazard concentration limit Cid, when the concentration of pollutants changes proportionally, the subjective differential response of people to the stimulation of pollutants changes equivalently, and this differential change should be used as the basis for the change in the degree of harm caused by pollutants.
Then, the evaluation model of the generalized contrastive weighted comprehensive scale index is proposed based on the principle. This method quantifies the damage of a single harmful substance through the scale sub-index. Then, the factor weighting method of the generalized contrast algorithm is used to calculate the scale sub-index, and the generalized contrastive weighted comprehensive scale index of air quality is derived. In recent years, such methods have been gradually popularized and applied in air quality assessment.
The generalized contrastive weighted comprehensive scaling index model is characterized by the fact that the pollutant concentration changes proportionally and the degree of harm to the environment changes equivalently, which is scientific and reasonable. When using the generalized contrastive weighted method to determine the weight, the influence of the scaling index on the weight (including enhancement and weakening) can be adjusted by selecting different adjustable parameters p, making it reasonable and flexible. The scale sub-index equation and the generalized contrastive weighted calculation equation are simple and standardized, with the evaluation method being comparable and universal. Therefore, this paper applies the model to the air quality evaluation of coal mines based on the introduction of gas.

2.1. Determination of Evaluation Indicators

The air in coal mines contains a large number of toxic and harmful substances such as NOx, SO2, CO, TSP, and gas. NOx, especially NO2, is highly toxic and causes strong irritation to human eyes and respiratory organs. It mainly comes from blasting operations and fuel equipment operations. SO2 has a strong smell. Its contact with respiratory organs and moist skin produces sulfuric acid, which irritates and paralyzes respiratory organs, causing lung and bronchial inflammation. It mainly comes from the oxidation of sulfur-containing coal, spontaneous combustion of coal, and blasting of sulfur-containing coal seams. CO is colorless, odorless, and highly toxic. When the CO content reaches 0.4%, it causes death in a short period of time. When it is 13–75%, an explosion can occur in the case of fire. It mainly comes from natural coal oxidation, blasting operations, and fuel oil equipment operations. It is mostly present in the middle and upper parts of the roadway [28,29,30]. TSP stands for total suspended particles. Particles smaller than 100 μm can enter the lungs, damaging alveoli and mucous membranes, and causing diseases such as pulmonary heart disease. It mainly comes from underground mining operations, transport reloading, and ventilation dust. Gas is colorless, odorless, non-toxic, and flammable. When the gas concentration reaches 5–16%, an explosion may occur when the gas is exposed to an open flame. When the gas concentration in coal mines rises, the oxygen concentration decreases, leading to suffocation of workers. The gas is mainly released from coal and rock. Based on the above analysis, SO2, NOx, CO, TSP, and gas are introduced into the model as evaluation indicators.

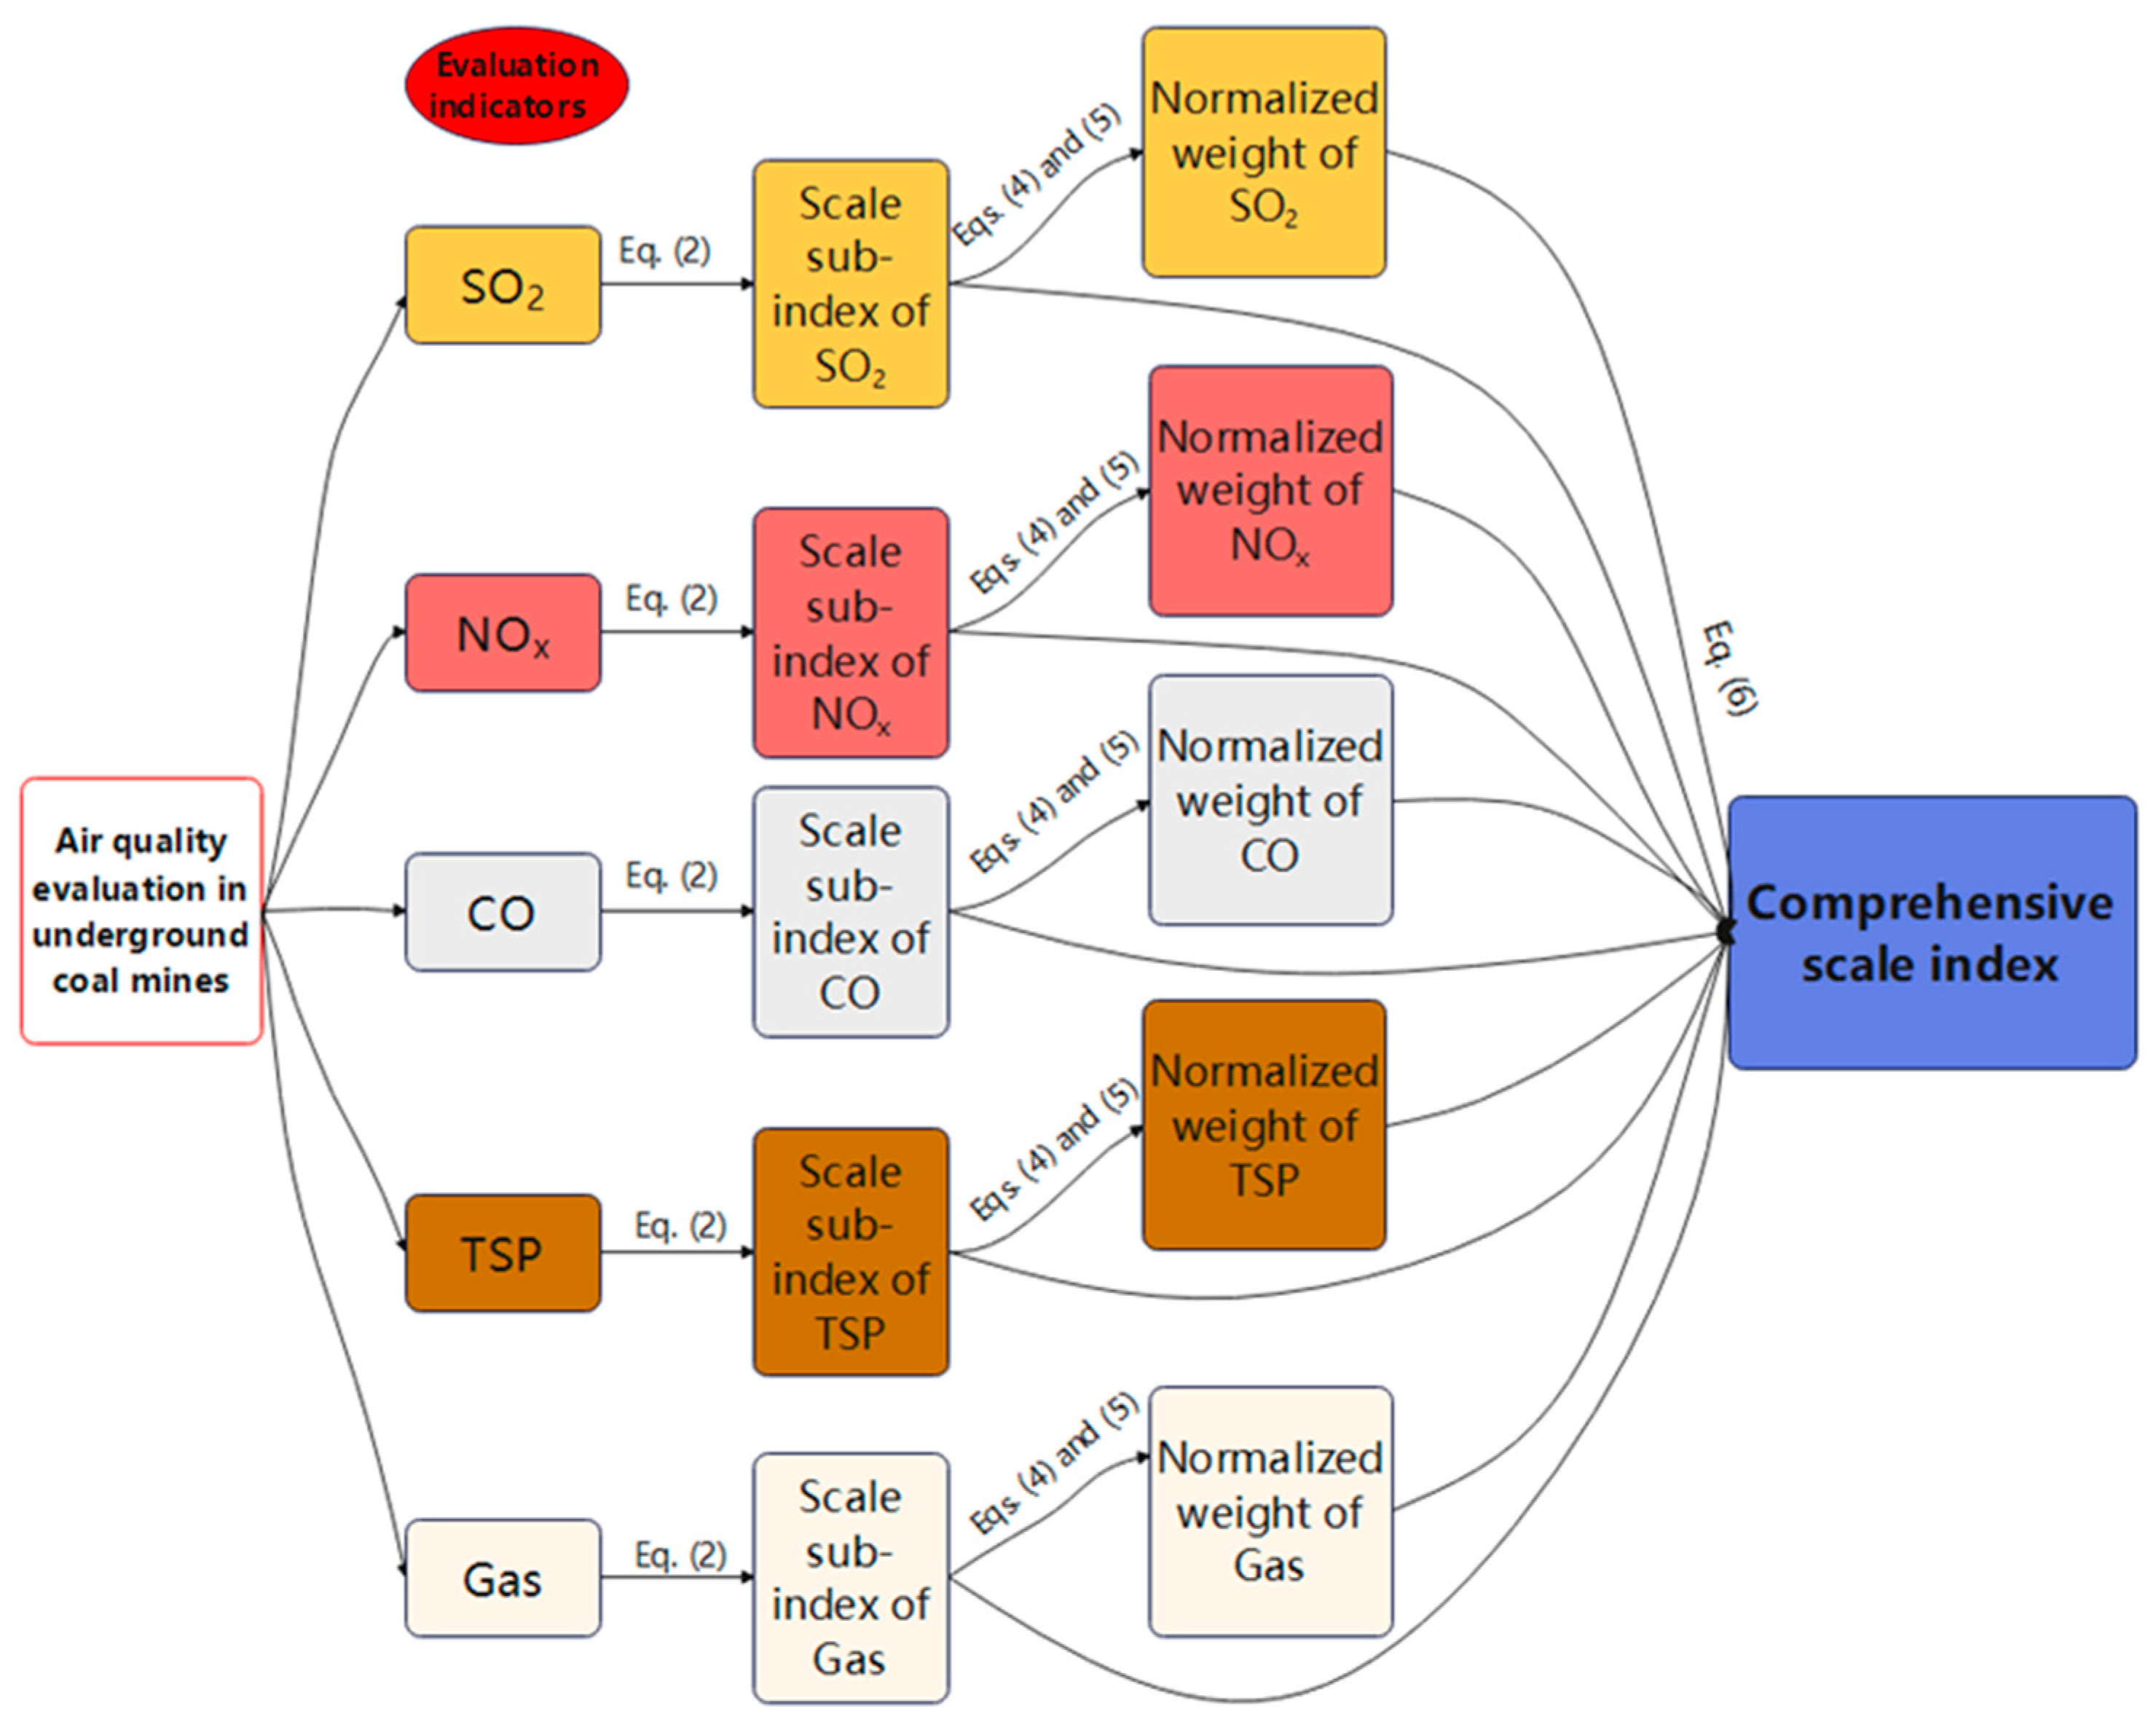
2.2. Establishment of Evaluation Model

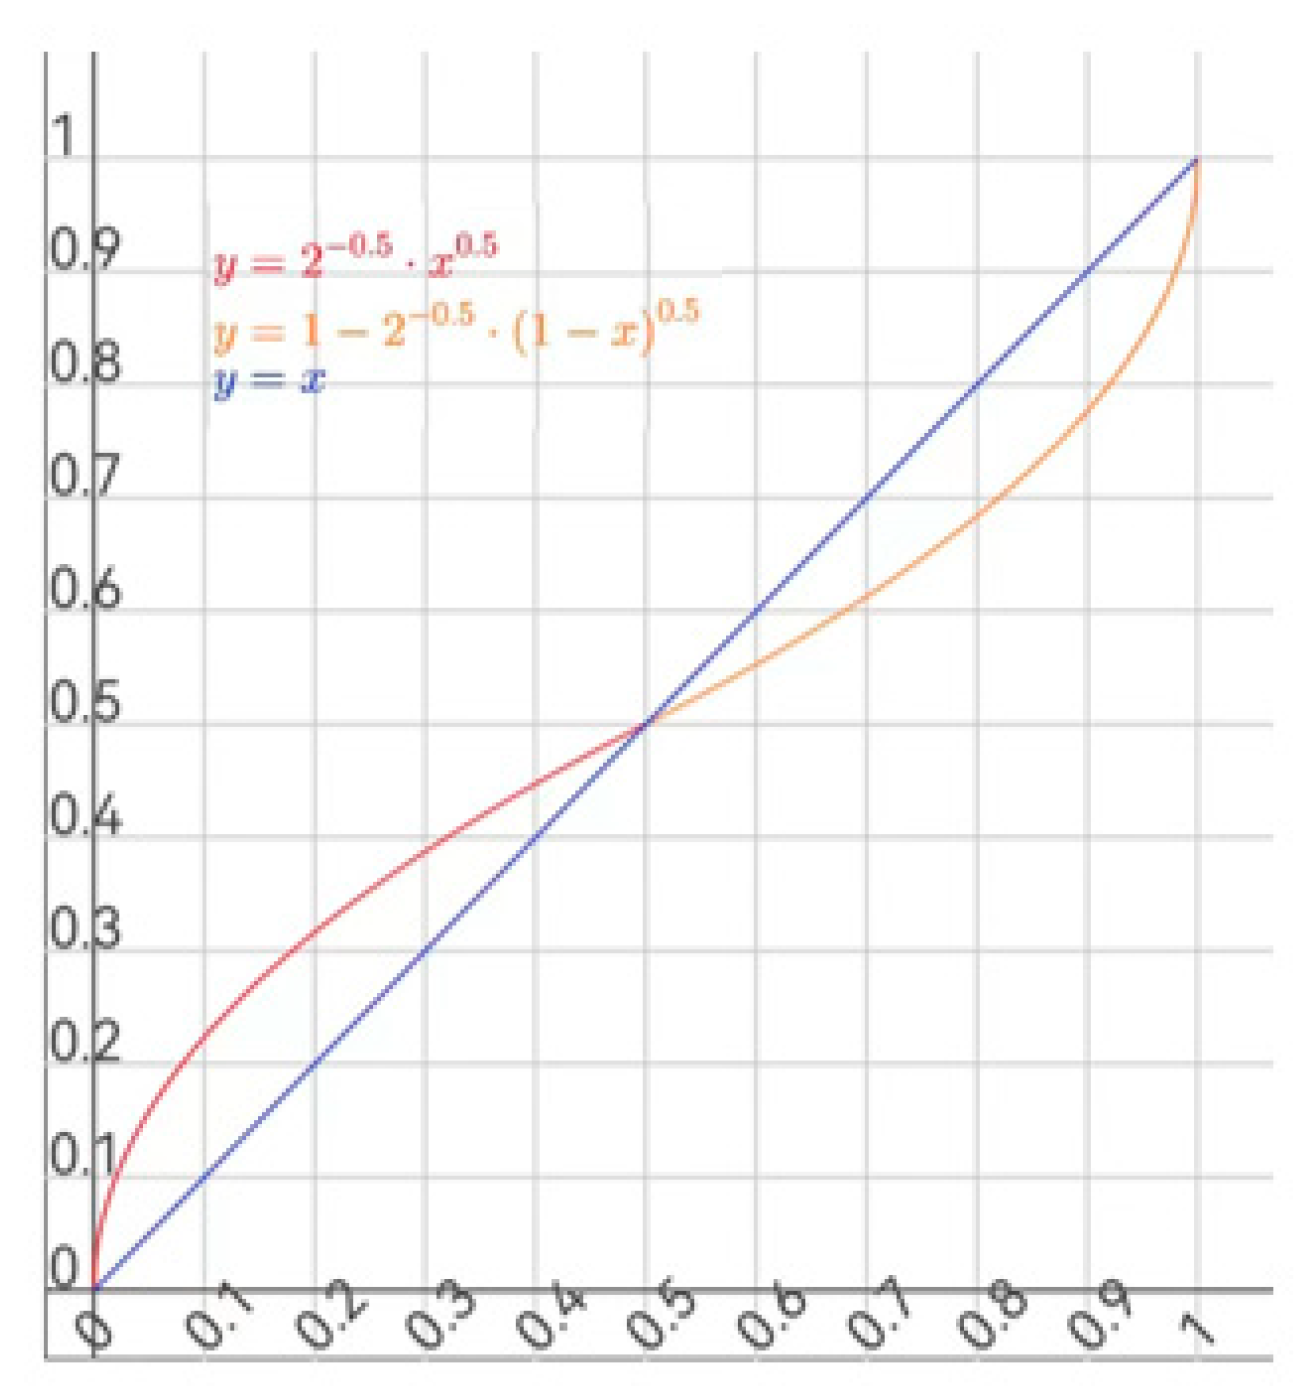
2.2.1. Calculation of Scale Sub-Index

The main measure of environmental quality is the degree of harm caused by air pollutants. The change in the concentration of harmful substances in coal mines is equally proportional, and the change in harm degree is equally variable. The index reflecting this change is defined as the scale sub-index. It is represented by Kj and calculated as follows [31]:
K j = lg ( C j k / C j 0 ) lg a j
where Cjk is the measured concentration value of harmful substance j; Cj0 is the background concentration value of harmful substance j; and aj is the importance ratio of two adjacent levels of harmful substance j, aj = (Cjd/Cj0)1/9, where Cjd is the obvious hazardous concentration of harmful substance j.
The corresponding results in Equation (2) are normalized, and the equation for the normalized scale sub-index Ij is obtained [31]:
I j = 1 9 K j = lg C j k lg C j 0 lg C j d lg C j 0
According to the “Ambient Air Quality Standard” [32] and the “Coal Mine Safety Regulations” [33], and the background concentration limits (Cj0) and obvious hazardous concentration limits (Cjd) of several pollutants adopted by the environmental protection department, the first-level and second-level concentration standards of this model correspond to the standards in the “Ambient Air Quality Standard”. Moreover, the obvious hazardous concentration limit is used as the third-level concentration limit for this model. Table 1 lists the background concentration limits (Cj0), obvious hazard limits (Cjd), and primary and secondary standard concentration limits (Cj1 and Cj2, respectively) of each evaluation indicator. Table 2 shows the normalized scale sub-index Ijk under the corresponding level obtained from Table 1 and Equation (3).

2.2.2. Calculation of Generalized Contrastive Weighted Value

Factor weighting is based on the principle that a larger scale sub-index of the factor results in a larger weight. However, it is not a simple linear relationship. As Figure 1 shows, the weight change of the smaller scale sub-index should be greater than the linear change, while the weight change of the larger scale sub-index should be less than the linear change. On this basis, the importance of the smaller scale sub-index in the evaluation should be appropriately increased, while the importance of the larger scale sub-index should be appropriately suppressed. Therefore, when the scale sub-index of a factor is 0.5, its weight does not change. When the scale sub-index is greater than 0.5, and especially when it is close to 1, its weight should be properly suppressed. In addition, when the scale sub-index is smaller than 0.5, and especially when it is close to 0, its weight should be properly strengthened. The rate at which the weight changes with the sub-index can be controlled by changing the value of the adjustable parameter p.
Finally, the calculation equation of the generalized contrast weight Wj′ is [31]:
W j = {   2 p 1 I j p ,                                                           0 I j 0.5   1 2 p 1 1 I j p ,                               0.5 I j 1
where p is an adjustable parameter that controls the speed of weight change, and its value range is 0 ≤ p ≤ 1.
Generally, the value of p is 1/2. Considering that the sub-index calculated by Equation (2) may be less than 0 and greater than 1, Equation (4) is extended to obtain the final calculation in Equation (5) [31]:
W j = { ( I j 2 ) 1 / 2   ,                                               I j 0 ( I j 2 ) 1 / 2                                     0 I j 0.5 1 1 I j 2 1 / 2 ,                       0.5 I j 1 1 + I j 1 2 1 / 2 ,                                             I j 1

2.2.3. Calculation of Generalized Contrastive Weighted Comprehensive Scale Index

The weight Wj is normalized to obtain W j * :
W j * = W j W 1 + W 2 + W 3 + W 4 + W 5
On the basis, the equation for calculating the generalized contrastive weighted comprehensive scale index (I) of the air quality in underground coal mines is obtained:
I = W j * I j
where W j * is the normalized generalized contrastive weighted value.
The frame diagram of this optimization model is shown in Figure 2.

2.2.4. Classification of Underground Air Quality in Coal Mines

According to Equations (3) and (5)–(7), the generalized contrastive weighted comprehensive scale index I at all levels is obtained based on the standard values of each substance specified in the Ambient Air Quality Standard. Then, the correspondence between the grading evaluation standard of hazardous substances and its comprehensive scale index is obtained: grade I, I ∈ (0, 0.490); grade II, II ∈ (0.490, 0.668); grade III, III ∈ (0.668, 1); grade IV, IV ∈ (1, +∞). Table 3 shows the classification and evaluation standard of underground air quality in coal mines.
Grade I refers to the coal mine underground with excellent air quality and safety. Under this grade, the coal mine can be maintained and workers can continue to work. Grade II refers to coal mines with good air quality and a relatively safe state. Under this grade, workers need to take precautions, wear individual protective masks, and turn on the spray to reduce dust. Grade III refers to poor air quality in underground coal mines, which is slightly dangerous. Under this grade, the cause must be identified, and strengthening measures such as additional dust collectors and increased ventilation must be adopted to improve the air quality in underground coal mines. Grade IV refers to poor air quality in the underground coal mine, which is in a serious state of danger. Under this grade, the environment can cause significant harm to the operators. Warnings should be issued to underground operators immediately. Moreover, compulsory measures such as shortening operating time, evacuating areas with excessive hazardous substances, overhauling underground ventilation measures, and using harmful substance elimination technologies should be taken to improve the air quality in coal mines [28].
To evaluate the air quality in underground coal mines, the concentration values of the evaluation indicators at each monitoring point should be first measured. Afterward, the comprehensive scale index is derived according to Equations (3) and (5)–(7), and then the evaluation grade is obtained. Finally, a series of disposal measures can be taken regarding the evaluation grade to improve the air quality of underground coal mines.

3. Evaluation Example

The evaluation model introduced above was used to evaluate and analyze the air quality of an underground roadway in a coal mine in Shaanxi Province.

3.1. Basic Situation of the Underground Roadway

This coal mine has a shallow buried underground roadway coal seam and good storage conditions. The coal seam is thick and hard, with good surrounding rock conditions at the top and bottom plates. The geological structure is simple and has good mining conditions. The immediate roof is fine-grained sandstone with a thickness of 3.2–3.5 m, and the pseudo-roof is 0.5 m thick siltstone. The old roof consists of siltstone-sandpaper mudstone with a thickness of 21.1–28.2 m. The immediate bottom is sandy mudstone with a thickness of 1.3 m–2.76 m. The old bottom comprises sandy mudstone-siltstone-fine sandstone, with a thickness of 10.04–13.6 m. The roadway is 690 m long, 5.1 m wide, and 3.95 m high. Two local fans are installed in the roadway. The power of each fan is 2 × 45 kW. The air supply volume is 850–400 m3/min. The wind pressure is 800–7000 Pa, and the roadway head-on air volume is 700 m3/min.
As the level of fully mechanized mining equipment increases in size and intelligence, underground environmental pollution keeps intensifying, seriously threatening the occupational health of miners. Therefore, there is an urgent need to monitor and improve underground air quality.

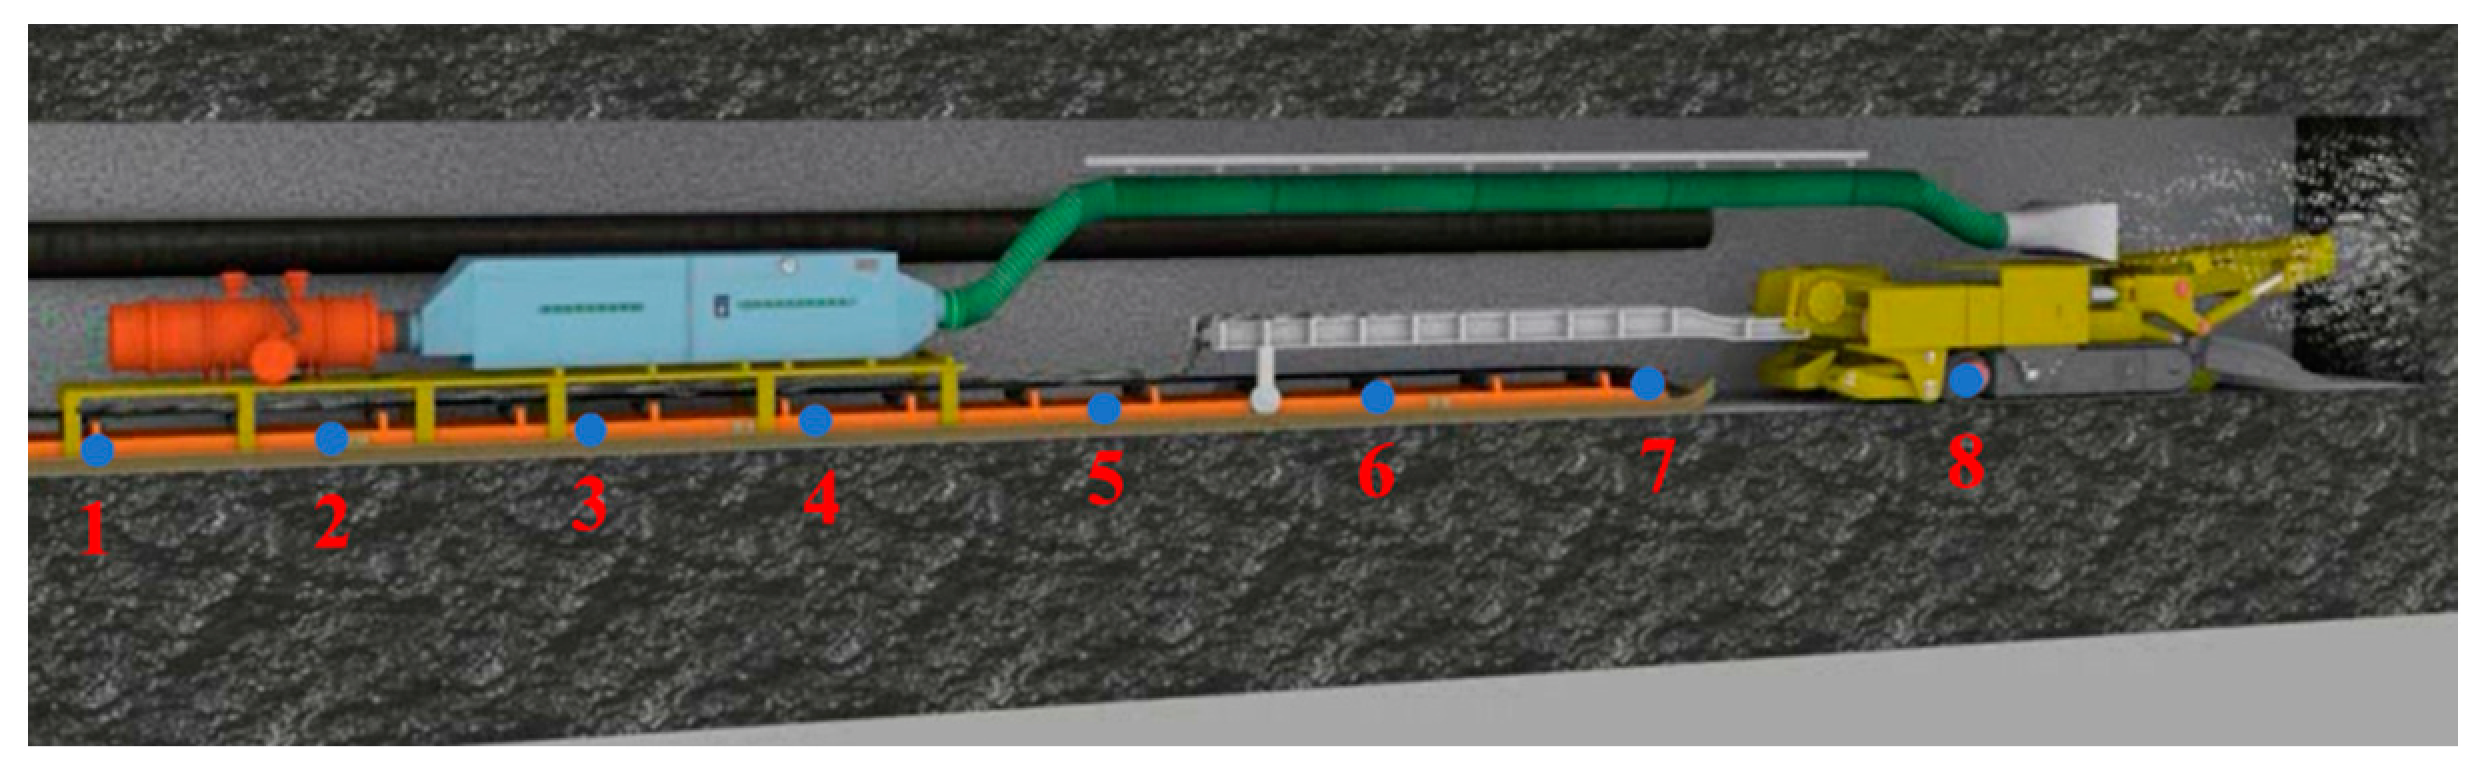
3.2. Layout Method and Sampling Equipment

Since gas and toxic and harmful substances are flammable and the concentration is high at the head of the excavation face, a monitoring point is set every 6 m at the front end of the roadway, and a total of eight monitoring points are set up. The layout points are shown in Figure 3. A portable harmful gas detector and a portable optical gas detector are used to monitor the concentration of harmful gases. The toxic and harmful gas detector is a pump suction type. Its operating principle is to pump the gas into the detection probe and obtain a concentration reading after processing. The TSP concentration is obtained by the filter membrane weighing method. The working principle is to pump the air through the filter membrane to block the dust particles on the filter membrane. After drying, the weight of the filter membrane before and after sampling is measured on an electronic balance, and the monitoring value is calculated according to the weight difference method.

3.3. Results and Discussion

Table 4 shows the measured concentration values, comprehensive scale index I and evaluation grade of each harmful substance in the eight monitoring points of the coal mine. Table 5 is the normalized scale sub-index of each harmful substance at the monitoring point obtained through Equation (3). The normalized weights calculated by Equations (5) and (6) are listed in Table 6.
From the results in Table 4 and Table 5, it can be concluded that the air quality of monitoring points 1, 2, and 3 are Grade I (safe), and workers can continue to work normally. The air quality of monitoring points 4 and 5 are grade II (relatively safe), and operators should take extra care and precautions. The air quality at monitoring point 6 is grade III (slightly dangerous), and thus the cause should be identified. Protective measures should be taken, and ventilation should be strengthened. The air quality of monitoring points 7 and 8 are grade IV (seriously dangerous). An early warning should be issued to the underground workers and the working hours should be reduced. If necessary, workers should be evacuated from the area where harmful substances exceed the limit, and the power supply should be disconnected. Then, a report should be produced following the prescribed procedures, and work can continue after the problem is solved. If left untreated, the occupational health of coal mine workers can be endangered, causing human and property losses.
It can be concluded from Table 4 that, as the monitoring point is closer to the front of the excavation face, the gas concentration, TSP concentration, and toxic and harmful gas concentration are higher. In particular, the gas and TSP concentrations at monitoring points 7 and 8 rise sharply, with a corresponding increase in their respective scale sub-indices. After being weighted by generalized contrast, their weights are properly highlighted compared with the weights of other indicators. It can also be seen in Table 4 that the air quality of monitoring points 7 and 8 is very poor compared with other monitoring points. The reason for this might be that an increasing number of large-scale machines and equipment are used in underground coal mine operations. When coal is broken, a large amount of dust is generated, and toxic and harmful substances such as gas, SO2, NOx, and CO are released. Furthermore, due to the complex ventilation management, the toxic and harmful substances such as gas cannot be diluted in time, causing the accumulation of these substances to exceed the limit. The substances released by coal crushing and dust formed by coal crushing diffuse inside the roadway and spread to the rear under air flow, resulting in serious air pollution at monitoring points 7 and 8 near the working face, threatening the health of workers. The results indicate that with closer proximity to the excavation face, the air quality becomes worse. The evaluation results are basically consistent with the actual situation.
In this model, when one of the indicators has a higher scale sub-index, the impact on the air quality grade will be appropriately highlighted. When the scale sub-indexes of all indicators increase, interactions and synergies among various pollutants occur, exerting a significant impact on the air quality grade.
In this study, a generalized contrastive weighted comprehensive scale index evaluation model was constructed to monitor and evaluate various indicators in coal mines. First, it can measure the air quality in coal mines. Second, it can reflect the governance situation after implementing action, and quickly and accurately control the factors that lead to environmental deterioration. The measurement results can provide a reference for the design of the underground coal mine ventilation system and air quality evaluation.

4. Conclusions

In order to avoid the deficiencies of previous coal mine underground air quality evaluation models, this paper uses gas as one of the evaluation indicators based on the generalized contrastive weighted comprehensive scale index method. A generalized contrastive weighted comprehensive scale index evaluation optimization model for underground air quality in coal mines was established. This model uses the obvious harmful concentration as the third standard concentration, making the air quality evaluation grade more reasonable. The obtained comprehensive scale index can fully reflect the environmental impact of the coexistence of multiple pollutants, emphasizing the interaction and synergistic effect of each pollutant. Moreover, the inclusion of gas as one of the evaluation indicators also makes the optimization model more comprehensive and consistent with the actual situation of coal mines. The model also has horizontal and vertical comparability, which is not limited by the type and number of pollutants.
The optimization model was used to evaluate the air quality of a coal mine in Shaanxi Province. The field test was performed on eight monitoring points at the coal mine excavation working face to obtain the air quality grade at each point. The results show that the air quality of the monitoring points close to the working face is poor, while that of the monitoring points far away from the working face is good. Based on the measurement results, air quality optimization measures are given for the areas with poor air quality. These results are also in line with the actual situation. This study is of great significance for improving the air quality in underground coal mines.

Author Contributions

Conceptualization, S.L.; experiment, J.H., M.H. and B.G.; formal analysis, X.C., G.P. and Q.G.; data curation, X.C. and G.P.; writing—original draft preparation, X.C.; writing—review and editing, S.L.; funding acquisition, S.L. All authors have read and agreed to the published version of the manuscript.

Funding

This research was funded by the National Natural Science Foundation of China, grant number 52174215, the Natural Science Foundation of Jiangsu Province, grant number BK20200642, the Fundamental Research Funds for the Central Universities, grant number 2022YCPY0203, and the Priority Academic Program Development of Jiangsu Higher Education Institutions.

Institutional Review Board Statement

Not applicable.

Informed Consent Statement

Not applicable.

Data Availability Statement

Not applicable.

Conflicts of Interest

The authors declare no conflict of interest.

References

  1. Zhong, C.; Dong, F.; Geng, Y.; Dong, Q. Toward carbon neutrality: The transition of the coal industrial chain in China. Front. Environ. Sci. 2022, 10, 1448. [Google Scholar] [CrossRef]
  2. Jia, Z.; Wen, S.; Sun, Z. Current relationship between coal consumption and the economic development and China’s future carbon mitigation policies. Energy Policy 2022, 162, 112812. [Google Scholar] [CrossRef]
  3. Fu, X.; Liu, A.; Wang, K.; Shen, J. Prevention and origin of exceptional deleterious gas compositions in coal mine. Procedia Eng. 2011, 26, 424–430. [Google Scholar]
  4. Zhou, A.; Zhang, M.; Wang, K.; Elsworth, D.; Wang, J.; Fan, L. Airflow disturbance induced by coal mine outburst shock waves: A case study of a gas outburst disaster in China. Int. J. Rock Mech. Min. Sci. 2020, 128, 104262. [Google Scholar] [CrossRef]
  5. Shu, L.; Liu, Z.; Wang, K.; Zhu, N.; Yang, J. Characteristics and classification of microseismic signals in heading face of coal mine: Implication for coal and gas outburst warning. Rock Mech. Rock Eng. 2022, 55, 6905–6919. [Google Scholar] [CrossRef]
  6. Yuan, L. Control of coal and gas outbursts in Huainan mines in China: A review. J. Rock Mech. Geotech. Eng. 2016, 8, 559–567. [Google Scholar] [CrossRef] [Green Version]
  7. Zhang, H.; Liu, R.; Chun, J.; Xue, Q.; Fan, J. Study on optimization of the dedusting air duct layout in coal mine roadway. Front. Earth Sci. 2022, 10, 855438. [Google Scholar] [CrossRef]
  8. Zhang, H.; Han, W.; Xu, Y.; Wang, Z. Analysis on the development status of coal mine dust disaster prevention technology in China. J. Healthc. Eng. 2021, 2021, 5574579. [Google Scholar] [CrossRef]
  9. Wei, Y.; Li, J.; Wang, J. Respirable dust detection and optimization of dust prevention measures in fully mechanized face of coal mine. IOP Conf. Ser. Earth Environ. Sci. 2019, 330, 032012. [Google Scholar] [CrossRef]
  10. Yao, Y.; Wei, T.; Zhang, H.; Xie, Y.; Gu, P.; Yao, Y.; Xiong, X.; Peng, Z.; Zhen, Z.; Liu, S.; et al. Characteristics of diagnosed and death cases of pneumoconiosis in Hubei Province, China, 1949–2019. Int. J. Environ. Res. Public Health 2022, 19, 15799. [Google Scholar] [CrossRef]
  11. Kang, W.; Yang, Y. Discussion on coal mine dust prevention and control technology. In Proceedings of the International Symposium on Rock Mechanics and Mine Dynamic Disaster Prevention, Fuxin, China, 13–14 July 2013; pp. 94–97. [Google Scholar]
  12. Ji, M.; Sun, Z.; Guo, H. The application of the foam technology to the dust control for reducing the dust injury of coal mines. Appl. Sci. 2022, 12, 10878. [Google Scholar] [CrossRef]
  13. Thakur, P. Origin of gases in coal mines. In Advanced Mine Ventilation; Woodhead Publishing: Sawston, UK, 2019; pp. 213–226. [Google Scholar]
  14. Banasiewicz, A.; Janicka, A.; Michalak, A.; Włostowski, R. Photocatalysis as a method for reduction of ambient NOx in deep underground mines. Measurement 2022, 200, 111453. [Google Scholar] [CrossRef]
  15. Kurnia, J.; Sasmito, A.; Wong, W.; Mujumdar, A.S. Prediction and innovative control strategies for oxygen and hazardous gases from diesel emission in underground mines. Sci. Total Environ. 2014, 481, 317–334. [Google Scholar] [CrossRef] [PubMed]
  16. Jo, B.; Khan, R.M.A. An internet of things system for underground mine air quality pollutant prediction based on azure machine learning. Sensors 2018, 18, 930. [Google Scholar] [CrossRef] [Green Version]
  17. Wang, X.; Wang, Z.; Guo, M.; Chen, W.; Zhang, H. Research on air quality evaluation based on principal component analysis. IOP Conf. Ser. Earth Environ. Sci. 2018, 108, 042030. [Google Scholar] [CrossRef]
  18. Shi, L.; Yu, X.; Mi, T.; Wu, X.; Yang, H. Assessment on mine air quality using pollution loss rate. Ind. Saf. Environ. Prot. 2006, 32, 36–37. (In Chinese) [Google Scholar]
  19. Chen, D.; Li, Z. The assessment of atmospheric environmental quality based on matter element analysis. Res. Environ. Sci. 1994, 7, 24–28. (In Chinese) [Google Scholar]
  20. Lv, L.; Li, H. Air quality evaluation of Beijing-Tianjin-Hebei region of China based on the fuzzy comprehensive evaluation method. Acta Sci. Nat. Univ. Nankaiensis 2016, 49, 62–68. (In Chinese) [Google Scholar]
  21. Li, Q.; Ji, M.; Sun, Y.; Zhai, X.; Zheng, Y. Analysis and evaluation of air quality in Shandong province based on AHP. IOP Conf. Ser. Earth Environ. Sci. 2021, 651, 042033. [Google Scholar] [CrossRef]
  22. Meng, X.; Sun, L.; Zhou, D.; Hu, S. Application and improvement of grey theory for assessment of environmental quality. J. Harbin Inst. Technol. 2002, 34, 700–702. (In Chinese) [Google Scholar]
  23. Liu, W.; Zhou, Y. Study of comprehensive evaluation on air quality in mine based on matter element model. Min. Res. Dev. 2015, 35, 61–63. (In Chinese) [Google Scholar]
  24. Yang, M.; Liu, L.; Gao, R. Application of fuzzy synthesis evaluation to the environmental influence of the west mineral exploration. J. Xi’an Univ. Sci. Technol. 2006, 26, 439–442. (In Chinese) [Google Scholar]
  25. Du, X.; Fang, H.; Liu, K.; Xue, B.; Cai, X. Environmental evaluation of coal mines based on generalized linear model and nonlinear fuzzy analytic hierarchy. Geofluids 2020, 2020, 8836908. [Google Scholar] [CrossRef]
  26. Jiao, M. Evaluation of mine environmental quality based on grey clustering analysis. In Proceedings of the 2015 International Academic Forum for Mine Surveying in China, Beijing, China, 16–18 October 2015; pp. 286–292. [Google Scholar]
  27. Ye, Y.; Ding, D.; Li, X.; Zhou, X. An evaluation model for air quality in underground uranium mines based on integrated scale index on weights of generalized contrast. Uranium Min. Metall. 2007, 86, 421–424. (In Chinese) [Google Scholar]
  28. Wang, D.; Zhang, P.; Zhang, Y.; Tu, S.; Wang, J.; Hao, Z. Distribution characteristic and migration mechanism of toxic gases in goafs during close-distance coal seam mining: A case study of shaping coal mine. Acs Omega 2022, 7, 7403–7413. [Google Scholar] [CrossRef] [PubMed]
  29. Li, Y.; Sun, Y.; Wang, L. Quantitative analysis and study of coal mine underground environment gases based on the FTIR. In Proceedings of the International Conference on Mechanical Engineering, Industry and Manufacturing Engineering (MEIME 2011), Beijing, China, 23–24 July 2011; pp. 878–881. [Google Scholar]
  30. Tang, Y. Sources of underground CO: Crushing and ambient temperature oxidation of coal. J. Loss Prev. Process Ind. 2015, 38, 50–57. [Google Scholar] [CrossRef]
  31. Li, Z.; Ding, J.; Peng, L. An evaluation formula of air quality based on weighted scale index of generalized contrast. In Principles and Methods of Environmental Quality Assessment; Chemical Industry Press: Beijing, China, 2004; pp. 347–352. (In Chinese) [Google Scholar]
  32. GB 3095-2012; Ambient Air Quality Standard. China Environmental Press: Beijing, China, 2012. (In Chinese)
  33. State Administration of Work Safety. Coal Mine Safety Regulations; Emergency Management Press: Beijing, China, 2022; pp. 54–55. (In Chinese) [Google Scholar]
Figure 1. The relationship between the scaling sub index and its weight.
Atmosphere 14 01021 g001
Figure 2. Frame diagram of generalized contrastive weighted comprehensive scale index evaluation model.
Atmosphere 14 01021 g002
Figure 3. Layout of monitoring points in the underground roadway.
Atmosphere 14 01021 g003
Table 1. Background concentration limit Cj0, obvious hazardous concentration limit Cjd, and primary and secondary standard concentration limits of air quality evaluation indicators in coal mines.
LimitConcentration (mg/m3)Volume Fraction (%)
SO2NOxCOTSPGas
C j 0 0.020.0150.500.050.05
C j 1 0.050.1040.120.15
C j 2 0.150.1040.300.5
C j d 0.50.31011
Table 2. Normalized scale sub-index.
I j k SO2NOxCOTSPGas
I j 1 0.2850.6330.6940.2920.367
I j 2 0.6260.6330.6940.5980.769
I j d 11111
Table 3. Classified evaluation standard for underground air quality in coal mines.
GradeI I k
I (Safe)0.490[0, 0.490]
II (Relatively safe)0.668[0.490, 0.668]
III (Slightly dangerous)1[0.668, 1]
IV (Seriously dangerous)+∞[1, +∞]
Table 4. Measured values of harmful substances at each monitoring point in a coal mine and evaluation results.
Monitoring PointsMeasured Concentration Value (mg/m3)Volume Fraction (%)IGrade
SO2NOxCOTSPGas
10.0450.0221.0310.0750.3440.342I
20.0540.0451.2130.1010.3260.391I
30.0610.0431.4440.2480.3890.476I
40.0850.0722.2350.4260.4410.604II
50.0810.0631.5460.6730.4270.614II
60.0960.1022.4251.6860.4320.814III
70.1270.1314.3316.3370.7731.075IV
80.2010.1233.79210.2120.9431.167IV
Table 5. Normalized scale sub-index value.
Monitoring PointsSO2NOxCOTSPGas
10.2520.1280.2420.1350.644
20.3090.3670.2950.2350.626
30.3460.3520.3540.5350.685
40.4500.5240.5000.7420.727
50.4350.4790.3770.8680.716
60.4870.6400.5271.1740.720
70.5740.7230.7211.6160.914
80.7170.7020.6761.7760.980
Table 6. Normalized weights.
Monitoring PointsSO2NOXCOTSPGAS
10.1980.1410.1940.1450.322
20.1860.2020.1820.1620.268
30.1750.1760.1770.2180.254
40.1720.1860.1810.2320.229
50.1690.1780.1580.2700.226
60.1410.1640.1470.3700.179
70.1300.1510.1510.3760.191
80.1400.1380.1530.3650.203
Disclaimer/Publisher’s Note: The statements, opinions and data contained in all publications are solely those of the individual author(s) and contributor(s) and not of MDPI and/or the editor(s). MDPI and/or the editor(s) disclaim responsibility for any injury to people or property resulting from any ideas, methods, instructions or products referred to in the content.

