Abstract
Air pollution is one of the deadliest and most important concerns of our era, and it not only impacts our environment but also our health. The consequences of poor air quality are not limited to just our lungs or our heart but also our brain and resulting in increased mortality rate of many countries every year. There are many effluents/pollutants present in the air that are harmful and cause diseases in humans which eventually lead to an increase in morbidity and mortality. Therefore, there is a need to identify those factors and evaluate the effect of pollution caused by air on the health of humans which is a prerequisite for the implementation of policies in preventing pollution. In this study, we model and evaluate the harmful impact of pollution caused by air on the health of humans by using a multi-criteria decision-making approach (MCDM). We have proposed a novel coupled model of the double modified (criteria importance through intercriteria correlation) CRITIC—technique for order of preference by similarity to ideal solution (TOPSIS) method (DMCTM) to identify and evaluate the factors of air pollution and its effect on health which overcome the disadvantage of bias while collecting the subjective data in the traditional TOPSIS method. To get a clear view of the framework proposed, a case study is conducted based on the methodology proposed in which we find that Xinxiang is the most polluted city in China among the five studied cities with SO2 as the major contributor, and the city experienced more pollution levels in 2022 and least in 2016, whereas there is a slight fluctuation in life expectancy with air pollution in the years 2015 and 2023.
1. Introduction
The world’s largest problem that affects the environment, as well as our health, is air pollution. Through extensive studies, we confidently conclude that the activities of humans and rapid urbanization and industrialization have an adverse influence on the environment. Despite the great revolution in the fields of science and technology, these revolutions come up with an adverse impact on the environment in terms of mixing harmful pollutants into the air which eventually deteriorates the quality of air [1]. Air pollution impacts the environment and our health [2,3,4], leading to a rapid increase in the loss of lives, especially in many developing countries. Long-term exposure to these pollutants in the air causes many deadly diseases related to the lungs and heart. Rapid urbanization [5], deforestation, green space shrinkage [6], the interference of humans with nature, and the mixing of harmful effluents into the air are mainly responsible for air pollution [7,8,9]. The death ratio also increases due to the pollution caused by industries and the harmful chemicals released by them in the air [10]. There are many reports present on air pollution’s impact and the diseases caused by it. A few of them are given in this paper. According to the Cancer Prevention II study, conducted by the American Cancer Society in 1982, risk factor data for roughly five lakh adults were linked with air pollution data from metropolitan regions across the United States and merged with vital status and cause of death data [3]. The 2019 report of the Lancet Commission on Pollution and Health reveals that around 2.3 million premature deaths were due to pollution, including nearly 1.6 million deaths due to air pollution alone in India and around 9 million deaths globally.
Therefore, there is an urgent need to take steps in controlling and preventing deaths caused by air pollution. Many steps have already been taken, many policies have been implemented, and efforts like Pradhan Mantri Ujjwala Yojana [11] was launched by India’s P.M. in 2016 which helped in shifting rural women to use a cooking gas were made to control this, and Program for Result (PforR) is used in Jing-Jin-Ji to control the air pollutants and to support the plan made by the government in air pollution in China. There are many policies and steps taken but deaths caused by air pollution continue to exponentially increase every year.
Many scientists have proposed different methods and technologies to control air pollution [12] but there is a dire need to assess the effect of air pollution on the healthy lives of humans. Air quality deteriorates day by day due to an enormous number of factors and pollutants [13] present in the air such as PM10, SO2, NO2, ozone, pH, etc. The identification of the pollutants and quantifying their contribution to deteriorating our health is a cumbersome task; therefore, the analytic evaluation of air pollution and its impact on health can be visualized and modeled with multi-criteria decision making (MCDM) where with respect to a single objective, we may have multiple conflicting criteria. The first research study on MCDM was done by Benjamin Franklin in his research on the moral algebra concept [14]. Since decision-makers find it difficult to choose among multiple criteria due to subjective perceptions. MCDM helps them to select and rank the alternative and evaluate the criteria properly [15]. Many case studies have been done in the past by using MCDM in different forms [16]. There are many well-known methods of MCDM which has already been used by researchers in different fields including the manufacturing industry, supply chain, finance, and banking. The methods include the analytical hierarchy process, data envelopment analysis, case-based reasoning, CRITIC, TOPSIS, WASPAS, and their hybrids [16,17]. In our study, we look at several different pollutants, AQI (air quality index), and the health of the people, and the number of people affected the most, and we use AQLI (air quality life index) here for accounting for the health of the people.
There are a few techniques in MCDM that can be used for the evaluation of the effect of air pollution. In past research, researchers used different techniques of MCDM; for example, in Turkey, the air quality monitoring system is evaluated using GRA (grey relational analysis), and among all the pollutants, found that PM10 is the most important [18]. Thirty European countries are ranked by evaluating the pollutants by the combination of PROMETHEE and DEA where weights are evaluated with the help of DEA [19]. Even for green transportation, electric buses are prioritized using the AHP-TOPSIS method in Ankara [20]. Strategies are prioritized in Iran to reduce greenhouse gases using stepwise weight assessment ratio analysis (SWARA) technique [21]. Even the effect of the pandemic on air quality is also analyzed using a fuzzy MCDM model for three cities in India [22]. However, the most reliable technique is the TOPSIS method [8,23]. In this study, we are using the novel coupled model of the double modified CRITIC–TOPSIS method (DMCTM) because there are so many pros associated with it when we compare this coupled model with the other methods. The TOPSIS method is not as affected by the number of alternatives and it is simpler [24] in terms of implementation as compared to other methods like AHP (analytical hierarchy process) [25]. However, the main con of TOPSIS is associated with weight as weights are difficult to determine [26,27] because they are given by the experts based on their knowledge which somehow results in bias [28]. To avoid this problem of the TOPSIS method and to eliminate the bias [29] from the decision-maker side, we used the modified CRITIC method for the evaluation of objective weights [30]. According to previous studies, CRITIC has been used for solving many real-life applications by combining it with other methods [31,32], but few studies are working with the modified CRITIC method [33,34,35]. Rather than just considering the contrast intensity in the entropy method of MCDM, the CRITIC method [36] considers both the contrast intensity [37] as well as the relationships that are contradicting in nature [38] which helps in determining the initial weights easily and are more reliable than other techniques [39]. Higher weights are assigned to the criterion with high contrast intensity as well as a high degree of conflicting relationships [36]. Pearson correlation does not work well in the CRITIC method as it works with linear data only, and that is why distance correlation is used to overcome this problem.
In this study, we propose a novel double modified CRITIC–TOPSIS method (DMCTM) to evaluate the impact of air pollution on the health of the people.
The research contribution of this paper is given below:
- We propose a modified CRITIC method first in which we use logarithmic criteria for the normalization of criteria/factors taken for the study to make the criteria’s values on the same scale as the criteria taken are in different units with high variability, and Manhattan distance correlation is used to evaluate the non-linear relationships between the criterion which is not captured by the Pearson’s correlation in the CRITIC method;
- After evaluating the criteria weights, we aggregate the results and apply the modified TOPSIS method in which normalization data is taken from the modified CRITIC normalization table itself to avoid bias. Moreover, instead of first making the weighted decision matrix, we first calculate the distance from the normalized data and then multiply it with the weights that we get from the modified CRITIC results, and then the weighted Euclidean distance is calculated;
- A case study is done based on the proposed methodology followed by verification and validation.
The remainder of the paper is as follows: Section 2 provides a brief overview of different harmful air pollutants with the associated risk. In Section 3, we discuss a few MCDM techniques. In Section 4, we thoroughly discuss the methodology proposed. In Section 5, a case study on China is done to implement the proposed methodology. The conclusions and future work of the research are discussed in Section 6.
2. Air Pollutants and Risks Associated with It
PM2.5, PM10, ground level ozone, carbon monoxide, sulphur oxides, nitrogen oxides, and lead are the major air pollutants reported by WHO (World Health Organization, Geneva, Switzerland). They affect not only the air but also our environment, including soil and groundwater. Children, the elderly, and people with pre-existing diseases are more vulnerable to air pollution [40]. So, it is important to know more about these pollutants and how they affect our health and causes deadly diseases. Many researches have shown the number of cases related to heart and lung diseases increases due to an increase in particulate matter and ozone. Most of the pollutants penetrate our system and cause heart, lung, and brain diseases. Ozone protects us from ultraviolet radiation but it is harmful to our health when it is present in higher concentrations at ground level [1]. A high percentage of carbon monoxide in the air acts as a poison for healthy people. The list of diseases caused by the aforementioned substances is very long and includes some deadly diseases such as cancer, chronic obstructive pulmonary disease (COPD), asthma, and bronchitis [41]. Therefore, a proper investigation is needed to understand how air quality plays a big role in health deterioration and increased chances of having these diseases. The summary of some major pollutants [42] is given in Table 1.

Table 1.
Pollutants, Sources, and Associated Risk.
3. Review of a Few MCDM Techniques
The purpose of the MCDM is to solve multi-aspect problems by using different approaches as well as provide tools so that decision makers can make better decisions. This method is used everywhere and in every field which requires proper structuring while dealing with multiple criteria in complex problems [16]. During the last few decades, there were many methods developed or improved by different authors, and each method differs in terms of complexity in the approach, evaluation of weights of criteria, and aggregation of data. Table 2. gives an overview of some of the MCDM methods developed in the past.
Table 2.
Overview of MCDM Techniques.
4. Proposed Methodology
The effects of air pollution on our health, which cause many diseases like asthma, cancer, and many respiratory diseases (not only in youngsters but also in infants and the elderly) and on our surroundings, that is, on the plants as well as on the materials like cars, homes, and materials leads to the many deaths as shown in Figure 1 [43,44].
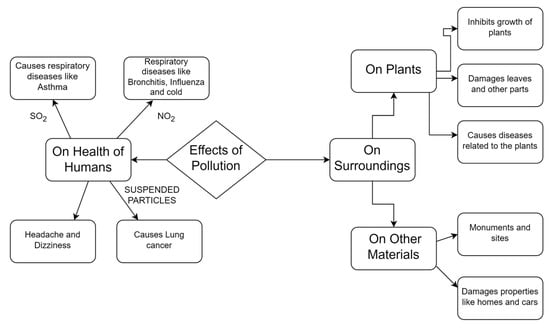
Figure 1.
Effects of Air Pollution on Humans and Surroundings.
To overcome the problems as shown in Figure 1 and to minimize the harmful effects of these on the surroundings and our health, we propose a methodology based on the double modified CRITIC-TOPSIS method (DMCTM). The prototype of the methodology is shown in Figure 2.
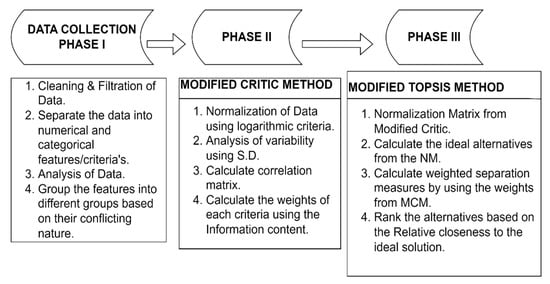
Figure 2.
Proposed Methodology.
The methodology is divided into three phases:
Phase I—Collection and analysis of data (as shown in Section 4.1);
Phase II—Evaluation of weights using the modified CRITIC method (as shown in Section 4.2);
Phase III—Alternatives ranking using the modified TOPSIS Method (as shown in Section 4.3).
4.1. Phase I—Collection and Analysis of Data
Air pollution is caused by multiple factors like the burning of fossil fuels, harmful emissions from industries, usage of harmful products like volatile organic compounds (VOCs), and subtle burning mentioned by AQI India which interact with the environment The very first stage is the collection of reliable data on air pollutants, AQI, and AQLI from trusted sources which may be from the government portal of that city/country or the other trusted sites. In this study, we are taking air pollutants, AQI, and AQLI of China. After collecting the data, it is important to filter the data and remove the redundancies for a better understanding. The clean data is grouped into different clusters based on the features of whether they negatively impact or positively impact our environment. Negative impact features (negative criterion) are those features that contribute to causing air pollutants or which in high concentration pose a harmful threat to the lives of the people and negatively impact our environment, whereas positive impact features (positive criterion) are those features which when in high concentration (number) is good for our health or people. In this study, the pollutants that we are taking as well as the AQI are considered as a negative criterion, and AQLI is considered a positive criterion.
4.2. Phase II—Evaluation of Weights Using the Modified Critic Method
As the CRITIC method can be used with both types of data, that is, subjective and objective, to analyze and evaluate the weights [45], and in this study, modified CRITIC method is used for the evaluation of criteria weights. Here criteria are air pollutants, AQI. The main feature of the modified critic method is that here during the normalization of the dataset, we are using the logarithmic criteria as it gives better results than the normalization procedure that we used in the earlier CRITIC method. Moreover, as the Pearson correlation works well only with linear data [46], here we are using the Manhattan distance correlation for the analysis of the criteria relationships. The algorithm of the modified CRITIC method is as follows:
- Data is already collected, filtered, and analyzed in Phase I. Let us consider we are dealing with r number of pollutants/criteria in s number of regions. So, the matrix of the Data becomes ;
- Normalization of the data: As the criteria are in different units or scales so normalizing of data is necessary. After normalization, the value lies between 0 and 1. The logarithmic procedure is used for the normalization procedure:
For the Criteria that are in favor of our objective, that is, positive criteria normalized value is given by Equation (1):
Similarly, for the negative criteria, we have
where is the amount of jth pollutant in the ith region and represents the normalized value;
- 3.
- After normalization, standard deviation is calculated for each criterion which will be helpful in analyzing contrast intensity [37]. More standard deviation of the criteria means higher weight associated with the criteria. S.D. is given by the Equation (3):where is the average value of the jth pollutant;
- 4.
- The Manhattan distance correlation matrix is created using the normalization matrix. As the Pearson correlation deals only with the linear data and does not accurately calculate the relationship among the criteria, we are using distance correlation. The process of calculating the distance correlation between the criteria is given below:
- Create a distance matrix for each criterion based on the normalized values attached with all the alternatives taken;
- From the distance matrix, subtract the row and column mean and add the matrix mean, and this procedure is done with each entry of the distance matrix. In the final matrix, the row mean and the column mean of the resultant matrix is zero;
- Multiply the resultant matrix element-wise and by taking the average of the entire matrix, and then the resulting value square root gives the Manhattan distance covariance of and , that is, mdCov ();
- If in the above step, , then mdVar () = mdCov (). Similarly, by using steps (a)–(d), we can calculate other distance covariances and variances;
- 5.
- By using the distance covariances and variances, the correlation matrix [37] is given by Equation (4):
Here ’ represents the criteria;
- 6.
- Analyze the distance correlation matrix and figure out the important and redundant criteria based on the values of the matrix;
- 7.
- To get deeper insights into our results and to know about the amount of information each criterion has, the next step is to calculate the information content which is given by
- 8.
- Calculate the weights of each criterion j using Equation (6).
4.3. Phase III—Alternatives Ranking Using the Modified TOPSIS Method
The main reason behind choosing the TOPSIS method is that it is not affected by a large number of alternatives and is more effective as compared to the other methods of MCDM. The main differentiation between the TOPSIS and modified TOPSIS is that in the TOPSIS method, ideal solutions are used to find the distance from the weighted normalized matrix, but in the modified TOPSIS method, we first find the positive and negative ideal solution from the normalized matrix, and then the weighted Euclidean distance is calculated to calculate the relative closeness/farness of a particular alternative from the ideal solution. The algorithm used in this study is as follows:
- The normalization matrix data that we evaluated in Phase II using Equation (1) is taken as a normalization matrix for the MODIFIED TOPSIS method;
- By using the normalized matrix, we find the ideal solutions by implementing the following Equations (7) and (8).
- After finding the negative and positive ideal solution, we find the weighted Euclidean distance, and the weights that are used here are taken from the results of the modified CRITIC method. The distance is given by Equations (9) and (10):
- The relative distance of each alternative from its ideal solution is calculated by Equation (11):
Here Ci+, Ci− represents the degree of closeness/farness that each alternative matches with the criteria.
5. Case Study
In this paper, we choose the dataset of China, more specifically, we take the dataset of the five most polluted cities of China in terms of air pollution from the years 2015 to 2023, which are Xinxiang, Shanghai, Tianjin, Beijing, and Guangzhou. Data on these cities is taken from the “Air Quality Open Data Platform” [47], WHO, and Energy Policy Institute at the University of Chicago (EPIC). Five pollutants, CO, NO2, PM10, PM2.5, and SO2, are taken in this study according to the GB3095-2012 standard of China [48].
We apply our proposed model to assess the impact of air pollution on the health of the people. The flow chart of the case study evaluation is given in Figure 3.
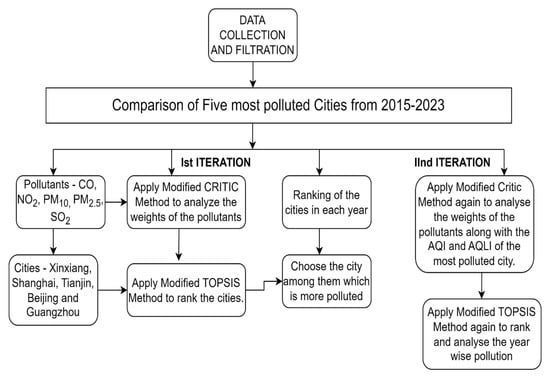
Figure 3.
Flow chart.
The steps followed during the case study are as follows:
- Identification of the criteria and alternatives for evaluating the case study. CO, NO2, PM10, PM2.5, SO2 pollutants are taken as criteria which are already discussed in Table 1, and in addition to this, AQI (air quality index) is used for evaluating and identifying the quality of air currently and also used in forecasting the air quality and AQLI (air quality life index) which eventually uses the concentration of air pollutant to know its impact on the life expectancy are also taken as criteria. The alternatives information is given in Table 3. The control of air quality in these megacities has enormous implications for the upcoming development of other Chinese megacities [49].
Table 3. Description of Alternatives.
- Collection and filtration of data on air pollutants, AQI, and AQLI of five different cities of China that are mentioned above from the years 2015 to 2023.
5.1. Ist Iteration
- Creation of the normalized matrix for each year by using the equation of the modified CRITIC method which is shown in Table 4. As CO, NO2, PM10, PM2.5, SO2, and AQI are negative so we are using the logarithmic procedure of normalization for the negative criteria. Table 4 and the subsequent tables below are based on the data from the year 2015;
Table 4. Normalization Matrix (Year–2015).
- Calculate the distance correlation matrix which is shown in Table 5 by using Equation (4). As there is a high distance correlation between the CO–PM10 and similarly between PM10–PM2.5, PM10–SO2, and PM2.5–SO2 which means there is a strong redundancy between these criteria;
Table 5. Distance- Correlation Matrix (For Year 2015).
- S.D. is calculated to analyze the contrast intensity which is shown in Table 6. The greater the S.D., the greater the contrast intensity which means SO2 followed by CO and PM10 has high contrast intensity;
Table 6. S.D. of each criterion.
- Information content as well as the weights of each criterion is calculated using an equation which is shown in Table 7 and Table 8. From the weights, we can say that SO2 is causing more pollution than the other criteria in 2015;
Table 7. Information Content Table.
Table 8. Weights of each criterion (2015).
- The criteria weights for each year are given in Table 9. By analyzing the weights, we can easily find the most contributing pollutant causing air pollution;
Table 9. Weights table for each year (2015—2023).The modified TOPSIS method is applied to rank the cities of China to find out which city is more polluted;
- Normalization matrix created in the modified CRITIC method is taken for this and from this normalized matrix, we have evaluated the positive and negative ideal solutions by Equations (7) and (8) shown in Table 10;
Table 10. Ideal Solutions.
- After evaluating the ideal solutions, we need to calculate the weighted Euclidean distance by Equations (9) and (10) from the weights that we calculated in step (d). The Euclidean Distance is shown in Table 11.
Table 11. Euclidean Distance (Weighted).
- The relative distance of each city from its ideal solution is calculated. As all criteria are negative criteria so we need to maximize the distance from a particular alternative. Ci− for Xinxiang, Shanghai, and Tianjin and Beijing are 0.7523, 0.2080, 0.8124, 0.4590, 0.1865 respectively. Moreover, we can see from here that Tianjin is on rank 1 and Xinxiang is on rank 2 followed by others;
- The ranking of the cities for each year is shown in Table 12. From this, we can see that Xinxiang is on rank 1 from the year 2016 to 2023 which means Xinxiang is the most polluted city in China.
Table 12. Ranking of all cities (2015–2023).
5.2. IInd Iteration
From the first iteration, we can observe that Xinxiang is the most polluted city so now by taking Xinxiang city, we evaluate the effect of these pollutants on our lives by taking the pollutants, AQI and AQLI as the criteria.
- For evaluating the effect of this, repeat steps (a)–(j) of Ist Iteration. As AQLI is the positive criterion so we are using the logarithmic positive criteria for the evaluation;
Table 13.
Normalization Matrix for Xinxiang (2015–2023) (with AQLI).
Table 13.
Normalization Matrix for Xinxiang (2015–2023) (with AQLI).
| CO | NO2 | PM10 | PM2.5 | SO2 | AQI | AQLI | |
| 2015 | 0.060952 | 0.050773 | 0.037982 | 0.035838 | 0.040296 | 0.044905 | 0.231218 |
| 2016 | 0.054615 | 0.052844 | 0.038334 | 0.036963 | 0.039357 | 0.034979 | 0.336427 |
| 2017 | 0.051752 | 0.050302 | 0.040748 | 0.037856 | 0.050399 | 0.035488 | 0.281072 |
| 2018 | 0.057472 | 0.05265 | 0.042146 | 0.038884 | 0.060932 | 0.035835 | 0.251629 |
| 2019 | 0.062559 | 0.050018 | 0.041772 | 0.038759 | 0.072066 | 0.035835 | 0.223001 |
| 2020 | 0.06398 | 0.049932 | 0.041306 | 0.037984 | 0.074427 | 0.035488 | 0.205586 |
| 2021 | 0.063844 | 0.053254 | 0.04372 | 0.040679 | 0.078625 | 0.04306 | 0.203606 |
| 2022 | 0.069988 | 0.063641 | 0.046315 | 0.042556 | 0.083189 | 0.037111 | 0.194428 |
| 2023 | 0.062384 | 0.059265 | 0.041369 | 0.037375 | 0.077293 | 0.035317 | 0.188641 |
Table 14.
Normalization Matrix for Xinxiang (2015–2023) (without AQLI).
Table 14.
Normalization Matrix for Xinxiang (2015–2023) (without AQLI).
| CO | NO2 | PM10 | PM2.5 | SO2 | AQI | |
| 2015 | 0.060952 | 0.050773 | 0.037982 | 0.035838 | 0.040296 | 0.044905 |
| 2016 | 0.054615 | 0.052844 | 0.038334 | 0.036963 | 0.039357 | 0.034979 |
| 2017 | 0.051752 | 0.050302 | 0.040748 | 0.037856 | 0.050399 | 0.035488 |
| 2018 | 0.057472 | 0.05265 | 0.042146 | 0.038884 | 0.060932 | 0.035835 |
| 2019 | 0.062559 | 0.050018 | 0.041772 | 0.038759 | 0.072066 | 0.035835 |
| 2020 | 0.06398 | 0.049932 | 0.041306 | 0.037984 | 0.074427 | 0.035488 |
| 2021 | 0.063844 | 0.053254 | 0.04372 | 0.040679 | 0.078625 | 0.04306 |
| 2022 | 0.069988 | 0.063641 | 0.046315 | 0.042556 | 0.083189 | 0.037111 |
| 2023 | 0.062384 | 0.059265 | 0.041369 | 0.037375 | 0.077293 | 0.035317 |
The ranking for each year with and without AQLI is given in Table 15. From Table 15, we can conclude that in the year 2022, Ci− has the lowest value (with and without AQLI) which means in the year 2022, we have experienced serious air pollution along with the negative effect of this on life expectancy. Moreover, in the year 2016, we have the least amount of air pollution along with an increased life expectancy than other years taken for the study. In 2021 we can see that there is an increase in life expectancy if the quality of the air improves. Moreover, if we compare the last three years then we can say that the quality of the air improves along with the life expectancy which is due to the steps and policies made by the Chinese government.
Table 15.
Ranking for each Year (From 2015–2023).
6. Conclusions
Air pollution has an adverse impact on the environment as well as on the lives of humans directly by causing numerous incurable diseases which not only deteriorate our health but also decrease our life expectancy. Due to continuous increment in this, life expectancy decreases year by year. Therefore, there is an urgent need to check on this and take immediate steps which help in controlling this disaster. Since most of the earlier research models and evaluations are based on the domain experts’ views that may be biased based on different views, it is necessary to propose a model which reduces the effect of this bias and gives us more accurate and reliable results.
In this study, we propose a novel MCDM model double-modified CRITIC–TOPSIS method in which we take the objective data for our evaluations. It is difficult to deal with the subjective data in the TOPSIS and, therefore, we are using the modified CRITIC along with them. All of us know air pollution is bad for our health but we cannot control them in the blink of an eye from the entire country. We need a proper mechanism so that we can control them in a step-by-step manner. Controlling the pollution from the entire country is very difficult so we try to develop a mathematical framework to analyze and evaluate the factors causing air pollution. We apply our framework to the five cities of China and take the data of the pollutants, AQI, AQLI from the years 2015–2023 and find out the following:
- We first find the cities in China where people are more prone to the effects of this deadly pollution. We have taken five cities, that is, Xinxiang, Shanghai, Tianjin, Beijing, and Guangzhou, and among them, Xinxiang is the city that is most prone to this; therefore, by doing the Ist iteration of our model and along with that we also get the weights of the pollutants which are causing air pollution;
- Moreover, from the IInd iteration, we see that in 2022, Xinxiang experienced the highest air pollution and in 2016, the lowest air pollution which in turn means that life expectancy increases with the improvement in air pollution;
- But it is not always mandatory that whenever air pollution increases, life expectancy decreases as we can see in the years 2015 and 2023 as life expectancy also depends on many factors like the lifestyle of people and genetics other than the environmental impact.
We concluded from our results that air pollution scores fluctuate over time, and we can say that there are some points where life expectancy increases along with air pollution which is because of the effective measure taken by the government as well as by the people for living a healthy life, and pollution can be controlled by using correct technologies, enforcing policies which help in the reduction of pollution, as well as adjusting industry work will help to reduce air pollution and support sustainable urban growth. As each MCDM methodology has some advantages and disadvantages. One of the limitations of this study is that the AQLI data is available only for the particulate matter and not for the other pollutants. If AQLI of other pollutants is taken then it will give a more concise result. Moreover, statistical tests can be applied to validate the proposed methodology. One of the future works that we can do is to predict the upcoming year’s life expectancy and AQI using the combination of MCDM and machine learning algorithms.
Author Contributions
S.G.: Methodology, Software, Writing—Original Draft; R.B.: Conceptualization, Supervision, Investigation, Writing—Review and Editing. All authors have read and agreed to the published version of the manuscript.
Funding
This research receives financial support from Guru Gobind Singh Indraprastha University.
Institutional Review Board Statement
Not applicable.
Informed Consent Statement
Not applicable.
Data Availability Statement
The data used to support this study is taken from Air Quality Open Data Platform, WAQI. (https://aqicn.org/data-platform/covid19/).
Acknowledgments
We are grateful to Guru Gobind Singh Indraprastha University for undertaking this research.
Conflicts of Interest
The authors declare no conflict of interest.
References
- Manisalidis, I.; Stavropoulou, E.; Stavropoulos, A.; Bezirtzoglou, E. Environmental and Health Impacts of Air Pollution: A Review. Front. Public Health 2020, 8, 14. [Google Scholar] [CrossRef] [PubMed]
- Lepeule, J.; Bind, M.A.C.; Baccarelli, A.A. Epigenetic Influences on Associations between Air Pollutants and Lung Function in Elderly Men. N. Engl. J. Med. 2014, 122, 1085–1095. [Google Scholar]
- Pope, C.A.; Burnett, R.T.; Thun, M.J.; Calle, E.E.; Krewski, D.; Ito, K.; Thurston, G.D. Lung Cancer Cardiopulmonary Mortality, and Long-term Exposure to Fine Particulate Air Pollution. JAMA 2002, 287, 1132–1141. [Google Scholar] [CrossRef] [PubMed]
- Tanaka, S. Environmental regulations on air pollution in China and their impact on infant mortality. J. Health Econ. 2015, 42, 90–103. [Google Scholar] [CrossRef]
- Cho, H.S.; Choi, M.J. Effects of Compact Urban Development on Air Pollution: Empirical Evidence from Korea. Sustainability 2014, 6, 5968–5982. [Google Scholar] [CrossRef]
- Liu, H.L.; Shen, Y.S. The Impact of Green Space Changes on Air Pollution and Microclimates: A Case Study of the Taipei Metropolitan Area. Sustainability 2014, 6, 8827–8855. [Google Scholar] [CrossRef]
- Alvarado, M.; Gonzalez, F.; Erskine, P.; Cliff, D.; Heuff, D. A Methodology to Monitor Airborne PM10 Dust Particles Using a Small Unmanned Aerial Vehicle. Sensors 2017, 17, 343. [Google Scholar] [CrossRef]
- Chen, J.K.; Chen, I.S. Using a novel conjunctive MCDM approach based on DEMATEL, fuzzy ANP, and TOPSIS as an innovation support system for Taiwanese higher education. Expert Syst. Appl. 2010, 37, 1981–1990. [Google Scholar] [CrossRef]
- Nduwayezu, J.B.; Ishimwe, T.; Niyibizi, A. Quantification of Air Pollution in Kigali City and Its Environmental and Socio-Economic Impact in Rwanda. Am. J. Environ. Eng. 2015, 5, 106–119. [Google Scholar]
- Fuller, R.; Landrigan, P.J.; Balakrishnan, K.; Bathan, G.; Bose-O’Reilly, S.; Brauer, M.; Caravanos, J.; Chiles, T.; Cohen, A.; Corra, L.; et al. Pollution and Health: A progress update. Lancet Planet Health 2022, 6, E535–E547. [Google Scholar] [CrossRef]
- Pradhan Mantri Ujjwala Yojana. Ministry of Petroleum and Natural Gas. 2016. Available online: https://www.pmuy.gov.in/index.aspx (accessed on 5 January 2023).
- Vallero, D.A. Air Pollution Monitoring Changes to Accompany the Transition from a Control to a Systems Focus. Sustainability 2016, 8, 1216. [Google Scholar] [CrossRef]
- Donga, L.; Liang, H. Spatial analysis on China’s regional air pollutants and CO2 emissions: Emission pattern and regional disparity. Atmos. Environ. 2014, 92, 280–291. [Google Scholar] [CrossRef]
- Taherdoost, H.; Madanchian, M. Multi-Criteria Decision Making (MCDM) Methods and Concepts. Encyclopedia 2023, 3, 77–87. [Google Scholar] [CrossRef]
- Shahsavarani, A.M.; Azad Marz Abadi, E. The Bases, Principles, and Methods of Decision-Making: A review of literature. Int. J. Med. Rev. 2015, 2, 214–225. [Google Scholar]
- Hajduk, S. Multi-Criteria Analysis in the Decision-Making Approach for the Linear Ordering of Urban Transport Based on TOPSIS Technique. Energies 2021, 15, 274. [Google Scholar] [CrossRef]
- Bączkiewicz, A.; Wątróbski, J.; Kizielewicz, B.; Sałabun, W. Towards Objectification of Multi-Criteria Assessments: A Comparative Study on MCDA Methods. In Proceedings of the 2021 16th Conference on Computer Science and Intelligence Systems (FedCSIS), Sofia, Bulgaria, 2–5 September 2021. [Google Scholar] [CrossRef]
- Zeydan, Ö.; Pekkaya, M. Evaluating air quality monitoring stations in Turkey by using multi criteria decision making. Atmos. Pollut. Res. 2021, 12, 101046. [Google Scholar] [CrossRef]
- Giannakitsidou, O.; Giannikos, I.; Chondrou, A. Ranking European countries on the basis of their environmental and circular economy performance: A DEA application in MSW. Waste Manag. 2020, 109, 181–191. [Google Scholar] [CrossRef]
- Hamurcu, M.; Eren, T. Electric Bus Selection with Multicriteria Decision Analysis for Green Transportation. Sustainability 2020, 12, 2777. [Google Scholar] [CrossRef]
- Ghoushchi, S.J.; Ab Rahman, M.N.; Soltanzadeh, M.; Rafique, M.Z.; Marangalo, F.Y.; Ismail, A.R. Assessing Sustainable Passenger Transportation Systems to Address Climate Change Based on MCDM Methods in an Uncertain Environment. Sustainability 2023, 15, 3558. [Google Scholar] [CrossRef]
- Suresh, S.; Modi, R.; Sharma, A.K.; Arisutha, S.; Sillanpää, M. Pre-COVID-19 pandemic: Effects on air quality in the three cities of India using fuzzy MCDM model. J. Environ. Health Sci. Eng. 2022, 20, 41–51. [Google Scholar] [CrossRef]
- Yoon, K.P.; Hwang, C.L. Multiple Attribute Decision Making: An Introduction; Sage Publications: Thousand Oaks, CA, USA, 1995; Volume 104. [Google Scholar]
- Sipahi, S.; Timor, M. The analytic hierarchy process and analytic network process: An overview of applications. Manag. Decis. 2010, 48, 775–808. [Google Scholar] [CrossRef]
- Velasquez, M.; Hester, P.T. An analysis of multi-criteria decision making methods. Int. J. Oper. Res. 2013, 10, 56–66. [Google Scholar]
- Behzadian, M.; Otaghsara, S.K.; Yazdani, M.; Ignatius, J. A state-of the-art survey of TOPSIS applications. Expert Syst. Appl. 2012, 39, 13051–13069. [Google Scholar] [CrossRef]
- Hafezalkotob, A.; Hafezalkotob, A. Extended MULTIMOORA method based on Shannon entropy weight for materials selection. J. Ind. Eng. Int. 2016, 12, 1–13. [Google Scholar] [CrossRef]
- Dymova, L.; Sevastjanov, P.; Tikhonenko, A. An approach to generalization of fuzzy TOPSIS method. Inf. Sci. 2013, 238, 149–162. [Google Scholar] [CrossRef]
- Vanolya, N.M.; Jelokhani-Niaraki, M. The use of subjective–objective weights in GIS-based multi-criteria decision analysis for flood hazard assessment: A case study in Mazandaran, Iran. GeoJournal 2019, 86, 379–398. [Google Scholar] [CrossRef]
- Alemi-Ardakani, M.; Milani, A.S.; Yannacopoulos, S.; Shokouhi, G. On the effect of subjective, objective and combinative weighting in multiple criteria decision making: A case study on impact optimization of composites. Expert Syst. Appl. 2016, 46, 426–438. [Google Scholar] [CrossRef]
- Marković, V.; Stajić, L.; Stević, Ž.; Mitrović, G.; Novarlić, B.; Radojičić, Z. A Novel Integrated Subjective-Objective MCDM Model for Alternative Ranking in Order to Achieve Business Excellence and Sustainability. Symmetry 2020, 12, 164. [Google Scholar] [CrossRef]
- Yerlikaya, M.A.; Tabak, Ç.; Yıldız, K. Logistic Location Selection with Critic-Ahp and Vikor Integrated Approach. Data Sci. Appl. 2019, 2, 21–25. [Google Scholar]
- Krishnan, A.R.; Kasim, M.M.; Hamid, R.; Ghazali, M.F. A Modified CRITIC Method to Estimate the Objective Weights of Decision Criteria. Symmetry 2021, 13, 973. [Google Scholar] [CrossRef]
- Wu, H.W.; Zhen, J.; Zhang, J. Urban rail transit operation safety evaluation based on an improved CRITIC method and cloud model. J. Rail Transp. Plan. Manag. 2020, 16, 100206. [Google Scholar] [CrossRef]
- Žižović, M.; Miljković, B.; Marinković, D. Objective methods for determining criteria weight coefficients: A modification of the CRITIC method. Decis. Mak. Appl. Manag. Eng. 2020, 3, 149–161. [Google Scholar] [CrossRef]
- Diakoulaki, D.; Mavrotas, G.; Papayannakis, L. Determining objective weights in multiple criteria problems: The critic method. Comput. Oper. Res. 1995, 22, 763–770. [Google Scholar] [CrossRef]
- Krishnan, A.R.; Hamid, R.; Kasim, M.M. An Unsupervised Technique to Estimate λ0-Fuzzy Measure Values and Its Application to Multi-criteria Decision Making. In Proceedings of the 2020 IEEE 7th International Conference on Industrial Engineering and Applications (ICIEA), Bangkok, Thailand, 16–21 April 2020; pp. 969–973. [Google Scholar] [CrossRef]
- Li, L.-H.; Mo, R. Production Task Queue Optimization Based on Multi-Attribute Evaluation for Complex Product Assembly Workshop. PLoS ONE 2015, 10, e0134343. [Google Scholar] [CrossRef]
- Peng, X.; Zhang, X.; Luo, Z. Pythagorean fuzzy MCDM method based on CoCoSo and CRITIC with score function for 5G industry evaluation. Artif. Intell. Rev. 2020, 53, 3813–3847. [Google Scholar] [CrossRef]
- EPA—United States Environmental Protection Agency. Available online: https://www.epa.gov/criteria-air-pollutants (accessed on 10 January 2023).
- Burroughs Peña, M.S.; Rollins, A. Environmental exposures and cardiovascular disease: A challenge for health and development in low- and middle-income countries. Cardiol. Clin. 2017, 35, 71–86. [Google Scholar] [CrossRef] [PubMed]
- Environment Protection Authority—Victoria. Available online: https://www.epa.vic.gov.au/ (accessed on 20 January 2023).
- Omoya, F.O.; Ajayi, K.O.; Afolami, O.I.; Odetunde, E.T. Air pollution: Adverse effects on plants, animals, humans, microorganisms and food—A review. Monogr. Atmos. Res. 2018, 33–37. Available online: https://carnasrda.com/wp-content/uploads/2019/06/Omaya-et-al.pdf (accessed on 3 February 2023).
- Whitacre, P. Air Pollution Accounts for 1 in 8 Deaths Worldwide, According to New WHO Estimates; National Institute of Environmental Health Sciences: Durham, NC, USA, 2014. Available online: https://www.niehs.nih.gov/research/programs/geh/geh_newsletter/assets/docs/april14_feature_508.pdf (accessed on 3 February 2023).
- Piasecki, M.; Kostyrko, K. Development of Weighting Scheme for Indoor Air Quality Model Using a Multi-Attribute Decision Making Method. Energies 2020, 13, 3120. [Google Scholar] [CrossRef]
- Chaudhuri, A.; Hu, W. A fast algorithm for computing distance correlation. Comput. Stat. Data Anal. 2019, 135, 15–24. [Google Scholar] [CrossRef]
- Air Quality Open Data Platform, WAQI. Available online: https://aqicn.org/data-platform/covid19/ (accessed on 3 February 2023).
- Ministry of Envirmental Protection of the People’s Republic China. Ambient Air Quality Standards; Ministry of Envirmental Protection of the People’s Republic China: Beijing, China, 2012. [Google Scholar]
- Chan, C.K.; Yao, X. Air pollution in mega cities in China. Atmos. Environ. 2008, 42, 1–42. [Google Scholar] [CrossRef]


Disclaimer/Publisher’s Note: The statements, opinions and data contained in all publications are solely those of the individual author(s) and contributor(s) and not of MDPI and/or the editor(s). MDPI and/or the editor(s) disclaim responsibility for any injury to people or property resulting from any ideas, methods, instructions or products referred to in the content. |
© 2023 by the authors. Licensee MDPI, Basel, Switzerland. This article is an open access article distributed under the terms and conditions of the Creative Commons Attribution (CC BY) license (https://creativecommons.org/licenses/by/4.0/).