Article

Spatiotemporal Variability of Urban Air Pollution in Bucharest City

1
National Institute of Research and Development for Optoelectronics-INOE 2000, Str. Atomistilor nr 409, 077125 Măgurele, Romania
2
Faculty of Geography, University of Bucharest, Bulevardul Nicolae Bălcescu 1, 010041 Bucharest, Romania
*
Author to whom correspondence should be addressed.
These authors contributed equally to this work.
Atmosphere 2023, 14(12), 1759; https://doi.org/10.3390/atmos14121759
Submission received: 13 October 2023 / Revised: 17 November 2023 / Accepted: 20 November 2023 / Published: 29 November 2023
(This article belongs to the Special Issue Air Quality in Metropolitan Areas and Megacities)

Abstract

:
Urban air pollution is one of the major challenges that cities around the world face. Particulate matter (PM), nitrogen dioxide (NO 2 ), volatile organic compounds (VOCs), and other pollutants are many times over the recommended airborne exposure, generating a strong impact on human health and city well-being. Considering Bucharest as a case study, this study aimed to investigate the patterns of particulate matter and nitrogen dioxide concentrations. Multiyear data from the Romanian National Air Quality Monitoring Network were used to investigate spatial and temporal variability. All air pollutants presented a typical bimodal trend during the day, with specific double peaks corresponding to the morning rush hours and nighttime. Spatial variability in NO 2  concentrations was observed, with almost double the concentration values in the city center during midday compared with those for the background and industrial areas. A weekly pattern of PM was noticed, with lower concentrations during the weekends in comparison with those during weekdays, more pronounced in the case of PM 10  compared with the case of PM 2.5 . The fine particle fraction presented monthly and seasonal variability, with higher levels during the cold months compared with the warm months, mainly corresponding to the increased household heating. The estimated proportion of mortality attributable to annual exposure to an air PM 2.5  above 5  μ g/m 3  in Bucharest ranged between 7.55% and 8.26%, with the maximum from 2021. By contrast, the estimated proportion of mortality attributable to PM 10  and NO 2  above 10  μ g/m 3  was significantly lower, with values around 4%. The results are useful in supporting environmental planning measures to decrease urban air pollution.

1. Introduction

Cities face many environmental challenges that influence their attractiveness and competitiveness. These challenges include climate change, air pollution, and urban expansion. Particulate matter, nitrogen oxides, sulfur oxides, volatile organic compounds, and ozone are among the air pollutants most likely to exceed the recommended levels of population exposure.
Particulate matter (PM) and nitrogen dioxide (NO2) have an important impact on air quality, climate, and consequently human health [1,2]. Particulate matter is frequently classified depending on its size, with PM10 being particles that have diameters less than 10  μ m, while PM2.5 represents particulate matter with a diameter less than 2.5  μ m. Atmospheric aerosols are small particles suspended in the atmosphere, including soot, dust, smoke, pollen, and liquid droplets. They can be a combination of organic and inorganic substances of natural or anthropogenic origin [3]. The main sources of PM are fuel burning, traffic, industrial emissions, soil erosion, and biomass burning [4,5,6]. Another group of pollutants that contribute to air quality is NO2, produced mostly by traffic emissions but also due to the production of electricity and due to commercial, institutional, and household activities [7,8]; SO 2  is primarily released into the atmosphere from the combustion of sulfur-containing fossil fuels, such as coal and oil [9,10]; ground-level O 3  is a secondary pollutant formed by the reaction of volatile organic compounds (VOCs) and nitrogen oxides (NOx) in the presence of sunlight [11]; and CO is a colorless, odorless gas produced by the incomplete combustion of carbon-containing fuels, such as gasoline and wood. These can be emitted from various sources, including vehicles, industrial processes, and residential heating [12].
The European Environment Agency (EEA) plays a crucial role in performing air quality monitoring following the guidelines from EU air quality directives, in coordination with the National Environmental Agency network, providing the necessary tools to achieve informed political decisions related to the environment. These guidelines aim to protect human health and the environment from the detrimental effects of air pollution. The EU’s directives focus on various pollutants, such as particulate matter (PM) and nitrogen dioxide (NO2), among others. The EU air quality directives in place, 2008/50/EC and 2004/107/EC, establish a 24 h limit of 50  μ g/m 3  for PM10; no limit for PM2.5 yet; an hourly outer limit of 200  μ g/m 3  NO2; and annual limits of 40  μ g/m 3  for PM10, 25  μ g/m 3  for PM2.5, and 40  μ g/m 3  for NO2 [1,13]. Recently, the European Commission proposed a revision of the Ambient Air Quality Directive to impose stricter limits for air pollution than the current ones, towards alignment with those set by the World Health Organization.
The World Health Organization (WHO) updated its guidelines related to air quality health risk values in 2021, recommending even lower average concentrations of air pollutants than the air quality directives. The WHO recommends an annual limit of 15  μ g/m 3  for PM10, indicating that the average concentration of PM10 over a year should not exceed this threshold. Additionally, there is a 24 h limit of 45  μ g/m 3 . The recommended annual limit for PM2.5 is significantly lower, set at 5  μ g/m 3 . This indicates a stricter standard for PM2.5 concentrations, emphasizing the need to minimize long-term exposure to this pollutant. Therefore, the 24 h limit for PM2.5 is set at 15  μ g/m 3 . Another significant air pollutant considered by the WHO guidelines is NO2. The recommended annual limit for NO2 is 10  μ g/m 3 ; the average concentration over a year should not exceed this level to protect human health. Additionally, there is a 24 h limit of 25  μ g/m 3  for NO2 [14].
Air pollution is responsible for the majority of premature deaths, with heart disease and stroke being the leading contributors, followed closely by respiratory diseases and lung cancer [15,16,17,18]. In the European Union, in 2020, there were 238,000 premature deaths due to exposure to PM 2.5  concentrations above 5  μ g/m 3  and 49,000 premature deaths due to exposure to nitrogen dioxide levels above 10  μ g/m 3 . Moreover, according to the European Environment Agency (EEA), from 2022, Romania saw 21,600 premature deaths due to particulate matter, and almost 1211 years of life were lost per 100,000 inhabitants [19]. A health risk assessment is a crucial process used to systematically evaluate and understand the potential health risks that individuals or entire populations may face due to exposure to various environmental agents or stressors. These agents could include pollutants, chemicals, biological agents, or other hazardous substances found in air, water, soil, or food [20].
Urban air pollution is a critical environmental concern that affects cities worldwide, including Bucharest, the capital city of Romania [21]. As urban areas continue to grow and industrialize, the emission of pollutants into the atmosphere poses significant health risks and ecological consequences. In urban environments, air pollution has become a major issue due to factors such as vehicular emissions, industrial activities, and energy production [22,23]. The assessment of air quality in several European cities is thus emphasized: Serra San Bruno, Italy [24]; Istanbul, Türkiye [25]; Thessaloniki, Greece [26]; Copenhagen, Denmark [27]; and several cities across France [28,29]. Furthermore, the knowledge of air quality variability in Bucharest is very limited [30,31,32]; only a few studies have focused on identifying the possible particle sources, as well as their properties, and only for short time periods and for one PM size (e.g., [33,34,35,36]).
In Romania, air quality monitoring and management are performed by the Ministry of Environment under the Romanian National Air Quality Monitoring Network (RNMCA), which provides standard air pollution monitoring data, with a total of 30 air quality measurement stations distributed throughout Bucharest and its peripheral areas [37]. In recent decades, the monitoring of air quality in Romania has been also motivated by a mandate imposed by the European Union at the proposal of Greenpeace and ClientEarth [30,38,39,40].
This study focuses on the assessment of air quality, specifically particulate matter and NO2 concentration variability over three years in Bucharest, emphasizing the seasonal, diurnal, and spatial variability. The article is structured as follows. Section 2 describes the measurement location and data, as well as the data treatment and tools used for data analysis. PMs and gaseous variability are discussed in Section 3. The Section 4 contains the concluding remarks on air pollutant variability in Bucharest city.

2. Materials and Methods

2.1. Study Area and Measurements

Bucharest is located in the south of the Romanian Plain in the eastern part of Europe, characterized by a temperate continental climate [41]. The pollutants are transported from the vicinity, and the urban area suffers from increased pollution due to the large number of inversions influenced by the topography of the area [42,43].
Bucharest, the capital of Romania, is an urban hub facing significant challenges in regard to air pollution. This large city, home to over 2 million people, has experienced a steady increase in air pollution levels in recent years [44]. Furthermore, industrial zones in and around Bucharest, coupled with the use of outdated technologies, release a variety of harmful pollutants into the atmosphere. Finally, during the cold winter months, the city’s reliance on solid fuel for heating further exacerbates the air quality issue, as emissions from wood and coal combustion become prevalent [45,46].
This study uses air quality data from the National Air Quality Monitoring Network (RNMCA) stations distributed throughout Bucharest. Measurements performed at 8 stations have been selected based on data availability during the study time frame (2020–2022). All types of stations are selected for the study: urban-type stations (2) in the east and northeast of the city, a suburban station (1) located 4 km south of the capital, industrial-type stations (3) located in the southern half, and traffic-type stations (2) located in the center of the city (see Table 1).
The study focuses only on particulate matter and nitrogen dioxide, which are available in all stations (CO (5 stations), O 3  (3 stations), and SO 2  variability are included in Supplementary Figure S1, due to the low data availability). It should be also mentioned that the 8 stations in the case of PM10 and PM2.5 measurements are equipped with different sensor types and consequently with different uncertainties, but follow the same standards of measurement.

2.2. Data Treatment

The data set used to assess the pollutants’ variability is represented by three years (from 1 January 2020 to 31 December 2022) of measurements. The hourly average concentrations of PM10, PM2.5, and NO2 from the selected RNMCA stations were further used in the study to characterize the air pollutants in the Bucharest area.
The data filtering was performed using a custom-made Python code, through several steps as follows. During the first filter, the consistency of the data for all pollutants was checked using a moving average for 3 points (3 h). All concentrations with values higher and lower than the double mean were removed. These represented only 0.08% of the data. The values of the ratio of PM2.5 and PM10 were used in the second step to identify any irregularities that might exist within the data set. Any measurements that displayed a ratio exceeding 1 were considered anomalous and subsequently eliminated from the analyzed data set. This filtering approach ensured the reliability and accuracy of the remaining data for the assessment of factors influencing air quality and potential environmental concerns. Moreover, this ratio was further used to gain insights related to the particulate matter granularity, possible composition, and potential sources of pollution.
The Quantum Geographic Information System (QGIS) software (https://qgis.org/en/site/), made by QGIS Development Team, Gossau, Switzerland, was used to visualize and analyze the filtered data on a map, enabling a comprehensive understanding of the spatial characteristics of the data set [47]. Using this tool, we were able to identify patterns, trends, and spatial relationships, providing valuable information on the distribution and concentrations of the PM2.5 and PM10 pollutants.
During the three years of measurement, the maximum number of possible data points was 26,301. The temporal data coverage was calculated as a percentage to show the data availability for the entire time frame of 3 years. Table 2 presents only the stations with more than 95% data availability, those that measured two thirds of the period, and the B9 station with data available only during 2022. The filtered data set (last column of Table 2) is representative, since the lowest filtered coverage (from the total temporal coverage of the data) is 92.54% for the B5 station.

2.3. Air Pollution Human Health Risk Assessment

The AirQ +  model has been used to assess the human health risk due to air pollution in Bucharest. AirQ +  is a tool provided by the WHO, built to assist health officials and environmental experts in evaluating the impact of air pollution on health. In our study, we analyzed the effects of exposure to PM 10 , PM 2.5 , and NO 2  during the three years selected. The software calculated the estimated attributable proportions, estimated number of attributable cases, and estimated number of attributable cases per 100,000 population at risk, taking into account the annual average concentrations for each pollutant and using cut-off values based on emission standards documentation provided by the WHO: 5  μ g/m 3  for PM 2.5 , 10  μ g/m 3  for PM 10  and NO 2  [48].
Our study focused on mortality analysis for all natural causes for adults over the age of 30. The relative risk (RR) values used were 1.08 for PM 2.5 , 1.04 for PM 10 , and 1.02 for NO 2  concentrations.
The values related to the total population and the population aged 30 and above in the city of Bucharest, as well as the total number of deaths for each year, were provided by the Romanian National Institute of Statistics [49]. The death incidence was calculated as the ratio between the number of deaths and the total population multiplied by 100,000. (Table 3).

3. Results and Discussion

This study presents the assessment of air quality variability in Bucharest, Romania, covering all seasons during three years of measurements, 2020–2022. A particular focus was given to the comparison of the investigated time period including the COVID-19 lockdown period and not, similarly to the work by [50], The trends in the spatiotemporal variability of urban air pollution in Bucharest showed a minimal impact of the lockdown period (as depicted in Supplementary Figures S2–S4); therefore, the full database was considered for further analysis.
The values of the concentrations presented in Table 4 show variability for all three pollutants, PM10, PM2.5, and NO2, over the Bucharest area, but within the same limits for all three years. Significant peaks are observed sporadically in the city center, as measured by the B6 station. The average concentrations are within the same range for all stations and for all three atmospheric compounds. Mean concentrations vary over all stations, with a maximum of 20% for PM 10 , for example. The maximum loadings for three of the stations (B1, B3, and B6) are considerably high, reaching hourly concentrations of up to 570  μ g/m 3  and 644  μ g/m 3  for PM10.
Moreover, the other compounds present higher values at these stations, most likely due to their location in the central area of the city and their type (traffic and urban stations, respectively).
By comparing the mean PM10 concentrations at background and traffic stations in Bucharest, an increased concentration of PM10 in the city center and traffic area can be observed. These differences are significant in all years. An overall decrease in concentrations over the years is seen at traffic stations, while, at industrial ones, there is an increase. Significant differences in mean PM10 concentrations are highlighted at the industrial station, B4, possibly due to the proximity to the industrial area in the Berceni district, in the southeast of Bucharest, and a possible effect of the COVID-19 lockdown in 2020.
The target value of 40  μ g/m 3  for the annual mean concentration of PM10 mentioned in the EU legislation has not been exceeded in Bucharest for the analyzed period. However, the daily mean value concentrations for all stations from the Bucharest area have been exceeded for 22, 17, and 21 days in 2020, 2021, and 2022, respectively. The majority of days exceeding the PM10 daily limit concentration are during spring and autumn, seasons characterized by intense anthropogenic activity. Although the air quality EU limits are not exceeded for the PM10 annual concentration in Bucharest, the human health EU limit is exceeded during the three years for all sites. Moreover, the PM2.5 annual concentration is more than two times the target value of 5  μ g/m 3  for human health protection.
The highest concentrations and maximum loadings of PM2.5 are noticed in the urban areas, by comparison with industrial and traffic areas, while the mean NO2 concentrations in Bucharest show increased values at traffic sites, as expected, followed by the industrial ones. At traffic sites, the mean concentrations are almost double those at the background sites. The target value of 40  μ g/m 3  for the annual mean concentration of NO2 mentioned in the EU legislation has been exceeded in Bucharest only for the traffic sites during the analyzed period. The mean NO2 concentrations at each station are nearly constant over these three years, with the highest variability being noticed in the city center.
Figure 1 shows that the mean annual concentration of particulate matter (PM 10  and PM 2.5 ) for the entirety of Bucharest city is almost constant across the years, with smaller variability in 2022. The highest annual concentration and variability of NO 2  is observed during 2021 but within the EC limits.
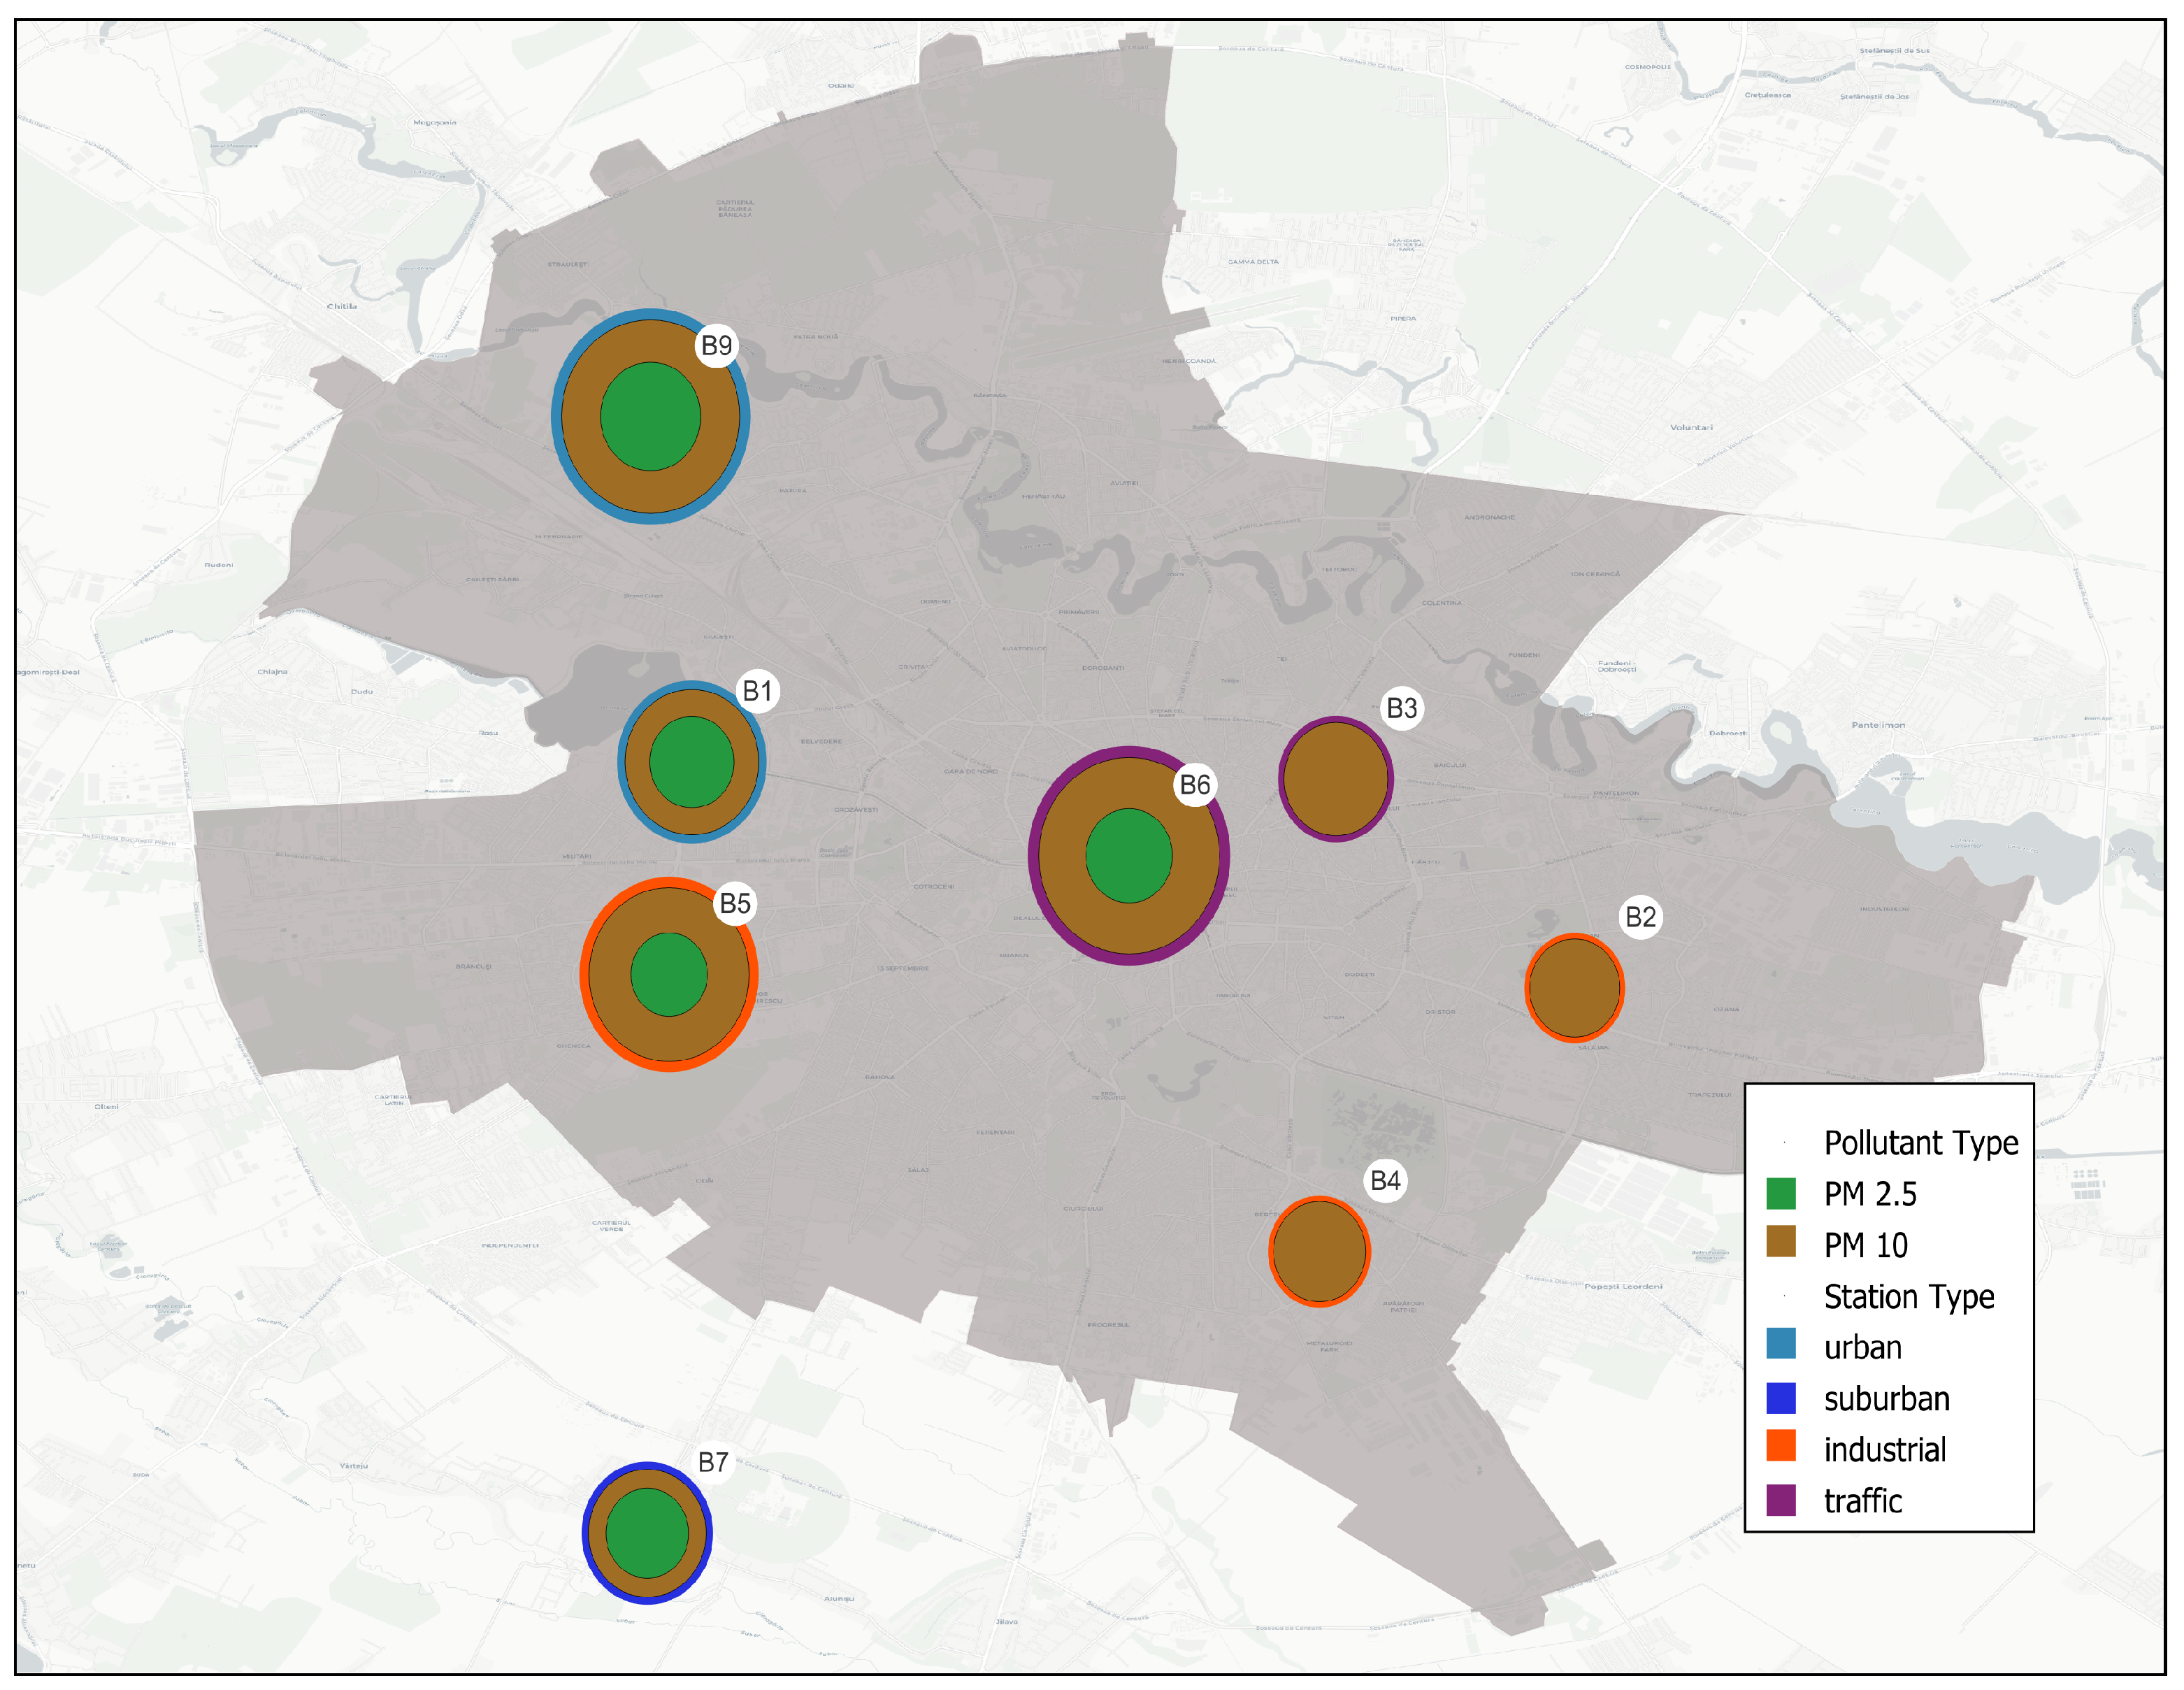
Figure 2 presents the percentage contribution of the average concentration over the 3-year period of PM2.5 and PM10, where the diameter of the circle is given by the value of the concentration and the color of the edge of the circle corresponds to the station type. The highest value of PM10 is measured at the traffic-type station, B6, located in the center of the capital, while the lowest concentration of PM10 is measured at the industrial-type station, B2. For PM2.5, the highest value is measured at the suburban station outside Bucharest, and the lowest value is measured at an industrial-type station, B5.
According to the data of the eight stations, the concentrations of PM 10  are higher in the west of Bucharest than in the east of the city. Northern Bucharest presents the highest concentrations of large particles. Although the PM2.5 data are missing for the stations in the east of Bucharest, B2, B3, and B4, it can be assessed that the stations outside the city or on its outskirts have the highest ratio of fine particles. The Măgurele station (B7) has the highest PM2.5 concentration, most probably due to the nearby agricultural areas and specific crops, as already identified by [39,51].
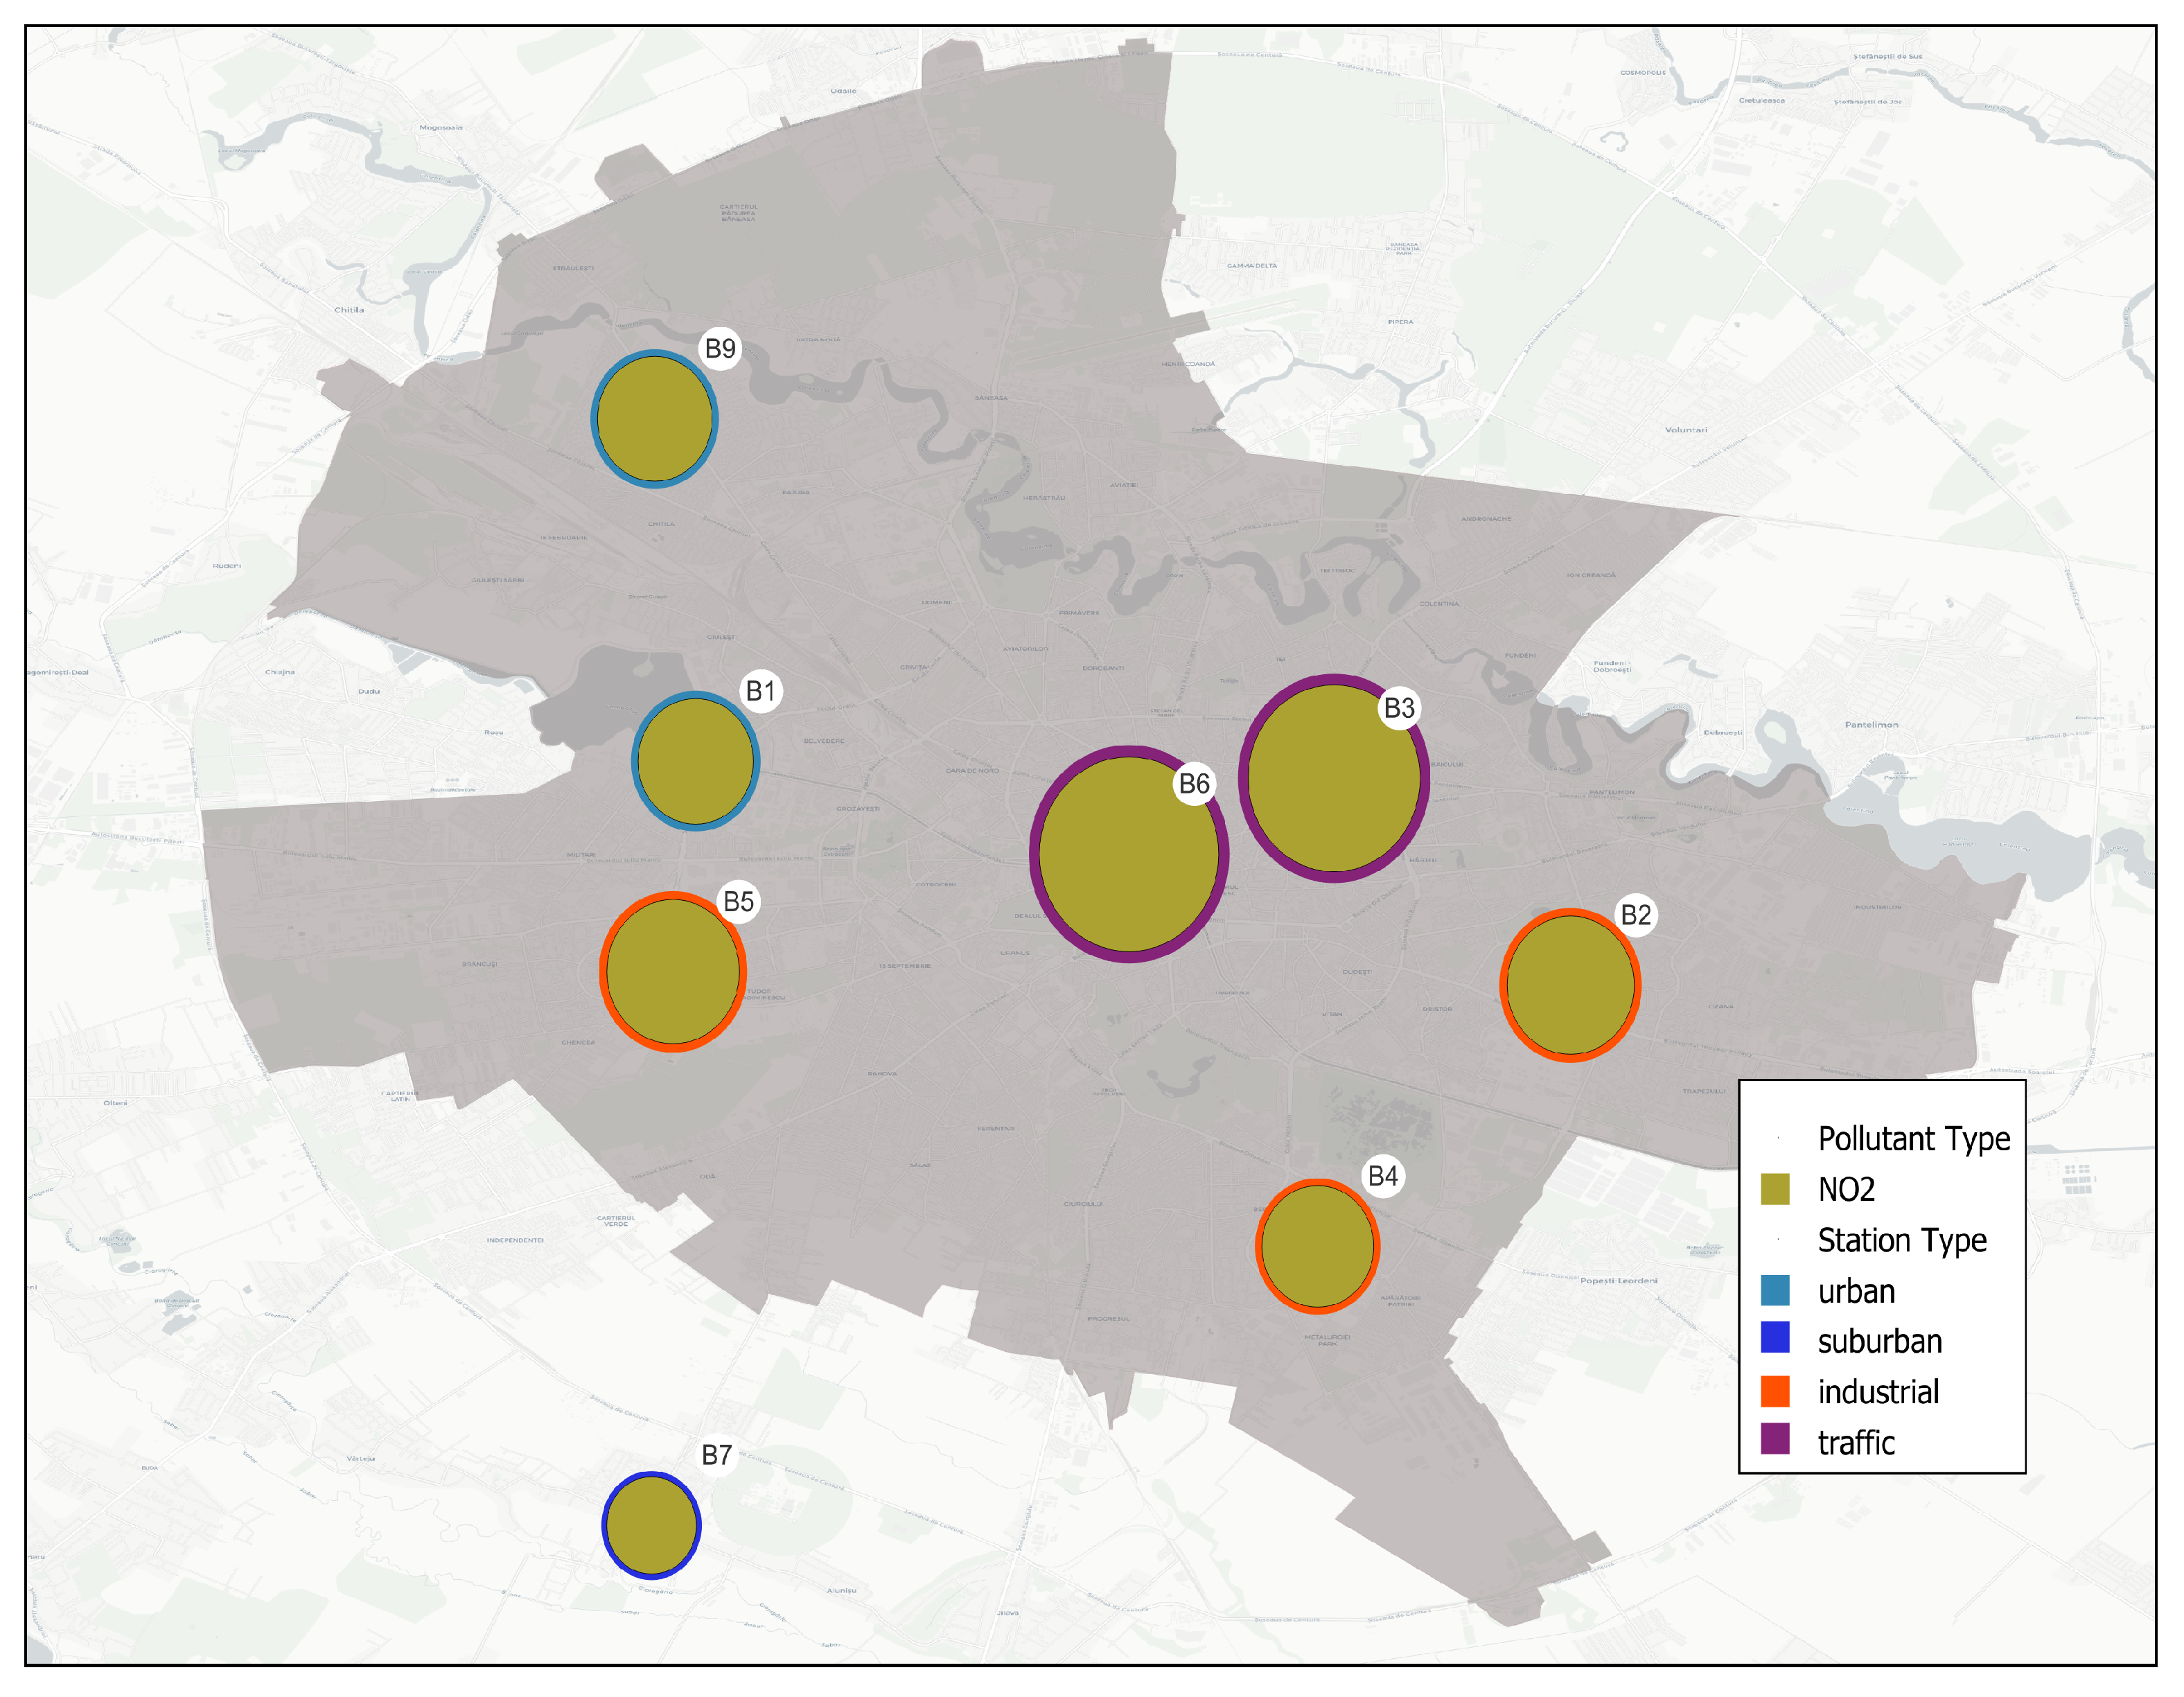
Figure 3 presents the variability of the average NO2 concentrations in the Bucharest area, with the size of the circle indicating the percentage contribution of the concentration. The highest concentrations of NO2 are recorded by two monitoring stations, B6 and B3, which are located in the city center, in areas with intense traffic. These stations are placed near major roads or busy intersections, where vehicle exhaust emissions can be significant during the day. Thus, the city center is characterized by high concentrations of NO2 and consequently increased air pollution.
On the other hand, high average values of NO2 concentrations are observed also in industrial and urban-type monitoring stations. Emissions from industrial facilities and road traffic may contribute to the higher NO2 levels in these areas. As expected, low values of NO2 concentrations are observed in the suburban monitoring station, due to the location in a less dense area in terms of traffic and industrial activity.
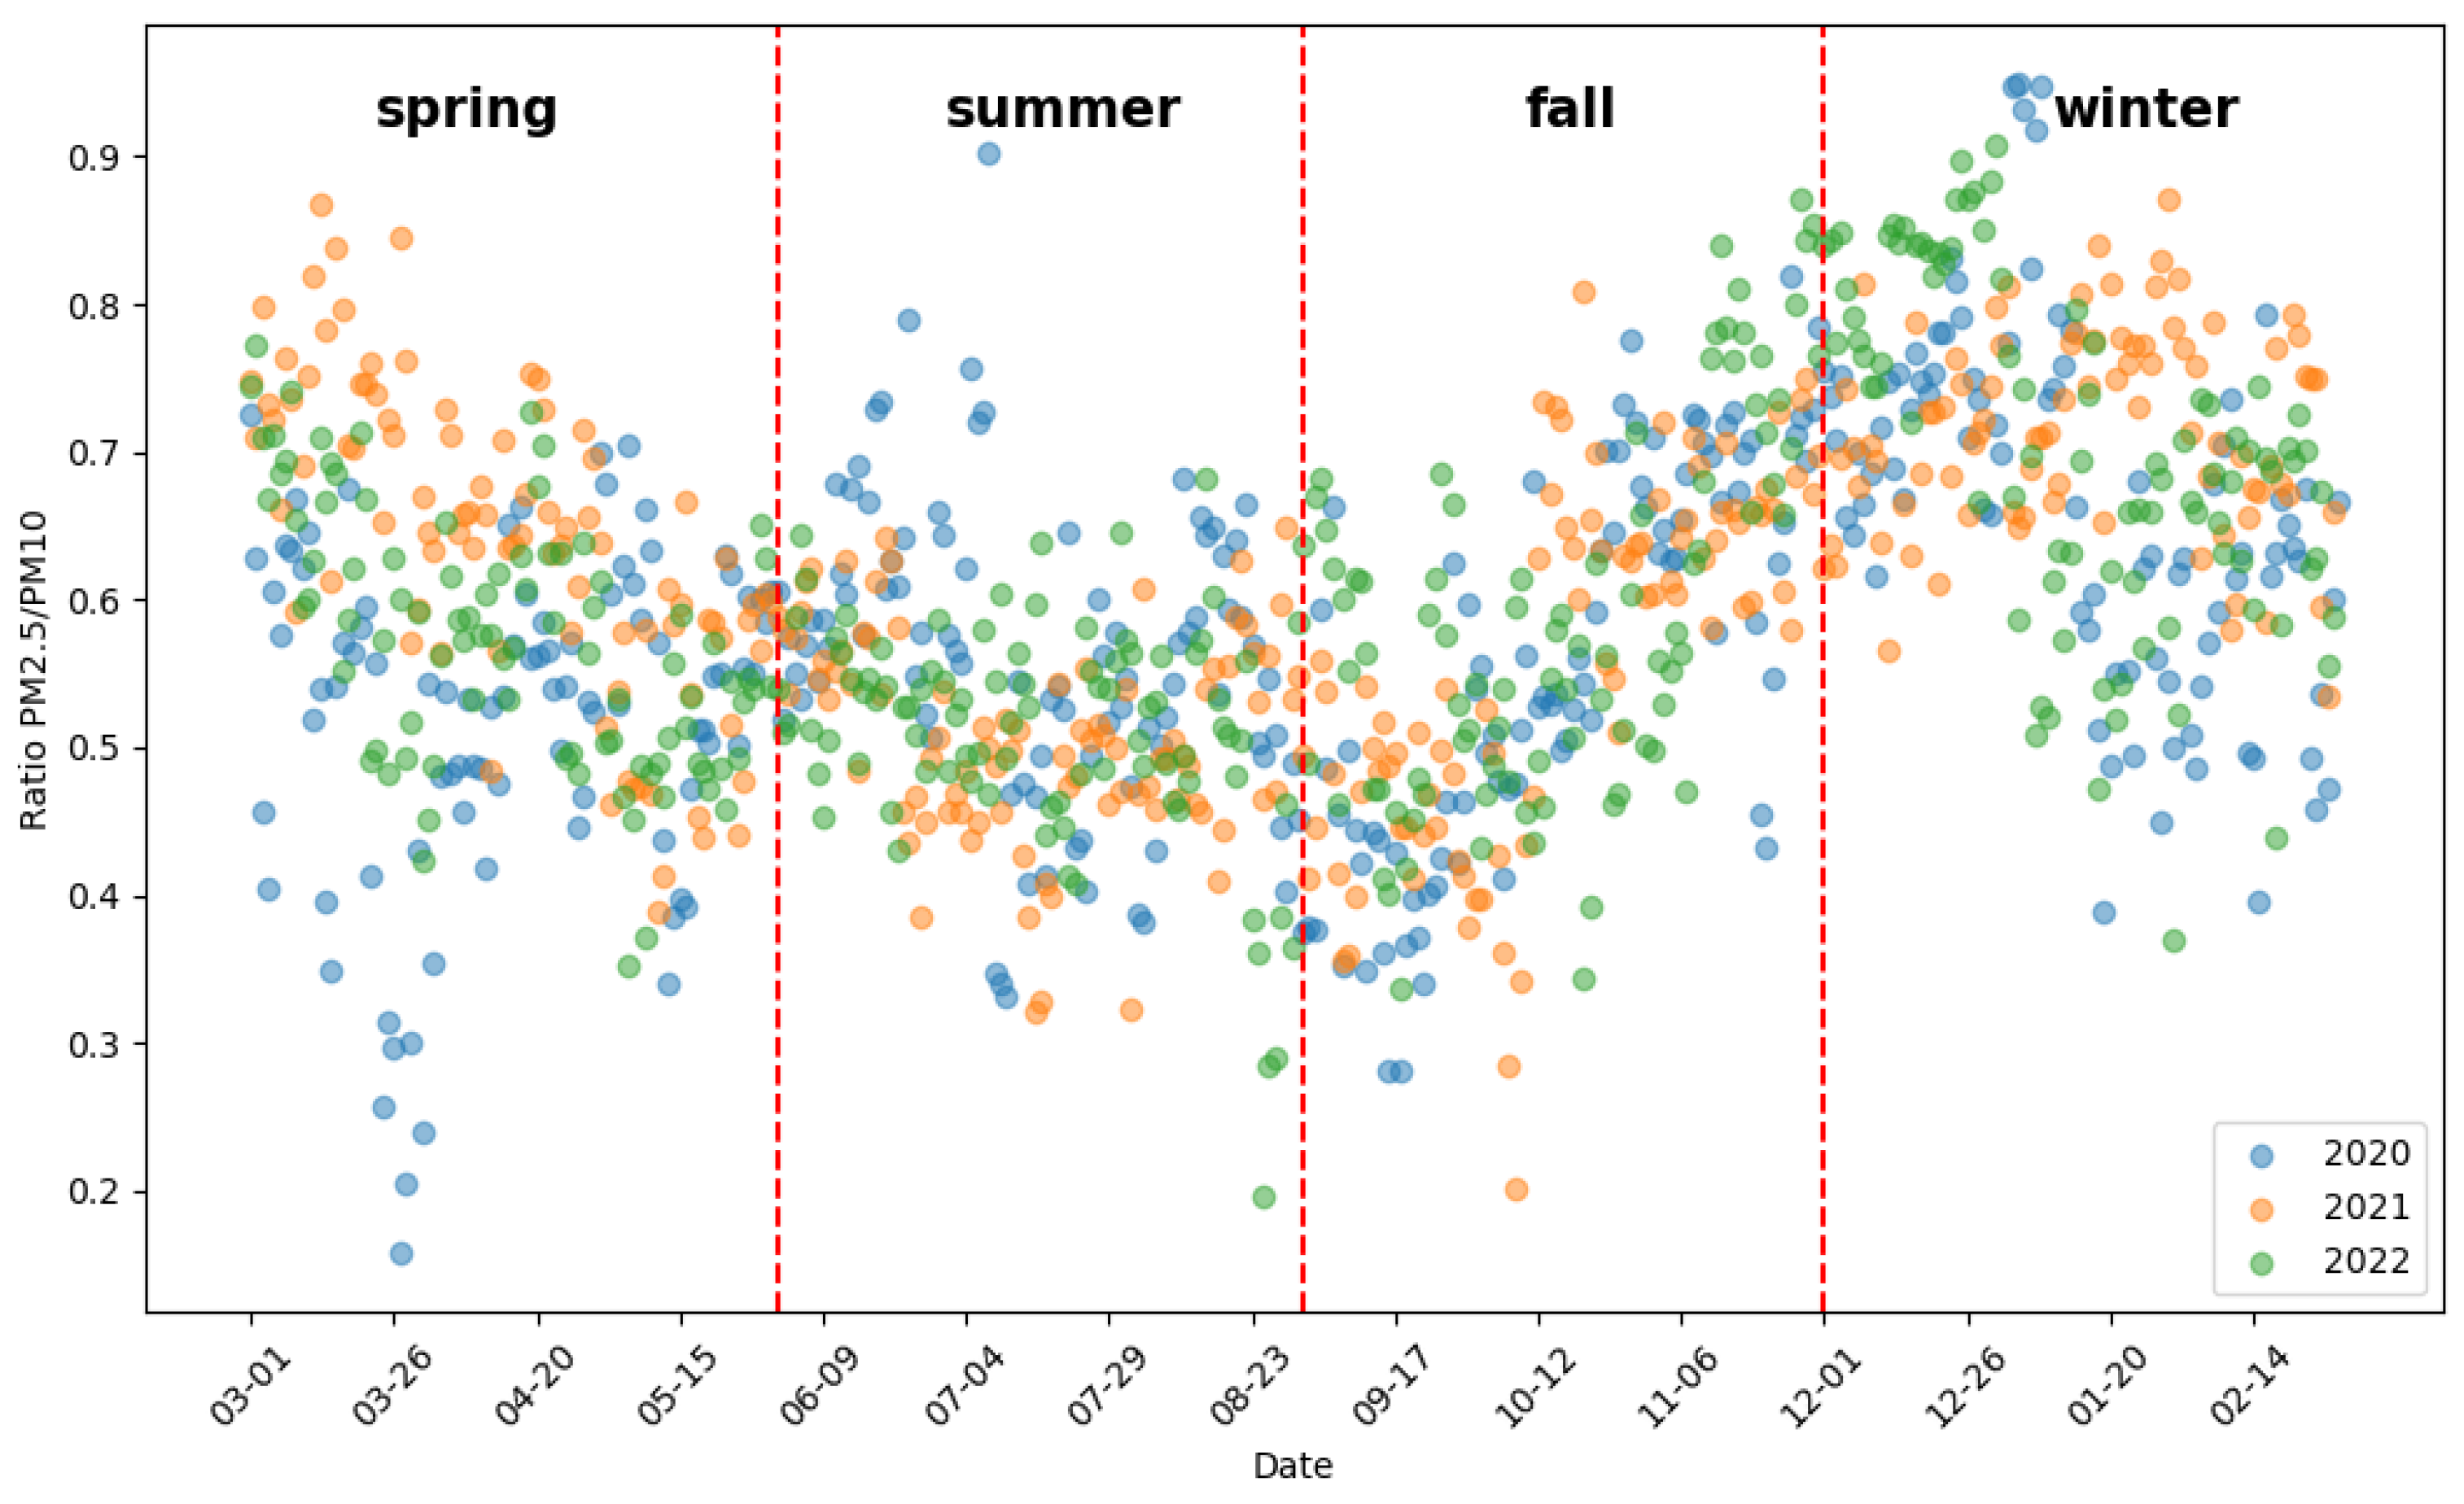
The seasonal variation in the fine particle fraction, represented by the ratio between PM2.5 and PM10 concentrations, is illustrated in Figure 4 for each year, averaged for all stations. An obvious monthly and seasonal trend is noticed, showing higher levels during the cold months than the warm months, mainly corresponding to the increased household heating. Seasonal fluctuations are intricately linked to changes in the height of the planetary boundary layer (PBL), which is directly influenced by variations in air temperature [52,53,54]. The highest fine particle fraction values occur in winter, with fine particles representing up to 90%, and the lowest values occur in March and September, with fine particle proportions around 20%. The lowest fine particle fraction values may be related to the high values of coarse particles due to frequent long-range dust transport in spring [36,55]. The high values of PM10 in March 2020 are most probably due to specific meteorological conditions. High temperatures, a lack of precipitation, and air mass circulation favor the transport of aerosols from anthropogenic sources from Central and Northeastern Europe [56]. Moreover, during spring and autumn, there is an increase in agricultural activity in the rural areas around Bucharest. This may include tillage, harvesting, and the burning of stubble or crop residues. These activities can contribute to increased concentrations of PM10 as larger particles such as dust and soil are released into the air. Moreover, the PM2.5 concentration increase may be determined by the agricultural activities, since the fine particle fraction is still significant, reaching up to 50%.
The fine particle proportion is smaller during summertime than during cold periods; the warm season is characterized by lower anthropogenic activity, high temperatures, and decreased pollutant emissions, with similar behavior being seen by Fan et al., 2021 [57]. The variation in the fine particle fraction is small from April to mid-September, ranging between 0.4 and 0.6, with the larger particles being predominant. The fraction has similar trends during these three years, with a slightly larger percentage of fine particles during winter–spring 2021 and December 2022. A greater percentage of larger particles was encountered during the spring of 2020.
Figure 5 illustrates the diurnal variation in the three atmospheric compounds along with the temperature during the 3-year period. The air pollutant concentrations at ground level and their dispersion in the troposphere are highly influenced by the planetary boundary layer height. In Bucharest, all air pollutants present a typical bimodal trend, with specific double peaks corresponding to the morning rush hours and nighttime, inversely correlated with the planetary boundary layer height and temperature variability. The diurnal bimodal trend of air pollutants is also characteristic of other cities [28,58].
Moreover, the diurnal variation in PM10 is strongly influenced by human activities, such as emissions from moving vehicles, construction, and industry, but also other anthropogenic sources. Activities such as heavy road traffic [59], construction work [60], and fossil fuel burning [61,62] lead to the release of large numbers of particles into the air, leading to an increase in the concentration of PM10. During rush hour, when traffic is heavy, the concentrations of PM10 can reach higher levels, due to the particle emissions from tire, brake, and road wear [63,64,65], as well as particles from fuel combustion.
Two distinct morning peaks are noticed, depending on the measurement area. The industrial sites are characterized by a morning peak at around 8 am, while traffic and urban sites are characterized by morning peaks at around 9 am. Nighttime peaks are similar for all measurement sites around Bucharest. The variation in the PM10 concentration during the day at the B6 site is smaller relative to the other stations, with the less pronounced peaks highlighting relatively constant traffic and sources during the daytime. A similar diurnal variation is noticed for the PM2.5 concentration in Bucharest.
The diurnal variation in NO2 presents also the bimodal trend, with peaks at 9 am due to the traffic hours and a second peak, more pronounced, at around 7 pm for the traffic stations and 8 pm for the urban and industrial ones. A more pronounced peak in the morning in comparison with the particle diurnal variation points out primary emissions due to traffic exhaust. The surroundings of traffic stations, B3 and B6, contribute to higher exposure to exhaust emissions, including NO2, which is a byproduct of combustion in internal combustion engines. A less pronounced diurnal pattern is specific to these areas, where the values of NO2 concentrations are higher during the entire daytime, with small peaks during the traffic hours when the number of moving cars is at its maximum. High variability in NO2 concentrations in the city center during midday can be observed, with concentration values almost double those for the background and industrial areas.
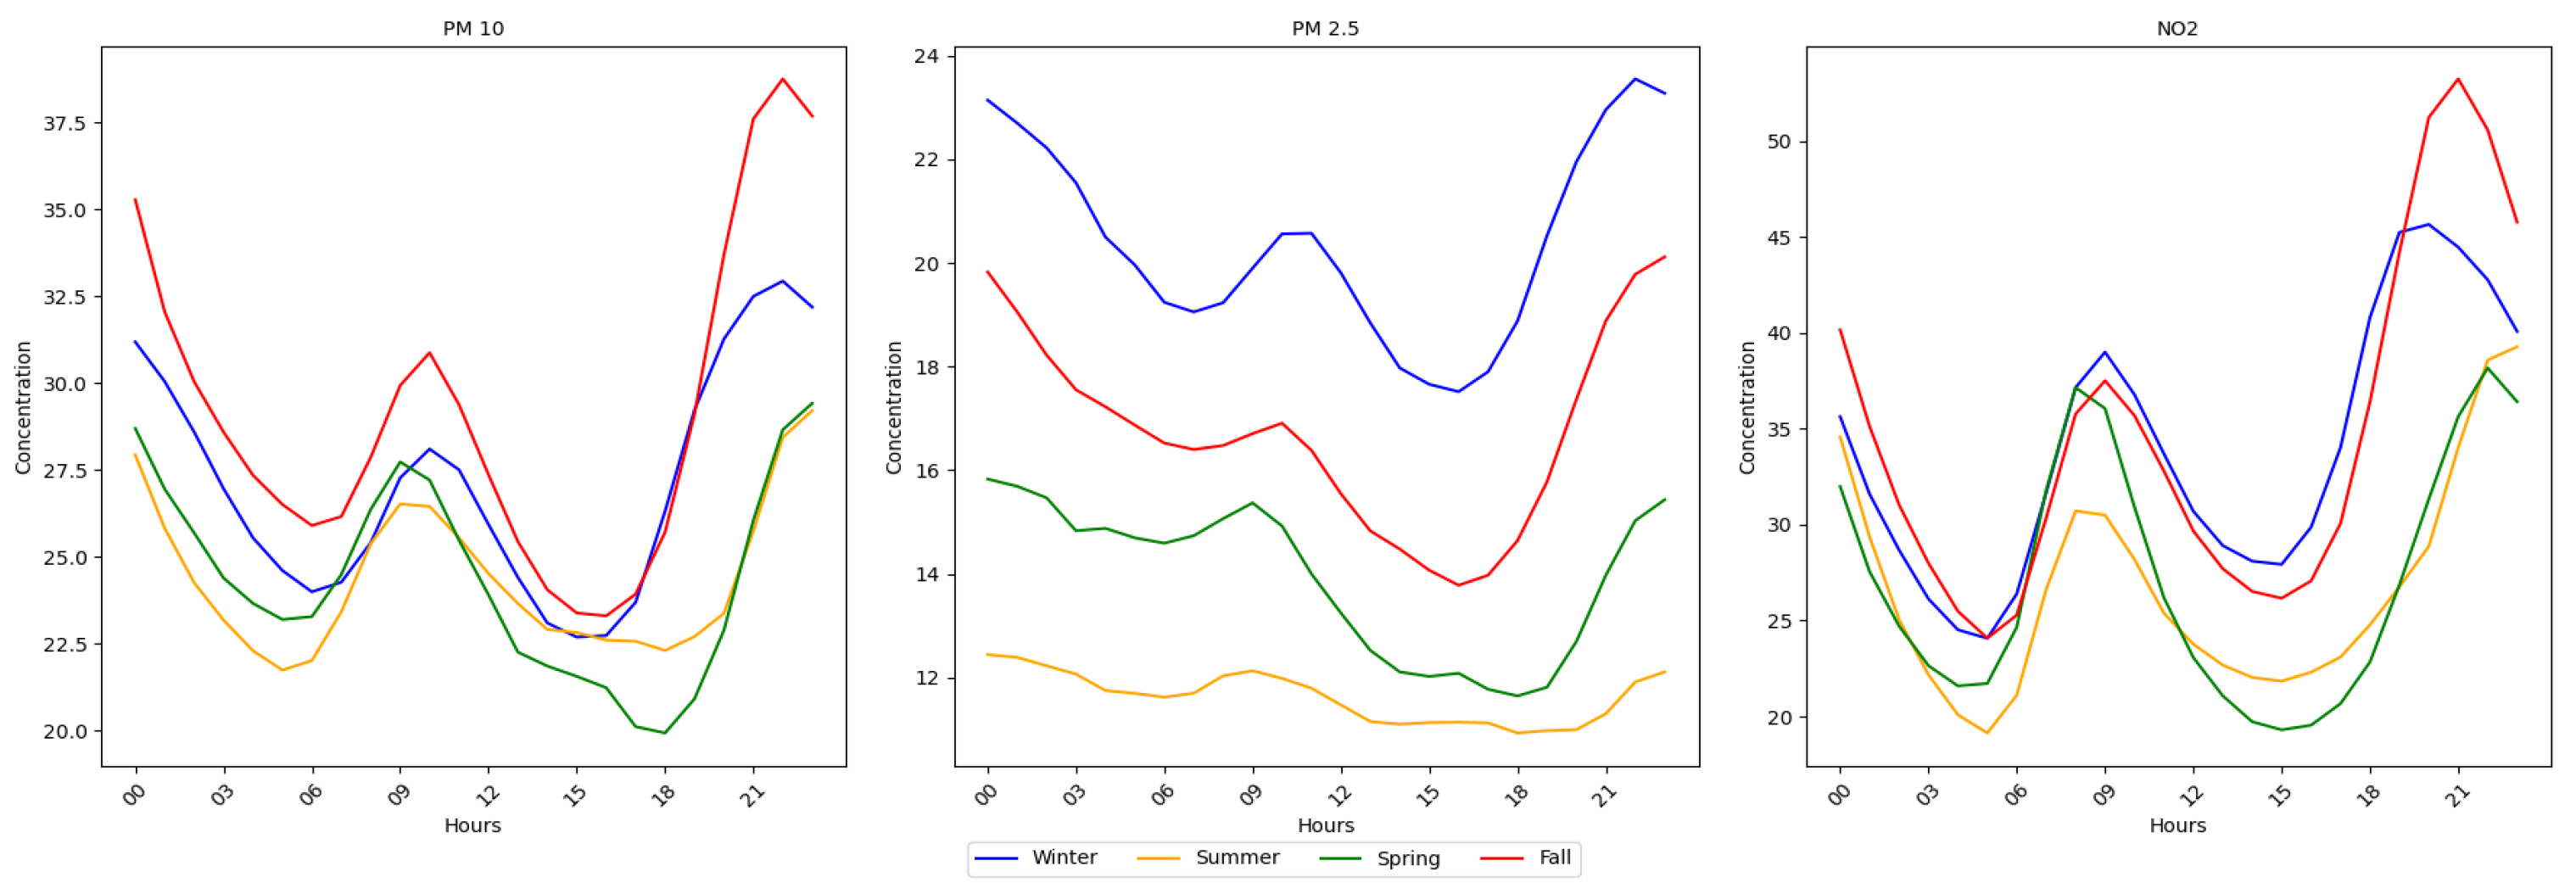
The diurnal seasonal variation analysis of atmospheric compounds across seasons is shown in Figure 6, highlighting a similar trend across all seasons. PM 10  concentrations have two peaks around 9 am and around 9 pm, with the highest averages occurring in fall and winter. As for PM 2.5 , the difference between seasons is much more pronounced, with values in winter almost twice as high as in the summer period, indicating a strong influence of household activities and home heating. A similar trend across seasons is evidenced in the case of NO 2  for the morning peak, while, starting in the afternoon, the winter and fall present a more pronounced peak, also identified in another city in Romania [66].
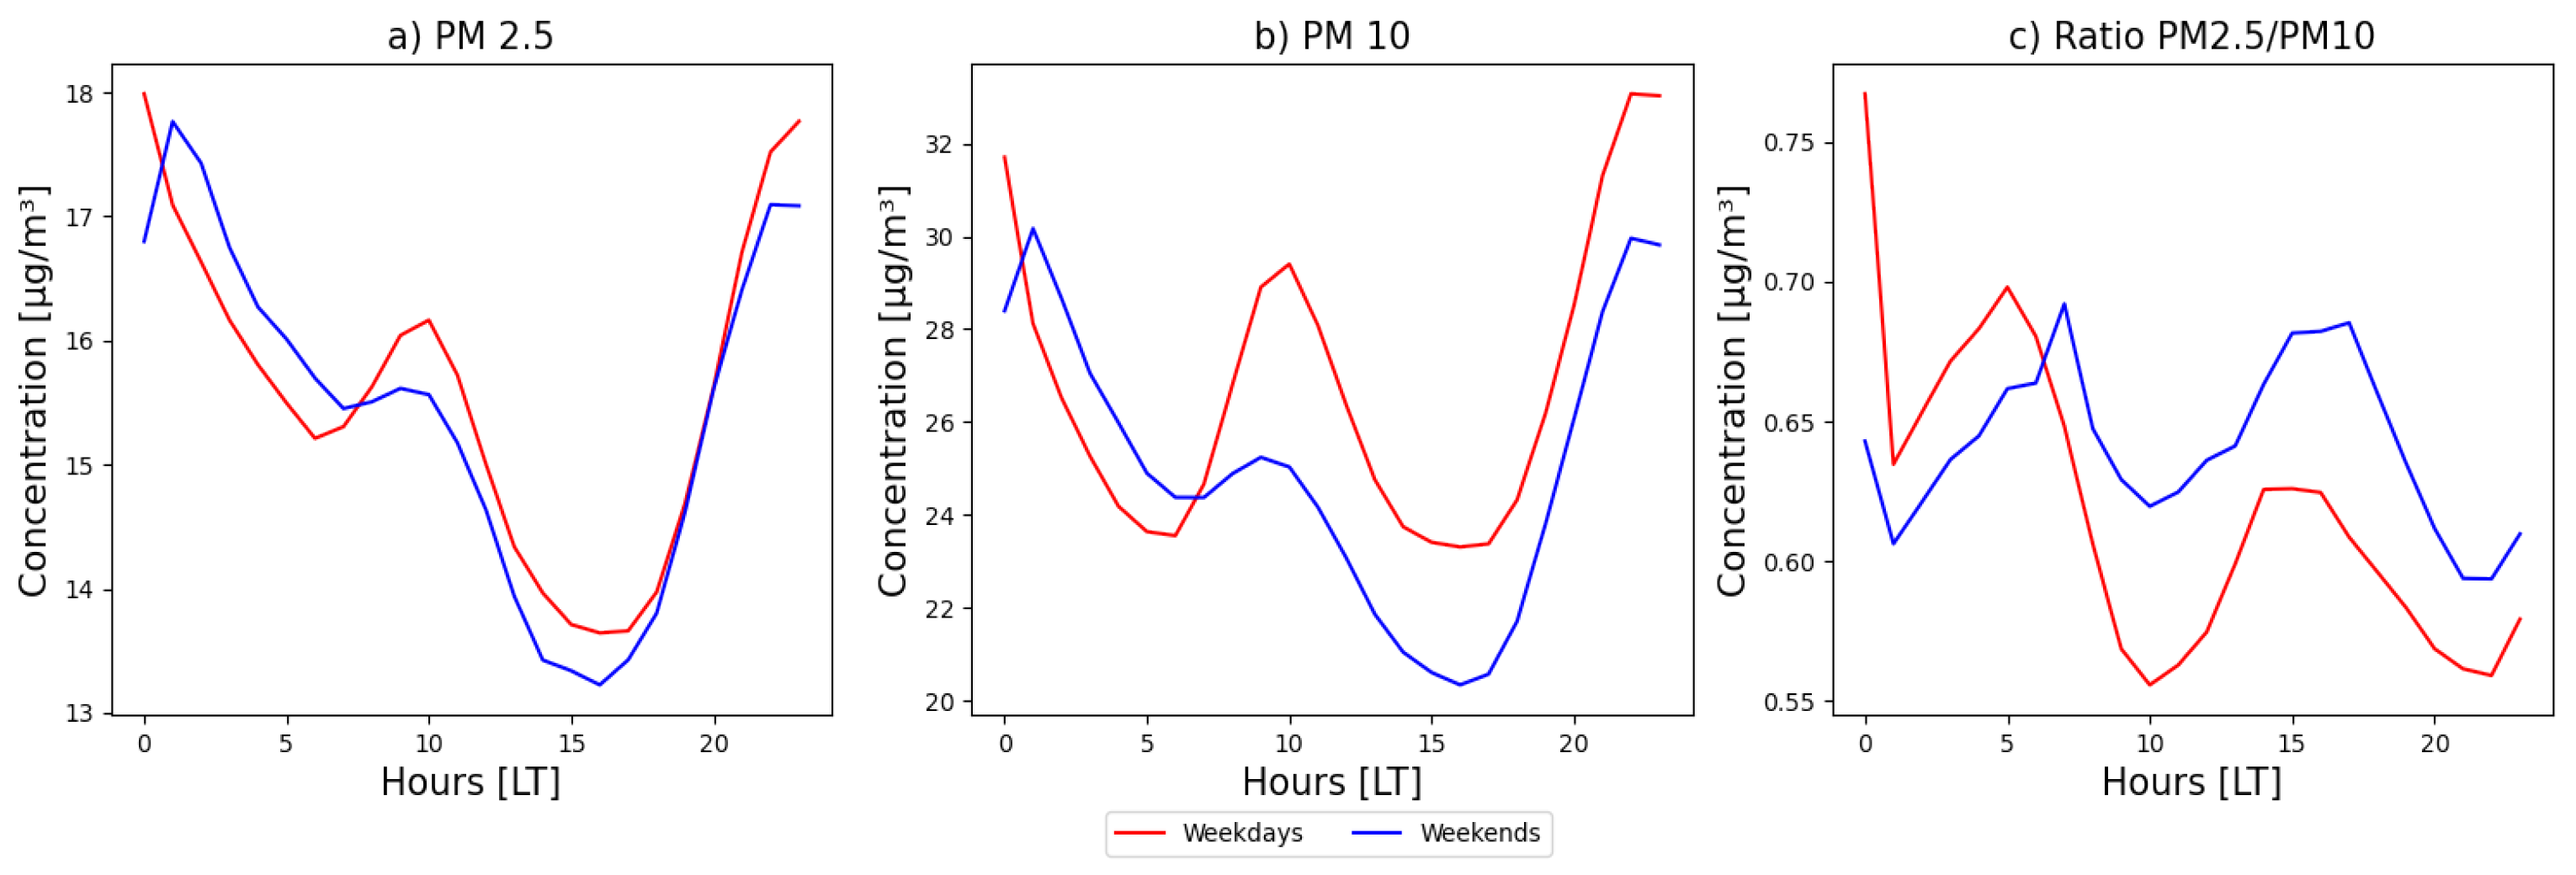
In general, the levels of PM exhibited a weekly pattern, with lower concentrations during the weekends in comparison to weekdays (Figure 7). This weekend effect was more pronounced for PM10 compared to PM2.5. During weekdays, the daily average concentrations of PM10 and PM2.5 ranged from 23.3 to 33.06  μ g/m 3  and 13.64 to 17.98  μ g/m 3 , respectively. On the other hand, during weekends, the concentrations were lower, in the ranges of 20.33 to 30.16  μ g/m 3  for PM10 and 13.22 to 17.76  μ g/m 3  for PM2.5. A similar pattern of a weekly effect in the case of particulate matter has been observed in Bucharest and, as depicted by Jiao et al. (2023), in France [28]. The weekday distribution indicates two distinct peaks in the data, corresponding to the morning rush hours and nighttime anthropogenic activities. On the other hand, the weekend distribution showed a less pronounced two-peak diurnal pattern, with one during nighttime, when household heating was likely the dominant factor influencing the PM10 and PM2.5 concentrations. The second peak was less pronounced due to a smaller effect during the morning. An overall lower average concentration on weekends than on weekdays is noticed, as depicted also in several cities [28,67].
Compared to weekdays, the significant decrease in PM10 levels observed during weekends indicates a reduction in traffic, sources from fossil fuel combustion, and road dust. The levels of fine particles (PM2.5) did not show significant reductions on weekends compared to weekdays, particularly during nighttime. The findings suggest that anthropogenic activities play a significant role in influencing the local air quality in the area, as also noticed in other cities [28]. The ratios of PM2.5/PM10 are increased from weekdays to weekends, indicating a potential contribution from anthropogenic sources to the elevated fine particle concentrations during weekend periods.
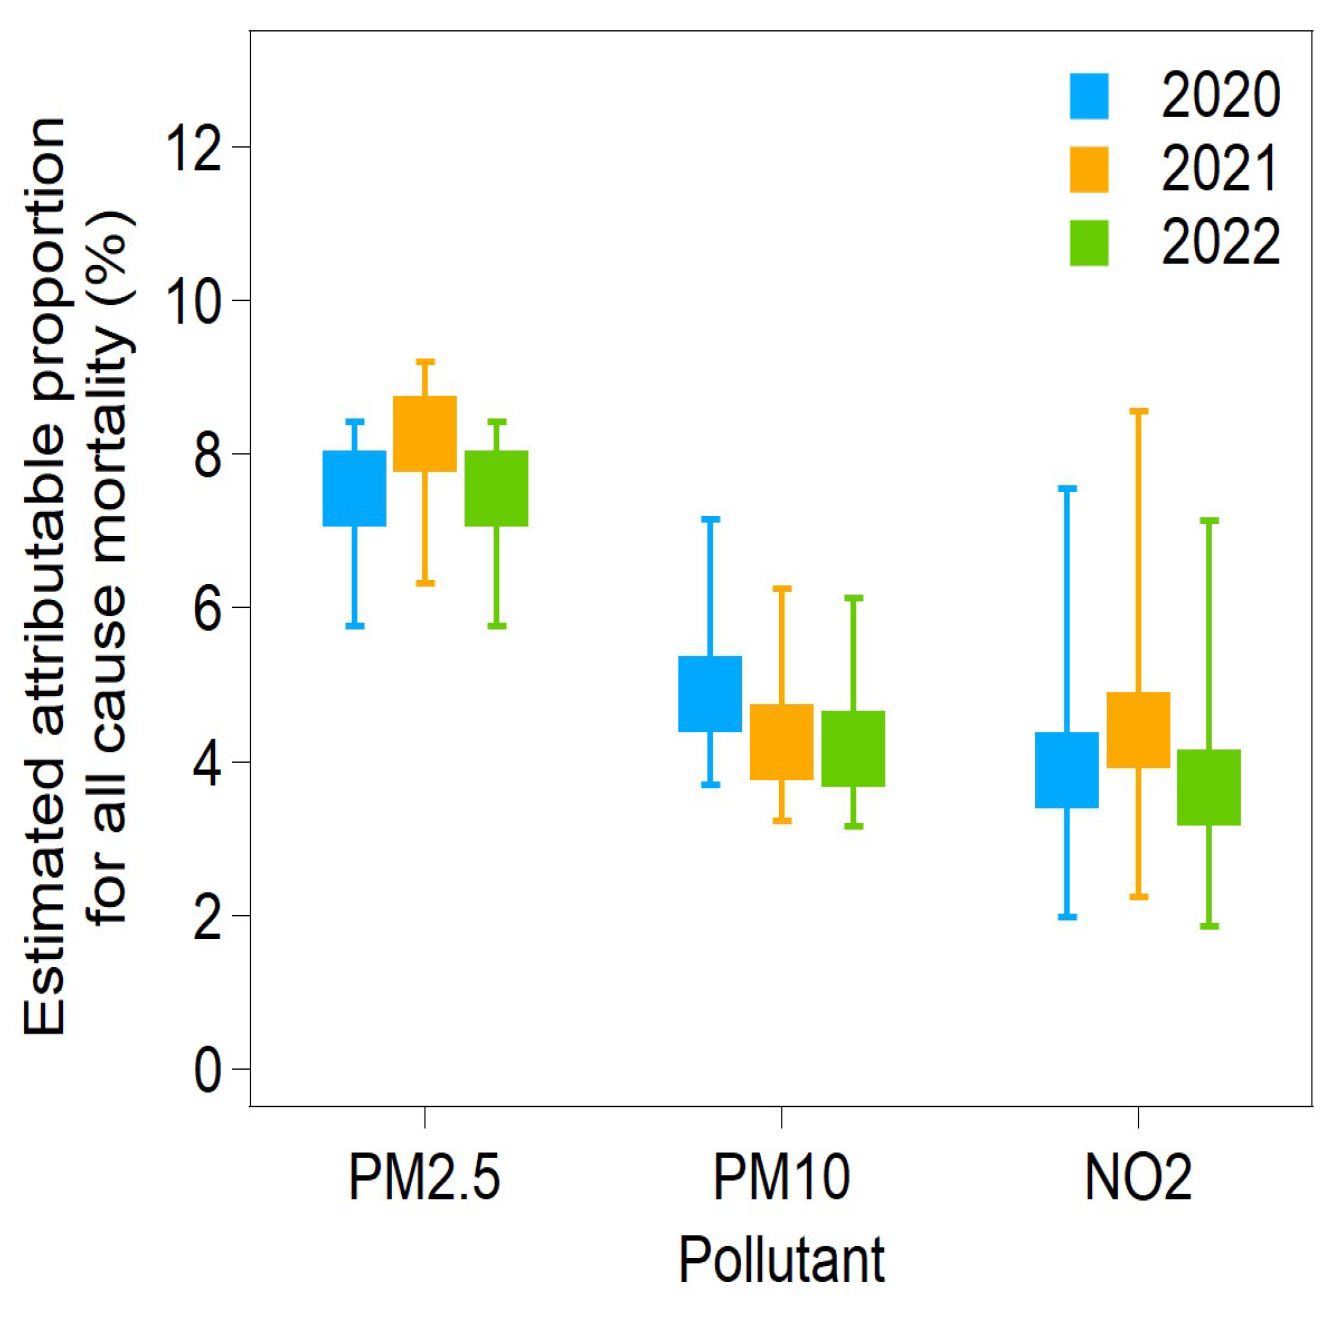
The analysis of the estimated proportion of mortality attributed to annual exposure to air pollutants above the WHO threshold provides valuable insights into the public health impact of air pollution in Bucharest. The findings, illustrated in Figure 8, explain the varying degrees of health risks associated with different air pollutants.
Looking at PM 2.5 , the results reveal an alarming proportion of mortality ranging from 7.55% to 8.26%. This means that a significant percentage of deaths in Bucharest are caused by long-term exposure to PM 2.5  concentrations above 5  μ g/m 3 . The estimated number of attributable cases, ranging from 1302 to 1425 within the target population, highlights the severity of the issue, with the highest proportion observed in 2021. Nevertheless, the mortality rates attributed to PM 2.5  concentrations are much lower than those indicated by recent studies performed in highly polluted areas [68,69] and other European cities [70,71].
In contrast, the proportion of mortality attributed to long-term exposure to PM 10  above 10  μ g/m 3  is notably lower, ranging from 4.16% to 4.87%. The corresponding estimated number of attributable cases, between 717 and 917 within the target population, indicates a less severe health impact compared to PM 2.5 . This clear difference between the PM 2.5  and PM 10  impacts highlights the importance of considering the particle size when assessing the health risks associated with air pollution.
It is worth noting that the lowest proportion of mortality is associated with NO 2  concentrations above 10  μ g/m 3 , ranging from 3.67% to 4.41%. This suggests that, among the pollutants considered, NO 2  poses a comparatively lower risk of mortality. However, the estimated number of attributable cases, ranging from 633 to 950 within the target population, still emphasizes the need for measures to mitigate the health impact of NO 2  exposure.

4. Conclusions

This variability study provides a detailed and comprehensive analysis of air quality fluctuations in Bucharest, Romania, over a three-year period from 2020 to 2022, encompassing all seasons. For this study, measurements of PM 10 , PM 2.5 , and NO 2  performed at eight stations of the Romanian National Air Quality Monitoring Network located in Bucharest were used.
Regarding the levels of particulate matter, it was observed that the western part of the city experiences a greater impact. Conversely, concerning NO2 pollution, the central area of the city is more significantly influenced.
The investigation revealed notable variations in the particulate matter and nitrogen dioxide concentrations across the Bucharest metropolitan region. Although the concentrations were within a similar range, specific increases were identified, predominantly in the city center. The results showed that air pollutants exhibit a characteristic bimodal pattern throughout the day, characterized by distinctive dual peaks corresponding to the morning rush hour and nighttime hours.
The investigation revealed the significant spatial variability in NO 2  concentrations. The concentrations in the city center during midday were almost double the ones observed in the background and industrial areas. Additionally, a discernible weekly pattern was noticed for particulate matter concentrations, with reduced levels during weekends as opposed to weekdays. This trend was more pronounced in the case of PM 10  than PM 2.5  concentrations.
The seasonal variation in the ratio of PM2.5 and PM10 highlighted the predominance of fine particles in the atmosphere during wintertime, due to the more intense activity of electro-thermal plants and apartment heating.
The analysis of the mortality rates associated with annual exposure to air pollutants in Bucharest above the thresholds set by WHO highlighted the larger proportion of mortality due to PM 2.5 , which is alarming and indicates a significant impact on public health. On the other hand, PM 10  and NO 2  have a lower impact on mortality, around 4%, indicating lower health risks.
In a broader context, this study significantly contributes to our understanding of air quality dynamics. It provides spatial insights into the distinct contributions of NO 2  and particulate matter across different areas within the city, while also emphasizing temporal variations during the day and changes over the seasons. These findings underline the need for targeted interventions aimed at mitigating air pollution, particularly in urban centers, and emphasize the importance of adopting seasonal adjustments to effectively manage air quality and protect public health.

Supplementary Materials

The following supporting information can be downloaded at https://www.mdpi.com/article/10.3390/atmos14121759/s1. Figure S1: Average diurnal variation of CO, SO 2  and O 3 , measured during 2020–2022; Figure S2: Weekend effect of average daily variation without the COVID-19 lockdown for PM 10 , PM 2.5  and Ratio PM 2.5 /PM 10 ; Figure S3: Average diurnal seasonal variation of PM 10 , PM 2.5  and NO 2 , measured during 2020–2022 without the COVID-19 lockdown period; Figure S4: Average diurnal variation of PM 10 , PM 2.5 , NO 2  and temperature, measured during 2020-2022 without the COVID-19 lockdown period.

Author Contributions

Conceptualization, A.I. and J.V.; methodology, A.I. and J.V.; software, A.I.; validation, A.I., J.V., C.T. and C.I.; formal analysis, A.I.; investigation, A.I. and J.V.; writing—original draft preparation, A.I. and J.V.; writing—review and editing, A.I., J.V., C.T., C.I. and A.N.; visualization, A.I. All authors have read and agreed to the published version of the manuscript.

Funding

This work was carried out through the Core Program within the National Research Development and Innovation Plan 2022–2027, carried out with the support of MCID, project no. PN 23 05; the Romanian Ministry of Research, Innovation and Digitalization, through Program 1—Development of the national research-development system, Subprogram 1.2—Institutional performance—Projects to finance the excellent RDI, Contract no. 18PFE/30.12.2021; the European Regional Development Fund through the Competitiveness Operational Programme 2014–2020; by the project Strengthen the participation of the ACTRIS-RO consortium in the pan-European research infrastructure ACTRIS, ACTRIS-ROC, MYSMIS code 107596 (ctr. no.337/2021); and by the RI-URBANS project (Research Infrastructures Services Reinforcing Air Quality Monitoring Capacities in European Urban & Industrial Areas, European Union’s Horizon 2020 research and innovation program under grant agreement, contract 101036245).

Institutional Review Board Statement

Not applicable.

Informed Consent Statement

Not applicable.

Data Availability Statement

The air quality data are available at https://www.calitateaer.ro/public/home-page (accessed on 9 October 2023).

Acknowledgments

We gratefully acknowledge the National Air Quality Monitoring Network (RNMCA), part of the Ministry of Environment, for providing essential air quality data, which significantly enriched our research. Their commitment to monitoring and sharing air quality information is invaluable, and we appreciate their contribution to our efforts in the characterization of urban air pollution, as well as the anonymous reviewers and editors for their time and effort to improve the paper. We wish to express our sincere appreciation to AirQ+, developed by the World Health Organization, for its invaluable contribution to the methodologies and data used in this work. The robust tools and insights provided by AirQ+ significantly enriched the depth and quality of the research presented. The authors also gratefully acknowledge the Romanian Institute of Statistics for providing invaluable data essential to this research.

Conflicts of Interest

The authors declare no conflict of interest.

References

  1. EEA. European City Air Quality Viewer. 2023. Available online: https://www.eea.europa.eu/themes/air/urban-air-quality/european-city-air-quality-viewer (accessed on 15 May 2023).
  2. Bodor, Z.; Bodor, K.; Keresztesi, Á.; Szép, R. Major air pollutants seasonal variation analysis and long-range transport of PM 10 in an urban environment with specific climate condition in Transylvania (Romania). Environ. Sci. Pollut. Res. 2020, 27, 38181–38199. [Google Scholar] [CrossRef] [PubMed]
  3. Grobéty, B.; Gieré, R.; Dietze, V.; Stille, P. Airborne particles in the urban environment. Elements 2010, 6, 229–234. [Google Scholar] [CrossRef]
  4. Mukherjee, A.; Agrawal, M. World air particulate matter: Sources, distribution and health effects. Environ. Chem. Lett. 2017, 15, 283–309. [Google Scholar] [CrossRef]
  5. Kim, B.M.; Park, J.S.; Kim, S.W.; Kim, H.; Jeon, H.; Cho, C.; Kim, J.H.; Hong, S.; Rupakheti, M.; Panday, A.K.; et al. Source apportionment of PM10 mass and particulate carbon in the Kathmandu Valley, Nepal. Atmos. Environ. 2015, 123, 190–199. [Google Scholar] [CrossRef]
  6. Pascal, M.; Falq, G.; Wagner, V.; Chatignoux, E.; Corso, M.; Blanchard, M.; Host, S.; Pascal, L.; Larrieu, S. Short-term impacts of particulate matter (PM10, PM10-2.5, PM2.5) on mortality in nine French cities. Atmos. Environ. 2014, 95, 175–184. [Google Scholar] [CrossRef]
  7. Alberts, W.M. Indoor air pollution: NO, NO2, CO, and CO2. J. Allergy Clin. Immunol. 1994, 94, 289–295. [Google Scholar] [CrossRef] [PubMed]
  8. Salonen, H.; Salthammer, T.; Morawska, L. Human exposure to NO2 in school and office indoor environments. Environ. Int. 2019, 130, 104887. [Google Scholar] [CrossRef]
  9. Nazari, S.; Shahhoseini, O.; Sohrabi-Kashani, A.; Davari, S.; Sahabi, H.; Rezaeian, A. SO2 pollution of heavy oil-fired steam power plants in Iran. Energy Policy 2012, 43, 456–465. [Google Scholar] [CrossRef]
  10. Hung, Y.T.; Ashner, I. Sulfur Dioxide Emission and Mitigation. In Handbook of Environment and Waste Management: Acid Rain and Greenhouse Gas Pollution Control; World Scientific: Singapore, 2020; pp. 627–658. [Google Scholar]
  11. Sicard, P. Ground-level ozone over time: An observation-based global overview. Curr. Opin. Environ. Sci. Health 2021, 19, 100226. [Google Scholar] [CrossRef]
  12. Badr, O.; Probert, S. Sources of atmospheric carbon monoxide. Appl. Energy 1994, 49, 145–195. [Google Scholar] [CrossRef]
  13. EEA. Air Quality Standards. 2021. Available online: https://www.eea.europa.eu/themes/air/air-quality-concentrations/air-quality-standards (accessed on 20 June 2023).
  14. WHO. WHO Global Air Quality Guidelines: Particulate Matter (PM2.5 and PM10), Ozone, Nitrogen Dioxide, Sulfur Dioxide and Carbon Monoxide: Executive Summary. 2021. Available online: https://who.int/publications/i/item/9789240034228 (accessed on 17 May 2023).
  15. Pope, C.A., III; Dockery, D.W. Health effects of fine particulate air pollution: Lines that connect. J. Air Waste Manag. Assoc. 2006, 56, 709–742. [Google Scholar] [CrossRef] [PubMed]
  16. Carvalho, H. Air pollution-related deaths in Europe–time for action. J. Glob. Health 2019, 9, 020308. [Google Scholar] [CrossRef] [PubMed]
  17. Sicard, P.; Agathokleous, E.; De Marco, A.; Paoletti, E.; Calatayud, V. Urban population exposure to air pollution in Europe over the last decades. Environ. Sci. Eur. 2021, 33, 28. [Google Scholar] [CrossRef] [PubMed]
  18. Katsouyanni, K.; Touloumi, G.; Samoli, E.; Gryparis, A.; Le Tertre, A.; Monopolis, Y.; Rossi, G.; Zmirou, D.; Ballester, F.; Boumghar, A.; et al. Confounding and effect modification in the short-term effects of ambient particles on total mortality: Results from 29 European cities within the APHEA2 project. Epidemiology 2001, 521–531. [Google Scholar] [CrossRef] [PubMed]
  19. EEA. Health Impacts of Air Pollution in Europe. 2022. Available online: https://www.eea.europa.eu/publications/air-quality-in-europe-2022/health-impacts-of-air-pollution (accessed on 19 June 2023).
  20. EPA. Risk Assessment Guidance for Superfund. Volume I: Human Health Evaluation Manual (Part A); Technical report; EPA/540/1-89/002; Office of Emergency and Remedial Response, U.S. Environmental Protection Agency: Washington, DC, USA, 1989.
  21. Alpopi, C.; Colesca, S.E. Urban air quality. A comparative study of major European capitals. Theor. Empir. Res. Urban Manag. 2010, 5, 92–107. [Google Scholar]
  22. Cohen, A.J.; Anderson, H.R.; Ostro, B.; Pandey, K.D.; Krzyzanowski, M.; Künzli, N.; Gutschmidt, K.; Pope, C.A., III; Romieu, I.; Samet, J.M.; et al. Urban air pollution. In Comparative Quantification of Health Risks: Global and Regional Burden of Disease Attributable to Selected Major Risk Factors; World Health Organization: Geneva, Switzerland, 2004; Volume 2, pp. 1353–1433. [Google Scholar]
  23. Seinfeld, J.H. Urban air pollution: State of the science. Science 1989, 243, 745–752. [Google Scholar] [CrossRef]
  24. Lotrecchiano, N.; Sofia, D. Analysis of the Air Quality of a District Heating System with a Biomass Plant. Atmosphere 2022, 13, 1636. [Google Scholar] [CrossRef]
  25. Kahya, C.; Balcik, F.B.; Oztaner, Y.B.; Ozcomak, D.; Seker, D.Z. Spatio-temporal analysis of PM2. 5 over Marmara region, Turkey. Fresenius Environ. Bull. 2017, 26, 310–317. [Google Scholar]
  26. Vlachokostas, C.; Achillas, C.; Moussiopoulos, N.; Kalogeropoulos, K.; Sigalas, G.; Kalognomou, E.A.; Banias, G. Health effects and social costs of particulate and photochemical urban air pollution: A case study for Thessaloniki, Greece. Air Qual. Atmos. Health 2012, 5, 325–334. [Google Scholar] [CrossRef]
  27. Wang, F.; Ketzel, M.; Ellermann, T.; Wåhlin, P.; Jensen, S.; Fang, D.; Massling, A. Particle number, particle mass and NO x emission factors at a highway and an urban street in Copenhagen. Atmos. Chem. Phys. 2010, 10, 2745–2764. [Google Scholar] [CrossRef]
  28. Jiao, Y.; Ren, Y.; Laroussi, W.; Robin, C.; De Filippis, A.; Bordier, F.; Rangognio, J.; Yahyaoui, A.; Favez, O.; Mellouki, A. Tracking changes in atmospheric particulate matter at a semi-urban site in Central France over the past decade. Sci. Total Environ. 2023, 885, 163807. [Google Scholar] [CrossRef] [PubMed]
  29. Favez, O.; Weber, S.; Petit, J.E.; Alleman, L.Y.; Albinet, A.; Riffault, V.; Chazeau, B.; Amodeo, T.; Salameh, D.; Zhang, Y.; et al. Overview of the French operational network for in situ observation of PM chemical composition and sources in urban environments (CARA program). Atmosphere 2021, 12, 207. [Google Scholar] [CrossRef]
  30. Proorocu, M.; Odagiu, A.; Oroian, I.G.; Ciuiu, G.; Dan, V. Particulate matter status in romanian urban areas: PM10 pollution levels in bucharest. Environ. Eng. Manag. J. (EEMJ) 2014, 13, 3115–3122. [Google Scholar] [CrossRef]
  31. Rusanescu, C.O.; Jinescu, C.; Rusanescu, M.; Begea, M.; Ghermec, O. Evaluation of air pollution by NO2, SO2, PM10 in Bucharest. Rev. Chim. 2018, 69, 105–111. [Google Scholar] [CrossRef]
  32. Bucur, E.; Danet, A.F. Particulate matter and polycyclic aromatic hydrocarbon air pollution in areas of Bucharest with heavy road traffic. Rev. Chim. 2016, 67, 621–625. [Google Scholar]
  33. Marmureanu, L.; Vasilescu, J.; Marin, C.; Ene, D. Aerosol source assessment based on organic chemical markers. Rev. Chim. 2017, 68, 853–857. [Google Scholar] [CrossRef]
  34. Vasilescu, J.; Marmureanu, L.; Nemuc, A.; Nicolae, D.; Talianu, C. Seasonal variation of the aerosol chemical composition in a romanian peri-urban area. Environ. Eng. Manag. J. (EEMJ) 2017, 16, 2491–2496. [Google Scholar]
  35. Marmureanu, L.; Vasilescu, J.; Stefanie, H.; Talianu, C. Chemical and optical characterization of submicronic aerosol sources. Environ. Eng. Manag. J. (EEMJ) 2017, 16, 2165–2172. [Google Scholar] [CrossRef]
  36. Carstea, E.; Fragkos, K.; Siomos, N.; Antonescu, B.; Belegante, L. Columnar aerosol measurements in a continental southeastern Europe site: Climatology and trends. Theor. Appl. Climatol. 2019, 137, 3149–3159. [Google Scholar] [CrossRef]
  37. RNMCA. National Network for Monitoring Air Quality. 2023. Available online: https://www.calitateaer.ro/public/home-page/ (accessed on 19 June 2023).
  38. European Comission. Air Quality: Commission Decides to Refer Romania to the Court of Justice of the European Union for Failure to Comply with EU Clean Air and Industrial Emissions Legislation. 2023. Available online: https://ec.europa.eu/commission/presscorner/detail/en/ip_21_6264 (accessed on 2 October 2023).
  39. Mărmureanu, L.; Vasilescu, J.; Slowik, J.; Prévôt, A.S.; Marin, C.A.; Antonescu, B.; Vlachou, A.; Nemuc, A.; Dandocsi, A.; Szidat, S. Online Chemical Characterization and Source Identification of Summer and Winter Aerosols in Măgurele, Romania. Atmosphere 2020, 11, 385. [Google Scholar] [CrossRef]
  40. Iorga, G. Air Pollution and Environmental Policies, EU and Romania: Where We Stand, What the Data Reveals, What Should Be Done in the Future? In Europeanization of Environmental Policies and their Limitations: Capacity Building; Springer: Berlin/Heidelberg, Germany, 2021; pp. 51–73. [Google Scholar]
  41. Tumanov, S.; Stan-Sion, A.; Lupu, A.; Soci, C.; Oprea, C. Influences of the city of Bucharest on weather and climate parameters. Atmos. Environ. 1999, 33, 4173–4183. [Google Scholar] [CrossRef]
  42. Fenger, J.; Hertel, O.; Palmgren, F. Urban Air Pollution—European Aspects; Springer Science & Business Media: Berlin/Heidelberg, Germany, 1999; Volume 1. [Google Scholar]
  43. Grønskei, K.E. Europe and its cities. In Urban Air Pollution—European Aspects; Springer: Berlin/Heidelberg, Germany, 1998; pp. 21–32. [Google Scholar]
  44. Rodríguez-Urrego, D.; Rodríguez-Urrego, L. Air quality during the COVID-19: PM2.5 analysis in the 50 most polluted capital cities in the world. Environ. Pollut. 2020, 266, 115042. [Google Scholar] [CrossRef] [PubMed]
  45. Lin, C.; Huang, R.J.; Ceburnis, D.; Buckley, P.; Preissler, J.; Wenger, J.; Rinaldi, M.; Facchini, M.C.; O’Dowd, C.; Ovadnevaite, J. Extreme air pollution from residential solid fuel burning. Nat. Sustain. 2018, 1, 512–517. [Google Scholar] [CrossRef]
  46. Iorga, G. Air pollution monitoring: A case study from Romania. In Air Quality: Measurement and Modeling; IntechOpen: London, UK, 2016. [Google Scholar] [CrossRef]
  47. QGIS Development Team. QGIS Geographic Information System; QGIS Association: Gossau, Switzerland, 2023. [Google Scholar]
  48. World Health Organization. Health Impact Assessment of Air Pollution: Introductory Manual to AirQ+; Technical report; World Health Organization, Regional Office for Europe: Copenhagen, Denmark, 2020. [Google Scholar]
  49. INSSE. Romanian National Institute of Statistics. 2023. Available online: http://statistici.insse.ro:8077/tempo-online (accessed on 31 October 2023).
  50. Pushpawela, B.; Shelton, S.; Liyanage, G.; Jayasekara, S.; Rajapaksha, D.; Jayasundara, A.; Das Jayasuriya, L. Changes of Air Pollutants in Urban Cities during the COVID-19 Lockdown-Sri Lanka; Aerosol and Air Quality Research: Taoyuan, Taiwan, 2023. [Google Scholar] [CrossRef]
  51. Vasilescu, J.; Nemuc, A.; Marmureanu, L.; Nicolae, D. Aerosol size distribution and composition near bucharest during may 2010. Environ. Eng. Manag. J. (EEMJ) 2011, 10, 121–126. [Google Scholar] [CrossRef]
  52. Zhang, Y.; Seidel, D.J.; Zhang, S. Trends in planetary boundary layer height over Europe. J. Clim. 2013, 26, 10071–10076. [Google Scholar] [CrossRef]
  53. Jänicke, B.; Meier, F.; Fenner, D.; Fehrenbach, U.; Holtmann, A.; Scherer, D. Urban–rural differences in near-surface air temperature as resolved by the Central Europe Refined analysis (CER): Sensitivity to planetary boundary layer schemes and urban canopy models. Int. J. Climatol. 2017, 37, 2063–2079. [Google Scholar] [CrossRef]
  54. Zhang, Y.; Yong, X.; Zhou, H.; Gao, H.; Yang, N. Characteristics of atmospheric boundary layer structure and its influencing factors under different sea and land positions in Europe. Earth Planet. Phys. 2023, 7, 257–268. [Google Scholar] [CrossRef]
  55. Nemuc, A.; Vasilescu, J.; Talianu, C.; Belegante, L.; Nicolae, D. Assessment of aerosol’s mass concentrations from measured linear particle depolarization ratio (vertically resolved) and simulations. Atmos. Meas. Tech. 2013, 6, 3243–3255. [Google Scholar] [CrossRef]
  56. Talianu, C.; Vasilescu, J.; Marmureanu, L.; Belegante, L. Quantification of black carbon anthropogenic changes over Bucharest during COVID-19 lock-down based on similarity of aerosol transport patterns. In Proceedings of the 2021 European Aerosol Conference, Birmingham, UK, 30 August–3 September 2021. [Google Scholar]
  57. Fan, H.; Zhao, C.; Yang, Y.; Yang, X. Spatio-temporal variations of the PM2.5/PM10 ratios and its application to air pollution type classification in China. Front. Environ. Sci. 2021, 9, 692440. [Google Scholar] [CrossRef]
  58. Shelton, S.; Liyanage, G.; Jayasekara, S.; Pushpawela, B.; Rathnayake, U.; Jayasundara, A.; Jayasooriya, L.D. Seasonal Variability of Air Pollutants and Their Relationships to Meteorological Parameters in an Urban Environment. Adv. Meteorol. 2022, 2022, 5628911. [Google Scholar] [CrossRef]
  59. Charron, A.; Harrison, R.M. Fine (PM2.5) and coarse (PM2.5-10) particulate matter on a heavily trafficked London highway: Sources and processes. Environ. Sci. Technol. 2005, 39, 7768–7776. [Google Scholar] [CrossRef]
  60. Faber, P.; Drewnick, F.; Borrmann, S. Aerosol particle and trace gas emissions from earthworks, road construction, and asphalt paving in Germany: Emission factors and influence on local air quality. Atmos. Environ. 2015, 122, 662–671. [Google Scholar] [CrossRef]
  61. Chow, J.C.; Watson, J.G. Review of PM2.5 and PM10 apportionment for fossil fuel combustion and other sources by the chemical mass balance receptor model. Energy Fuels 2002, 16, 222–260. [Google Scholar] [CrossRef]
  62. Grigg, J. The health effects of fossil fuel derived particles. Arch. Dis. Child. 2002, 86, 79–83. [Google Scholar] [CrossRef]
  63. Bukowiecki, N.; Lienemann, P.; Hill, M.; Furger, M.; Richard, A.; Amato, F.; Prévôt, A.; Baltensperger, U.; Buchmann, B.; Gehrig, R. PM10 emission factors for non-exhaust particles generated by road traffic in an urban street canyon and along a freeway in Switzerland. Atmos. Environ. 2010, 44, 2330–2340. [Google Scholar] [CrossRef]
  64. Camatini, M.; Crosta, G.F.; Dolukhanyan, T.; Sung, C.; Giuliani, G.; Corbetta, G.M.; Cencetti, S.; Regazzoni, C. Microcharacterization and identification of tire debris in heterogeneous laboratory and environmental specimens. Mater. Charact. 2001, 46, 271–283. [Google Scholar] [CrossRef]
  65. Adachi, K.; Tainosho, Y. Characterization of heavy metal particles embedded in tire dust. Environ. Int. 2004, 30, 1009–1017. [Google Scholar] [CrossRef]
  66. Voiculescu, M.; Constantin, D.E.; Condurache-Bota, S.; Călmuc, V.; Roșu, A.; Dragomir Bălănică, C.M. Role of meteorological parameters in the diurnal and seasonal variation of NO2 in a Romanian urban environment. Int. J. Environ. Res. Public Health 2020, 17, 6228. [Google Scholar] [CrossRef]
  67. Fang, C.; Xue, K.; Li, J.; Wang, J. Characteristics and weekend effect of air pollution in eastern Jilin Province. Atmosphere 2022, 13, 681. [Google Scholar] [CrossRef]
  68. Ghobakhloo, S.; Khoshakhlagh, A.H.; Mostafaii, G.R.; Chuang, K.J.; Gruszecka-Kosowska, A.; Hosseinnia, P. Critical air pollutant assessments and health effects attributed to PM2.5 during and after COVID-19 lockdowns in Iran: Application of AirQ+ models. Front. Public Health 2023, 11, 1120694. [Google Scholar] [CrossRef]
  69. Arregocés, H.A.; Rojano, R.; Restrepo, G. Health risk assessment for particulate matter: Application of AirQ+ model in the northern Caribbean region of Colombia. Air Qual. Atmos. Health 2023, 16, 897–912. [Google Scholar] [CrossRef] [PubMed]
  70. Cakaj, A.; Lisiak-Zielińska, M.; Khaniabadi, Y.O.; Sicard, P. Premature deaths related to urban air pollution in Poland. Atmos. Environ. 2023, 301, 119723. [Google Scholar] [CrossRef]
  71. Brito, J.; Bernardo, A.; Gonçalves, L.L. Atmospheric pollution and mortality in Portugal: Quantitative assessment of the environmental burden of disease using the AirQ+ model. Sci. Total. Environ. 2022, 815, 152964. [Google Scholar] [CrossRef] [PubMed]
Figure 1. Pollutants’ variability for each year between 2020 and 2022.
Atmosphere 14 01759 g001
Figure 2. Spatial variability of PM concentration in Bucharest area.
Atmosphere 14 01759 g002
Figure 3. NO 2  concentration variability in Bucharest area during 2020–2022.
Atmosphere 14 01759 g003
Figure 4. Seasonal variation in the fine particle fraction ratio between PM 2.5  and PM 10 .
Atmosphere 14 01759 g004
Figure 5. Average diurnal variation in PM 10 , PM 2.5 , NO 2 , and temperature, measured during 2020–2022.
Atmosphere 14 01759 g005
Figure 6. Average diurnal seasonal variation in PM 10 , PM 2.5 , and NO 2 , measured during 2020–2022.
Atmosphere 14 01759 g006
Figure 7. Weekday versus weekend average daily variation for PM 10 , PM 2.5 , and ratio of PM 2.5 /PM 10 .
Atmosphere 14 01759 g007
Figure 8. Estimated attributable proportion of all-cause mortality for PM 10 , PM 2.5 , and NO 2  each year.
Atmosphere 14 01759 g008
Table 1. Air quality measurement stations [37].
StationTypeAvailable MeasurementsLocationCoordinates
B1UrbanPM10, PM2.5, SO2, O3, NO2, COMilitari44.45, 26.04
B2IndustrialPM10, SO2, NO2, COTitan44.42, 26.16
B3TrafficPM10, NO2, COObor44.44, 26.13
B4IndustrialPM10, SO2, NO2Berceni44.38, 26.13
B5IndustrialPM10, PM2.5, SO2, NO2, CODrumul Taberei44.42, 26.03
B6TrafficPM10, PM2.5, NO2, COUniversitate44.44, 26.10
B7SuburbanPM10, PM2.5, SO2, O3, NO2Magurele44.35, 26.03
B9UrbanPM10, PM2.5, O3, NO2Bucurestii Noi44.49, 26.03
Table 2. Data coverage for every station.
StationMeasurementsTemporal CoverageFiltered Coverage from the Total
B125,08595.37%98.40%
B217,59366.89%100%
B326,11699.29%100%
B417,80467.69%100%
B517,52766.64%92.54%
B625,38096.49%95.29%
B717,37066.04%99.61%
B9566421.53%100%
Table 3. Input data for AirQ +  software (https://www.who.int/tools/airq, WHO-EURO: Copenhagen, Denmark).
YearPopulationOver 30DeathsIncidencePM 2.5  [ μ g/m 3 ]PM 10  [ μ g/m 3 ]NO 2  [ μ g/m 3 ]
20202,153,4921,561,28126,045120915.227.7229.98
20212,161,6211,554,82129,972138616.226.0932.79
20222,164,5061,585,48923,552108815.225.8328.9
Table 4. Pollutants mean concentration variability at each monitoring station.
StationB1B2B3B4B5B6B7B9
Min0.30.550.030.230.60.630.30.41
TotalMax627.36250.83570.25367.55336.47644.21369.61369.61
  P M 10 Mean & Std Dev26.605 ± 20.123.96 ± 15.824.83 ± 17.424.1 ± 15.628.13 ± 17.429.36 ± 2025.62 ± 16.925.62 ± 24.1
[ μ g/m 3 ]2020Mean & Std Dev27.23 ± 25.722.16 ± 15.725.91 ± 22.115.19 ± 9.223.94 ± 17.630.94 ± 26.224.92 ± 14.5-
2021Mean & Std Dev26.84 ± 1624.69 ± 15.923.59 ± 13.624.03 ± 15.626.94 ± 17.228.14 ± 16.726.05 ± 17-
2022Mean & Std Dev25.54 ± 1723.38 ± 15.724.98 ± 15.124.86 ± 15.727 ± 17.626.43 ± 14.525.18 ± 1725.62 ± 24.1
Min0.11---1.721.40.210.11
TotalMax234.56---49.7973.38187.79162.37
  P M 2.5 Mean & Std Dev16.63 ± 12.9---13.12 ± 6.913.92 ± 7.817.83 ± 13.415.37 ± 14.5
[ μ g/m 3 ]2020Mean & Std Dev17.7 ± 14.5---15.53 ± 8.814.12 ± 9.321.94 ± 13.1-
2021Mean & Std Dev17.1 ± 12.7---13.59 ± 7.414.53 ± 7.518.95 ± 14.7-
2022Mean & Std Dev15.47 ±11.2---12.68 ± 613.43 ± 5.716.54 ± 11.815.37 ± 14.5
Min0.175.150.713.644.470.334.620.1
TotalMax178.5161.28171.68143.05177.66185.04100.32108.05
  N O 2 Mean & Std Dev25.92 ± 1829.2 ± 19.641.43 ± 21.425.47 ± 17.331.75 ± 19.443.52 ± 23.419.1 ± 11.925.14 ± 17.9
[ μ g/m 3 ]2020Mean & Std Dev26.97 ± 18.727.6 ± 17.340.18 ± 20.827.29 ± 1031.15 ±18.741.64 ±23.319.82 ± 11-
2021Mean & Std Dev29.38 ±19.829.16 ± 19.444.79 ± 24.425.41 ± 15.932.05 ± 19.849.16 ± 25.818.8 ± 12.5-
2022Mean & Std Dev22.03 ± 1729.38 ±19.939.31 ± 18.325.4 ± 18.829.65 ± 1938.04 ± 19.319.34 ± 11.425.14 ± 17.9
Disclaimer/Publisher’s Note: The statements, opinions and data contained in all publications are solely those of the individual author(s) and contributor(s) and not of MDPI and/or the editor(s). MDPI and/or the editor(s) disclaim responsibility for any injury to people or property resulting from any ideas, methods, instructions or products referred to in the content.