Article

Indoor Air Quality in the Most Crowded Public Places of Tehran: An Inhalation Health Risk Assessment

1
Department of Environmental Health Engineering, School of Public Health, Tehran University of Medical Sciences, Tehran 1417993362, Iran
2
Centre for Air Pollution Research (CAPR), Institute for Environmental Research (IER), Tehran University of Medical Sciences, Tehran 1417993362, Iran
3
Department of Research Methodology and Data Analysis, Institute for Environmental Research, Tehran University of Medical Sciences, Tehran 1417993362, Iran
4
International Laboratory for Air Quality and Health, School of Earth and Atmospheric Sciences, Science and Engineering Faculty, Queensland University of Technology (QUT), Brisbane, QLD 4001, Australia
5
Department of Environmental Health Engineering, Faculty of Medical Sciences, Tarbiat Modares University, Tehran 1411713116, Iran
*
Authors to whom correspondence should be addressed.
These authors contributed equally to this work.
Atmosphere 2023, 14(7), 1080; https://doi.org/10.3390/atmos14071080
Submission received: 9 May 2023 / Revised: 13 June 2023 / Accepted: 21 June 2023 / Published: 27 June 2023
(This article belongs to the Special Issue Smoking, Vaping, and Indoor Air Pollution)

Abstract

:
Satisfying indoor air quality in public environments has become essential in cities. In the present study, indoor PM2.5, CO2, NO2, SO2, nicotine, and BTEX have been assessed in 12 categories of public places. The highest average concentrations of PM2.5, NO2, and SO2 were observed in waterpipe cafés (233, 29.6, and 5.1 µg/m3), whereas the lowest concentrations were found in health clubs and hospitals, respectively. Moreover, indoor BTEX concentration varied from 69.5 µg/m3 (passenger terminals) to 1739.2 µg/m3 (elderly care centers). Given nicotine, the highest concentrations were found in waterpipe cafés, ranging from approximately 11.0 to 50 µg/m3. The mean hazard quotient (HQ) and Hazard Index (HI) for benzene, toluene, ethylbenzene, and xylene were calculated in all types of public environments, and results showed that the amount of HQ and HI in none of the places was more than 1. Furthermore, the lifetime cancer risk (LTCR) exceeded the guideline threshold in hospitals, restaurants, elderly care centers, passenger terminals, movie theaters, and beauty salons. The findings of our study indicate that the indoor air quality in most public settings within Tehran city is not acceptable and necessitates appropriate management. These findings underscore the importance of monitoring indoor air quality and implementing effective strategies to mitigate exposure to air pollutants.

1. Introduction

Air pollution is the most considerable environmental risk factor of the century, particularly in developing countries [1,2]. Society’s exposure to air pollutants is categorized into two portions, including ambient air and indoor micro-environments exposure [3]. In the modern lifestyle, about 90% of a lifetime, on average, spends indoors, and this considerable fact directs the researchers to the development of studies scoping indoor air quality as a crucial issue threatening human health and equipment [4,5,6,7]. There is clear scientific evidence that air pollution poses a significant risk to public health, particularly to vulnerable groups such as children, the elderly, and pregnant women [8,9]. The World Health Organization (WHO) reported that approximately 3.8 million premature deaths were attributed to indoor air pollution each year, and this number contributed to approximately 7.7% of annual mortality [10]. Evidence shows that the presence of air pollutant sources in a variety of public places can be a considerable risk factor for the cardiovascular, immune, and respiratory systems [6,11,12,13].
Health and environmental organizations have identified numerous compounds in the atmosphere that are considered harmful pollutants. However, some of these pollutants in indoor environments cause much health concern. Short-term exposure to PM2.5 accounts for increased risks of myocardial infarction (MI), stroke, arrhythmia, and heart failure exacerbation in susceptible individuals, such as the elderly and those with existing Coronary Artery Disease [14]. This pollutant can be associated with an increase in the rate of respiratory diseases and hospitalization due to pneumonia and chronic lung disease [15]. Volatile organic compounds (VOCs) generally have a significant concentration in indoor micro-environments [16]. Benzene, toluene, ethylbenzene, and isomeric xylene (BTEX) are notorious indoor VOCs that threaten employees and clients in public environments. VOCs that penetrate the respiratory system have concerning effects on human health. The International Agency for Research on Cancer (IARC) and the United States Environmental Protection Agency (U.S. EPA) have classified benzene as a significant carcinogen due to its potential to pose risks and increase the incidence of Acute Myeloid Leukemia [17,18]. Other types of BTEX have also been proven to be carcinogenic and teratogenic and have significant adverse effects on the cardiovascular and respiratory systems [19]. NO2 has a significant short-term and chronic effect on human health. Studies show that exposure to NO2 chemical compounds can cause asthma and decreased lung function in children. This pollutant is also related to low birth weight, respiratory mortality, and the risk of lung cancer [20,21]. SO2 is another well-known compound that can cause asthma-related hospitalization and respiratory mortality [22]. Furthermore, high indoor concentrations of indoor carbon dioxide have increased sick-building symptoms, including drowsiness and irritation of the nose, eyes, and respiratory system [23]. Indoor air pollution is a complex issue, with emissions arising from a variety of sources, including building materials, products used within the space, human activities, and the outdoor environment. [3,24,25]. The results of investigations showed that the employees of public places and people who spend their time in such places are susceptible to exposure to diverse levels of concerning air pollutants, such as particulate matter, nitrogen dioxide, sulfur dioxide, and volatile organic compounds (VOCs), especially in the crowded urban areas [9,18].
Tehran, the capital of Iran, with nearly nine million inhabitants, is the most populated territory in Western Asia [26,27]. The people in the city have faced high levels of ambient air pollutants over the past few decades due to the transportation of approximately four million vehicles in the megacity, as well as its proximity to numerous industrial sources. Moreover, according to government reports, the density of the population, vehicles, and industries of Tehran is getting aggravated [1,28]. With over 166,000 public service places, including procurement and distribution (of food) centers, healthcare service centers, food industries, and other public places provides a suitable situation for the investigation of indoor air quality in the public environments of Tehran’s metropolis. Due to the special cultural conditions and extreme air pollution in Tehran on most days of the year [29], public places can be considered a refuge for citizens against the threat of air pollution. The lack of a comprehensive study on indoor air quality in public places in Tehran necessitates the collection of data through sampling. To address this gap, the present study aims to measure PM2.5, NO2, SO2, BTEX, and CO2 levels, as well as temperature and relative humidity, in 98 crowded public places across 12 categories. Additionally, this study seeks to calculate the indoor-to-outdoor relationship of pollutants using air quality monitoring stations and assess the health risks associated with BTEX compounds.

2. Materials and Methods

2.1. Study Area and Public Places

After obtaining the general characteristics and the list of public places in Tehran from the Center for Environmental and Occupational Health, a group of five environmental and epidemiology specialists determined the criteria for choosing the type of sampling of the public environment. The criteria that were utilized as the most significant include health concerns, the number of customers/attendees, accessibility for sampling, and the possibility of implementing interventions to improve the air quality of each group of public places. The fuzzy analytical hierarchy process (AHP) and fuzzy technique for order preference by similarity to the ideal solution (TOPSIS) were employed to prioritize the criteria and select the most suitable locations. Studies show that indoor air quality can be related to the socioeconomic status of urban areas, and also, different districts’ air quality is affected by spatial variations. Therefore, the present study tried to select public places using previous studies that worked on the spatial variations of ambient air pollutants and the socioeconomic status of Tehran to achieve an appropriate sampling place distribution in the study area [1,29,30,31]. Finally, using AHP and TOPSIS procedures according to the socioeconomic characteristics, the present study chose 98 public places within 12 categories of public environments (including 10 beauty salons, 9 elderly care centers, 8 health clubs, 3 passenger terminals, 8 movie theaters, 10 mosques, 2 hotels, 10 waterpipe cafés, 10 restaurants, 8 coffee shops, 10 hospitals, and 10 healthcare service centers) throughout all 22 districts of Tehran.

2.2. Indoor Air Sampling

The indoor air quality monitoring phase started in January 2020 and lasted until March. In this study, indoor air’s PM2.5, NO2, SO2, nicotine, BTEX, CO2, and thermal comfort parameters (temperature and relative humidity) were sampled in 98 public places in a single sampling manner. Indoor air samplers were set at a height of 1.5 m above the floor and at least 2 m away from vertical barriers, windows, doors, and ventilation inlets. Through a previous interview, the population peak hours in each sampling place were determined for measurement. Moreover, in places that consisted of several separate rooms, such as hospitals and elderly care centers, the most crowded salon was determined through interviews.

2.2.1. Real-Time Sampling

Indoor PM2.5 and CO2 levels were measured using real-time air quality monitors (GM8803 and GRIMM dust monitors for PM2.5 and portable AQ110 KIMO [32] for CO2, respectively). Relative humidity and temperature were also determined by HD110 Kimo portable analyzer [32].

2.2.2. Off-Site Analyzing

The modified West–Gaeke method and modified Jacobs–Hochheiser method were used for sampling and analyzing indoor SO2 and NO2, respectively. Briefly, 0.04 M potassium tetrachloromercurate (TCM) and Sodium Hydroxide with Sodium Arsenite (SH and SA) solutions were used as absorbing reagents for indoor SO2 and NO2, respectively. Furthermore, SKC charcoal sorbent tubes (6 mm OD × 70 mm length and 100/50 mg sorbent in 2 sections) were used for BTEX sampling. Additionally, XAD sorbent tubes (7 mm OD × 70 mm length and 80/40 mg sorbent in 2 sections) were used for nicotine sampling. Indoor SO2 and NO2 air samplings were carried out by placing 25 mL of each TCM and SH and SA solution in a standard midget impinger (part number 225-20, SKC Inc., Eighty Four, PA, USA), respectively. Charcoal sorbent tube, XAD sorbent tube, and impingers were connected to a personal air sampling pump (Universal 224-PCXR4, SKC Inc., Eighty Four, PA, USA) equipped with an adjustable low flow holder for 4 h at the flow rate of 1 L/min for nicotine, NO2, and SO2, and 0.2 L/min for BTEX. At the end of sampling, absorbents were poured into 50 mL glass vials, and sorbent tubes were capped and transferred to the cold box filled with dry ice and delivered to the laboratory within 2 h. In the laboratory, absorption solutions and sorbent tubes were stored at 4 °C and −20 °C, respectively. Analyzing process was performed within a week.

2.3. Sample Preparation and Analytical Procedures

All chemicals and reagents used to prepare absorbing solutions based on the aforementioned methods met the specifications of analytical reagent grade and were purchased from Merck (München, Germany). Sample preparations for indoor SO2 and NO2 analyses were performed by pipetting out 10 mL of each collected sample into a 50 mL volumetric glass flask. For indoor SO2 samples, 1 mL of 0.6% sulphamic acid, 2 mL of 0.2% formaldehyde solution, and 2 mL of pararosaniline solution were added and made up to 25 mL with distilled water. Furthermore, for NO2 samples, 1 mL of hydrogen peroxide solution, 10 mL of sulphanilamide solution, and 1.4 mL of NEDA solution were added with thorough mixing after the addition of each reagent and made up to 50 mL with distilled water. After 30 min for SO2 and 10 min for NO2 color development intervals, the absorbance of samples was measured and recorded using a Spectrophotometer (Perkin Elmer) at 560 nm and 540 nm, respectively. Calibration curves were obtained using working sulfite TCM solution and Sodium Nitrite working solution at 10 points (0.07–1.15 µg/mL for SO2) and (0.02–0.4 µg/mL for NO2), with r2 values of 0.997 and 0.993 for SO2 and NO2, respectively.
For nicotine extraction, after breaking XAD sorbent tubes, the front and back parts were transferred separately into a 2 ml vial 1 ml of 0.01% ethyl acetate absorbent solution was transferred into each of the vials, and desorption was performed for 30 minutes inside the ultrasound bath. After the desorption procedure, 1 μL of the analyte was taken and injected into gas chromatography–mass spectrometry instrument (Agilent, Santa Clara, CA, USA).
BTEX chemical compound extraction procedures were carried out through the addition of 2 mL of benzene-free carbon disulfide to each part of the sorbent tubes. All extraction stages were performed in 2 mL GC glass vials, shaking gently in desorbed time (30 min at room temperature) under the hood. After the extraction phase, 1 μL of the analyte was taken and injected into a gas chromatograph (Agilent 7890, Santa Clara, CA, USA) equipped with a mass spectrometer detector (Agilent 5975, Santa Clara, CA, USA) for analysis. Analyte separation was performed on an HP-5 capillary column (30 m, 0.25 mm i.d., 1.0 µm film thickness, J&W Scientific, Folsom, CA, USA). The following conditions were applied for the GC analysis: helium carrier gas (99.999%) at a constant flow rate of 1 mL min−1; injector temperature 210 °C; detector temperature 280 °C; gas chromatograph oven temperature programmed from 40 °C (6 min initial hold) to 70 °C at 4 °C min−1; hold 1 min and then increase to 250 °C at the rate of 10 °C min−1; hold 2 min. This analysis was performed in SIM mode registering the positive ion-to-charge ratio (m/z) where 105, 95, 78, and 78 were used for benzene, toluene, ethylbenzene, and xylenes, respectively. Calibration curves with r2 values of 0.991, 0.995, 0.991, and 0.993 were obtained for benzene, ethylbenzene, toluene, and xylene, respectively (Table S1).

2.4. Quality Control/Quality Assurance (QC/QA)

To ensure the accuracy and reliability of the air sampling and analysis procedures, a stringent quality control and quality assurance protocol was implemented at every stage, including equipment calibration, field samples, field blank analysis, and lab blank testing. The calibration of all employed air pumps in this study was performed using a soap bubble flow meter. Field blanks were evaluated beside routine indoor NO2, SO2, and BTEX actual samples. Moreover, laboratory blanks with 10 mL of unexposed absorbing reagent for indoor SO2/NO2 and unexposed charcoal sorbent tube for indoor BTEX chemical compounds were analyzed in the same manner as the real sample analytical procedures. Distilled water was used as the optical reference instead of the reagent blank. Indoor SO2/NO2 actual samples with an absorbance greater than 1.0 were re-analyzed after diluting an aliquot of the collected samples with an equal quantity of unexposed absorbing reagent. As a part of an internal quality assurance program, 10% of the indoor SO2/NO2 samples were re-analyzed. Actual sample charcoal tubes were analyzed separately for both the back and front parts as breakthrough controls. Recovery efficiencies (higher than 95%) were determined by spiking 10 µg of BTEX target compounds into fresh charcoal tubes (Table S1). The concentrations of benzene, toluene, ethylbenzene, and xylene in field blanks were identified as ND to 0.73, ND-0.87, ND-0.45, and ND-0.66 µg/m3, respectively. The limit of detection (LOD) and limit of quantification (LOQ) were calculated using laboratory blanks. The mean of LOD and LOQ were 5 and 15 µg/L for all BTEX chemical compounds.

2.5. Outdoor Air Quality Data Gathering

Ambient air pollution can be considered a crucial factor that affects indoor air quality; therefore, to calculate the indoor-to-outdoor air pollution (I/O) ratio, hourly ambient air quality data (PM2.5, NO2, and SO2) were collected from air quality monitoring stations under the operation of Tehran Air Quality Control Company (TAQCC). There are about 22 active ambient air quality monitoring stations in Tehran that monitor ambient criteria air pollutants across all of the districts of the city [28,30]. The inverse distance weighting (IDW) interpolation approach was used to estimate ambient air pollutant concentration surrounding each investigated public place ( X p ), according to the location of the sampled places, as well as the nearest three neighbors’ air quality monitoring stations’ distance and values.
X p = i = 1 n ( Z i d i ) i = 1 n ( 1 d i )
In this equation, Z is the value from the air quality monitoring station, and d is the distance of the station from the sampled place. Finally, the I/O ratio was also estimated using indoor sampling and IDW results.

2.6. Cancer and Non-Cancer Risk Assessment

The risk of adverse health effects of BTEX compounds in the monitored places was evaluated as cancer and non-cancer risk assessments. According to the model developed by U.S. EPA, in order to calculate the hazard quotients and lifetime cancer risk, the exposure concentration (EC, µg/m3) and estimated daily intake (EDI, mg/kg day) of each pollutant are calculated using a time-weighted formula as follows [18]:
E C = ( P C × E T × E F × E D ) / A T
where PC (µg/m3) is pollutant concentration; ET (h/day) is the exposure time; EF (day/year) is the exposure frequency; ED (year) is the exposure duration, and the AT (hr) is the averaging time.
E D I = P C × I R × E T × E F × E D A T × B W
where IR (m3/day) is inhalation rate, and BW (kg) is body weight. The following equation estimates the Hazard Quotient (HQ), as a non-cancer risk indicator, where Rfc (mg/m3) is the inhalation unit risk:
H Q = E D I / R f c
Finally, the Hazard Index (HI) for the total BTEX was obtained by summing up all HQs. For carcinogenic risk assessment, the lifetime cancer risk (LTCR) parameter was obtained for benzene and ethylbenzene using inhalation unit risk (IUR, m3/µg) as follows:
L T C R = E C × I U R
Table 1 represents the values of the parameters used for the risk assessment in this study.
Through the utilization of Monte Carlo simulation methodology, the inhalation-based exposure to BTEX chemical compounds was evaluated for potential health risks, both carcinogenic and non-carcinogenic, via a probabilistic approach. As a precautionary measure, the 95th percentile values of risk indicators for carcinogenic and non-carcinogenic effects were taken into account. As per established guidelines from the USEPA and WHO, a non-carcinogenic risk assessment is deemed low if the Hazard Quotient (HQ) and Hazard Index (HI) are below 1. Conversely, if these indices exceed 1, non-carcinogenic health outcomes may be possible [33].

2.7. Statistical Analysis

The data obtained from measuring the target pollutants were processed and statistically analyzed using SPSS. Initially, the concentrations of various pollutants in different public places were calculated using such measures as the mean, standard deviation, minimum, and maximum concentrations. In the analytical analysis part, the test question was whether the concentration level of different indoor pollutants among 12 categories of public places has a statistically significant difference or not. To address the hypothesis, the Shapiro–Wilk test was used to assess the normality of measured concentrations in each place. Since the distribution of the parameters does not follow the normal distribution, the non-parametric Kruskal–Wallis tests were used to compare different groups. Moreover, Dunn’s Bonferroni Pairwise Comparison was used for double comparisons. All statistical analyses were performed in IBM SPSS (IBM Corp. IBM SPSS Statistics for Windows, Version 22.0, New York, NY, USA). For all comparisons, p-values less than 0.05 were considered statistically significant.

3. Results

3.1. Indoor Temperature, Humidity, and CO2

A total of 98 public environments (12 categories) were monitored in the Tehran metropolis. The summary results of indoor temperature, relative humidity, and CO2 in the investigated public places are presented in Table 2. During this study, regardless of the public place type, the mean indoor air temperature was in the range of 19–24 °C. The results showed that the average levels of indoor temperature were nearly equal to the recommended values, 20–24 °C [34]. The relative humidity also varied from 24 to 32%, with the maximum and minimum degrees recorded in beauty salons and hospitals, respectively. Recommended moisture level for indoor places is about 30–50% [35]. Sampling results indicated that the CO2 concentration was in the 430–1150 ppm range, with the following order: waterpipe cafés > beauty salons > health clubs > restaurants > elderly care centers > hotels > coffee shops > hospitals > passenger terminals > movie theaters > healthcare service centers > mosques. Several studies show that indoor CO2 concentration is directly related to the number of residents, ventilation, and combustion [35,36], and our results, according to the collected data from the number of customers and combustion activities in sampled places, indicate these factors’ effects. The National Institute of Occupational Safety and Health (NIOSH) and the Occupational Safety and Health Administration (OSHA) in the United States have determined 5000 ppm (9000 mg/m3) as the permissible exposure limit for carbon dioxide 8-h time weighted-average exposure [37]. Additionally, ASHRAE’s guideline recommended that indoor CO2 concentration should be lower than 1200 ppm [38]. High CO2 levels are associated with difficulty in breathing, an increase in the cardiac rhythm, headache, and physiological effects, which can decrease the facility user’s functional ability [36,39,40]. Levels above 700 ppm of CO2 indicate poor ventilation and could be associated with an increased likelihood of incidence of respiratory infections such as COVID-19 in indoor public places [41]. Ramos et al. measured CO2 concentration in fitness centers in Lisbon [14]. CO2 concentrations in this study were found to be in the range of 524–4418 ppm, which is higher than the CO2 concentration measured for health clubs in the present study. In another study by Jung et al. CO2 concentrations were measured in Taiwan hospitals [42], which were nearly the same as the present study levels (609 ppm vs. 613 ppm).

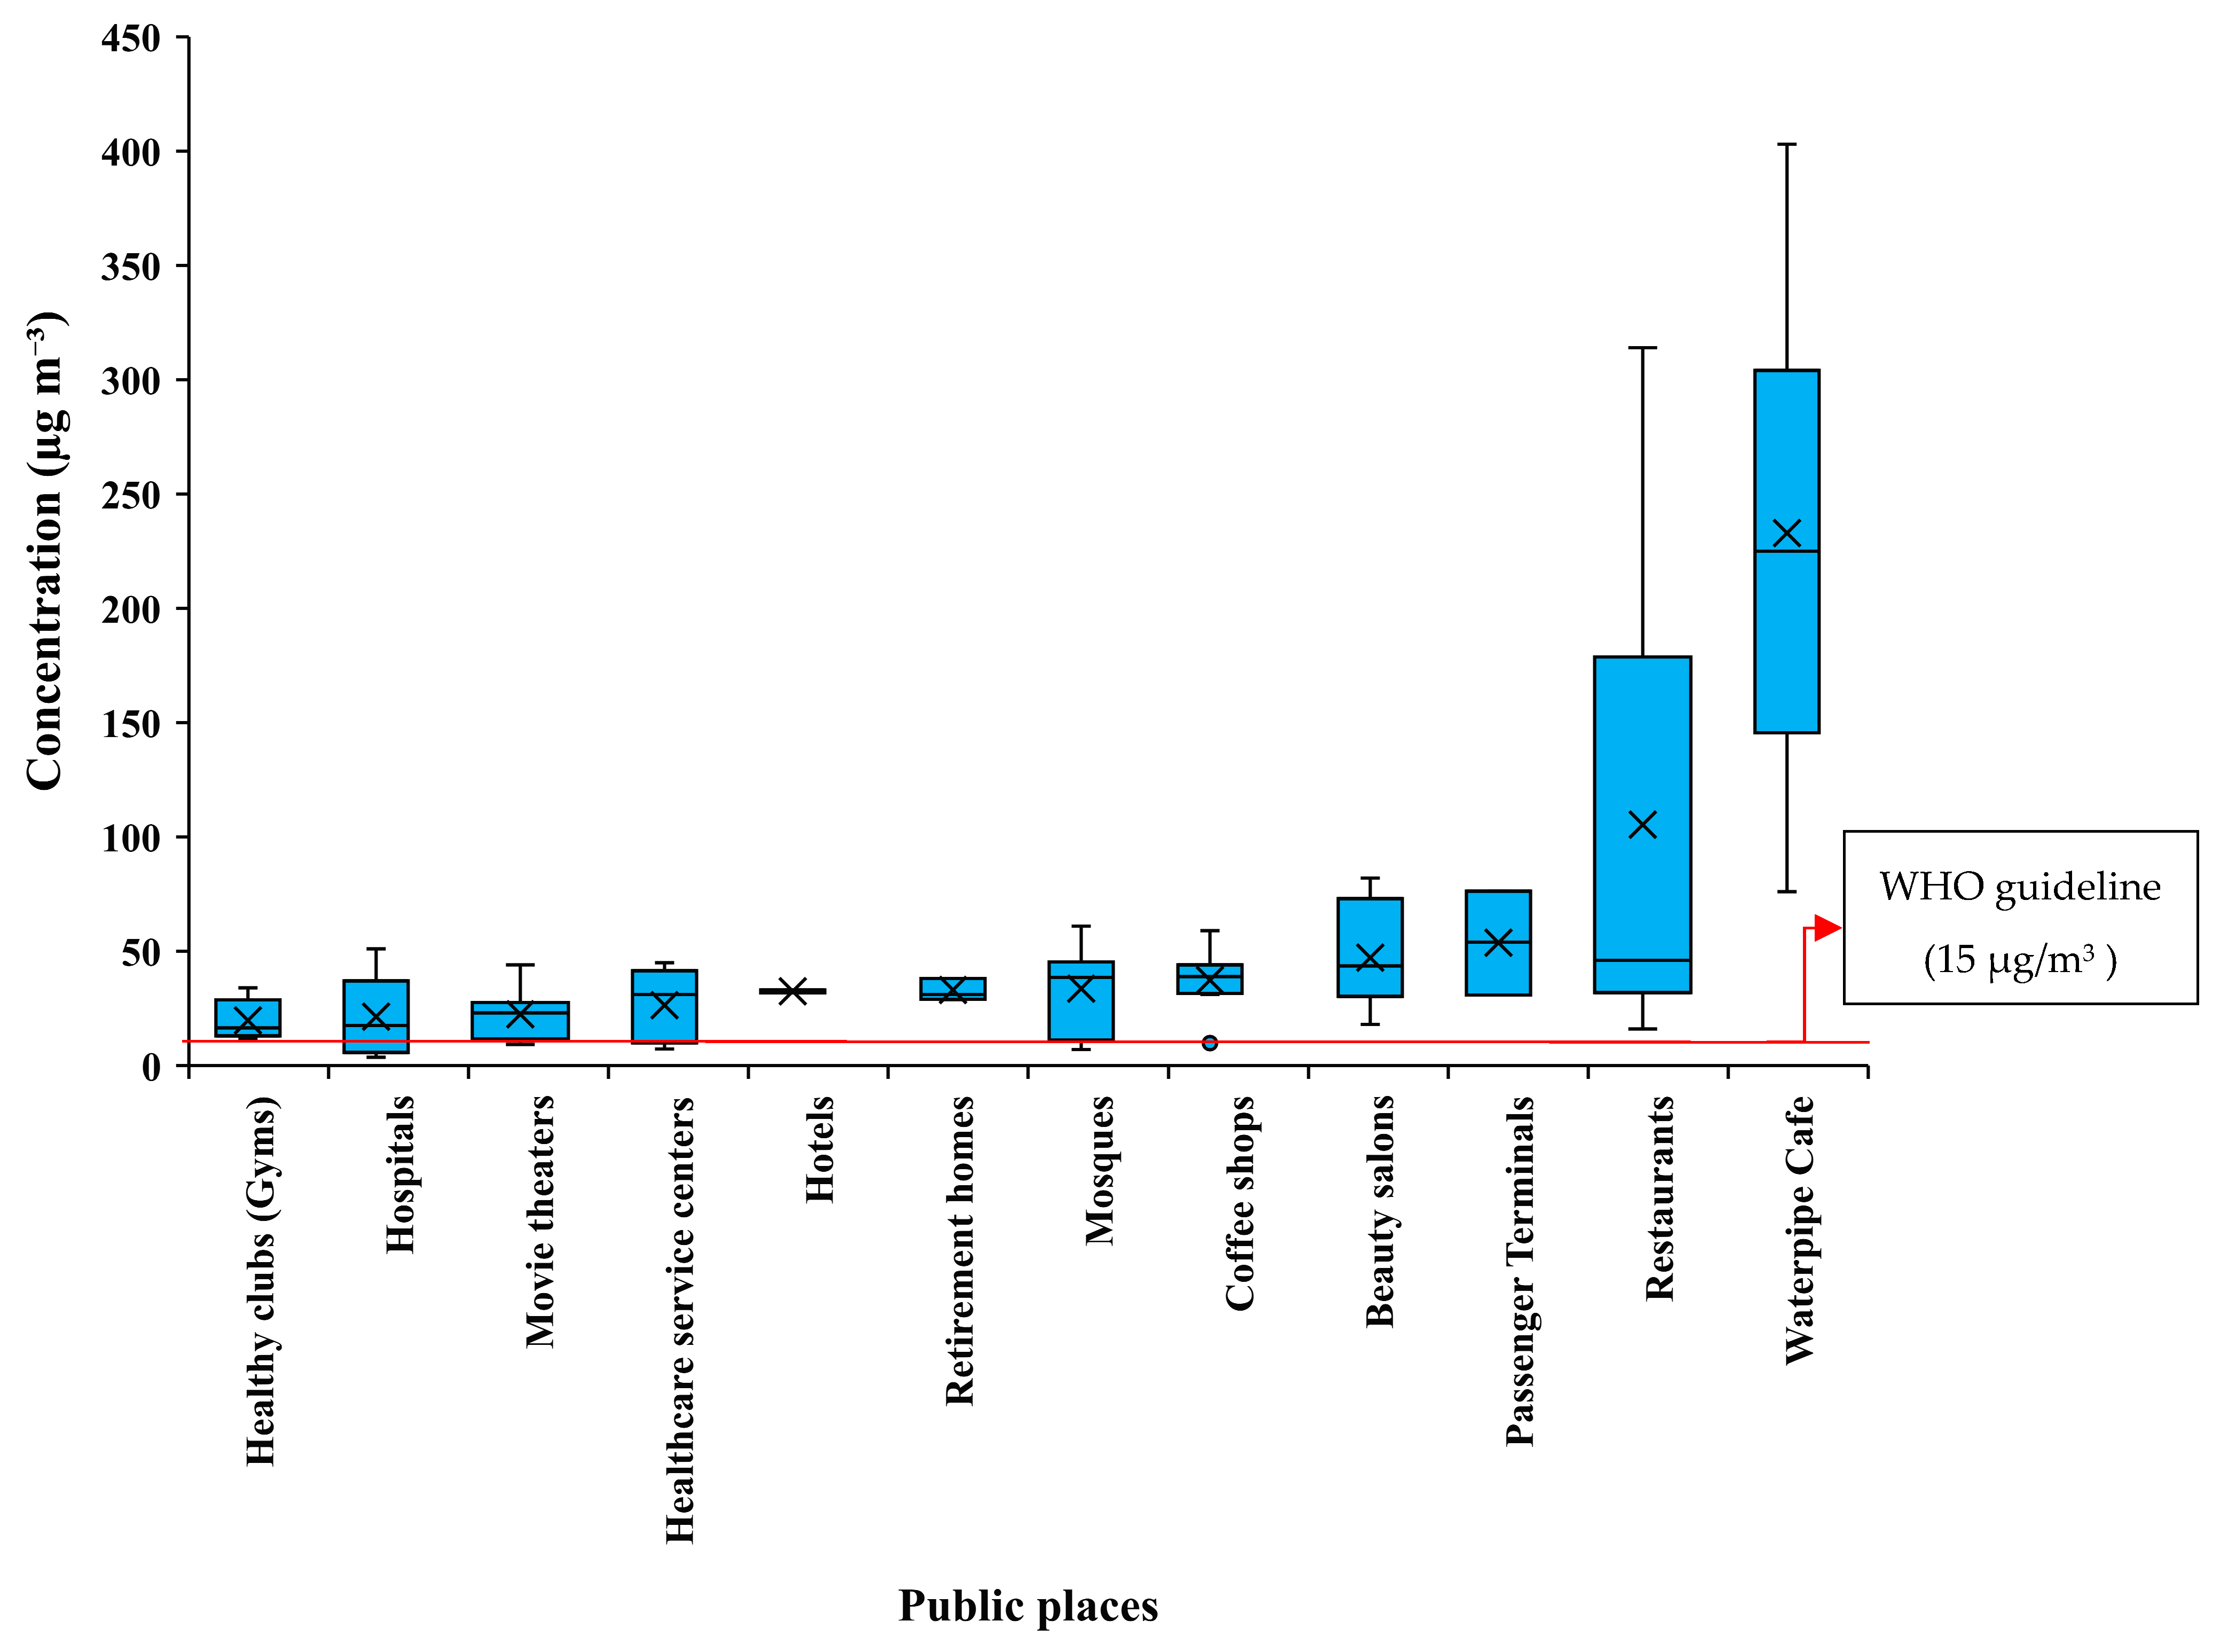
3.2. PM2.5 Mass Concentration

The indoor PM2.5 mass concentrations in public places are presented in Figure 1. As shown, the mean PM2.5 concentration in public places ranged from 20 to 233 µg/m3, with the following order: waterpipe cafés (~233 µg/m3) > restaurants (~106 µg/m3) > passenger terminals (54 µg/m3) > beauty salons (47 µg/m3) > coffee shops (37 µg/m3) > mosques (34 µg/m3) > elderly care centers (33 µg/m3) > hotels (32 µg/m3) > healthcare service centers (26 µg/m3) > movie theaters (22 µg/m3) > hospitals (21 µg/m3) > health clubs (20 µg/m3). The results showed that the maximum PM2.5 concentration was found in waterpipe cafés, while the minimum PM2.5 levels were in health clubs and hospitals. The results indicated that the mean indoor air PM2.5 concentration in all public places exceeded the last WHO’s daily guidelines (15 µg/m3) [22].
The results of the Kruskal–Wallis test (p-value < 0.001, chi-squared = 44.932 with d.f:11) showed that there is a statistically significant difference between the concentration of PM2.5 in the indoor air (at least between two public places). Therefore, the concentration of PM2.5 in the indoor air of all public places was compared pairwise [28]. The results showed a statistically significant difference between indoor PM2.5 concentration in waterpipe cafés versus sports clubs, hospitals, movie theaters, comprehensive healthcare service centers, and mosques (p-value < 0.001). None of the other pairwise comparisons between public places differed in indoor air PM2.5 concentration (p-value > 0.05).
Indoor air pollutants typically deposit on the internal surface, and their concentrations decrease over time. However, various sources of pollution in public environments can lead to unacceptable concentrations due to reduced air turnover. Heating, cooking, and physical activity are the main causes of increased concentration and resuspension of indoor particulate matter [14]. The adverse effects of PM2.5 are attributed not only to their mass and number concentration but also to their separate constituents, such as black carbon and toxic metals [43]. The waterpipe cafés, the public places that serve waterpipe as an instrument for tobacco smoking, are becoming more popular, especially in Middle East society. Several recent studies have dealt with particulate matter and its components in the waterpipe cafés [44]. An increasing body of evidence illustrates that due to incomplete charcoal burn during waterpipe smoking, customers and waiters are exposed to a range of pollutants, such as particulate matter and other hazardous gases [45,46]. However, it is important to note that not all individuals who frequent these establishments are smokers, as some may visit for the primary purpose of consuming food or tea. The average PM2.5 concentrations in waterpipe cafés of the current study were nearly the same as in a study in Oregon (211 µg/m3) [47] and lower than in studies carried out in New York City (515 µg/m3 and 1179.9 µg/m3) [48,49]. According to recent evidence, the number of smokers, ventilation systems, and the kind of tobacco served are the major factors influencing PM concentration in such public environments [50]. Resuspension of particles in the waterpipe cafés and other crowded public environments is also to blame [51].

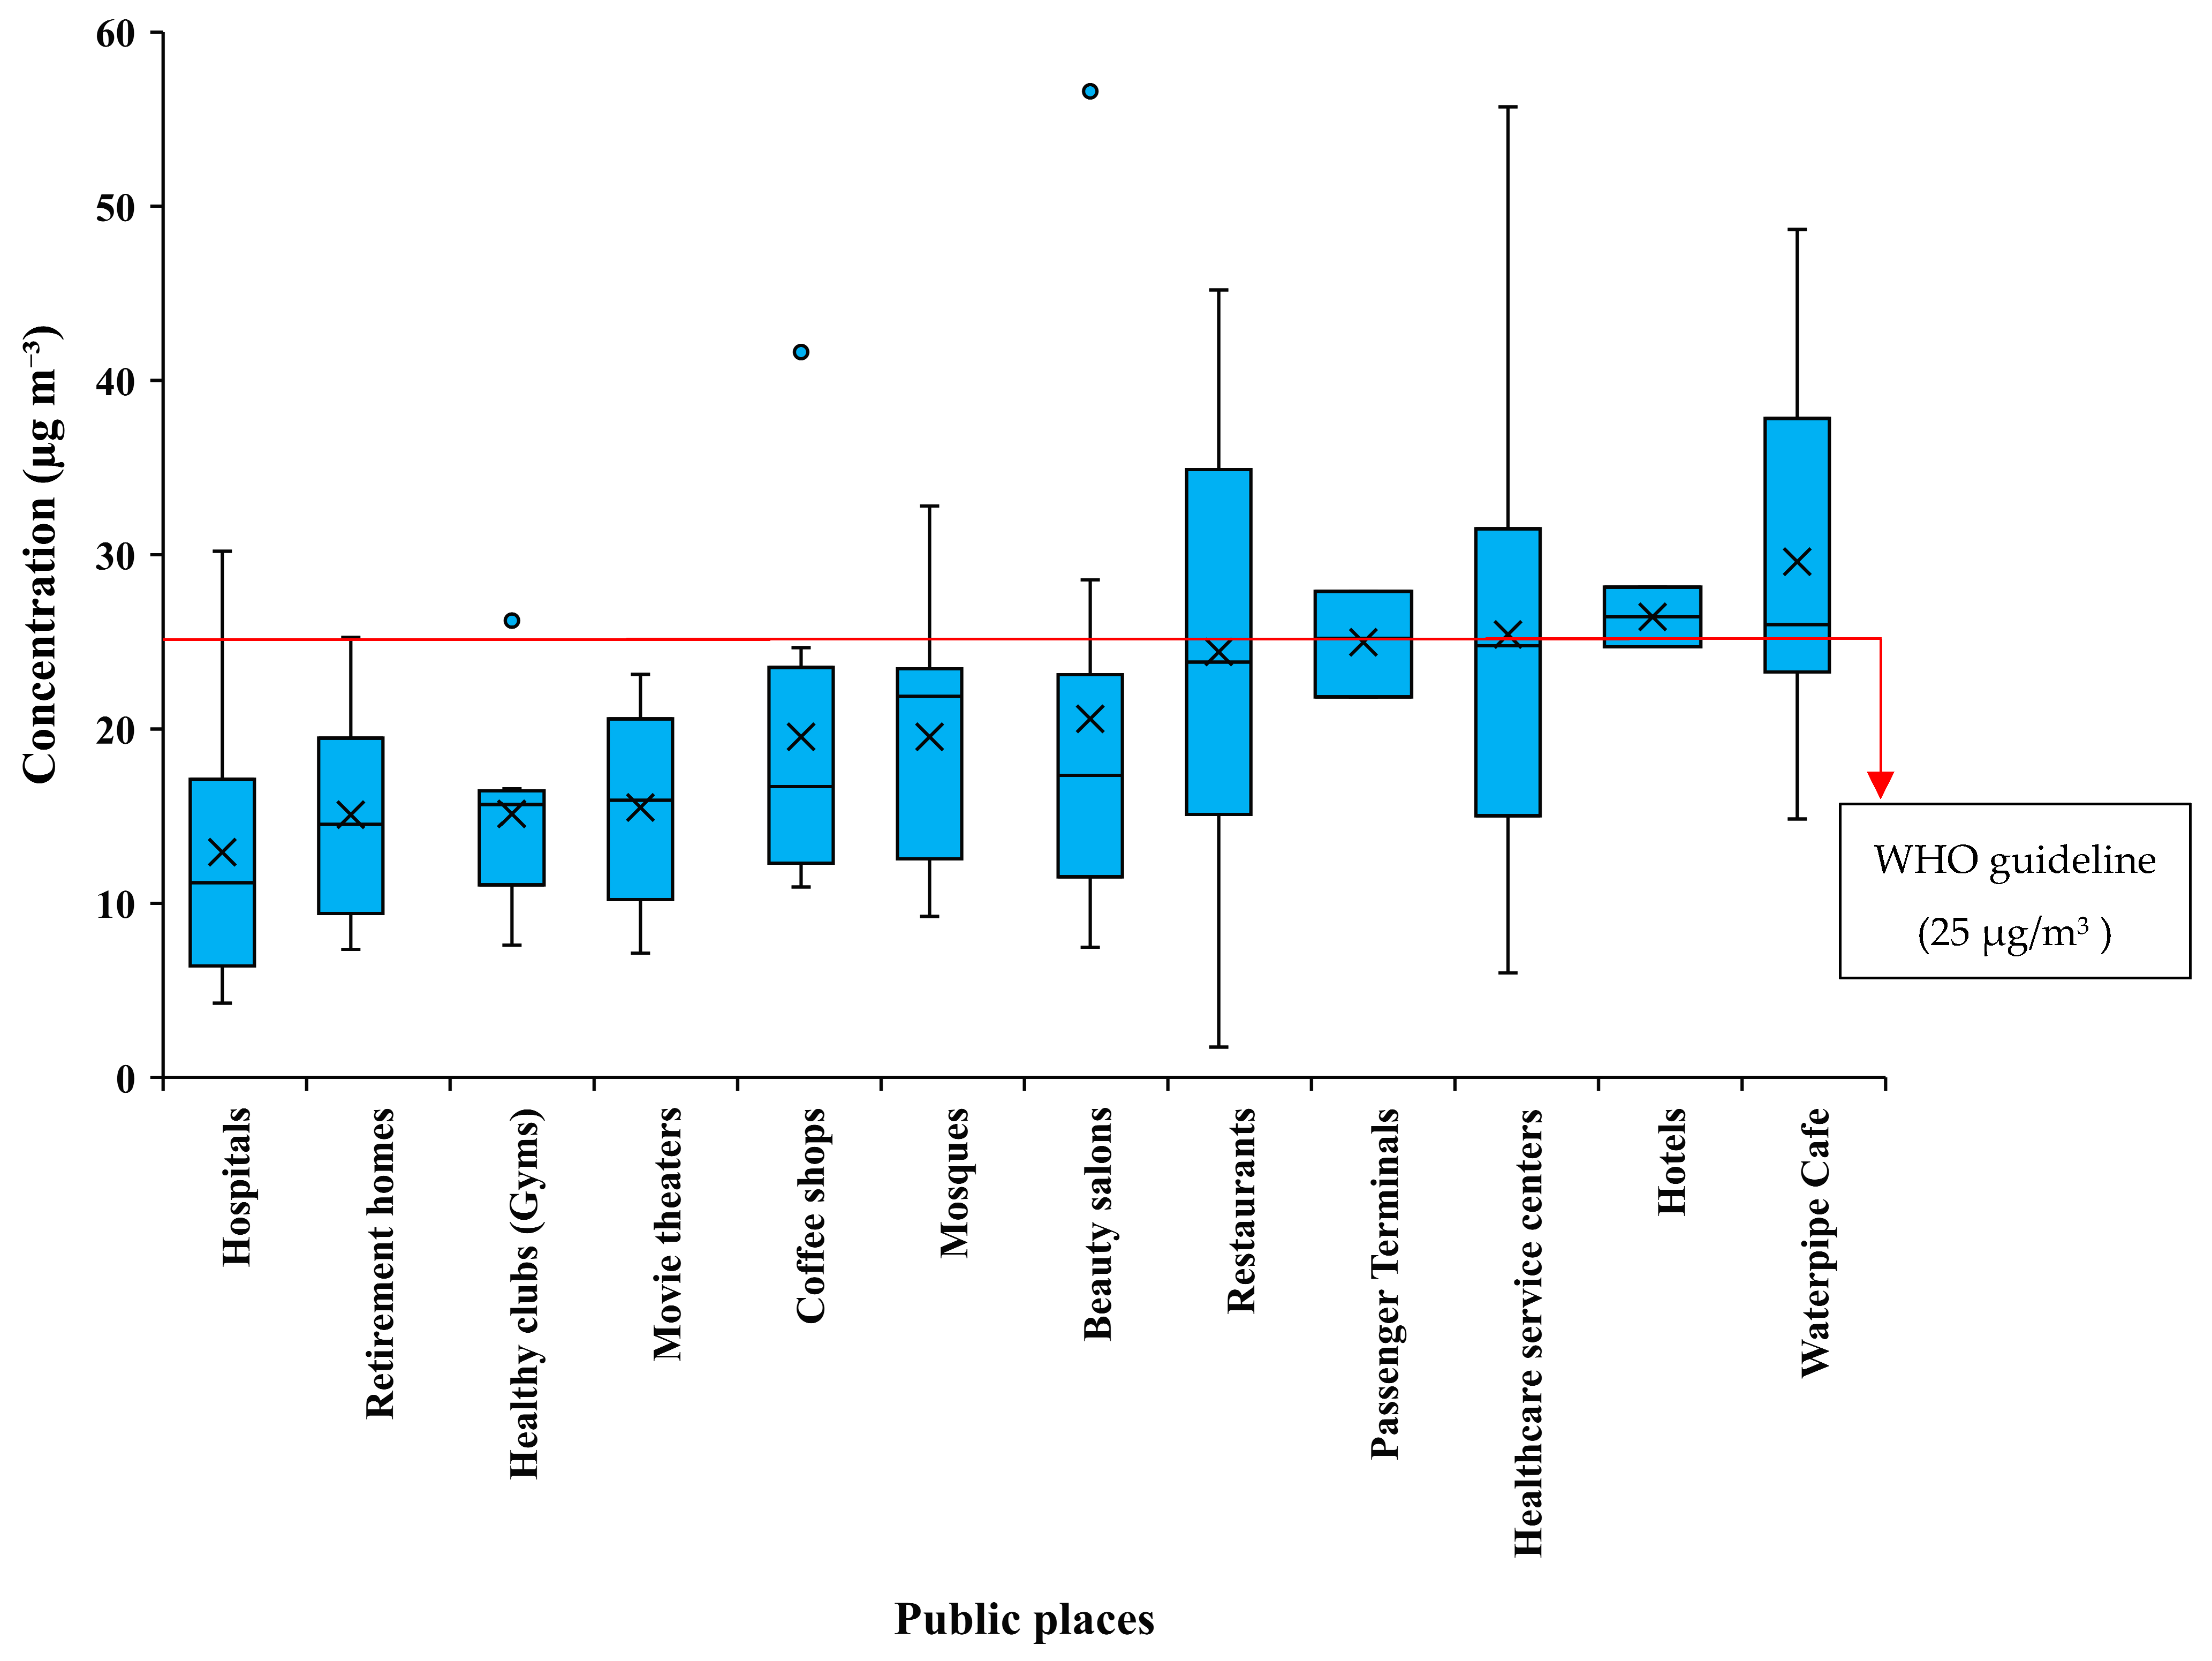
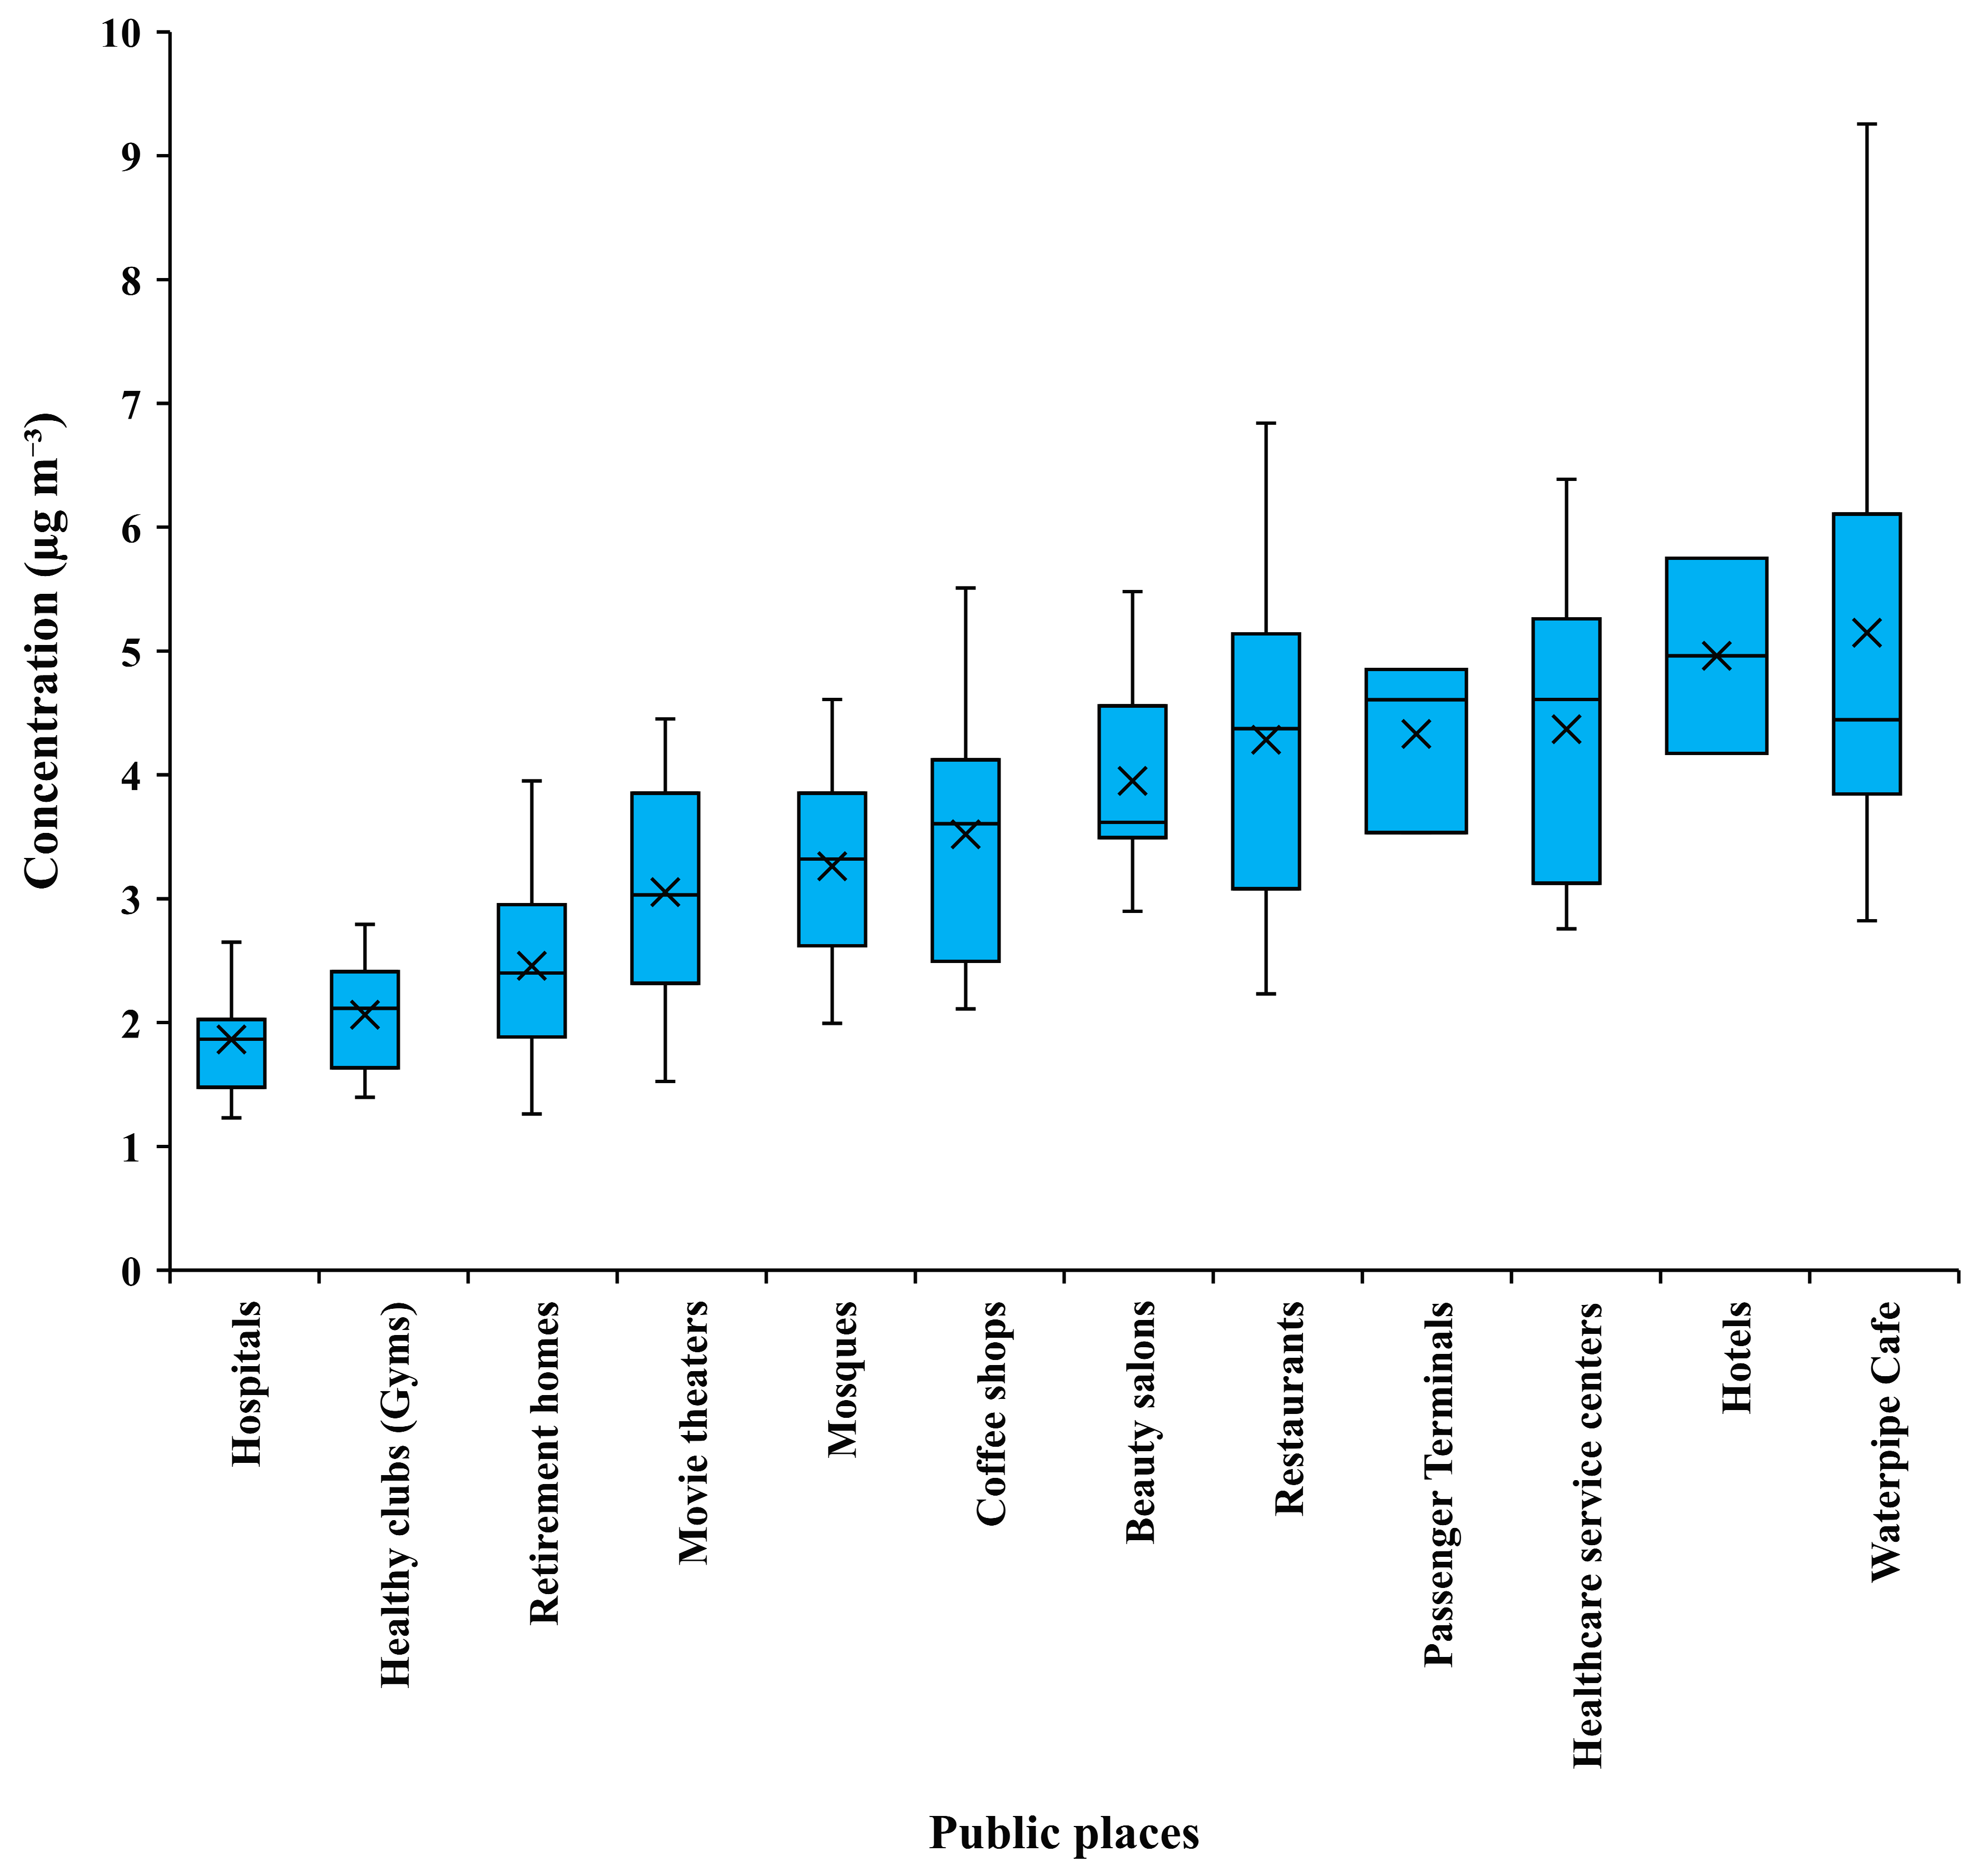
3.3. NO2 and SO2 Concentration

Figure 2 shows the boxplots of indoor NO2 collected during the sampling period. Monitoring results showed that the average indoor NO2 concentration in the public places in Tehran was in the range of 13–30 µg/m3, with the following order: waterpipe cafés (~29.6) > hotels (26.4) > healthcare service centers (25.4) > passenger terminals (24.9) > restaurants (24.4) > beauty salons (20.5) > mosques (19.5) > coffee shops (19.5) > movie theaters (15.5) > health clubs (15.1) > elderly care centers (15.0) > hospitals (~12.7). The results showed that the maximum NO2 concentrations were found in waterpipe cafés, and the minimum concentration was observed in hospitals and elderly care centers. It should be mentioned that the daily average concentrations recorded in waterpipe cafés, hotels, and healthcare service centers exceeded the new air quality guideline value by the WHO (25 µg/m3) [22], while in the other public places, the mean indoor NO2 concentration was lower than this guideline. In a study conducted by Hwang et al. in South Korea, the concentration of NO2 was measured in hospitals and elderly care centers. The results indicated that the average NO2 concentration in hospitals and elderly care centers was 14.4 µg/m3 and 10.6 µg/m3, respectively. These findings are lower than the NO2 concentration measured in hospitals but higher than the NO2 concentration observed in elderly care centers in the current investigation. It is worth noting that the differences in the NO2 levels between the studies may be attributed to variations in the study design, sample size, and location, among other factors. Nonetheless, these findings underscore the importance of monitoring indoor air quality in healthcare facilities and implementing effective strategies to mitigate exposure to air pollutants, particularly among vulnerable populations such as the elderly. Confirming the significant difference in the concentrations of NO2 by Kruskal–Wallis tests, the NO2 values were compared in pairs. The results showed that there was a statistically significant difference between the indoor air NO2 concentration in coffee shops and hospitals (p-value < 0.001). Indoor NO2 originates from various sources, such as air exchange (e.g., mechanical ventilation, natural ventilation, and infiltration), indoor sources (e.g., heating, cooking, and smoking), and chemical reactions (e.g., surface reactions and gas reactions) [52]. Study results imply that NO2 and BTEX compounds increase the potential for tropospheric ozone formation, which is another harmful indoor air pollutant [18].
The indoor SO2 concentrations in the investigated public places in Tehran have presented in Figure 3. The mean indoor air SO2 concentration was between 1.86 and 5.15 µg/m3. The results showed that the maximum indoor SO2 concentration was recorded in waterpipe cafés, and the minimum concentration was observed in hospitals and health clubs. Our results showed that the indoor SO2 concentrations detected during the present study were much lower than the WHO air quality guideline values (40 µg/m3) [22]. Dunn’s Bonferroni Pairwise Comparison showed that there was a statistically significant difference between the SO2 concentration of hospitals and health clubs compared with beauty salons, restaurants, healthcare service centers, and waterpipe cafés. The low levels of indoor SO2 found in this study indicate that cooking and heating fuels, including liquefied petroleum gas (LPG) and electricity in the study area, contain low levels of sulfur [53].

3.4. The Indoor-to-Outdoor Concentration Ratio

The average PM2.5, NO2, and SO2 indoor-to-outdoor air (I/O) ratios in the investigated public places in Tehran are presented in Table 3. The mean PM2.5 indoor-to-outdoor air ratio was between 0.67 and 11.09 in 12 categories of public environments. In fact, higher than unity ratios show the presence of indoor sources or an increased ambient pollution infiltration. Ambient particles originating from mobile sources, industries, combustion, and natural sources can penetrate the indoor air through poor ventilation and infiltration through cracks and leaks and lead to accumulated indoor particulate matter. On the other hand, major indoor sources, such as combustion, high client density, and serving smoke instruments, are common in some public environments [50,52]. As shown in Table 3, public places that serve smoking or have been allowed to use smoking (e.g., waterpipe cafés, some restaurants, and coffee shops) have a particularly higher I/O ratio. Particulate matter can also be carried into the indoor air through soil adhering to footwear and the subsequent suspension due to a large number of visitors and customers [54]. Contrary to PM2.5, the I/O ratio of NO2 and SO2 is particularly lower than the unity for the sampled places. In fact, ratios lower than unity show the absence of indoor sources for these pollutants or the presence of an appropriate air exchange rate. Moreover, lower I/O for gaseous pollutants may be due to chemical reactions and deposition [55]. Studies have shown that the use of fuels other than LPG, such as charcoal, firewood, dunk, and other solid fuels, can greatly increase the NO2 I/O ratio [56]. None of the sampled places in the current study used solid fuels, and this feature may be a key factor in determining indoor NO2. SO2 is produced by the consumption of gasoline, gas, oil, and coal in industries and vehicles, and its raised concentrations have a significant impact on the health and economy of societies in urban areas [57]. In recent years, reducing the sulfur of gasoline in Iran has diminished the ambient SO2 and its infiltration into indoor environments [58].

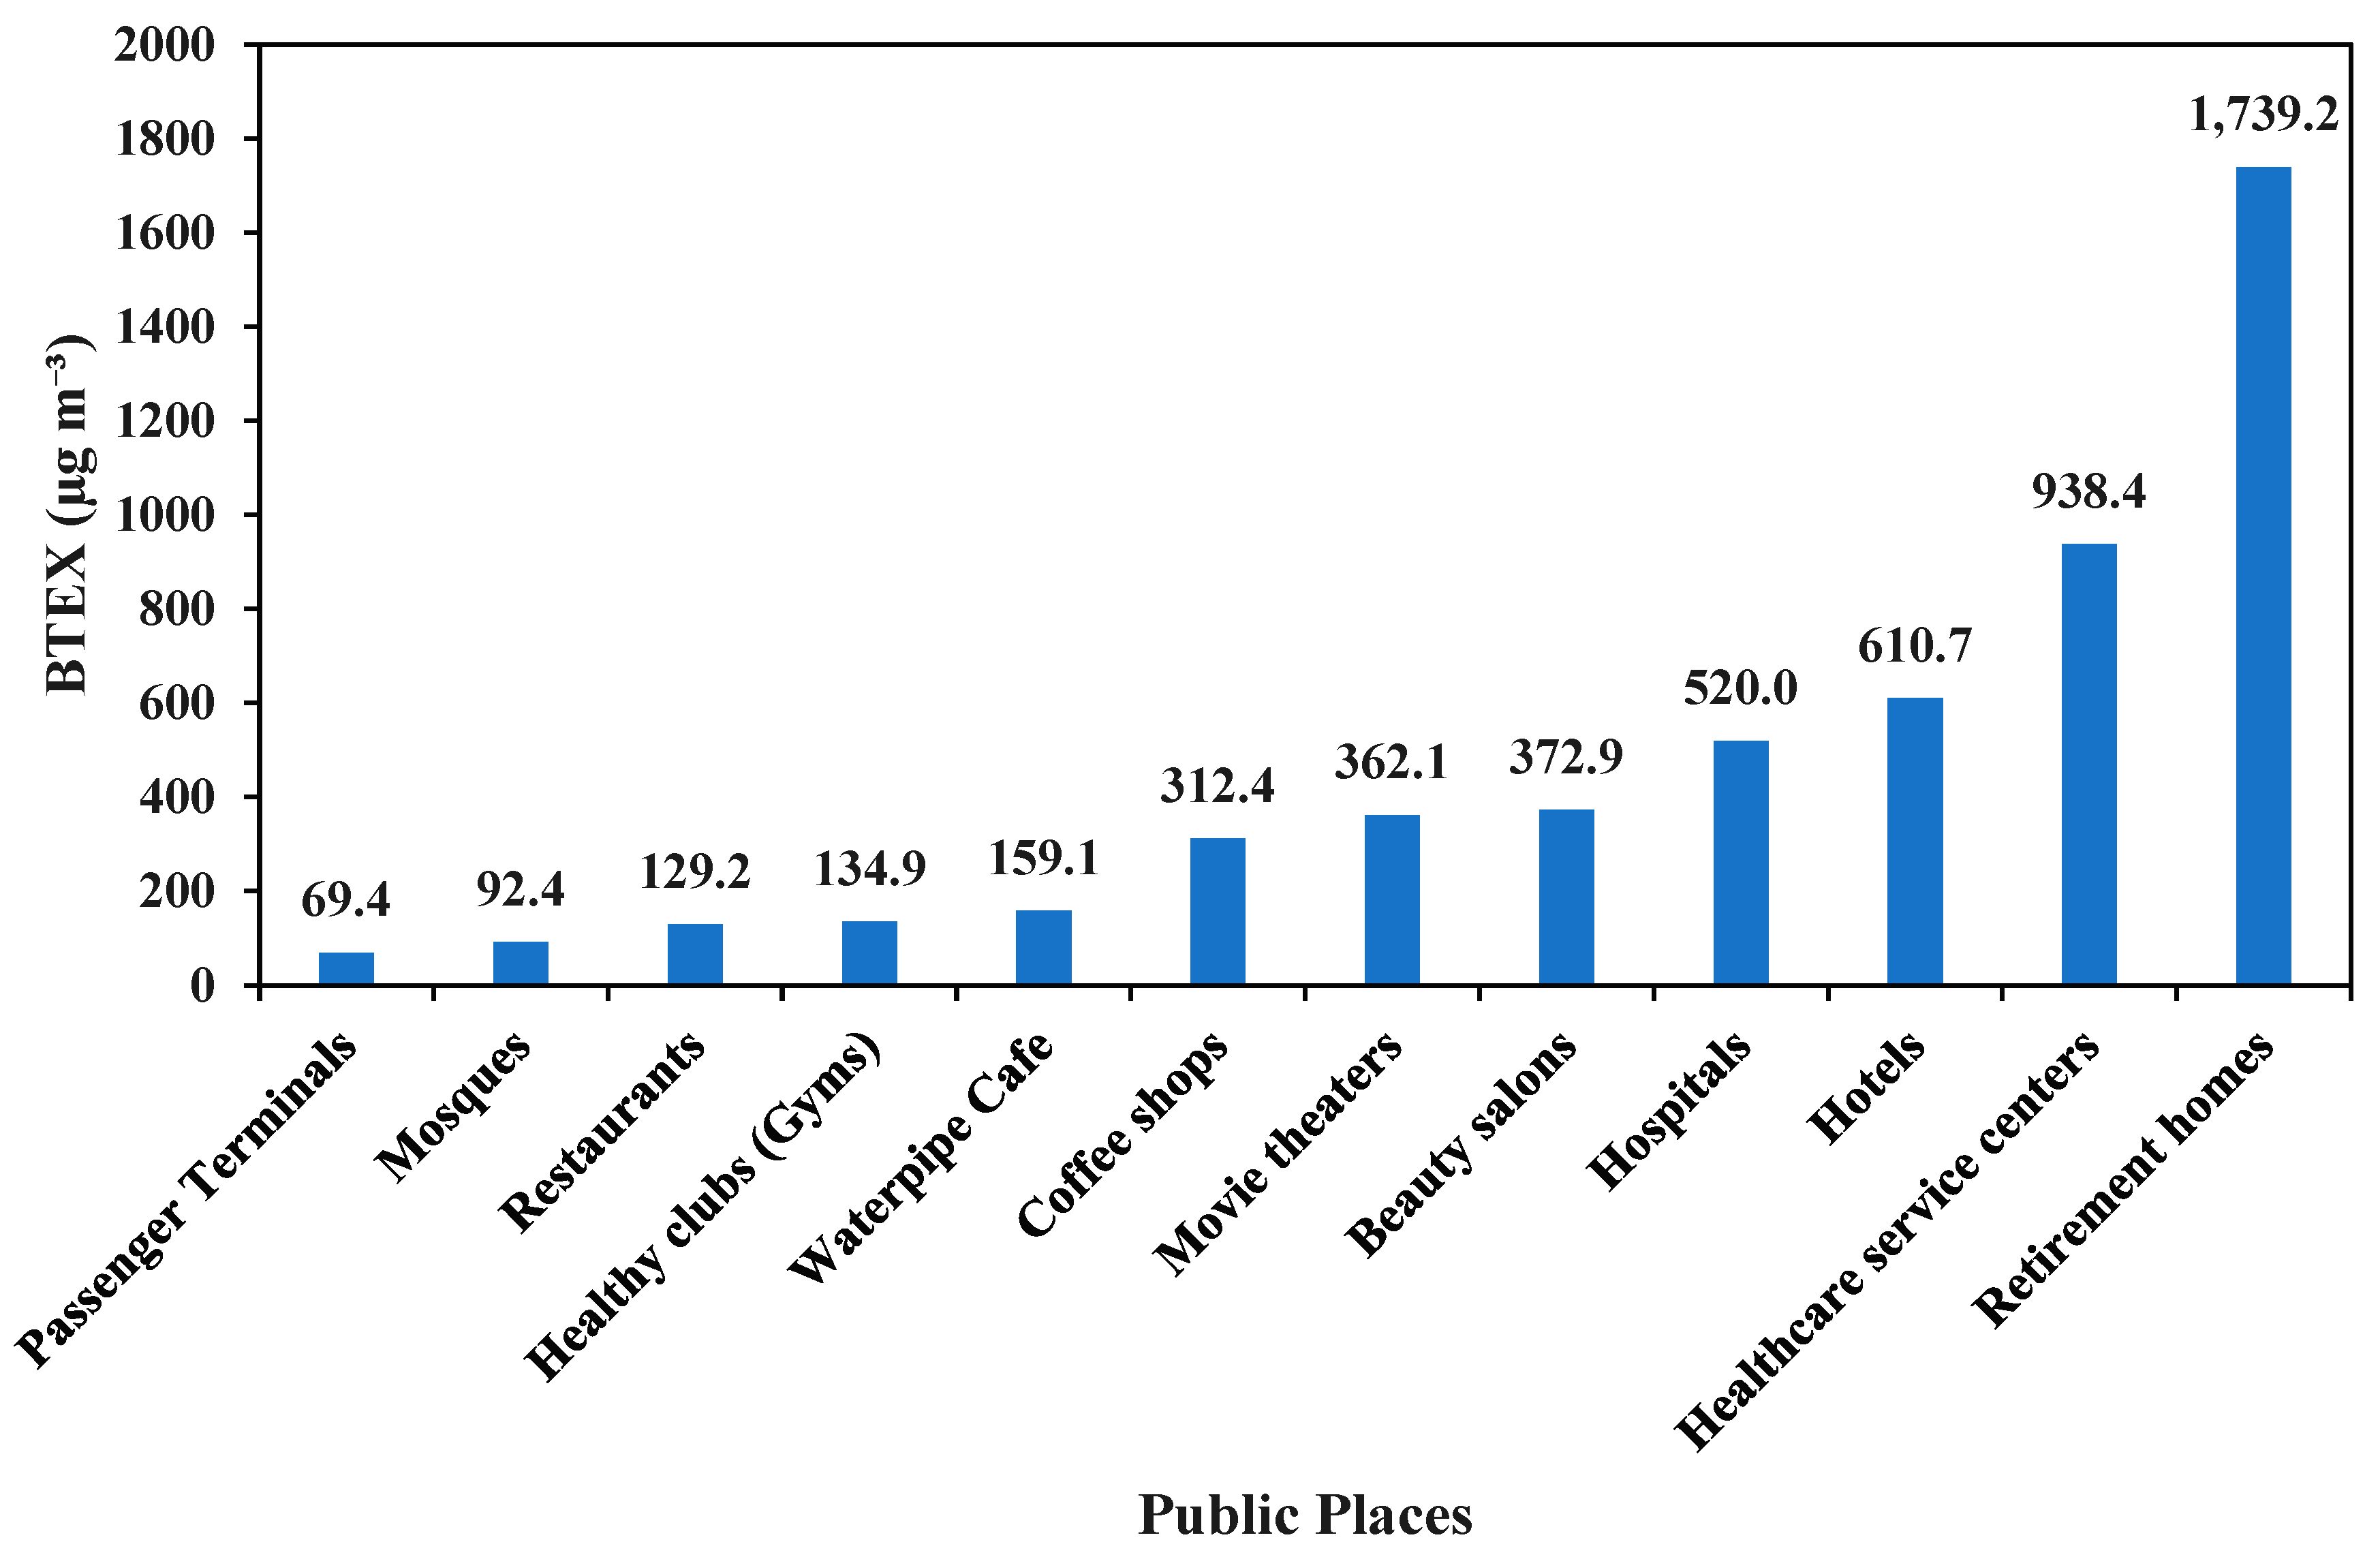
3.5. BTEX and Nicotine Concentration

Figure 4 presents the indoor air BTEX concentration in public places in Tehran city. As shown in Figure 4, the mean indoor BTEX concentration was in the range of 69.5–1739.2 µg/m3, with the following order: elderly care centers (1739.2) > healthcare service centers (938.5) > hotels (610.7) > hospitals (520) > women’s beauty salons (372.9) > movie theaters (362.1) > coffee shops (312.4) > waterpipe cafés (159.1) > health clubs (134.9) > restaurants (129.2) > mosques (92.4) > passenger terminals (69.5).
Figure 5 shows the radar plot of indoor nicotine concentrations in the investigated public places in Tehran city. Based on the objectives of this study, 22 nicotine samples were taken from women’s beauty salons (1), hospitals (2), passenger terminals (3), restaurants (3), waterpipe cafés (7), cafés (4), healthcare centers (1), and hotels (1). As shown in the figure, indoor nicotine concentration was between not detected (ND) and 48.96 µg/m3. The results showed that nicotine concentration was lower than the method limit of detection in a women’s beauty salon, a hospital, a healthcare center, and a hotel. The maximum nicotine concentration is usually detected in waterpipe cafés and cafés. The average nicotine concentration in the investigated waterpipe cafés was about 33 µg/m3, while this value was 24.5 µg/m3 for the café. Moreover, nicotine concentration was 25 µg/m3 for the Tehran Bahonar Hospital and 20.6 and 19.58 µg/m3 for passenger terminals and restaurants, respectively.
As shown in Table 4, the average indoor benzene concentrations in the selected public environments of Tehran were between 25.4 and 203.8 µg/m3, with the following order: hospitals (203.8) > elderly care centers (187) > healthcare service centers (170.5) > passenger terminals (90.1) > women’s beauty salons (69.8) > movie theaters (69.7) > restaurants (57.8) > hotels (46.4) > cafés (37.9) > health clubs (36) > mosques (28.2) > waterpipe cafés (25.4). As can be seen in the table, in this study, the dominant BTEX compound in public places of Tehran was toluene, except in passenger terminals. BTEX’s most common indoor air sources include household activities (such as cleaning, smoking, cooking, heating, and burning), building materials (including fabrications, furnishings, carpets, paints, and glues), and cosmetics [59]. Hairdressers utilize various cosmetics products, such as shampoos, permanent wave solutions, hair dyes, straighteners, bleaches, and hair sprays [60]. These products are the source of volatile organic compounds (VOCs) released into the air of beauty salons [61]. High levels of benzene in passenger terminals are associated with vehicular sources. The average concentrations of benzene, toluene, ethylbenzene, and xylene in the studied healthcare centers were 170.5, 843.4, 30.8, and 32.4 µg/m3, and high BTEX levels in such places and the sampled hospitals may be related to used cleaning solvents. Staff and patients of these places are at risk of adverse consequences, such as irritation in the mucous membrane, discomfort, headache, nausea, fatigue, lack of concentration, and poor work efficiency, as a result of exposure to VOCs [59]. Kheirmand et al. conducted a study to measure the concentration of BTEX (benzene, toluene, ethylbenzene, and xylene) in hospitals. The results of their investigation revealed that the concentrations of these chemical compounds were lower than those observed in the current study. Specifically, the concentrations of benzene, toluene, ethylbenzene, and xylene were 1.03, 0.96, 0.78, and 0.86 μg/m3, respectively [62]. Similarly, Dehghani et al. investigated BTEX concentrations in gyms and found that the concentrations of these chemical compounds were lower than those observed in the current study, with the exception of benzene. Specifically, the concentrations of benzene, toluene, ethylbenzene, and xylene were reported to be 75.1, 34.1, 54.8, and 19.5 µg/m3, respectively [33]. Baghani et al. investigated BTEX concentration in beauty salons [63]. They reported the concentrations of benzene, toluene, ethylbenzene, and xylene to be 32.4, 16.1, 62.38, and 13.82 µg/m3, respectively, which are lower than BTEX concentrations measured in the present study, except for ethylbenzene. Hazrati et al. investigated BTEX concentration in waterpipe cafés [64]. They reported the concentrations of benzene, toluene, ethylbenzene, and xylene to be 4960, 4860, 4380, and 6690 µg/m3, respectively, which are higher than BTEX concentrations measured in the present study, except for benzene. The tobaccos used in the preparation of waterpipes are presumably the main sources of BTEX emissions for the indoor ambient air of the cafés [65]. This concentration difference may be due to outdoor air pollution, cleaning solution and detergent, building age and materials, and type of public place performance.

3.6. BTEX’s Health Risk Assessment

Environmental pollutants may enter the human body through three main routes, including ingestion, inhalation, and dermal absorption. However, BTEX compounds were only monitored in the air, and then inhalation was considered as the main single exposure route for assessing the attributed health risks [18].
In this study, health risk was assessed according to the model proposed by U.S. EPA through a probabilistic procedure using the Monte Carlo simulation technique.

3.6.1. Non-Carcinogenic Risk

Calculated HQ and HI for public places are presented in Table 5 and Figure 6. Calculations show that the highest non-carcinogenic risk in the indoor air of investigated public places was associated with exposure to benzene. Hospitals, elderly care centers, and healthcare service centers had the most hazard index compared to other places. However, the amount of HQ and HI in none of the places was more than the amount of the guideline. In agreement with the present study, studies have also reported the safe level of non-cancer risk for BTEX compounds in gyms, beauty salons, and water pipe cafés [33,63,64].

3.6.2. Carcinogenic Risk

Furthermore, in the case of carcinogenic risk assessment, it would be considered as a low cancer risk when the LTCR index is lower than 1 × 10⁻⁶ and when the LTCR is more than 1 × 10⁻⁴, indicating carcinogenic effects of concern. When this criterion is between 1 × 10⁻⁶ and 1 × 10⁻⁴, it can be considered as an acceptable risk [66]. Table 6 shows that the LTCR exceeded the recommended limit in several public places, including hospitals, restaurants, elderly care centers, passenger terminals, movie theaters, and beauty salons. These findings are consistent with previous research that has also reported unsafe levels of cancer risk associated with exposure to BTEX chemicals in beauty salons and among elderly residents [63,67]. As you can see, the LTCR index in hospitals had the highest value compared to other types of places, and its probability distributions of benzene cancer risk are shown in Figure 7. Detailed information about the probability distributions of BTEX compounds’ cancer and non-cancer risk in public environments is presented in Figures S1–S12 (Supplementary Material).

4. Conclusions

The present study was performed to assess the indoor/outdoor concentrations of PM2.5, BTEX, NO2, and SO2 in 12 categories of public places in Tehran, including hospitals, elderly care centers, healthcare service centers, health clubs, waterpipe cafés, cafés, restaurants, beauty salons, passenger terminals, masques, hotels, and movie theaters. Our results indicate the diversity of indoor air quality among different public places. The mean thermal comfort values were generally within the WHO and NIOSH recommended ranges. Moreover, the average indoor PM2.5 levels exceeded the recommended values by the WHO in all types of investigated public places. The mean BTEX concentration was in the range of 69.5–1739.2 µg/m3. The mean concentration of benzene, toluene, ethylbenzene, and xylene in the indoor air of the sampled places ranged from 25.4 to 203.8, 30.7 to 1563.2, 8.4 to 53.4, and 3.6 to 43.3 µg/m3, respectively. Indoor nicotine concentration varied significantly in public places ranging from ND to 48.96 µg/m3. The concentration of nicotine in beauty salons, hospitals, healthcare centers, and hotels was lower than that of waterpipe cafés and cafés. NO2 level was higher than the reference concentration in waterpipe cafés, hotels, and healthcare service centers. However, the average concentration of SO2 in none of the investigated places was more than the guideline value.
Indoor-to-outdoor evaluation results show that the average concentration of PM2.5 was more than outdoors in eight out of 12 categories, including waterpipe cafés, restaurants, coffee shops, passenger terminals, beauty salons, hotels, elderly care centers, and healthcare service centers. Other surveyed pollutants, including NO2 and SO2, had lower average indoor concentrations than outdoors. In addition, the potential health risks associated with exposure to BTEX compounds were examined. A remarkable point in this assessment among the groups of places was the considerable risk indicators in the case of benzene exposure in health-oriented places, including hospitals, elderly care centers, and healthcare service centers. According to the findings, benzene’s cancer and non-cancer risks showed an unacceptable value in these public environments. Management of solvents and improving ventilation in such places should be particularly considered.

Supplementary Materials

The following supporting information can be downloaded at: https://www.mdpi.com/article/10.3390/atmos14071080/s1, Figure S1: Probability distributions of BTEX cancer and non-cancer risk in beauty salons; Figure S2: Probability distributions of BTEX cancer and non-cancer risk in coffe shops; Figure S3: Probability distributions of BTEX cancer and non-cancer risk in elderly care centers; Figure S4: Probability distributions of BTEX cancer and non-cancer risk in health clubs; Figure S5: Probability distributions of BTEX cancer and non-cancer risk in healthcare service centers; Figure S6: Probability distributions of BTEX cancer and non-cancer risk in hospitals; Figure S7: Probability distributions of BTEX cancer and non-cancer risk in hotels; Figure S8: Probability distributions of BTEX cancer and non-cancer risk in mosques; Figure S9: Probability distributions of BTEX cancer and non-cancer risk in movie theaters; Figure S10: Probability distributions of BTEX cancer and non-cancer risk in passenger terminals; Figure S11: Probability distributions of BTEX cancer and non-cancer risk in restaurants; Figure S12: Probability distributions of BTEX cancer and non-cancer risk in waterpipe cafes; Table S1: LOD, LOQ and recovery efficiency values.

Author Contributions

Conceptualization, A.D., A.T., M.S.H. and S.F.; methodology, M.S.H., S.F. and A.M., software, A.D., A.T. and M.H.; validation, M.S.H., K.N. and S.F., formal analysis, R.N. and M.S.; investigation, A.D., A.T., M.S.H., A.M. and S.F.; data curation, A.D., A.T., M.S.H. and S.F.; writing—original draft preparation, A.D., A.T., M.S.H., A.M. and S.F.; writing—review and editing, A.D., A.T., M.S.H., A.M., R.N., S.N., M.S.H., K.N., M.H. and S.F.; visualization, A.D., A.T., M.S.H. and S.F.; supervision, M.S.H. and S.F.; project administration, A.D., A.T., M.S.H., A.M. and S.F.; funding acquisition, M.S.H. All authors have read and agreed to the published version of the manuscript.

Funding

This study was financially supported by the Eastern Mediterranean Region, World Health Organization Office in Iran (grant number: 2019/938676) and the Institute for Environmental Research (IER), Tehran University of Medical Sciences (grant number: 98-3-110-45361).

Institutional Review Board Statement

Not applicable.

Informed Consent Statement

Not applicable.

Data Availability Statement

All data have been used in this paper.

Acknowledgments

The authors of this paper would like to thank all of those who have cooperated with this study.

Conflicts of Interest

The authors declare no conflict of interest.

References

  1. Faridi, S.; Niazi, S.; Yousefian, F.; Azimi, F.; Pasalari, H.; Momeniha, F.; Mokammel, A.; Gholampour, A.; Hassanvand, M.S.; Naddafi, K. Spatial homogeneity and heterogeneity of ambient air pollutants in Tehran. Sci. Total Environ. 2019, 697, 134123. [Google Scholar] [CrossRef] [PubMed]
  2. Marlier, M.E.; Jina, A.S.; Kinney, P.L.; DeFries, R.S. Extreme air pollution in global megacities. Curr. Clim. Change Rep. 2016, 2, 15–27. [Google Scholar]
  3. Stranger, M.; Potgieter-Vermaak, S.; Van, R.G. Characterization of indoor air quality in primary schools in Antwerp, Belgium. Indoor Air 2008, 18, 454–463. [Google Scholar] [CrossRef]
  4. Hamidin, N.; Yu, J.; Phung, D.T.; Connell, D.; Chu, C. Volatile aromatic hydrocarbons (VAHs) in residential indoor air in Brisbane, Australia. Chemosphere 2013, 92, 1430–1435. [Google Scholar]
  5. Delgado-Saborit, J.M.; Aquilina, N.J.; Meddings, C.; Baker, S.; Harrison, R.M. Relationship of personal exposure to volatile organic compounds to home, work and fixed site outdoor concentrations. Sci. Total Environ. 2011, 409, 478–488. [Google Scholar] [PubMed]
  6. Azuma, K.; Uchiyama, I.; Uchiyama, S.; Kunugita, N. Assessment of inhalation exposure to indoor air pollutants: Screening for health risks of multiple pollutants in Japanese dwellings. Environ. Res. 2016, 145, 39–49. [Google Scholar] [CrossRef] [PubMed]
  7. Martellini, T.; Berlangieri, C.; Dei, L.; Carretti, E.; Santini, S.; Barone, A.; Cincinelli, A. Indoor levels of volatile organic compounds at Florentine museum environments in Italy. Indoor Air 2020, 30, 900–913. [Google Scholar] [CrossRef]
  8. Nakhjirgan, P.; Kashani, H.; Naddafi, K.; Nabizadeh, R.; Amini, H.; Yunesian, M. Maternal exposure to air pollutants and birth weight in Tehran, Iran. J. Environ. Health Sci. Eng. 2019, 17, 711–717. [Google Scholar] [CrossRef]
  9. Baurès, E.; Blanchard, O.; Mercier, F.; Surget, E.; Le Cann, P.; Rivier, A.; Gangneux, J.-P.; Florentin, A. Indoor air quality in two French hospitals: Measurement of chemical and microbiological contaminants. Sci. Total Environ. 2018, 642, 168–179. [Google Scholar] [CrossRef] [PubMed]
  10. WHO. Household Air Pollution and Health. 2022. Available online: https://www.who.int/news-room/fact-sheets/detail/household-air-pollution-and-health (accessed on 28 November 2022).
  11. Śmiełowska, M.; Marć, M.; Zabiegała, B. Indoor air quality in public utility environments—A review. Environ. Sci. Pollut. Res. 2017, 24, 11166–11176. [Google Scholar]
  12. Ramos, C.; Wolterbeek, H.; Almeida, S. Exposure to indoor air pollutants during physical activity in fitness centers. Build. Environ. 2014, 82, 349–360. [Google Scholar]
  13. Romagnoli, P.; Balducci, C.; Perilli, M.; Vichi, F.; Imperiali, A.; Cecinato, A. Indoor air quality at life and work environments in Rome, Italy. Environ. Sci. Pollut. Res. 2016, 23, 3503–3516. [Google Scholar]
  14. Brook, R.D.; Rajagopalan, S.; Pope, C.A., III; Brook, J.R.; Bhatnagar, A.; Diez-Roux, A.V.; Holguin, F.; Hong, Y.; Luepker, R.V.; Mittleman, M.A. Particulate matter air pollution and cardiovascular disease: An update to the scientific statement from the American Heart Association. Circulation 2010, 121, 2331–2378. [Google Scholar]
  15. Lelieveld, J.; Evans, J.S.; Fnais, M.; Giannadaki, D.; Pozzer, A. The contribution of outdoor air pollution sources to premature mortality on a global scale. Nature 2015, 525, 367–371. [Google Scholar] [CrossRef] [PubMed]
  16. Guo, H.; Lee, S.; Li, W.; Cao, J. Source characterization of BTEX in indoor microenvironments in Hong Kong. Atmos. Environ. 2003, 37, 73–82. [Google Scholar] [CrossRef]
  17. Shallis, R.M.; Weiss, J.J.; Deziel, N.C.; Gore, S.D. A clandestine culprit with critical consequences: Benzene and acute myeloid leukemia. Blood Rev. 2021, 47, 100736. [Google Scholar]
  18. Ghaffari, H.R.; Kamari, Z.; Hassanvand, M.S.; Fazlzadeh, M.; Heidari, M. Level of air BTEX in urban, rural and industrial regions of Bandar Abbas, Iran; indoor-outdoor relationships and probabilistic health risk assessment. Environ. Res. 2021, 200, 111745. [Google Scholar] [CrossRef]
  19. Golkhorshidi, F.; Sorooshian, A.; Jafari, A.J.; Baghani, A.N.; Kermani, M.; Kalantary, R.R.; Ashournejad, Q.; Delikhoon, M. On the nature and health impacts of BTEX in a populated middle eastern city: Tehran, Iran. Atmos. Pollut. Res. 2019, 10, 921–930. [Google Scholar]
  20. Brauer, M.; Lencar, C.; Tamburic, L.; Koehoorn, M.; Demers, P.; Karr, C. A cohort study of traffic-related air pollution impacts on birth outcomes. Environ. Health Perspect. 2008, 116, 680–686. [Google Scholar] [CrossRef] [Green Version]
  21. Gauderman, W.J.; Avol, E.; Gilliland, F.; Vora, H.; Thomas, D.; Berhane, K.; McConnell, R.; Kuenzli, N.; Lurmann, F.; Rappaport, E. The effect of air pollution on lung development from 10 to 18 years of age. N. Engl. J. Med. 2004, 351, 1057–1067. [Google Scholar] [CrossRef] [Green Version]
  22. WHO. WHO Global Air Quality Guidelines: Particulate Matter (PM2.5 and PM10), Ozone, Nitrogen Dioxide, Sulfur Dioxide and Carbon Monoxide. Available online: https://apps.who.int/iris/handle/10665/345329 (accessed on 7 September 2021).
  23. Li, W.-M.; Lee, S.C.; Chan, L.Y. Indoor air quality at nine shopping malls in Hong Kong. Sci. Total Environ. 2001, 273, 27–40. [Google Scholar] [CrossRef] [PubMed]
  24. Lei, L.; Chen, W.; Xue, Y.; Liu, W. A comprehensive evaluation method for indoor air quality of buildings based on rough sets and a wavelet neural network. Build. Environ. 2019, 162, 106296. [Google Scholar] [CrossRef]
  25. Mokammel, A.; Rostami, R.; Niazi, S.; Asgari, A.; Fazlzadeh, M. BTEX levels in rural households: Heating system, building characteristic impacts and lifetime excess cancer risk assessment. Environ. Pollut. 2022, 298, 118845. [Google Scholar] [CrossRef] [PubMed]
  26. Al Hanai, A.H.; Antkiewicz, D.S.; Hemming, J.D.; Shafer, M.M.; Lai, A.M.; Arhami, M.; Hosseini, V.; Schauer, J.J. Seasonal variations in the oxidative stress and inflammatory potential of PM2.5 in Tehran using an alveolar macrophage model; The role of chemical composition and sources. Environ. Int. 2019, 123, 417–427. [Google Scholar]
  27. Statical_Center_of_Iran. Population-and-Housing-Censuses. 2016. Available online: https://www.amar.org.ir/english/Population-and-Housing-Censuses (accessed on 13 June 2023).
  28. Faridi, S.; Yousefian, F.; Niazi, S.; Ghalhari, M.R.; Hassanvand, M.S.; Naddafi, K. Impact of SARS-CoV-2 on ambient air particulate matter in Tehran. Aerosol Air Qual. Res. 2020, 20, 1805–1811. [Google Scholar] [CrossRef]
  29. Bayat, R.; Ashrafi, K.; Motlagh, M.S.; Hassanvand, M.S.; Daroudi, R.; Fink, G.; Künzli, N. Health impact and related cost of ambient air pollution in Tehran. Environ. Res. 2019, 176, 108547. [Google Scholar]
  30. Amini, H.; Schindler, C.; Hosseini, V.; Yunesian, M.; Künzli, N. Land use regression models for Alkylbenzenes in a middle eastern megacity: Tehran study of exposure prediction for environmental Health Research (Tehran SEPEHR). Environ. Sci. Technol. 2017, 51, 8481–8490. [Google Scholar] [CrossRef] [Green Version]
  31. Rohani-Rasaf, M.; Rohani-Rasaf, M.R.; Asadi-Lari, M.; Hashemi Nazari, S.S. Regional differences in cancer incidence trend in tehran, Iran: A contextual study on the effect of socioeconomic status at regional level. Int. J. Cancer Manag. 2018, 11. [Google Scholar] [CrossRef]
  32. KIMO. Kimo HD110 Thermo-Hygrometer. Available online: https://www.onetemp.com.au/hd110 (accessed on 13 June 2023).
  33. Dehghani, M.H.; Baghani, A.N.; Fazlzadeh, M.; Ghaffari, H.R. Exposure and risk assessment of BTEX in indoor air of gyms in Tehran, Iran. Microchem. J. 2019, 150, 104135. [Google Scholar] [CrossRef]
  34. NIOSH. Indoor Environmental Quality: HVAC Management. 2021. Available online: https://www.cdc.gov/niosh/topics/indoorenv/hvac.html (accessed on 25 February 2022).
  35. WHO. Indoor Air—WHO/Europe. 2021. Available online: http://www.euro.who.int/__data/assets/pdf_file/0005/156146/WA754ES.pdf (accessed on 20 June 2023).
  36. Vehviläinen, T.; Lindholm, H.; Rintamäki, H.; Pääkkönen, R.; Hirvonen, A.; Niemi, O.; Vinha, J. High indoor CO2 concentrations in an office environment increases the transcutaneous CO2 level and sleepiness during cognitive work. J. Occup. Environ. Hyg. 2016, 13, 19–29. [Google Scholar] [CrossRef]
  37. Mackinson, F. Occupational health guidelines for chemical hazards. NIOSH/OSHA 1981, 81–123. [Google Scholar]
  38. Standard 62.1-2019; Ventilation for Acceptable Indoor Air Quality. ASHRAE Standing Standard Project Committee 62.1. ASHRAE: Atlanta, GA, USA, 2019.
  39. Viveiros, F.; Gaspar, J.L.; Ferreira, T.; Silva, C. Hazardous indoor CO2 concentrations in volcanic environments. Environ. Pollut. 2016, 214, 776–786. [Google Scholar]
  40. Slezakova, K.; Peixoto, C.; do Carmo Pereira, M.; Morais, S. Indoor air quality in health clubs: Impact of occupancy and type of performed activities on exposure levels. J. Hazard. Mater. 2018, 359, 56–66. [Google Scholar]
  41. Morawska, L.; Tang, J.W.; Bahnfleth, W.; Bluyssen, P.M.; Boerstra, A.; Buonanno, G.; Cao, J.; Dancer, S.; Floto, A.; Franchimon, F. How can airborne transmission of COVID-19 indoors be minimised? Environ. Int. 2020, 142, 105832. [Google Scholar] [CrossRef]
  42. Jung, C.-C.; Wu, P.-C.; Tseng, C.-H.; Su, H.-J. Indoor air quality varies with ventilation types and working areas in hospitals. Build. Environ. 2015, 85, 190–195. [Google Scholar]
  43. Loupa, G.; Zarogianni, A.-M.; Karali, D.; Kosmadakis, I.; Rapsomanikis, S. Indoor/outdoor PM2.5 elemental composition and organic fraction medications, in a Greek hospital. Sci. Total Environ. 2016, 550, 727–735. [Google Scholar] [CrossRef] [PubMed]
  44. Naddafi, K.; Nabizadeh, R.; Rostami, R.; Ghaffari, H.R.; Fazlzadeh, M. Formaldehyde and acetaldehyde in the indoor air of waterpipe cafés: Measuring exposures and assessing health effects. Build. Environ. 2019, 165, 106392. [Google Scholar]
  45. Fromme, H.; Dietrich, S.; Heitmann, D.; Dressel, H.; Diemer, J.; Schulz, T.; Jörres, R.A.; Berlin, K.; Völkel, W. Indoor air contamination during a waterpipe (narghile) smoking session. Food Chem. Toxicol. 2009, 47, 1636–1641. [Google Scholar] [CrossRef]
  46. Maziak, W.; Ali, R.A.; Fouad, M.; Rastam, S.; Wipfli, H.; Travers, M.; Ward, K.; Eissenberg, T. Exposure to secondhand smoke at home and in public places in Syria: A developing country’s perspective. Inhal. Toxicol. 2008, 20, 17–24. [Google Scholar] [CrossRef]
  47. Fiala, S.C.; Morris, D.S.; Pawlak, R.L. Measuring indoor air quality of hookah lounges. Am. J. Public Health 2012, 102, 2043–2045. [Google Scholar] [CrossRef] [PubMed]
  48. Travers, M.J.; Kulak, J.A.; Vogl, L. Waterpipe cafés are hazardous to your health: Determination of a waterpipe specific calibration factor. Int. J. Hyg. Environ. Health 2018, 221, 48–53. [Google Scholar] [CrossRef]
  49. Zhou, S.; Weitzman, M.; Vilcassim, R.; Wilson, J.; Legrand, N.; Saunders, E.; Travers, M.; Chen, L.-C.; Peltier, R.; Gordon, T. Air quality in New York City hookah bars. Tob. Control 2015, 24, e193–e198. [Google Scholar] [CrossRef] [PubMed] [Green Version]
  50. Naddafi, K.; Nabizadeh, R.; Rostamy, R.; Kalan, M.E.; Hassanvand, M.S.; Fazlzadeh, M. Indoor air quality in waterpipe cafés: Exposure level to particulate matter. Environ. Sci. Pollut. Res. 2019, 26, 26605–26616. [Google Scholar] [CrossRef] [PubMed]
  51. Mohammadyan, M.; Shabankhani, B. Indoor PM1, PM2.5, PM10 and outdoor PM2.5 concentrations in primary schools in Sari, Iran. Arh. Za Hig. Rada I Toksikol. 2013, 64, 371–376. [Google Scholar] [CrossRef] [Green Version]
  52. Hwang, S.H.; Park, W.M. Indoor air concentrations of carbon dioxide (CO2), nitrogen dioxide (NO2), and ozone (O3) in multiple healthcare facilities. Environ. Geochem. Health 2020, 42, 1487–1496. [Google Scholar] [CrossRef]
  53. Agbo, K.E.; Walgraeve, C.; Eze, J.I.; Ugwoke, P.E.; Ukoha, P.O.; Van Langenhove, H. Household indoor concentration levels of NO2, SO2 and O3 in Nsukka, Nigeria. Atmos. Environ. 2021, 244, 117978. [Google Scholar] [CrossRef]
  54. Chen, C.; Zhao, B. Review of relationship between indoor and outdoor particles: I/O ratio, infiltration factor and penetration factor. Atmos. Environ. 2011, 45, 275–288. [Google Scholar] [CrossRef]
  55. Salonen, H.; Salthammer, T.; Morawska, L. Human exposure to NO2 in school and office indoor environments. Environ. Int. 2019, 130, 104887. [Google Scholar] [CrossRef] [PubMed]
  56. Hu, Y.; Zhao, B. Relationship between indoor and outdoor NO2: A review. Build. Environ. 2020, 180, 106909. [Google Scholar]
  57. Ebrahimi, M.; Qaderi, F. Determination of the most effective control methods of SO2 pollution in Tehran based on adaptive neuro-fuzzy inference system. Chemosphere 2021, 263, 128002. [Google Scholar] [CrossRef]
  58. Department of Environment, Iran. The Clean Air Act. 2017. Available online: https://www.doe.ir/ (accessed on 9 August 2017).
  59. Masih, A.; Dviwedi, S.; Lal, J. Source characterization and health risks of BTEX in indoor/outdoor air during winters at a terai precinct of North India. Environ. Geochem. Health 2021, 43, 2985–3003. [Google Scholar] [CrossRef]
  60. Halliday-Bell, J.A.; Gissler, M.; Jaakkola, J.J. Work as a hairdresser and cosmetologist and adverse pregnancy outcomes. Occup. Med. 2009, 59, 180–184. [Google Scholar] [CrossRef] [PubMed] [Green Version]
  61. Tsigonia, A.; Lagoudi, A.; Chandrinou, S.; Linos, A.; Evlogias, N.; Alexopoulos, E.C. Indoor air in beauty salons and occupational health exposure of cosmetologists to chemical substances. Int. J. Environ. Res. Public Health 2010, 7, 314–324. [Google Scholar] [CrossRef]
  62. Kheirmand, M.; Barkhordari, A.; Mosaddegh, M.H.; Farajzadegan, Z. Determination of benzene, toluene, ethyl benzene and xylene in administration room’s air of hospitals using solid phase micro extraction/gas chromatography/flame ionization detector. Int. J. Environ. Health Eng. 2014, 3, 27. [Google Scholar]
  63. Baghani, A.N.; Rostami, R.; Arfaeinia, H.; Hazrati, S.; Fazlzadeh, M.; Delikhoon, M. BTEX in indoor air of beauty salons: Risk assessment, levels and factors influencing their concentrations. Ecotoxicol. Environ. Saf. 2018, 159, 102–108. [Google Scholar] [CrossRef] [PubMed]
  64. Hazrati, S.; Rostami, R.; Fazlzadeh, M. BTEX in indoor air of waterpipe cafés: Levels and factors influencing their concentrations. Sci. Total Environ. 2015, 524, 347–353. [Google Scholar] [CrossRef]
  65. Markowicz, P.; Löndahl, J.; Wierzbicka, A.; Suleiman, R.; Shihadeh, A.; Larsson, L. A study on particles and some microbial markers in waterpipe tobacco smoke. Sci. Total Environ. 2014, 499, 107–113. [Google Scholar] [CrossRef] [PubMed] [Green Version]
  66. USEPA. Risk Assessment Guidance for Superfund: Volume III Part A, Process for Conducting Probabilistic Risk Assessment; US Environmental Protection Agency: Washington, DC, USA, 2001. Available online: https://www.epa.gov/sites/production/files/2015-09/documents/rags3adt_complete.pdf (accessed on 20 June 2023).
  67. Tunsaringkarn, T.; Prueksasit, T.; Morknoy, D.; Sawatsing, R.; Chinveschakitvanich, V.; Rungsiyothin, A.; Zapaung, K. Indoor air assessment, health risks, and their relationship among elderly residents in urban warrens of Bangkok, Thailand. Air Qual. Atmos. Health 2015, 8, 603–615. [Google Scholar] [CrossRef]
Figure 1. The boxplots of indoor PM2.5 concentrations in the public places of Tehran.
Atmosphere 14 01080 g001
Figure 2. The boxplots of indoor NO2 concentrations in the public places of Tehran.
Atmosphere 14 01080 g002
Figure 3. The boxplots of indoor SO2 concentrations in the public places of Tehran.
Atmosphere 14 01080 g003
Figure 4. The average indoor BTEX concentration in public places of Tehran.
Atmosphere 14 01080 g004
Figure 5. Indoor air nicotine concentrations in 22 investigated public places in Tehran.
Atmosphere 14 01080 g005
Figure 6. Hazard Index comparison in the studied public places.
Atmosphere 14 01080 g006
Figure 7. Probability distributions of benzene cancer risk in hospitals.
Atmosphere 14 01080 g007
Table 1. Values of the parameters used for the health risk assessment [18].
ParameterValuePollutionRfc (µg/m3)IUR (µg/m3)−1
ET (h/day)8Benzene307.8 × 10−6
EF (day/year)300Toluene5000
ED (year)30Ethylbenzene10002.5 × 10−6
AT (h)262,800Xylenes100
IR (m3/day)18.7
BW (kg)70
Table 2. Descriptive summary of indoor temperature, relative humidity, and CO2 during the study period.
Public PlacesTem. (°C)
Mean (Min-Max)
RH (%)
Mean (Min-Max)
CO2 (ppm)
Mean (Min-Max)
Hospitals21 (19–24)24 (20–27)613 (512–842)
Elderly care centers24 (23–26)26 (26–29)734 (582–893)
Health clubs21 (19–24)29 (22–33)850 (637–1041)
Restaurants21 (18–25)26 (21–35)768 (518–1018)
Waterpipe cafés20 (18–23)30 (19–44)1150 (1064–1272)
Coffee shops22 (20–27)26 (21–30)628 (557–793)
Passenger terminals21 (19–23)29 (25–35)561 (477–644)
Mosques19 (16–22)26 (18–33)430 (409–520)
Movie theaters24 (22–26)26 (19–36)540 (410–730)
Hotels19 (17–21)26 (16–35)675 (490–883)
Beauty salons22 (20–25)32 (21–51)945 (736–1032)
Healthcare service
centers
19 (16–23)25 (18–29)470 (430–580)
Table 3. The average indoor-to-outdoor ratios for PM2.5, NO2, and SO2 during the study period.
Public PlacesIndoor to Outdoor (I/O) Ratio
PM2.5NO2SO2
Hospitals0.670.310.38
Elderly care centers1.220.330.42
Health clubs0.800.310.43
Restaurants4.410.490.78
Waterpipe cafés11.090.500.84
Coffee shops2.000.400.64
Passenger terminals1.820.450.69
Mosques0.860.390.57
Movie theaters0.920.290.63
Hotels1.230.530.74
Beauty salons1.290.440.59
Healthcare service centers1.040.630.72
Table 4. The average indoor BTEX concentration (µg/m3) in public places during the study period.
Public PlacesBenzeneTolueneEthylbenzeneXylene
Hospitals203.8435.253.443.3
Elderly care centers187.01563.222.831.9
Health clubs36.092.618.517.1
Restaurants57.793.413.09.5
Waterpipe cafés25.4158.411.715.8
Coffee shops37.8297.627.923.6
Passenger terminals90.130.78.6-
Mosques28.278.58.43.6
Movie theaters69.7271.823.042.3
Hotels46.3529.024.933.5
Healthcare service centers170.5843.430.832.4
Beauty salons69.8305.814.118.3
Table 5. HQ comparison in the studied public environments.
Public PlacesBenzeneTolueneEthylbenzeneXylenes
Hospitals0.49720.00640.00390.0317
Elderly care centers0.45620.02290.00170.0233
Health clubs0.08780.00140.00140.0125
Restaurants0.14080.00140.00100.0070
Waterpipe cafés0.06200.00230.00090.0116
Coffee shops0.09220.00440.00200.0173
Passenger terminals0.21980.00040.0006-
Mosques0.06880.00110.00060.0026
Movie theaters0.17000.00400.00170.0310
Hotels0.11300.00770.00180.0245
Healthcare service centers0.41600.01230.00230.0237
Beauty salons0.17030.00450.00100.0134
Table 6. LTCR comparison in the studied public environments.
Public PlacesBenzeneTolueneEthylbenzeneXylenes
Hospitals4.36 × 10−4-3.65 × 10⁻⁵-
Elderly care centers4.00 × 10−4-1.56 × 10⁻⁵-
Health clubs7.69 × 10−5-1.26 × 10⁻⁵-
Restaurants1.23 × 10−4-8.90 × 10⁻⁶-
Waterpipe cafés5.43 × 10−5-8.01 × 10⁻⁶-
Coffee shops8.08 × 10−5-1.91 × 10⁻⁵-
Passenger terminals1.93 × 10−4-5.89 × 10⁻⁶-
Mosques6.03 × 10−5-5.75 × 10⁻⁶-
Movie theaters1.49 × 10−4-1.57 × 10⁻⁵-
Hotels9.89 × 10−5-1.70 × 10⁻⁵-
Healthcare service centers3.64 × 10−4-2.10 × 10⁻⁵-
Beauty salons1.49 × 10−4-9.65 × 10⁻⁶-
Disclaimer/Publisher’s Note: The statements, opinions and data contained in all publications are solely those of the individual author(s) and contributor(s) and not of MDPI and/or the editor(s). MDPI and/or the editor(s) disclaim responsibility for any injury to people or property resulting from any ideas, methods, instructions or products referred to in the content.

