Article

Patterns and Drivers of Change in the Normalized Difference Vegetation Index in Nunavik (Québec, Canada) over the Period 1984–2020

1
Département de Biologie, Université Laval, Québec, QC G1V 0A6, Canada
2
Centre for Northern Studies (CEN), Québec, QC G1V 0A6, Canada
3
Département de Géographie, Université Laval, Québec, QC G1V 0A6, Canada
4
Centre for Forest Research (CFR), Québec, QC G1V 0A6, Canada
*
Author to whom correspondence should be addressed.
Atmosphere 2023, 14(7), 1115; https://doi.org/10.3390/atmos14071115
Submission received: 15 June 2023 / Accepted: 30 June 2023 / Published: 5 July 2023
(This article belongs to the Special Issue Vegetation and Climate Relationships (2nd Edition))

Abstract

:
Altered temperature and precipitation regimes associated with climate change generally result in improved conditions for plant growth. For Arctic and sub-Arctic ecosystems, this new climatic context promotes an increase in primary productivity, a phenomenon often referred to as “greening”. Although this phenomenon has been widely documented at the circumpolar scale, little information is available at the scale of plant communities, the basic unit of the Arctic and sub-Arctic landscape mosaic. The objectives of this study were (1) to quantify the variation of NDVI within the different plant communities of Nunavik (Québec, QC, Canada) in order to identify which ones contributed the most to the greening and (2) to identify the climatic and biophysical drivers of the greening. To do so, we used Landsat imagery to produce a time series of summer NDVI for the period 1984 to 2020. A fine-resolution map of Northern Québec vegetation was then overlaid on the time series of NDVI imagery and on maps of surficial deposits, topography, and gridded climate data to obtain information at the plant community level. We found that greening was more important in shrub-dominated communities, particularly near the tree line. Summer temperature, fall and winter precipitation, and surficial deposits were identified as drivers of greening. Through utilizing detailed vegetation maps to accurately quantify changes in Nunavik’s plant communities, this study provides valuable insights into the dynamics of the region’s ecosystem under rapid climate change.

1. Introduction

In recent decades, surface air temperatures in Arctic and sub-Arctic regions have been warming almost three times faster than the global average of 0.12 °C per decade [1,2]. This differential warming rate, known as Arctic amplification, is caused by physical mechanisms that include local feedback such as lower albedo (due to sea-ice decline and permafrost degradation, among others) but also by changes in poleward energy transfer [3,4]. This rapid warming has led to the greening of high-latitude ecosystems, a phenomenon that can be defined as a multi-decadal increase in primary productivity often inferred from remote sensing vegetation indices [5]. However, despite the overall predominance of greening in the circumpolar region of the northern hemisphere, some areas have experienced the opposite trend, i.e., a decrease in primary productivity or “browning”, in response to large-scale natural disturbances such as fires or insect outbreaks [6]. Moreover, in recent years, boreal forests have faced increasing challenges, including drought conditions that have led to elevated levels of mortality among trees. While the specific impact of drought in Nunavik, Canada, requires further investigation, it is worth noting that several recent articles have highlighted the growing influence of drought on forest ecosystems. This suggests that drought-induced mortality could be a contributing factor to the observed decrease in primary productivity or browning in some areas [7].
The increase in primary productivity observed in high-latitude regions is a direct response to the beneficial impacts of climate change on plant communities exposed to harsh climatic conditions during the growing season. In these environments, primary productivity is mainly limited by cold temperatures [8], which hinders photosynthesis, plant phenological development [9], and pedogenesis processes [10]. The warmer temperatures experienced in recent decades have improved growth conditions for plants through extending the growing season by up to 14 days per decade [11,12], through increasing soil microbial activity and nutrient availability [13], and through altering soil hydrology in many regions [14].
This new climatic context has led to substantial changes in the composition and structure of plant communities [15]. Among the changes that occurred over the last decades, an increase in deciduous shrub cover, often referred to as “shrubification”, has been reported as the most frequent response of Arctic and sub-Arctic terrestrial ecosystems to climate change. Shrubification has been observed across the northern circumpolar region, be it in North America [16], northern Europe [17], or Russia [18]. In fact, most Arctic greening has been associated with the expansion of shrub species [19,20] through a positive impact of warmer temperatures on their growth, seed production, and recruitment. In turn, the expansion of the vertical and horizontal structure of the shrubs creates multiple feedbacks to the climate system through changes in terrestrial albedo and through biogeochemical cycles [3]. Shrub species’ response somewhat contrasts with the much more variable responses of tree species found near the treeline. In fact, a review of treeline dynamics under climate change revealed that ca. half of the treeline has not yet responded to warming [21], which could translate to a lower contribution of sub-Arctic forested ecosystems to the greening trend than shrub-dominated communities.
The greening of high-latitude ecosystems is commonly studied through satellite imagery analysis. One widely used index for quantifying greening is the Normalized Difference Vegetation Index (NDVI). This vegetation index, which measures the abundance of healthy vegetation, has been used and validated in different biomes across the globe [22]. In shrub-dominated landscapes such as the shrub tundra, NDVI is highly correlated with shrub cover, leaf area, and biomass [23]. In addition to its applications in high-latitude regions, NDVI analysis can be extended to ecosystems worldwide, including forests, grasslands, wetlands, and coastal areas, which are also experiencing the impacts of climate change. For instance, researchers have utilized NDVI to assess the effects of climate and land use changes on vegetation dynamics in various environments, such as a semi-arid region of China [24]. Analyzing NDVI patterns at the plant community level in different ecosystems provides valuable insights into the specific vegetation responses and adaptations occurring due to climate change. Despite the extensive use of NDVI to study changes in primary productivity at broad spatial scales [25,26], there has been a relatively limited focus on the plant community level. This gap in research stems from challenges such as the limited availability of detailed vegetation maps. However, addressing these limitations is crucial for obtaining a more comprehensive understanding of how different ecosystems respond to global change. Through conducting studies at higher resolutions that account for the plant community level, we can bridge this research gap. Such investigations would enhance our knowledge of vegetation responses and adaptations specific to climate change in diverse environments.
The overall aim of this study is to quantify trends in the primary productivity of plant communities in Nunavik (sub-Arctic Québec, Canada) over the last few decades through combining an annual collection of 30 m resolution Landsat satellite imagery into a high-resolution vegetation map of northern Québec [27]. First, we aim to characterize the pattern of NDVI increase to identify vegetation zones and plant communities that contribute the most to the greening observed in Nunavik over that period. We hypothesize that shrub communities located near the treeline contribute the most to the greening observed in Nunavik via a greater increase in their productivity over the last few decades. Our second objective is to identify the climatic, biotic, and edaphic drivers of the greening, as well as their relative contributions. We hypothesize that summer temperature and plant community types will be the most important drivers of the greening of Arctic and sub-Arctic ecosystems in Nunavik, since not all plant communities can benefit from climate change. Our study will therefore provide a detailed analysis of greening at the plant community level that will allow for a better understanding of the consequences of climate change in high-latitude ecosystems.

2. Materials and Methods
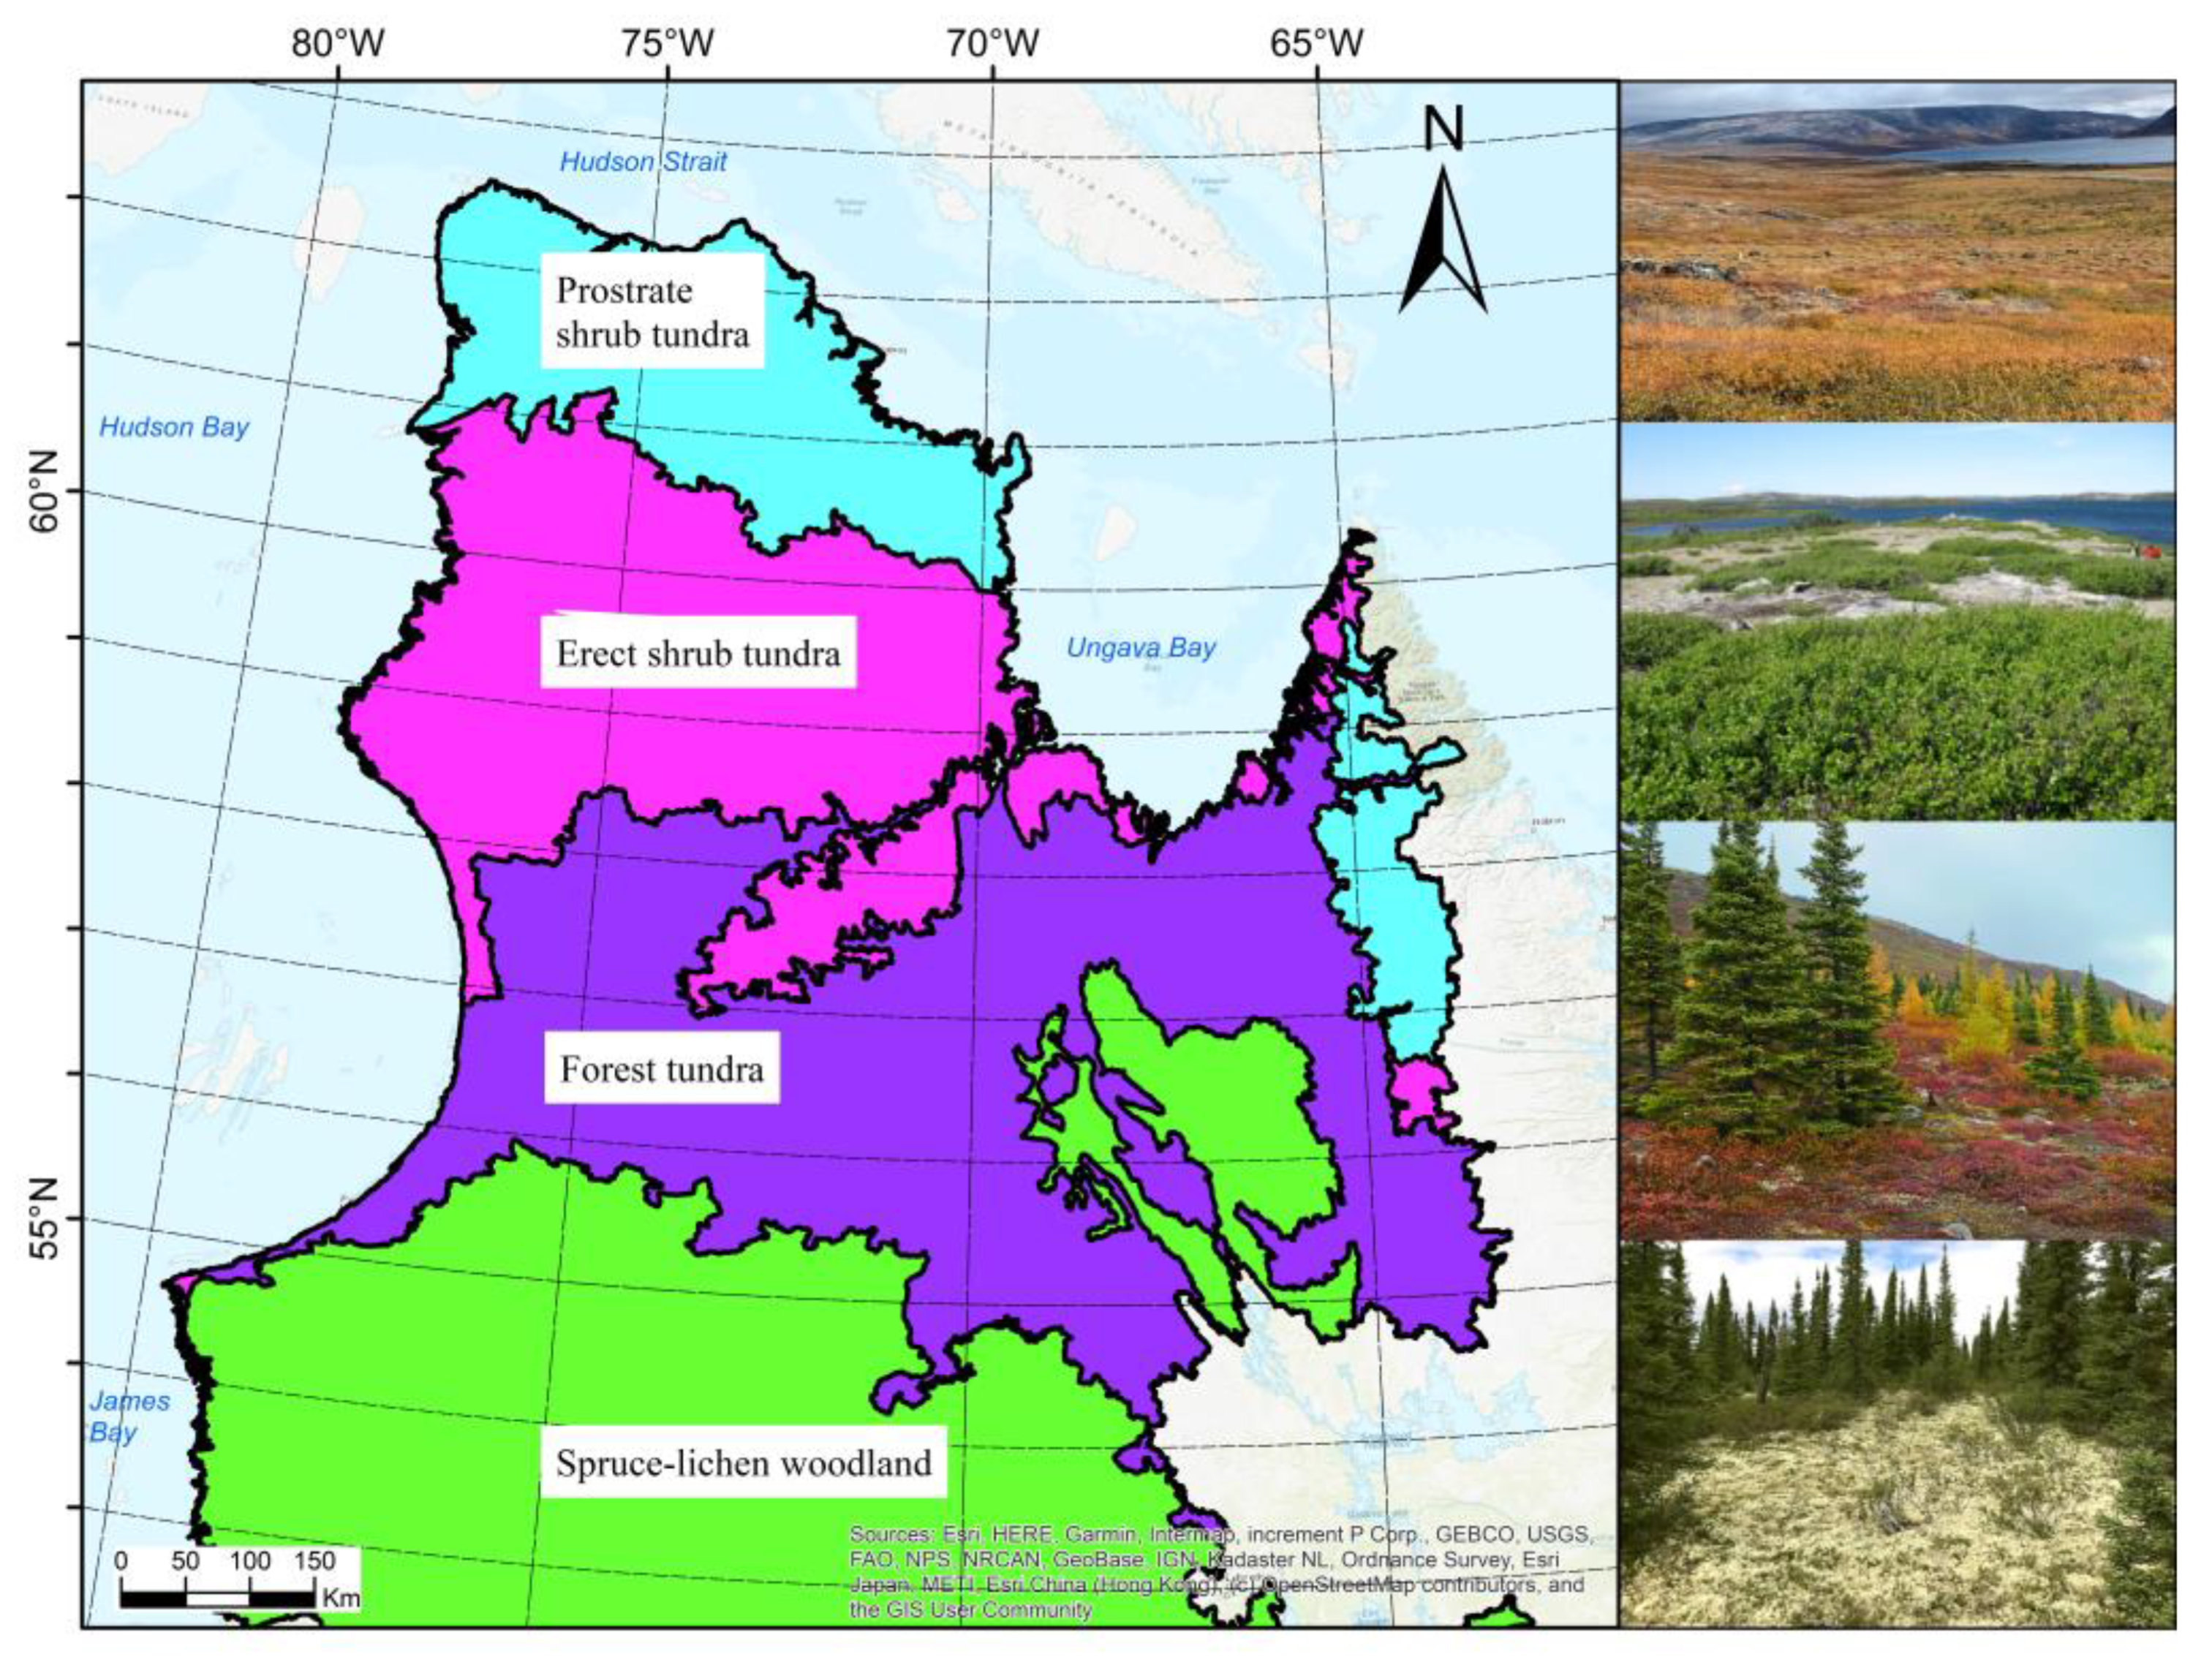
2.1. Study Area

Our study area includes all of Nunavik, a territory of 507,000 km2 located north of the 55th parallel in the province of Québec (Canada) and characterized by a strong climatic latitudinal gradient.
In its southern portion (53° N), Nunavik experiences a cold subpolar climate, with mean annual temperatures ranging from −0.5 to −4.6 °C and moderate precipitation (total annual precipitation of 860 to 1000 mm) for the period 1991 to 2020 [28]. January temperatures in the southern portion range from −22.7 to −16.3 °C, while July temperatures range from 11.9 to 18.3 °C. On the other hand, the northern portion of Nunavik (62° N) is characterized by a polar climate, with mean annual temperatures ranging from −10.7 to −5.6 °C and a semi-arid precipitation regime (480 to 700 mm) for the same period. January temperatures in the northern portion range from −29.1 to −22.7 °C, while the July temperatures range from 8.0 to 14.4 °C. According to Ju and Masek [16], Nunavik is the Canadian region where satellite-observed greening has been the most extensive between 1984 and 2012.
These strong temperature and precipitation gradients generate four different vegetation zones along the latitudinal gradient: the spruce–lichen woodland, the forest tundra, the erect shrub tundra, and the prostrate shrub tundra (Figure 1). The spruce–lichen woodland zone stretches from the 52nd to the 55th parallel and is characterized by forest stands with low-density tree cover and extensive lichen cover on the ground. The forest tundra zone extends from the 55th to the 58th parallel and represents the transitional zone between boreal and tundra biomes [29]. The landscape in this zone is a mosaic of shrubby heathlands covering 70% of the landscape, with isolated tree stands found in the less exposed sites [30]. North of the treeline, the erect shrub tundra zone extends approximately up to the 61st parallel and was characterized by continuous permafrost until the 2000s. However, the substantial warming experienced over recent decades has triggered significant permafrost degradation in the southern portion of the erect shrub tundra [31]. Erect shrub (generally >25 cm) dominates the landscape, although the height and horizontal cover of the shrub decrease from south to north. The dominant species in this zone is Betula glandulosa Michx., which has been identified as the main contributor to the shrub expansion in Nunavik [32]. The prostrate shrub tundra is Nunavik’s northernmost vegetation zone. Its landscape, characterized by lower vegetation in response to the harsh climate, is dominated by graminoid plant communities (sedges and grasses) with some mosses, lichens, and prostrate shrubs (generally <25 cm).

2.2. Data Collection and Trend Detection

To evaluate primary productivity across Nunavik during the 1984–2020 period, we produced a time series of summer NDVI from Landsat imagery (Landsat 8 OLI, Landsat 7 ETM+ and Landsat 4–5 TM sensors; 30 m resolution) using the Google Earth Engine platform [33]. To maximize the use of all available imagery, we used a per-pixel temporal compositing approach [34], whereby instead of mosaicking single-date cloud-free scenes, a composite image is created through combining a time series of spatially overlapping scenes using an aggregate function (median, average, maximum, best available pixel, etc.) on pixels meeting certain criteria (for example, cloud-free). From the Landsat Collection 2 Surface Reflectance Tier 1 dataset [35], we selected all scenes showing <80% cloud cover that were acquired between 1 July and 31 August of each year, as this period corresponds to the greenness peak across the latitudinal gradient. We masked clouds, cloud shadows, water, and snow/ice using the quality assessment band. Because masked images still showed clouds, we also removed pixels showing albedo values > 0.17 [36]. This conservative approach removed thinner clouds and ensured that only high-quality pixels were retained. NDVI was then computed on all masked images [33]. To obtain yearly NDVI mosaics for the entire Nunavik region, we extracted, on a per-pixel basis, the Best Available Pixel (BAP; [34]) or the median NDVI value from all available summertime images for each year. We used the median value instead of the average or the maximum value to limit the bias associated with phenological differences (Figure 2).
To assess the NDVI trends between 1984 and 2020 in the different plant community types, we used a fine-scale (minimum mapping area of 16 ha) vegetation map of northern Québec produced by the Ministère des Forêts, de la Faune et des Parcs du Québec (MFFP, [27]). This map provides a detailed classification of Nunavik plant communities and includes sixty-four vegetation classes and eight vegetation-free classes (<20% vegetation cover). To simplify subsequent analyses and the interpretation of results, we combined these classes to obtain eleven (11) broader classes: deciduous forest, mixed forest, coniferous forest, lichen woodland, shrubland with >70% shrub cover, shrubland with 30 to 70% shrub cover, shrubland with <30% shrub cover, prostrate-shrub tundra, rock substrate-dominated vegetation (thereafter open areas), bedrock, and wetland (see supplementary materials; Table S1). This modified vegetation map composed of 1,834,692 polygons was intersected with each annual NDVI mosaic to calculate the median NDVI value per vegetation polygon per year using the ArcMap Zonal Statistics tool. Deciduous and mixed forest cover types were removed from subsequent analyses because their overall cover represented <0.05% of the whole study area. For similar reasons, we removed lichen woodland and coniferous forest polygons found in two vegetation zones (erect shrub tundra and prostrate shrub tundra vegetation zones) because their cover was <0.01%.
To evaluate the influence of edaphic conditions on NDVI trends, we used a surficial deposit map for northern Québec [37] to assign one of the following surficial deposit categories to each vegetation type polygon in Nunavik: glacial and glaciofluvial deposits, fluvial deposits, lacustrine deposits, marine deposits, slope and weathering deposits, coastal marine deposits, organic deposits, bedrock, and anthropogenic deposits.
We used an aspect map from Canadian Digital Elevation Model (CDEM) produced by the Government of Canada [38] to assign an average aspect value to each vegetation polygon of our data set using the ArcMap Zonal Statistics tool. Aspect values range between 0° and 360°, clockwise from the north. We used the Beers et al. [39] transformation to make aspect a continuous variable between 0.00 (south) and 2.00 (north).
Due to the limited availability of climate stations in Nunavik, with a biased distribution mainly along the coastline (one station per Inuit community), we relied on Global Climate Models (GCMs) from ClimateData.ca. These GCMs provided data at a 10 km grid resolution from the CMIP6 (CanDCS-U6) climate model datasets. To ensure accurate representation of local climate conditions, the GCM data were downscaled and bias-adjusted using the BCCAQv2 method [40], as described by McKenney et al. [41] and the documentation provided by Climate Data Canada [42]. Previous studies have identified a positive relationship between vegetation change and temperature [15] and, to a lesser extent, with winter and summer precipitation at high latitudes [17,43]. Therefore, we included four temperature and precipitation variables in our subsequent analysis: mean annual temperature, mean summer temperature (June to August), mean fall temperature (September to November), mean winter temperature (December to February), total annual precipitation, total summer precipitation (June to August), total fall precipitation (September to November), and total winter precipitation (December to February). Through incorporating these temperature and precipitation variables into our analysis, we evaluated their impact on NDVI trends. The downscaled and bias-adjusted GCM data from Climate Data Canada provided broad coverage and a comprehensive representation of the climatic conditions in Nunavik. This allowed us to investigate the relationship between climate and NDVI changes on a larger scale, considering the unique characteristics of the region.

2.3. Statistical Analyses

A preliminary analysis of the NDVI trends revealed that the NDVI increase started in the 1990s. To select the most appropriate time frame to identify the climatic drivers of NDVI, we performed segmented linear regressions on NDVI time series for each of the cover types in each of the four vegetation zones. We used the Bayesian Information Criterion (BIC) to assess the number of breakpoints in the NDVI time series through applying the R package segmented [44]. BIC is based on the likelihood function, and models with lower BIC are generally preferred. Based on the results of the analysis, 67% of the NDVI time series had at least one breakpoint in 1992 (Figure 3). Segmented regressions showed that two-thirds of the times series (20/30) were best modeled with two linear segments over the 1984–2020 period, i.e., a somewhat stable or slightly negative trend from 1984 to 1992 followed by a sharply increasing trend afterwards. Six time series were best modeled with three linear segments over the 37-year period, with lower greening trends in the 1980s and in the 2010s. Four time series were best modeled with a single linear segment, with a positive trend from 1984 to 2020. Therefore, we decided to use the slope of the linear regression performed on the NDVI time series for the period 1992–2020 for each vegetation polygon as our indicator of greening intensity. Because a few polygons displayed extremely high or low greening rates, we used a percentile-based approach to detect and remove outliers from the annual rates of change in NDVI. Therefore, all observations lying outside the interval formed by the 0.5 and 99.5 percentiles were considered as outliers and were removed from subsequent analyses. An annual map of the greening rate was created at a spatial resolution of 3 km/pixel using the R package raster.
To determine the relative contribution of each of the four vegetation zones to the overall increase in NDVI at the Nunavik scale, we multiplied the annual rate of change in NDVI of each vegetation polygon by its respective area. We then summed these products for all the polygons belonging to a given vegetation zone and calculated the relative contribution of each zone through dividing the sum obtained for a particular zone by the sum of all the zones. Subsequently, we were able to determine whether the respective contribution of each vegetation zone was greater than their relative area. Similar analyses were conducted to determine the relative contribution of vegetation cover type to NDVI increase at both the Nunavik and vegetation zone scales.

2.4. Drivers of NDVI Trends

Drivers of greening rate at either the Nunavik or the vegetation zone scale were identified using linear regression and the package stats in R. Two different series of models were run. The first series of models were built using climatic variables only, hereafter referred to climatic models. For these models, we used the linear rate of change of the previously identified 10 climatic variables over the period 1992–2020 (Figures S1–S8). The second series of models, the ecological models, included 10 climatic variables as well as 10 categories of surficial deposits, 9 vegetation cover types, and the aspect for each vegetation polygon.
To assess and mitigate the potential issue of multicollinearity among climate variables, the Variance Inflation Factor (VIF) was used. Climate variables that exhibited VIF values below 2.5 were considered to have acceptable levels of multicollinearity and were consequently included in the same models [45]. Through excluding highly correlated variables, we ensured the independence and reliability of the climate variables included in the models.
The best explanatory models were identified using the Akaike Information Criterion (AIC). Pearson correlations were calculated between the rates of change in NDVI and climate variables and aspect using the rcorr function in the Hmisc package and were visualized using the corrplot R package [46,47]. All assumptions of normality and homogeneity of variances were verified and met.

3. Results

3.1. Spatial Patterns of NDVI

NDVI trends from 1992 to 2020 displayed high variability across Nunavik (Figure 4). Overall, NDVI time series regressions conducted on vegetation polygons over the 1992–2020 period showed that 98.71% of the polygons experienced a significant increase in NDVI (greening), while significant (p < 0.01) browning was observed for only 0.16% of the polygons (Figure 5 and Figures S9–S11). The highest greening rates were observed in the forest tundra (0.0062 NDVI units y−1) and in the erect shrub tundra (0.0061 NDVI units y−1) vegetation zones, south and north of the sub-Arctic treeline, respectively (Figure 5, Table 1). Lower greening rates were mainly observed in the prostrate shrub tundra (0.0038 NDVI units y−1) but also in the south-western portion of the lichen woodland zone near James Bay, although the spruce–lichen woodland zone displayed a higher overall greening rate than the prostrate shrub tundra (0.0053 NDVI units y−1; Figure 5). Browning was observed at both ends of the latitudinal gradient.

3.2. Contribution of Vegetation Zones and Cover Types to NDVI Increase

Prostrate shrub tundra areas on bedrock and open areas showed relatively lower greening rates compared to other cover types, with NDVI rate of increase values around 0.0029 and 0.0036 NDVI units per year, respectively (Table 1 and Table S2). Despite their lower greening rates, these cover types still made notable contributions to the overall greening of the prostrate shrub tundra vegetation zone. Erect shrub tundra areas exhibited remarkable greening rates, especially for stands with <30% cover and 30–70% cover (Table 1 and Table S2). The mean NDVI rate of increase for these cover types exceeded 0.006 NDVI units per year. These erect shrub cover types made substantial contributions to the greening of the erect shrub tundra vegetation zone, surpassing the expected contribution based on their relative area. Stands with < 30% cover contributed 12.64%, while stands with 30–70% cover contributed 5.58% to the NDVI increase. Similar to the erect shrub tundra, the forest tundra vegetation zone also experienced high greening rates for erect shrub cover types. Those with <30% cover and 30–70% cover displayed identical NDVI rate of increase values of 0.0066 NDVI units per year. The contribution of these erect shrub cover types to the greening of the forest tundra zone exceeded expectations based on their relative area. Stands with <30% cover contributed 10.65%, while stands with 30–70% cover contributed 7.07% to the NDVI increase. Within the spruce–lichen woodland vegetation zone, the greening rates for erect shrub cover types varied. Stands with <30% cover and 30–70% cover exhibited NDVI rate of increase values of 0.0050 and 0.0057 NDVI units per year, respectively. The contribution of erect shrub cover types to the greening of the spruce–lichen woodland zone aligned with their expected relative area. Overall, the results indicate that low- and moderate-density stands of erect shrubs consistently demonstrated high greening rates and contributed significantly to the greening process in various vegetation zones.

3.3. Drivers of NDVI Trends

No significant correlations were observed between the climate variables and the annual rate of change in NDVI (Figure S12). Using VIF analysis, it was determined that summer temperatures (Tjja), fall precipitation (Pfall), and winter precipitation (Pwin) were the only climate variables that could be simultaneously integrated into the models.
At the Nunavik scale, overall NDVI trends were best explained using models that included ecological variables (subset of ecological models). The most parsimonious model consisted of the rates of change in summer temperature, fall precipitation, winter precipitation, and the interaction between surficial deposits and cover types (R2 = 0.152; Table 2). The most frequent climate variables in the best models were fall precipitation followed by summer temperatures and then winter precipitation. In these models, the rate of change in summer temperature was negatively associated with the annual rate of change in NDVI, while the rate of change in fall and winter precipitation was positively associated with the annual rate of change in NDVI. The significant interaction between surficial deposits and cover types revealed that for a given cover type, the greening rate can vary depending on the surficial deposits. Overall, NDVI rates of increase were higher on glacial and glaciofluvial, fluvial, and lacustrine deposits but lower on organic deposits and rocky substrates (Table S3). The best climatic model included the rates of change in summer temperature, fall precipitation, and winter precipitation, which were the same variables as those observed in the most plausible model, but it had less predictive power (R2 = 0.055).
At the vegetation zone scale, ecological models outperformed climatic models in explaining NDVI trends, although their overall predictive power was lower than that at the Nunavik scale (Table S3). The most plausible climatic models that explained NDVI trends at both ends of the gradient indicated that the rate of change in summer temperature, fall precipitation, and winter precipitation can significantly influence NDVI trends. In these models, the relationship between winter precipitation and NDVI differed between the southern end (lichen woodland zone) and the northern end of the gradient. For the forest tundra and erect shrub tundra zones, the most parsimonious models included only the interaction between surficial deposits and cover types. Subsequent models included either the rate of change in summer temperature, winter precipitation, or fall precipitation as climate variables.

4. Discussion

4.1. Spatial Trends

Our results demonstrate that greening was the dominant trend in Nunavik from 1992 to 2020, as all cover types displayed NDVI increases during that time frame. Such a greening trend coincides with the onset of a strong warming trend in Nunavik during the 1990s, a climatic context that contrasts with the northwestern region of North America, which experienced warming from at least the mid-1970s [48]. As a result, it is likely that the response of plant communities to increased temperatures is asynchronous between these regions [49]. For example, central Alaska and parts of the Canadian Arctic Archipelago showed a decline in NDVI over the 1984–2012 period [50]. Recently, greening has slowed down in Nunavik; a comparable trend was also observed, at least temporarily, in the Arctic tundra of North America and Eurasia from 2011 to 2014 [48,50,51].
Our results show that NDVI trends vary spatially and temporally across our latitudinal gradient and between different plant communities, suggesting that while greening is observed throughout Nunavik, it is highly heterogeneous at the landscape level. As we hypothesized, the largest positive NDVI trends were observed on either side of the treeline, i.e., in the northern portion of the forest tundra and in the southern portion of the erect shrub tundra zones. These trends are also in general agreement with Bonney et al. [52], who showed that the transition zones between forest and tundra found along a latitudinal gradient in central Canada displayed the highest greening trends. Our results support the hypothesis of a substantial shift in plant communities at the landscape level in response to recent climate warming. While shrub and forest stands are becoming denser, open tundra ecosystems are being colonized by erect shrub species. This finding corroborates other studies linking high greening rates to the rapid expansion of erect shrub species in Nunavik [20,53]. The abundance of shrub-dominated ecosystems in the forest tundra and erect shrub tundra explains the higher greening rates observed in these vegetation zones. According to Riedel et al. [54] and Blok et al. [43], even small changes in shrub cover can trigger major changes in NDVI values. Plant communities with greater deciduous shrub cover thus tend to have higher greening rates [23,55].
At the cover type scale, we found that all cover types displayed a significant greening trend, a somewhat unexpected result. However, only shrub-dominated ecosystems contributed more to the NDVI increase than what we would expect from the relative areas they occupied, supporting the hypothesis that shrub species are able to respond more rapidly to warmer temperatures than other plant functional groups. This increased productivity of erect shrub species results from an increase in clonal growth and/or seedling recruitment leading to the infilling of pre-existing shrub patches [56]. This phenomenon may elucidate why shrub stands with less than 30% shrub cover (and to a lesser extent, those with 30 to 70% shrub cover) have the greatest impact on NDVI increases. As the shrub cover in these stands is not yet saturated, infilling can progress rapidly. In contrast, the NDVI profile in denser shrub stands (>70% cover) in the forest tundra zone stabilized in the early 2010s, presumably because they became saturated (Figure 3). Although one might argue that greening in Nunavik will eventually slow down due to saturation of shrub cover in plant communities, low-density shrub stands still occupy large areas, suggesting that shrub expansion will continue in Nunavik. In the Umiujaq region along the Hudson Bay coast in Nunavik, a modeling exercise conducted at the landscape level showed that shrub expansion should continue, although at a lesser rate, for a few more decades [37].
Coniferous forest and lichen woodland cover types found in the spruce–lichen woodland and forest tundra vegetation zones also contributed significantly to the overall greening trend observed in Nunavik. However, their contribution was lower than what was expected from their relative area. Increased productivity in forest cover types may be due in part to the understory shrub, but our data do not allow us to verify this hypothesis at the Nunavik scale. Field and satellite observations have shown increases in vegetation productivity and tree recruitment along the northern margin of the boreal forest, leading to forest expansion into the forest tundra zone [8,57]. In fact, forested ecosystems become greener when located near their range margins [52]. However, advancing treeline is a heterogeneous phenomenon, as some studies have found that only half of treeline sites are currently advancing [21,58].

4.2. Climate and Topography as Drivers of NDVI

Previous studies identified several drivers of NDVI trends: temperature, precipitation, soil moisture, snow cover duration, growing season length, extreme weather events, and large disturbances (i.e., fires and insect outbreaks; [59]). As the primary productivity of high latitude regions is known to be mainly limited by cold temperatures, it is not surprising that many studies have identified a positive relationships between maximum NDVI and summer temperature across the circumpolar Arctic [60,61], North America [51], or Arctic Alaska [62,63]. Such results somewhat contrast with our study, which highlights the negative relationship between NDVI and the rate of change in summer temperature in Nunavik. However, when looking at Figure S2, one can see heterogeneity in the rate of change in temperature over the period of 1992–2020 in Nunavik. Interestingly, the fast-warming regions are mainly located in the southern half of the gradient in the spruce–lichen woodland zone, in the eastern portion of the forest tundra zone, and in the erect-shrub tundra on the slope of the Torngat Mountains near Labrador. Most of these regions are characterized by lower greening rates than those observed on each side of the sub-Arctic treeline. It is possible that in such fast-warming regions, precipitation became limiting as it is likely that warmer temperatures triggered an increase in evapotranspiration. On the other hand, the region on either side of the sub-Arctic treeline in western Nunavik displayed a greater rate of NDVI increase but only a moderate warming rate during that period. These results suggest that warming rate is not directly related to NDVI increase as higher temperatures can somewhat have negative impacts on plant productivity through different mechanisms (drought stress, pathogen development, etc.).
Our study illustrates the importance of snow cover on plant productivity, although these impacts appear to be more important in the northern portion of the gradient [64]. In the prostrate shrub and erect shrub tundra zones, greater winter precipitation often results in a thicker and more persistent snowpack that can last longer. The snow cover provides insulation and protection for the vegetation, reducing frost and abrasion damage and increasing the overall survival of the plants [65]. Moreover, a deeper snowpack may also provide greater water availability at the onset of the short growing season, possibly leading to greater NDVI increases. Greater winter precipitation can also contribute to the degradation of permafrost as greater snow cover provides better soil insulation in winter. Permafrost degradation can lead to increased soil respiration that translates into greater nutrient availability, creating favorable conditions for plant growth [66], which will generate higher NDVI values. In contrast, winter precipitation does not appear to have a significant impact on vegetation growth in the spruce–lichen woodland and forest tundra zones, as the correlation between NDVI and winter precipitation is weaker or even negative. In fact, greater winter precipitation can delay the onset of the growing season. Such a hypothesis was supported by Crichton et al. [66], who found that late snowmelt significantly limits potential plant productivity (NDVI) through a shorter growing season. Indeed, late snowmelt prevents solar radiation from reaching and heating the ground surface, which leads to colder soils during the early growing season, delaying plant phenology and soil biogeochemical cycling.
Our study also reveals the importance of topography and surficial deposits as important drivers of NDVI. Topography influences NDVI patterns through influencing snow accumulation, snow cover persistence, nutrient availability, soil moisture, and soil temperature [25,37]. Our results also showed that NDVI rates of change were higher on lacustrine, fluvial, glacial, and glaciofluvial surficial deposits than other surficial deposits. These deposits likely possess physicochemical properties that promote plant growth, such as being well sorted, devoid of coarse particles, and having a greater water field capacity due to higher organic matter content. Such properties reduce water stress during droughts and provide greater volume for root development. Additionally, glacial soils, characterized by higher amounts of fine particles and inorganic nutrient concentrations, enhance aggregation and nutrient retention [67,68,69].

5. Conclusions

Our study allowed us to quantify greening in Nunavik at different spatial scales between 1992 and 2020. At the Nunavik scale, 98.71% of vegetation polygons experienced a significant increase in NDVI (greening) during this period, with the regions on either side of the treeline displaying the highest greening rates. At the plant community scale, our study reveals that low- (<30% cover) to moderate-density (30–70% cover) shrub ecosystems and forested ecosystems (lichen woodlands and closed coniferous forests) are the main contributors to the greening trend observed in Nunavik. However, only shrub-dominated cover types show a greater contribution to greening than what would be expected from their relative area. As such, our study is one of the few to provide detailed information at the plant community level over such a large territory.
The coarser resolution of the climatic data used in this study may somewhat limit our capacity to explain NDVI trends at such a detailed scale. Indeed, the resolution of climate models may not capture the fine-scale variability and localized effects that can impact NDVI trends. Climate models typically operate at broader spatial scales, which may not fully capture the nuances of vegetation dynamics at smaller scales. Additionally, the temporal resolution may not align perfectly with the timescales of vegetation responses, potentially leading to discrepancies between modelized climate variables and NDVI trends. The relationship between climate variables and NDVI trends is influenced by complex interactions and feedback mechanisms within the ecosystem. Vegetation dynamics are affected by multiple factors beyond just climate variables, including soil characteristics, biotic interactions, and disturbances. Neglecting these interactions in the modelized approach may oversimplify the complexity of the system and limit the ability to fully explain NDVI trends.
Despite these limitations, NDVI trends combined with modelized climate variables provide important information for developing adaptation strategies. Understanding how vegetation responds to specific climate drivers allows managers to design and implement measures to enhance the resilience of ecosystems and species to climate change. This can include actions such as habitat restoration, assisted migration, or the establishment of climate corridors. Overall, integrating NDVI trends with modelized climate variables provides valuable insights and tools for the adaptative management and monitoring of ecosystem health in the face of rapid climate change. These approaches contribute to the development of effective strategies for biodiversity and the sustainable management of natural resources.

Supplementary Materials

The following supporting information can be downloaded at: https://www.mdpi.com/article/10.3390/atmos14071115/s1, Table S1: Cover types used from the ecological mapping of the vegetation of northern Québec, Figure S1: Annual temperature trends for the 1992–2020 period in Nunavik, Figure S2: Summer temperature trends for the 1992–2020 period in Nunavik, Figure S3: Fall temperature trends for the 1992–2020 period in Nunavik, Figure S4: Winter temperature trends for the 1992–2020 period in Nunavik, Figure S5: Annual precipitation trends for the 1992–2020 period in Nunavik, Figure S6: Summer precipitation trends for the 1992–2020 period in Nunavik, Figure S7: Fall precipitation trends for the 1992–2020 period in Nunavik, Figure S8: Winter precipitation trends for the 1992–2020 period in Nunavik, Figure S9: Histograms showing the frequency of the adjusted R2 values for the NDVI time series regressions conducted on vegetation polygons over the 1992–2020 period, Figure S10: Histograms showing the frequency of the p-values for the NDVI time series regressions conducted on vegetation polygons over the 1992–2020 period,, Figure S11: Histograms showing the frequency of the standard error of regression for the NDVI time series regressions conducted on vegetation polygons over the 1992–2020 period, Figure S12: Correlation matrix between annual rate of change of climate variables and annual rate of change in NDVI for the period 1992–2020, Table S2: Mean NDVI rate of increase and relative contribution to NDVI increase of cover types by vegetation zone, Table S3: Interaction between surficial deposits and cover types, Table S4: Most plausible models to explain the annual rate of change in NDVI in each of the vegetation zones in Nunavik.

Author Contributions

Conceptualization, A.G., M.S. and S.B.; methodology, A.G., M.S. and S.B.; validation, M.S. and S.B.; formal analysis, A.G.; investigation, A.G., M.S. and S.B.; resources, M.S. and S.B.; data curation, A.G.; writing—original draft preparation, A.G.; writing—review and editing, M.S. and S.B.; visualization, A.G., M.S. and S.B.; supervision, M.S. and S.B.; project administration, S.B.; funding acquisition, S.B. All authors have read and agreed to the published version of the manuscript.

Funding

This research was funded by the Ministère des Forêts, de la Faune et des Parcs (MFFP) of the government of Québec: Fondsvert-DPC-20171003.

Institutional Review Board Statement

Not applicable.

Informed Consent Statement

Not applicable.

Data Availability Statement

Data are available upon request to the authors.

Acknowledgments

The authors are thankful to Hugues Dorion for analysis of satellite imagery, and to Émilie Saulnier-Talbot for linguistic revision. The authors would also like to thank the Centre for Northern Studies (CEN) for providing logistic support. We wish to thank ClimateData.ca for providing the climate information used in this paper. ClimateData.ca was created through a collaboration between the Pacific Climate Impacts Consortium (PCIC), Ouranos Inc. (Montréal), the Prairie Climate Centre (PCC), Environment and Climate Change Canada (ECCC) Centre de Recherche Informatique de Montréal (CRIM), and Habitat7.

Conflicts of Interest

The authors declare no conflict of interest.

References

  1. IPCC. Climate Change 2014: Synthesis Report; Pachauri, R.K., Mayer, L., Eds.; Intergovernmental Panel on Climate Change: Geneva, Switzerland, 2015; ISBN 978-92-9169-143-2. [Google Scholar]
  2. Bush, E.; Lemmen, D.S. Canada’s Climate Change Report; Government of Canada: Ottawa, ON, Canada, 2019; ISBN 978-0-660-30222-5.
  3. Ravn, N.R.; Elberling, B.; Michelsen, A. Arctic Soil Carbon Turnover Controlled by Experimental Snow Addition, Summer Warming and Shrub Removal. Soil Biol. Biochem. 2020, 142, 107698. [Google Scholar] [CrossRef]
  4. Previdi, M.; Smith, K.L.; Polvani, L.M. Arctic Amplification of Climate Change: A Review of Underlying Mechanisms. Environ. Res. Lett. 2021, 16, 093003. [Google Scholar] [CrossRef]
  5. Myers-Smith, I.H.; Kerby, J.T.; Phoenix, G.K.; Bjerke, J.W.; Epstein, H.E.; Assmann, J.J.; John, C.; Andreu-Hayles, L.; Angers-Blondin, S.; Beck, P.S.A.; et al. Complexity Revealed in the Greening of the Arctic. Nat. Clim. Chang. 2020, 10, 106–117. [Google Scholar] [CrossRef] [Green Version]
  6. Wu, W.; Sun, X.; Epstein, H.; Xu, X.; Li, X. Spatial Heterogeneity of Climate Variation and Vegetation Response for Arctic and High-Elevation Regions from 2001–2018. Environ. Res. Commun. 2020, 2, 011007. [Google Scholar] [CrossRef]
  7. Liu, Q.; Peng, C.; Schneider, R.; Cyr, D.; McDowell, N.G.; Kneeshaw, D. Drought-induced Increase in Tree Mortality and Corresponding Decrease in the Carbon Sink Capacity of Canada’s Boreal Forests from 1970 to 2020. Glob. Chang. Biol. 2023, 29, 2274–2285. [Google Scholar] [CrossRef]
  8. Mamet, S.D.; Brown, C.D.; Trant, A.J.; Laroque, C.P. Shifting Global Larix Distributions: Northern Expansion and Southern Retraction as Species Respond to Changing Climate. J. Biogeogr. 2019, 46, 30–44. [Google Scholar] [CrossRef] [Green Version]
  9. Munier, A.; Hermanutz, L.; Jacobs, J.D.; Lewis, K. The Interacting Effects of Temperature, Ground Disturbance, and Herbivory on Seedling Establishment: Implications for Treeline Advance with Climate Warming. Plant Ecol. 2010, 210, 19–30. [Google Scholar] [CrossRef]
  10. Buchan, G.D. Temperature Effects in Soil. In Encyclopedia of Agrophysics; Gliński, J., Horabik, J., Lipiec, J., Eds.; Encyclopedia of Earth Sciences Series; Springer: Dordrecht, The Netherlands, 2011; pp. 891–895. ISBN 978-90-481-3584-4. [Google Scholar]
  11. Box, J.E.; Colgan, W.T.; Christensen, T.R.; Schmidt, N.M.; Lund, M.; Parmentier, F.-J.W.; Brown, R.; Bhatt, U.S.; Euskirchen, E.S.; Romanovsky, V.E.; et al. Key Indicators of Arctic Climate Change: 1971–2017. Environ. Res. Lett. 2019, 14, 045010. [Google Scholar] [CrossRef]
  12. Prevéy, J.S.; Rixen, C.; Rüger, N.; Høye, T.T.; Bjorkman, A.D.; Myers-Smith, I.H.; Elmendorf, S.C.; Ashton, I.W.; Cannone, N.; Chisholm, C.L.; et al. Warming Shortens Flowering Seasons of Tundra Plant Communities. Nat. Ecol. Evol. 2019, 3, 45–52. [Google Scholar] [CrossRef] [Green Version]
  13. Sarneel, J.M.; Sundqvist, M.K.; Molau, U.; Björkman, M.P.; Alatalo, J.M. Decomposition Rate and Stabilization across Six Tundra Vegetation Types Exposed to >20 Years of Warming. Sci. Total Environ. 2020, 724, 138304. [Google Scholar] [CrossRef]
  14. Teufel, B.; Sushama, L. Abrupt Changes across the Arctic Permafrost Region Endanger Northern Development. Nat. Clim. Chang. 2019, 9, 858–862. [Google Scholar] [CrossRef]
  15. Elmendorf, S.C.; Henry, G.H.R.; Hollister, R.D.; Björk, R.G.; Bjorkman, A.D.; Callaghan, T.V.; Collier, L.S.; Cooper, E.J.; Cornelissen, J.H.C.; Day, T.A.; et al. Global Assessment of Experimental Climate Warming on Tundra Vegetation: Heterogeneity over Space and Time: Warming Effects on Tundra Vegetation. Ecol. Lett. 2012, 15, 164–175. [Google Scholar] [CrossRef] [PubMed]
  16. Ju, J.; Masek, J.G. The Vegetation Greenness Trend in Canada and US Alaska from 1984–2012 Landsat Data. Remote Sens. Environ. 2016, 176, 1–16. [Google Scholar] [CrossRef]
  17. Hallinger, M.; Manthey, M.; Wilmking, M. Establishing a Missing Link: Warm Summers and Winter Snow Cover Promote Shrub Expansion into Alpine Tundra in Scandinavia. New Phytol. 2010, 186, 890–899. [Google Scholar] [CrossRef] [PubMed]
  18. Forbes, B.C.; Fauria, M.M.; Zetterberg, P. Russian Arctic Warming and ‘Greening’ Are Closely Tracked by Tundra Shrub Willows. Glob. Chang. Biol. 2010, 16, 1542–1554. [Google Scholar] [CrossRef]
  19. Elmendorf, S.C.; Henry, G.H.R.; Hollister, R.D.; Björk, R.G.; Boulanger-Lapointe, N.; Cooper, E.J.; Cornelissen, J.H.C.; Day, T.A.; Dorrepaal, E.; Elumeeva, T.G.; et al. Plot-Scale Evidence of Tundra Vegetation Change and Links to Recent Summer Warming. Nature Clim. Chang. 2012, 2, 453–457. [Google Scholar] [CrossRef]
  20. García Criado, M.; Myers-Smith, I.H.; Bjorkman, A.D.; Lehmann, C.E.R.; Stevens, N. Woody Plant Encroachment Intensifies under Climate Change across Tundra and Savanna Biomes. Global Ecol. Biogeogr. 2020, 29, 925–943. [Google Scholar] [CrossRef]
  21. Rees, W.G.; Hofgaard, A.; Boudreau, S.; Cairns, D.M.; Harper, K.; Mamet, S.; Mathisen, I.; Swirad, Z.; Tutubalina, O. Is Subarctic Forest Advance Able to Keep Pace with Climate Change? Glob Chang. Biol. 2020, 26, 3965–3977. [Google Scholar] [CrossRef] [Green Version]
  22. Huete, A.; Didan, K.; Miura, T.; Rodriguez, E.P.; Gao, X.; Ferreira, L.G. Overview of the Radiometric and Biophysical Performance of the MODIS Vegetation Indices. Remote Sens. Environ. 2002, 83, 195–213. [Google Scholar] [CrossRef]
  23. Berner, L.T.; Jantz, P.; Tape, K.D.; Goetz, S.J. Tundra Plant Above-Ground Biomass and Shrub Dominance Mapped across the North Slope of Alaska. Environ. Res. Lett. 2018, 13, 035002. [Google Scholar] [CrossRef] [Green Version]
  24. Luo, N.; Mao, D.; Wen, B.; Liu, X. Climate Change Affected Vegetation Dynamics in the Northern Xinjiang of China: Evaluation by SPEI and NDVI. Land 2020, 9, 90. [Google Scholar] [CrossRef] [Green Version]
  25. Berner, L.T.; Massey, R.; Jantz, P.; Forbes, B.C.; Macias-Fauria, M.; Myers-Smith, I.; Kumpula, T.; Gauthier, G.; Andreu-Hayles, L.; Gaglioti, B.V.; et al. Summer Warming Explains Widespread but Not Uniform Greening in the Arctic Tundra Biome. Nat. Commun 2020, 11, 4621. [Google Scholar] [CrossRef] [PubMed]
  26. Jenkins, L.K.; Barry, T.; Bosse, K.R.; Currie, W.S.; Christensen, T.; Longan, S.; Shuchman, R.A.; Tanzer, D.; Taylor, J.J. Satellite-Based Decadal Change Assessments of Pan-Arctic Environments. Ambio 2020, 49, 820–832. [Google Scholar] [CrossRef] [PubMed]
  27. Leboeuf, A.; Pomerleau, I.; Morissette, A.; Noreau, L. Cartographie Écologique de la Végétation du Nord Québécois: Norme de Cartographie; Ministère des forêts, de la Faune et des Parcs: Québec, QC, Canada, 2018; ISBN 978-2-550-81204-3.
  28. Paquin, D.; Mailhot, A.; Guay, C.; Malenfant, C.; Bresson, É.; Logan, T.; Smith, T.; Talbot, G. Portrait Climatique Régional en Climat de Référence et Futur en Soutien à L’analyse des Impacts et de L’adaptation aux Changements Climatiques sur le Territoire Eeyou Lstchee Baie-James, du Nord de l’Abitibi-Témiscamingue et du Nunavik; Ministère des Transports: Quebec, QC, Canada, 2022; p. 904.
  29. Payette, S. The Forest Tundra and Present Tree-Lines of the Northern Québec-Labrador Peninsula. Nordicana 1983, 27, 3–23. [Google Scholar]
  30. Payette, S.; Filion, L.; Delwaide, A. Spatially Explicit Fire-Climate History of the Boreal Forest-Tundra (Eastern Canada) over the Last 2000 Years. Phil. Trans. R. Soc. B 2008, 363, 2299–2314. [Google Scholar] [CrossRef] [Green Version]
  31. Allard, M.; Lemay, M.; Barrette, C.; L’Hérault, E.; Sarrazin, D. Chapter 6. Permafrost and Climate Change in Nunavik and Nunatsiavut: Importance for Municipal and Transportation Infrastructures. 2012, pp. 171–197. Available online: https://www.researchgate.net/profile/Mickael-Lemay-2/publication/264454915_Chapter_6_Permafrost_and_climate_change_in_Nunavik_and_Nunatsiavut_Importance_for_municipal_and_transportation_infrastructures/links/53dfc9ac0cf27a7b8306b877/Chapter-6-Permafrost-and-climate-change-in-Nunavik-and-Nunatsiavut-Importance-for-municipal-and-transportation-infrastructures.pdf (accessed on 9 June 2023).
  32. Ropars, P.; Lévesque, E.; Boudreau, S. Shrub Densification Heterogeneity in Subarctic Regions: The Relative Influence of Historical and Topographic Variables. Écoscience 2015, 22, 83–95. [Google Scholar] [CrossRef] [Green Version]
  33. Gorelick, N.; Hancher, M.; Dixon, M.; Ilyushchenko, S.; Thau, D.; Moore, R. Google Earth Engine: Planetary-Scale Geospatial Analysis for Everyone. Remote Sens. Environ. 2017, 202, 18–27. [Google Scholar] [CrossRef]
  34. White, J.C.; Wulder, M.A.; Hobart, G.W.; Luther, J.E.; Hermosilla, T.; Griffiths, P.; Coops, N.C.; Hall, R.J.; Hostert, P.; Dyk, A.; et al. Pixel-Based Image Compositing for Large-Area Dense Time Series Applications and Science. Can. J. Remote Sens. 2014, 40, 192–212. [Google Scholar] [CrossRef] [Green Version]
  35. Example of Landsat Collection 2 Surface Reflectance|U.S. Geological Survey. Available online: https://www.usgs.gov/media/images/example-landsat-collection-2-surface-reflectance-0 (accessed on 8 June 2023).
  36. Liang, S. Narrowband to Broadband Conversions of Land Surface Albedo I. Remote Sens. Environ. 2001, 76, 213–238. [Google Scholar] [CrossRef]
  37. Lemay, M.-A.; Provencher-Nolet, L.; Bernier, M.; Lévesque, E.; Boudreau, S. Spatially Explicit Modeling and Prediction of Shrub Cover Increase near Umiujaq, Nunavik. Ecol. Monogr. 2018, 88, 385–407. [Google Scholar] [CrossRef]
  38. Government of Canada. Canadian Digital Elevation Model, 1945-2011—Open Government Portal. Available online: https://open.canada.ca/data/en/dataset/7f245e4d-76c2-4caa-951a-45d1d2051333 (accessed on 9 June 2023).
  39. Beers, T.W.; Dress, P.E.; Wensel, L.C. Notes and Observations: Aspect Transformation in Site Productivity Research. J. For. 1966, 64, 691–692. [Google Scholar]
  40. Cannon, A.J.; Sobie, S.R.; Murdock, T.Q. Bias Correction of GCM Precipitation by Quantile Mapping: How Well Do Methods Preserve Changes in Quantiles and Extremes? J. Clim. 2015, 28, 6938–6959. [Google Scholar] [CrossRef]
  41. McKenney, D.W.; Hutchinson, M.F.; Papadopol, P.; Lawrence, K.; Pedlar, J.; Campbell, K.; Milewska, E.; Hopkinson, R.F.; Price, D.; Owen, T. Customized Spatial Climate Models for North America. Bull. Am. Meteorol. Soc. 2011, 92, 1611–1622. [Google Scholar] [CrossRef] [Green Version]
  42. Climate Data Canada. Available online: https://climatedata.ca/ (accessed on 20 May 2023).
  43. Blok, D.; Sass-Klaassen, U.; Schaepman-Strub, G.; Heijmans, M.M.P.D.; Sauren, P.; Berendse, F. What Are the Main Climate Drivers for Shrub Growth in Northeastern Siberian Tundra? Biogeosciences 2011, 8, 1169–1179. [Google Scholar] [CrossRef] [Green Version]
  44. Muggeo, V. Segmented: An R Package to Fit Regression Models with Broken-Line Relationships. R News 2008, 8, 20–25. [Google Scholar]
  45. Johnston, R.; Jones, K.; Manley, D. Confounding and Collinearity in Regression Analysis: A Cautionary Tale and an Alternative Procedure, Illustrated by Studies of British Voting Behaviour. Qual. Quant. 2018, 52, 1957–1976. [Google Scholar] [CrossRef] [Green Version]
  46. Harrell, F.E.; Charles, D. Hmisc: Harrell Miscellaneous. R Package Version 2008, 437. [Google Scholar]
  47. Wei, T.; Simko, V. R Package “Corrplot”: Visualization of a Correlation Matrix (Version 0.84); Vienna, Austria, 2017; Available online: https://cran.r-project.org/web/packages/corrplot/corrplot.pdf (accessed on 20 May 2023).
  48. Bieniek, P.A.; Walsh, J.E.; Thoman, R.L.; Bhatt, U.S. Using Climate Divisions to Analyze Variations and Trends in Alaska Temperature and Precipitation. J. Clim. 2014, 27, 2800–2818. [Google Scholar] [CrossRef] [Green Version]
  49. Sulla-Menashe, D.; Woodcock, C.E.; Friedl, M.A. Canadian Boreal Forest Greening and Browning Trends: An Analysis of Biogeographic Patterns and the Relative Roles of Disturbance versus Climate Drivers. Environ. Res. Lett. 2018, 13, 014007. [Google Scholar] [CrossRef]
  50. Epstein, H.E.; Bhatt, U.S.; Raynolds, M.K.; Walker, D.A.; Bieniek, P.A.; Tucker, C.J.; Pinzon, J.; Myers-Smith, I.; Forbes, B.C.; Macias-Fauria, M.; et al. Tundra Greenness. In Arctic Report Card: Update for 2015; 2015. [Google Scholar]
  51. Bhatt, U.; Walker, D.; Raynolds, M.; Bieniek, P.; Epstein, H.; Comiso, J.; Pinzon, J.; Tucker, C.; Polyakov, I. Recent Declines in Warming and Vegetation Greening Trends over Pan-Arctic Tundra. Remote Sens. 2013, 5, 4229–4254. [Google Scholar] [CrossRef] [Green Version]
  52. Bonney, M.T.; Danby, R.K.; Treitz, P.M. Landscape Variability of Vegetation Change across the Forest to Tundra Transition of Central Canada. Remote Sens. Environ. 2018, 217, 18–29. [Google Scholar] [CrossRef] [Green Version]
  53. Ropars, P.; Boudreau, S. Shrub Expansion at the Forest–Tundra Ecotone: Spatial Heterogeneity Linked to Local Topography. Environ. Res. Lett. 2012, 7, 015501. [Google Scholar] [CrossRef]
  54. Riedel, S.M.; Epstein, H.E.; Walker, D.A. Biotic Controls over Spectral Reflectance of Arctic Tundra Vegetation. Int. J. Remote Sens. 2005, 26, 2391–2405. [Google Scholar] [CrossRef]
  55. Greaves, H.E.; Vierling, L.A.; Eitel, J.U.H.; Boelman, N.T.; Magney, T.S.; Prager, C.M.; Griffin, K.L. High-Resolution Mapping of Aboveground Shrub Biomass in Arctic Tundra Using Airborne Lidar and Imagery. Remote Sens. Environ. 2016, 184, 361–373. [Google Scholar] [CrossRef]
  56. Myers-Smith, I.H.; Forbes, B.C.; Wilmking, M.; Hallinger, M.; Lantz, T.; Blok, D.; Tape, K.D.; Macias-Fauria, M.; Sass-Klaassen, U.; Lévesque, E.; et al. Shrub Expansion in Tundra Ecosystems: Dynamics, Impacts and Research Priorities. Environ. Res. Lett. 2011, 6, 045509. [Google Scholar] [CrossRef] [Green Version]
  57. Beck, P.S.A.; Juday, G.P.; Alix, C.; Barber, V.A.; Winslow, S.E.; Sousa, E.E.; Heiser, P.; Herriges, J.D.; Goetz, S.J. Changes in Forest Productivity across Alaska Consistent with Biome Shift: Changes in Forest Productivity across Alaska. Ecol. Lett. 2011, 14, 373–379. [Google Scholar] [CrossRef]
  58. Harsch, M.A.; Hulme, P.E.; McGlone, M.S.; Duncan, R.P. Are Treelines Advancing? A Global Meta-Analysis of Treeline Response to Climate Warming. Ecol. Lett. 2009, 12, 1040–1049. [Google Scholar] [CrossRef]
  59. Bjerke, J.W.; Treharne, R.; Vikhamar-Schuler, D.; Karlsen, S.R.; Ravolainen, V.; Bokhorst, S.; Phoenix, G.K.; Bochenek, Z.; Tømmervik, H. Understanding the Drivers of Extensive Plant Damage in Boreal and Arctic Ecosystems: Insights from Field Surveys in the Aftermath of Damage. Sci. Total Environ. 2017, 599–600, 1965–1976. [Google Scholar] [CrossRef]
  60. Raynolds, M.K.; Walker, D.A.; Munger, C.A.; Vonlanthen, C.M.; Kade, A.N. A Map Analysis of Patterned-Ground along a North American Arctic Transect. J. Geophys. Res. 2008, 113, G03S03. [Google Scholar] [CrossRef] [Green Version]
  61. Bhatt, U.S.; Walker, D.A.; Raynolds, M.K.; Bieniek, P.A.; Epstein, H.E.; Comiso, J.C.; Pinzon, J.E.; Tucker, C.J.; Steele, M.; Ermold, W.; et al. Changing Seasonality of Panarctic Tundra Vegetation in Relationship to Climatic Variables. Environ. Res. Lett. 2017, 12, 055003. [Google Scholar] [CrossRef] [Green Version]
  62. Jia, G.J.; Epstein, H.E.; Walker, D.A. Greening of Arctic Alaska, 1981–2001. Geophys. Res. Lett. 2003, 30, 2067. [Google Scholar] [CrossRef]
  63. Verbyla, D. The Greening and Browning of Alaska Based on 1982–2003 Satellite Data. Glob. Ecol. Biogeogr. 2008, 17, 547–555. [Google Scholar] [CrossRef]
  64. Wipf, S.; Rixen, C. A Review of Snow Manipulation Experiments in Arctic and Alpine Tundra Ecosystems. Polar Res. 2010, 29, 95–109. [Google Scholar] [CrossRef]
  65. Sturm, M.; Schimel, J.; Michaelson, G.; Welker, J.M.; Oberbauer, S.F.; Liston, G.E.; Fahnestock, J.; Romanovsky, V.E. Winter Biological Processes Could Help Convert Arctic Tundra to Shrubland. BioScience 2005, 55, 17. [Google Scholar] [CrossRef]
  66. Crichton, K.A.; Anderson, K.; Charman, D.J.; Gallego-Sala, A. Seasonal Climate Drivers of Peak NDVI in a Series of Arctic Peatlands. Sci. Total Environ. 2022, 838, 156419. [Google Scholar] [CrossRef]
  67. Marek, R.S.; Richardson, J.B. Investigating Surficial Geologic Controls on Soil Properties, Inorganic Nutrient Uptake, and Northern Hardwood Growth in Western Massachusetts, USA. J. Soil Sci. Plant Nutr. 2020, 20, 901–911. [Google Scholar] [CrossRef]
  68. Da Rocha, P.R., Jr.; Ribeiro, P.H.; Mesquita, L.F.; Andrade, F.V.; Mendonça, E.d.S. Distribution of C and Inorganic Phosphorus Fractions in Different Aggregate Sizes under Forestry, Agroforestry System and Pasture. J. Soil Sci. Plant Nutr. 2018, 18, 361–375. [Google Scholar] [CrossRef]
  69. Vessia, G.; Di Curzio, D. Lacustrine Deposits. In Encyclopedia of Engineering Geology; Bobrowsky, P., Marker, B., Eds.; Springer International Publishing: Cham, Switzerland, 2018; pp. 1–6. ISBN 978-3-319-12127-7. [Google Scholar]
Figure 1. The four vegetation zones of Nunavik.
Atmosphere 14 01115 g001
Figure 2. Flowchart illustrating the steps used to generate and analyze the NDVI trends in Nunavik. Top row: summertime Landsat scenes from 1984 to 2020 were collected and masked, and then used to compute NDVI. Annual NDVI maps were produced by selecting, pixel by pixel, the median NDVI value (or best available pixel) for all available dates during the summer. The NDVI maps were then superimposed on ecological mapping of vegetation in northern Québec. Middle row: NDVI time series were produced by vegetation zone and cover types, and then used in segmented regression analysis to determine the appropriate time period (years) for studying NDVI trends. Simple linear regression was then performed on this time period to quantify the contribution of each vegetation zones and cover types to the increase in NDVI. Bottom row: drivers of NDVI trends were identified by conducting multiple linear regressions using climate variables, edaphic conditions (surficial deposits), and topographical conditions (aspect) as predictors.
Atmosphere 14 01115 g002
Figure 3. Segmented regression analysis of NDVI time series of cover types by vegetation zone.
Atmosphere 14 01115 g003
Figure 4. Map of the annual rates of change in NDVI from 1992 to 2020 in Nunavik.
Atmosphere 14 01115 g004
Figure 5. Frequency distribution of the annual rates of change in NDVI from 1992 to 2020 in each vegetation zone in Nunavik.
Atmosphere 14 01115 g005
Table 1. Relative contribution of cover types to vegetation greening in Nunavik’s vegetation zones: NDVI rate of increase (color-coded) and relative contribution to NDVI—relative area.
Cover Types
Vegetation ZonesConiferous
Forest
Lichen WoodlandErect Shrubs < 30%Erect Shrubs
30–70%
Erect Shrubs > 70%Prostrate ShrubsWetlandsOpen
Areas
BedrockAll Cover Types
Prostrate shrub tundraN.A.N.A.0.00.0N.A.−2.1−0.1−1.4−0.3−3.8
Erect shrub tundraN.A.N.A.1.61.40.2−0.10.1−0.4−0.12.6
Forest
tundra
0.30.61.81.20.2−0.3−0.2003.6
Spruce-
lichen woodland
−0.6−1.2−0.100N.A.−0.500−2.4
Greening rate (NDVI units y−1)
0–0.00390.0040–0.00490.0050–0.0059<0.0060
Note: The color-coded cells represent the rate of greening, while the numerical values indicate the relative contribution of each cover type to the NDVI (Normalized Difference Vegetation Index) considering their relative area. N.A.: cover type not observed in a particular vegetation zone.
Table 2. Most plausible models to explain the annual rate of change in NDVI in Nunavik. Tann: annual temperature; Tjja: summer temperature; Tfall: fall temperature; Twin: winter temperature; Pann: annual precipitation; Pjja: summer precipitation; Pfall: fall precipitation; Pwin: winter precipitation; Surf. Dep: surficial deposits. The symbol “*” denotes the interaction between the surficial deposit and the cover type in the models. Green crosses indicate a positive and significant relationship between the climate variable and the annual rates of change in NDVI in the model, while red crosses indicate a negative and significant relationship.
TannTjjaT fallT winPannPjjaPfallPwinAspectSurf. Dep * Cover TypeAICΔAICR2
Nunavik X XX X−17,903,000-0.152
X X−17,901,40615940.151
X X X−17,900,89521060.151
X−17,894,07589250.134
X X−17,888,69014,3100.144
X XXXX−17,871,59131,4090.151
Best climatic model X XX −17,707,544195,4560.055
Disclaimer/Publisher’s Note: The statements, opinions and data contained in all publications are solely those of the individual author(s) and contributor(s) and not of MDPI and/or the editor(s). MDPI and/or the editor(s) disclaim responsibility for any injury to people or property resulting from any ideas, methods, instructions or products referred to in the content.

