Article

Impacts of Extreme Weather Event in Southeast Brazilian Mangrove Forest

1
Environmental Research Institute, São Paulo 04015-011, Brazil
2
Department of Fishery Resources and Aquaculture, Sao Paulo State University, Registro 01140-070, Brazil
3
Geography Institute, Jataí Federal University, Jataí 75801-615, Brazil
4
Department of Geography, University of São Paulo, São Paulo 05508-010, Brazil
*
Author to whom correspondence should be addressed.
Atmosphere 2023, 14(8), 1195; https://doi.org/10.3390/atmos14081195
Submission received: 2 June 2023 / Revised: 6 July 2023 / Accepted: 21 July 2023 / Published: 25 July 2023
(This article belongs to the Special Issue Forests and Climate Interactions)

Abstract

:
Climate oscillations are becoming more extreme, and mangroves may be more susceptible to changes in physical conditions that can lead to mass diebacks. The current study analysed the impacts of an extreme weather event in the Cananéia-Iguape Coastal System, southeast Brazilian mangroves and the condition of the area over three years. We used a multiproxy approach, including analyses of climatic attributes, structural vegetation, and vegetation indices. Damage caused by a strong storm and hail damage had a severe impact on mangrove areas. A meteorological station installed in the mangrove since 2008 recorded a maximum wind gust of 58 km·h−1 on 30 May 2019. On the Beaufort scale, this speed is classified as strong wind. After the extreme weather event, there were catastrophic impacts on the mangrove, with more than 90% dead trunks. Vegetation indices were reduced, indicating intense changes. The NDVI of the mangroves was reduced from 0.72 to 0.35. The LAI confirmed this premise, with a reduction from 4.25 to 0.63. After three years, natural recovery had not occurred. Extreme weather events have continued to occur along coasts, drastically altering the landscape. Mangroves have been affected by these events, and depending on the state of health of the forests, may have difficulties in recovery.

1. Introduction

Natural losses of mangrove forests through shoreline erosion and extreme weather events remain pervasive worldwide. Global mangrove loss has been attributed primarily to human activity, although sedimentary processes such as erosion can also play a significant role in forest vulnerability. From 2000 to 2016, about 62% of losses resulted from land-use change, primarily through conversion to aquaculture and agriculture, especially in Southeast Asian countries. Almost all mangrove-holding nations are affected by erosion and extreme weather events. Coastal erosion accounted for the second highest percentage of global losses at 27% (912 ± 41 km2), and extreme weather events contributed 11% of losses (361 ± 31 km2). Nearly 130 km2 of coastal erosion also occurred along the eastern coast of Brazil [1], mainly as a result of significant Amazon River discharge [2].
Climate oscillations are becoming more extreme, and mangrove ecosystems may be more susceptible to changes in physical conditions that can sometimes lead to mass diebacks [3]. At broader scales, mangroves are impacted by long-term processes such as the relative sea-level rise and fluctuations in sea level linked to climate oscillations [4,5], with important implications for the vulnerability of the coastal populations who rely on mangrove resources [6].
Climate change substantially impacts mangroves through rising sea levels, increased frequency and intensity of extreme weather events and storms, rising air and sea temperatures, and changes in precipitation. These factors are interrelated and spatially variable at regional scales [7,8,9,10]. These changes can alter the function, as well as the ecosystem services obtained from mangroves, such as carbon sequestration and storage and shoreline protection [11,12].
The main causes of tree death and mangrove forest damage are episodic events (violent windstorms, frost damage, and hail damage), such as plant pathogens, wood-boring insects, lightning strikes, and tree falls, and slow and progressive changes, such as changes in sea level, water courses, sedimentation processes, and seasonal flooding or drought [13].
Mangroves protect the coastal zone against strong winds [14]. Their canopies, roots, and stems are rough areas functioning as barriers to attenuate the wind speed as it passes by these aboveground structures [15,16,17,18].
Mangroves are highly sensitive to all these factors and are likely to be influenced by altered climate cycles and associated increasing climatic variability [3]. Temperature and rainfall changes are expected to affect mangrove forests’ global distribution, abundance, and diversity [19].
Approximately 70% of reported mangrove losses from natural causes occur due to low-frequency, high-intensity weather events such as tropical cyclones and weather extremes [20]. Recent events such as the death of mangroves in Australia suggest the growing importance of extreme climate mortality events and highlight mangroves as important sentinels of global climate change. These events can also indicate the limits and vulnerabilities of such ecosystems in the face of climate change [5,20,21,22].
The current study uses a multiproxy approach to analyse the impacts of an extreme weather event in southeast Brazilian mangroves and the recovery over the area over three years. Microclimate monitoring in mangroves started in 2008, and the characterization of the vegetation structure has occurred since 2012. The extreme weather event under analysis occurred in 2019. For these analyses, climatic data, vegetation structure, and vegetation indices obtained by satellite images were used.

2. Materials and Methods

2.1. Study Area

The coastline of São Paulo State, located in SE Brazil, is 622 km long. It can be segmented into three sectors: the north coast, the Baixada Santista region (centre), and the Cananéia-Iguape Coastal System (south). The southeast region is Brazil’s most populated region and, according to FAO (2007) [23], is subject to high mangrove area losses due to urban development.
The Cananéia-Iguape Coastal System (hereafter abbreviated as ‘CICS’) consists of a complex of lagoon channels (Figure 1), is part of UNESCO’s World Site Heritage ‘Atlantic Forest South-East’ Reserves established in 1999, and has been a Ramsar site since 2017 [23]. This coastal system can be divided into a northern and a southern sector based on geomorphology and environmental conditions. The CICS mangrove area extent was estimated at 12,000 ha [24]. This region is home to the most conserved mangroves on the coast of the state of São Paulo, which is part of a continuum of this ecosystem that advances to the state of Paraná.
The northern sector, located between 24°50′ S–47°41′ W and 24°35′ S–47°30′ W, has been exposed to critical environmental changes over the last 150 years resulting from the opening of a canal. The canal, called Valo Grande was opened between 1827 and 1852 and connects the Ribeira River to the coastal system (Figure 1). Its opening led to significant modifications in salinity, depositional patterns, and input of heavy metals into the coastal system resulting from lead mining activities, although these ceased in 1995. The width of the channel increased from 4.4 m to 250 m in just a few decades [25].
Despite the region’s conservation, studies have identified clearings in mangrove areas in the Iguape region due to the increase in invasive aquatic macrophytes in this sector that resulted from the opening of the Valo Grande canal [26]. In the northern section, microclimatic monitoring of mangroves has been occurring, with variations interpreted as an indicator of changes in mangrove structure at its edge and inside the ecosystem [27,28].

2.2. Multiproxy Approach

A multiproxy approach including analyses of climatic attributes, structural vegetation in permanent plots, and vegetation indices with remote sensing to evaluate these impacts proved suitable for such an assessment at different spatial scales. Remote sensing provided details of how the storm impacted the landscape. The limitation of permanent plots allowed for analysis of the impact of vegetation cover, while the characterization of the climatic event allowed for a better understanding of the phenomenon on a regional scale and its impact on a local scale.

2.3. Climate

Microclimatic monitoring of mangroves in the northern sector of part of the Environmental Protection Area of Cananeia-Iguape-Peruíbe, CICS, began in 2008. We installed a microclimate tower containing two automatic meteorological stations (AMSs), which analyse the vertical variation of the climatic attributes. The microclimatic tower had a meteorological station at 2 m, with sensors for air temperature, relative air humidity, wind direction and speed, precipitation, and global solar radiation. Another meteorological station was installed above the vegetation canopy at 12 m to obtain the same climatic attributes plus a radiometer balance. The equipment was programmed to register every 10 min. The current event was recorded only at the station located in the northern sector of the coastal system [27,28].

2.4. Mangrove Structural Vegetation

In 2012, a permanent plot was installed next to the meteorological station to characterize and monitor the structure of the mangrove forest. We described the mangrove forest vegetation structures of a permanent plot (13 m × 13 m) in the mangrove area based on trunk density, which included about 30 individuals mangrove trees, according to the methodology [29]. This survey took place during the years 2012 to 2015 and 2019 to 2022.
We identified all plants and recorded the tree diameter, height, and occurrence of associated species. In each plot, individuals with a size ≥ 1 m were determined according to species and living or dead conditions. Their total height was measured by a digital telemeter or a Bosch GR 500 ruler according to tree height, depending on the lower limit of the telemeter. We used a Forest Suppliers Steel diameter tape graduated in pi (π) to measure each trunk’s diameter at breast height (DBH = 1.30 m above ground level). We calculated the mean height, basal area dominance, and stem density. The basal area of the forest is estimated from diameter measurements (<2.5 cm; 2.5–10.0 cm; ≥10.0 cm) within a hectare. In 2020 and 2021, all seedlings and saplings (less than 1.0 m in height) were counted and measured, and the species were identified.
The interstitial salinity was measured using a manual optical refractometer at 10 cm and 50 cm depths.

2.5. Remote Sensing

To assess the extent of damage caused by the extreme weather event, a radius of 5 km was established from the microclimatic station, including the lower course of the Ribeira de Iguape River, in an area of 7857 ha. Subsequently, images were obtained from the MSI sensor of the Sentinel 2 Satellite, scene T23JKN, with a resolution of 10 m in the Earth Explorer domain of the US Geological Survey. Bands 2 (blue), 3 (green), 4 (red), and 8 (near infrared) were used to analyse the images obtained on 25 May 2019 (before the extreme weather event), 14 June 2019 (after the damage), and 18 June 2020 (1 year after the event).
Using the ArcGIS 10.6.1® geographic information system licensed to the Geoinformation Laboratory of the Federal University of Jataí and the Raster Calculator tool, vegetation indices were generated to help quantify the extent of the damage.
The normalised difference vegetation index (NDVI) [30] calculates vegetation density based on the difference in light intensities reflected in the red (RED) and near-infrared (NIR) bands. Values are set between −1 and +1; the closer to +1, the greater the vegetation density. In hailstorm events, where tree vegetation loses most of its leaves, it becomes an efficient method to estimate the extent of the damage. The index can be obtained by:
NDVI = NIR − RED/NIR + RED
In areas where the luminosity of the soil can interfere with obtaining vegetation indices, the use of adjusted vegetation indices such as OSAVI (Optimized Soil-Adjusted Vegetation Index) is also recommended. This index considers a canopy bottom adjustment factor (0.16) suitable for areas with coverage greater than 50%. It can be obtained by [31]:
OSAVI = NIR − RED/NIR + RED + 0.16
In addition to vegetation indices, leaf area indices (LAI) are essential for analysing the foliage surface and estimating the number of leaves in a specific region. They are important in monitoring forest health and weather conditions, such as extreme weather events. If LAI = 3, the leaves can cover the surface three times, and when the index is close to 0, it can indicate severe problems in forest areas.
In remote sensing, different models can be used to calculate the leaf area index, one of which is the SEBAL algorithm (Surface Energy Balance Algorithms for Land) [32]. It can be calculated according to the soil-adjusted vegetation index using the following equation:
L A I = ln 0.69 S A V I 0.59 0.91

3. Results

3.1. Climate

Synoptic Conditions for the Period of 28–30 May 2019

On 28 May 2019, at levels of 250, 500, and 850 hPa to the surface, the flow over the area was anticyclonic (South Atlantic subtropical anticyclone—SASA), reflecting stable atmospheric conditions and clear skies in São Paulo, Minas Gerais, and Paraná. The Iguape meteorological station recorded an average air temperature of 19 °C, 28.4 mm of rain, and 89% relative humidity for that day [33].
In the mangrove, on 28 May 2019, the synoptic conditions reflected an average air temperature of 20.3 °C, an absolute maximum of 26.6 °C at 11:50 a.m., and an absolute minimum of 16.1 °C at 4:10 a.m. The recorded daily global solar radiation was 11.4 MJ·m−2, with an atmospheric transmissivity of 0.5 (partly cloudy day). The maximum wind gust was 30 km·h−1.
Atmospheric instability occurred in the study area on 29 and 30 May 2019. Low-level flows and a trough resulted in lightning, heavy rain, and hail in the region [34].
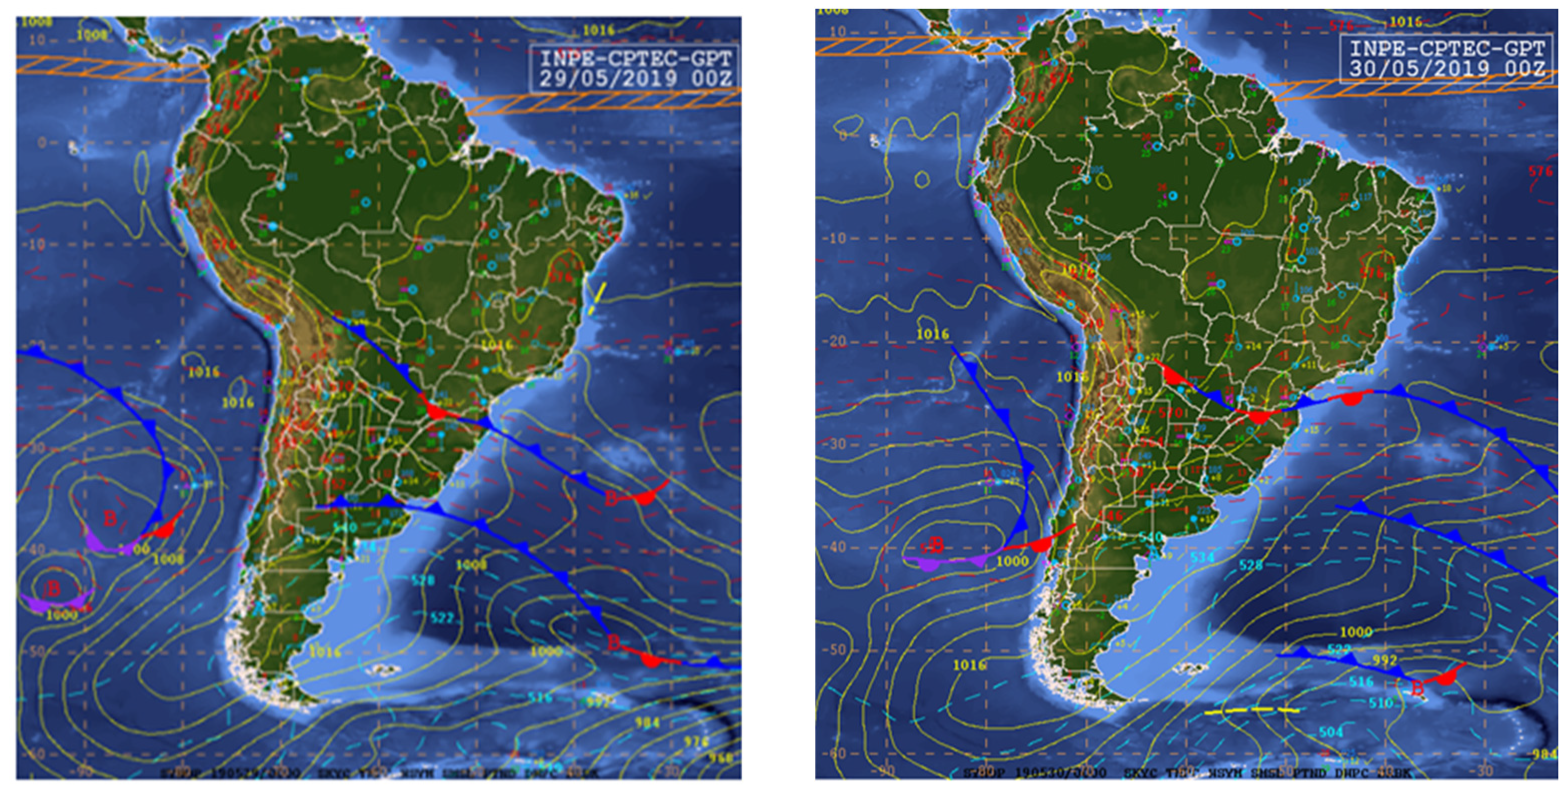
On 29 May 2019, 00Z, the trough at 250 and 500 hPa was located west of Rio Grande do Sul, Santa Catarina, and Paraná. Over São Paulo, the trough began to distort the anticyclonic flow present in the area. The subtropical jet stream was over the north of Rio Grande do Sul, following the curvature of the trough. At 850 hPa, the low-level jet was over Paraná and northern Santa Catarina. These fed the areas of instability associated with the Atlantic polar front (APF), which undulated between southern Bolivia and Paraguay. The frontal trough was over Paraná and ran over the Atlantic to about 35° S/36° W.
The SASA moved eastward, and its edge acted only over southeast and northeast Brazil. In São Paulo, due to the proximity of the APF, the skies were already cloudy, with induced wind gusts and troughs producing instabilities from the NW to SE of the state. In the study area, the air temperature was 17 °C, with northwest winds of 46.3 km·h−1 at 850 hPa, as shown in Figure 2. The satellite image shows clouds with vertical development over Paraná and on the border with São Paulo. These clouds have a deeper core (top cloud temperature of −65 °C) near Apiaí and Iporanga, in São Paulo, moving from NW to SE.
At 06Z, the APF advanced over the continent’s interior and reached the border of Mato Grosso do Sul/Brazil with Paraguay. Still near the Atlantic Ocean, the front continued to undulate between Paraná and Santa Catarina. At the upper levels, the trough axis was at 49° W, and the southern edge of the SASA was over São Paulo, with cloudy skies (10/10) and southeast winds of 9.2 km·h−1 and 1016 hPa. At this moment, the baroclinic zone was behind the front, with a horizontal temperature gradient. The polar migratory anticyclone was still in formation at 1018 hPa, located over Baía Blanca (Argentina).
At that time, the average air temperature in the mangrove was 19.8 °C, with 100% relative humidity and maximum wind gusts of 9.7 km·h−1.
At 12Z, the trough at altitude returned to the west, with its axis at 50° W, arriving at Vale do Ribeira in São Paulo state. The APF undulated with the warm sector over the west and centre portions of the state of Paraná and the cold sector exactly over Vale do Ribeira. At 18Z, the APF headed east, towards the Atlantic Ocean, displacing the warm sector, which, at 12Z, was over Paraná, to the Vale do Ribeira, and the cold sector of the front remained over the ocean.
In 500 mb, the trough axis also advanced eastward, along the 47° W meridian, with SASA moving eastward and contributing to a decrease in pressure in southeast and northeastern Brazil. The advection of warm air from the continent loaded the Vale do Ribeira with heat and humidity.
In the mangrove, on 29 May 2019, the average air temperature recorded at 3:00 p.m. was 23.5 °C, with a relative humidity of 94% and wind gusts of 11.8 km·h−1. Global solar radiation of 5.6 MJ/m2 was recorded, with an atmospheric transmissivity of 0.2, which is characteristic of cloudy days.
On 30 May 2019, 00Z, the trough at 250 and 500 hPA passed through São Paulo state (in the last 24 h) with the axis situated along the 40° W meridian. Thus, São Paulo state was under upper subsidence from the rear of the trough. At 850 hPa, the low-level jet was disfigured by the circulation of the upper levels, with the SASA controlling the weather again over São Paulo. The front remained stationary, undulating between Paraguay, Santa Catarina, and Paraná. The sector over the continent was static, and the cold sector over the ocean continued to be supported by the trough of the upper levels (Figure 2).
In São Paulo, the prevailing winds are from the northeast, with an average speed of 9.2 km·h−1, 7/10 sky cover, and a temperature in Alto Ribeira of 16 °C (air temperature and dew point), with the formation of fog.
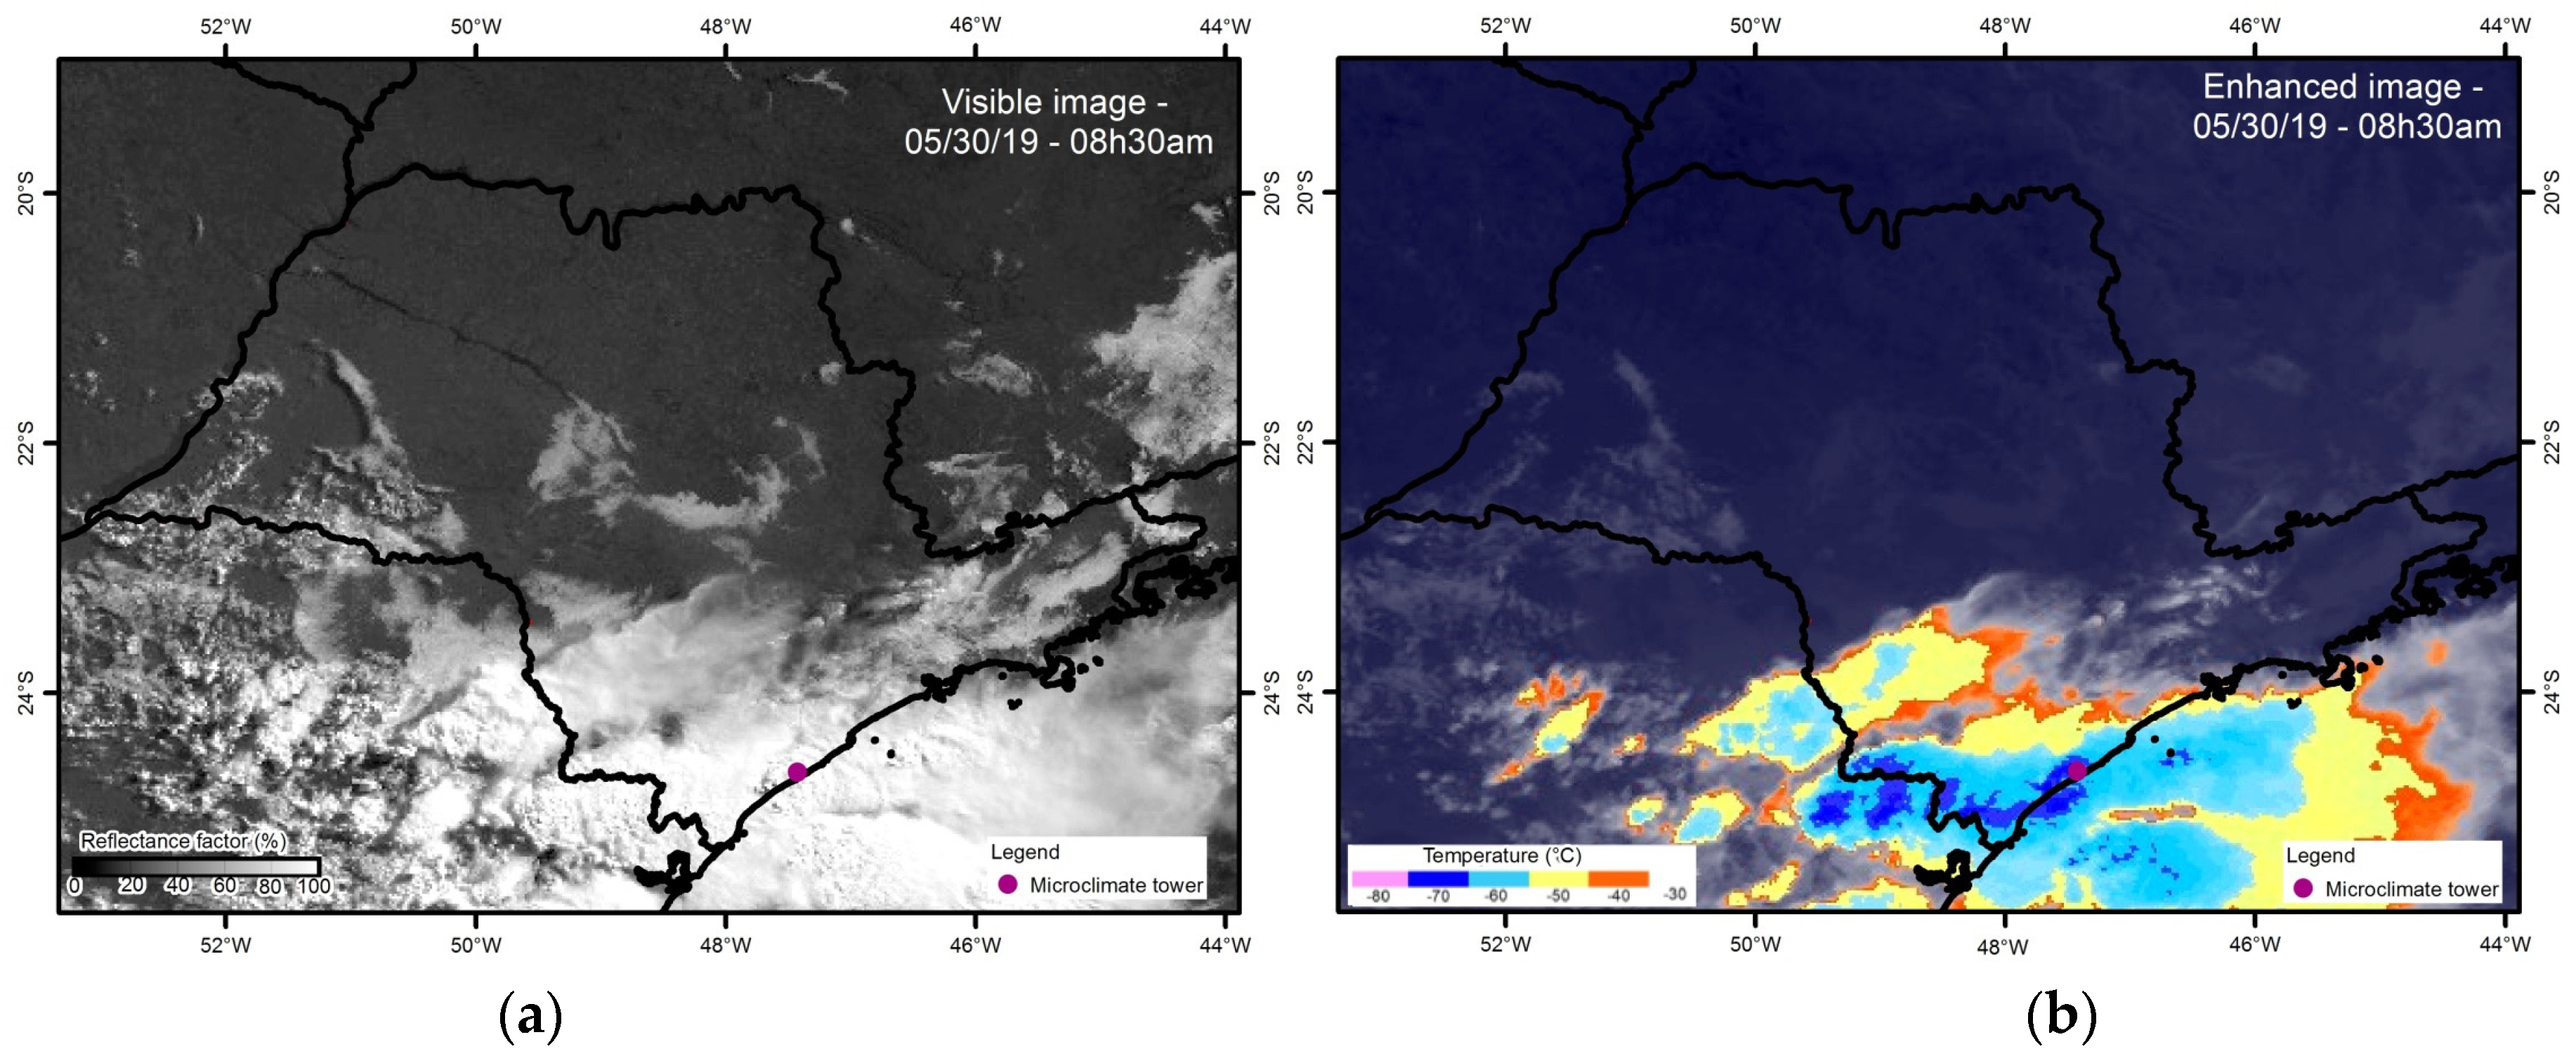
The visible image band (0.6 µm) shows the intense presence of clouds in the study area (Figure 3a). This image indicates the solar radiation reflected by the Earth and clouds. Lighter tones represent areas of high reflectivity (high albedo), and dark tones have low reflectivity (low albedo). Reflectivity is related to cloud depth, droplet size and distribution, composition (liquid, water, or ice), and liquid water content.
A large area of white clouds is observed over the study area (Figure 3a), which indicates a high albedo. The clouds have high reflectivity, indicating the presence of dense clouds, suggesting deep convection, the presence of high water content, and even hail. At 08:30 a.m., the study area was under the influence of clouds, with a temperature of −70 °C at the top of the formation, indicating intense convective power (Figure 3b).
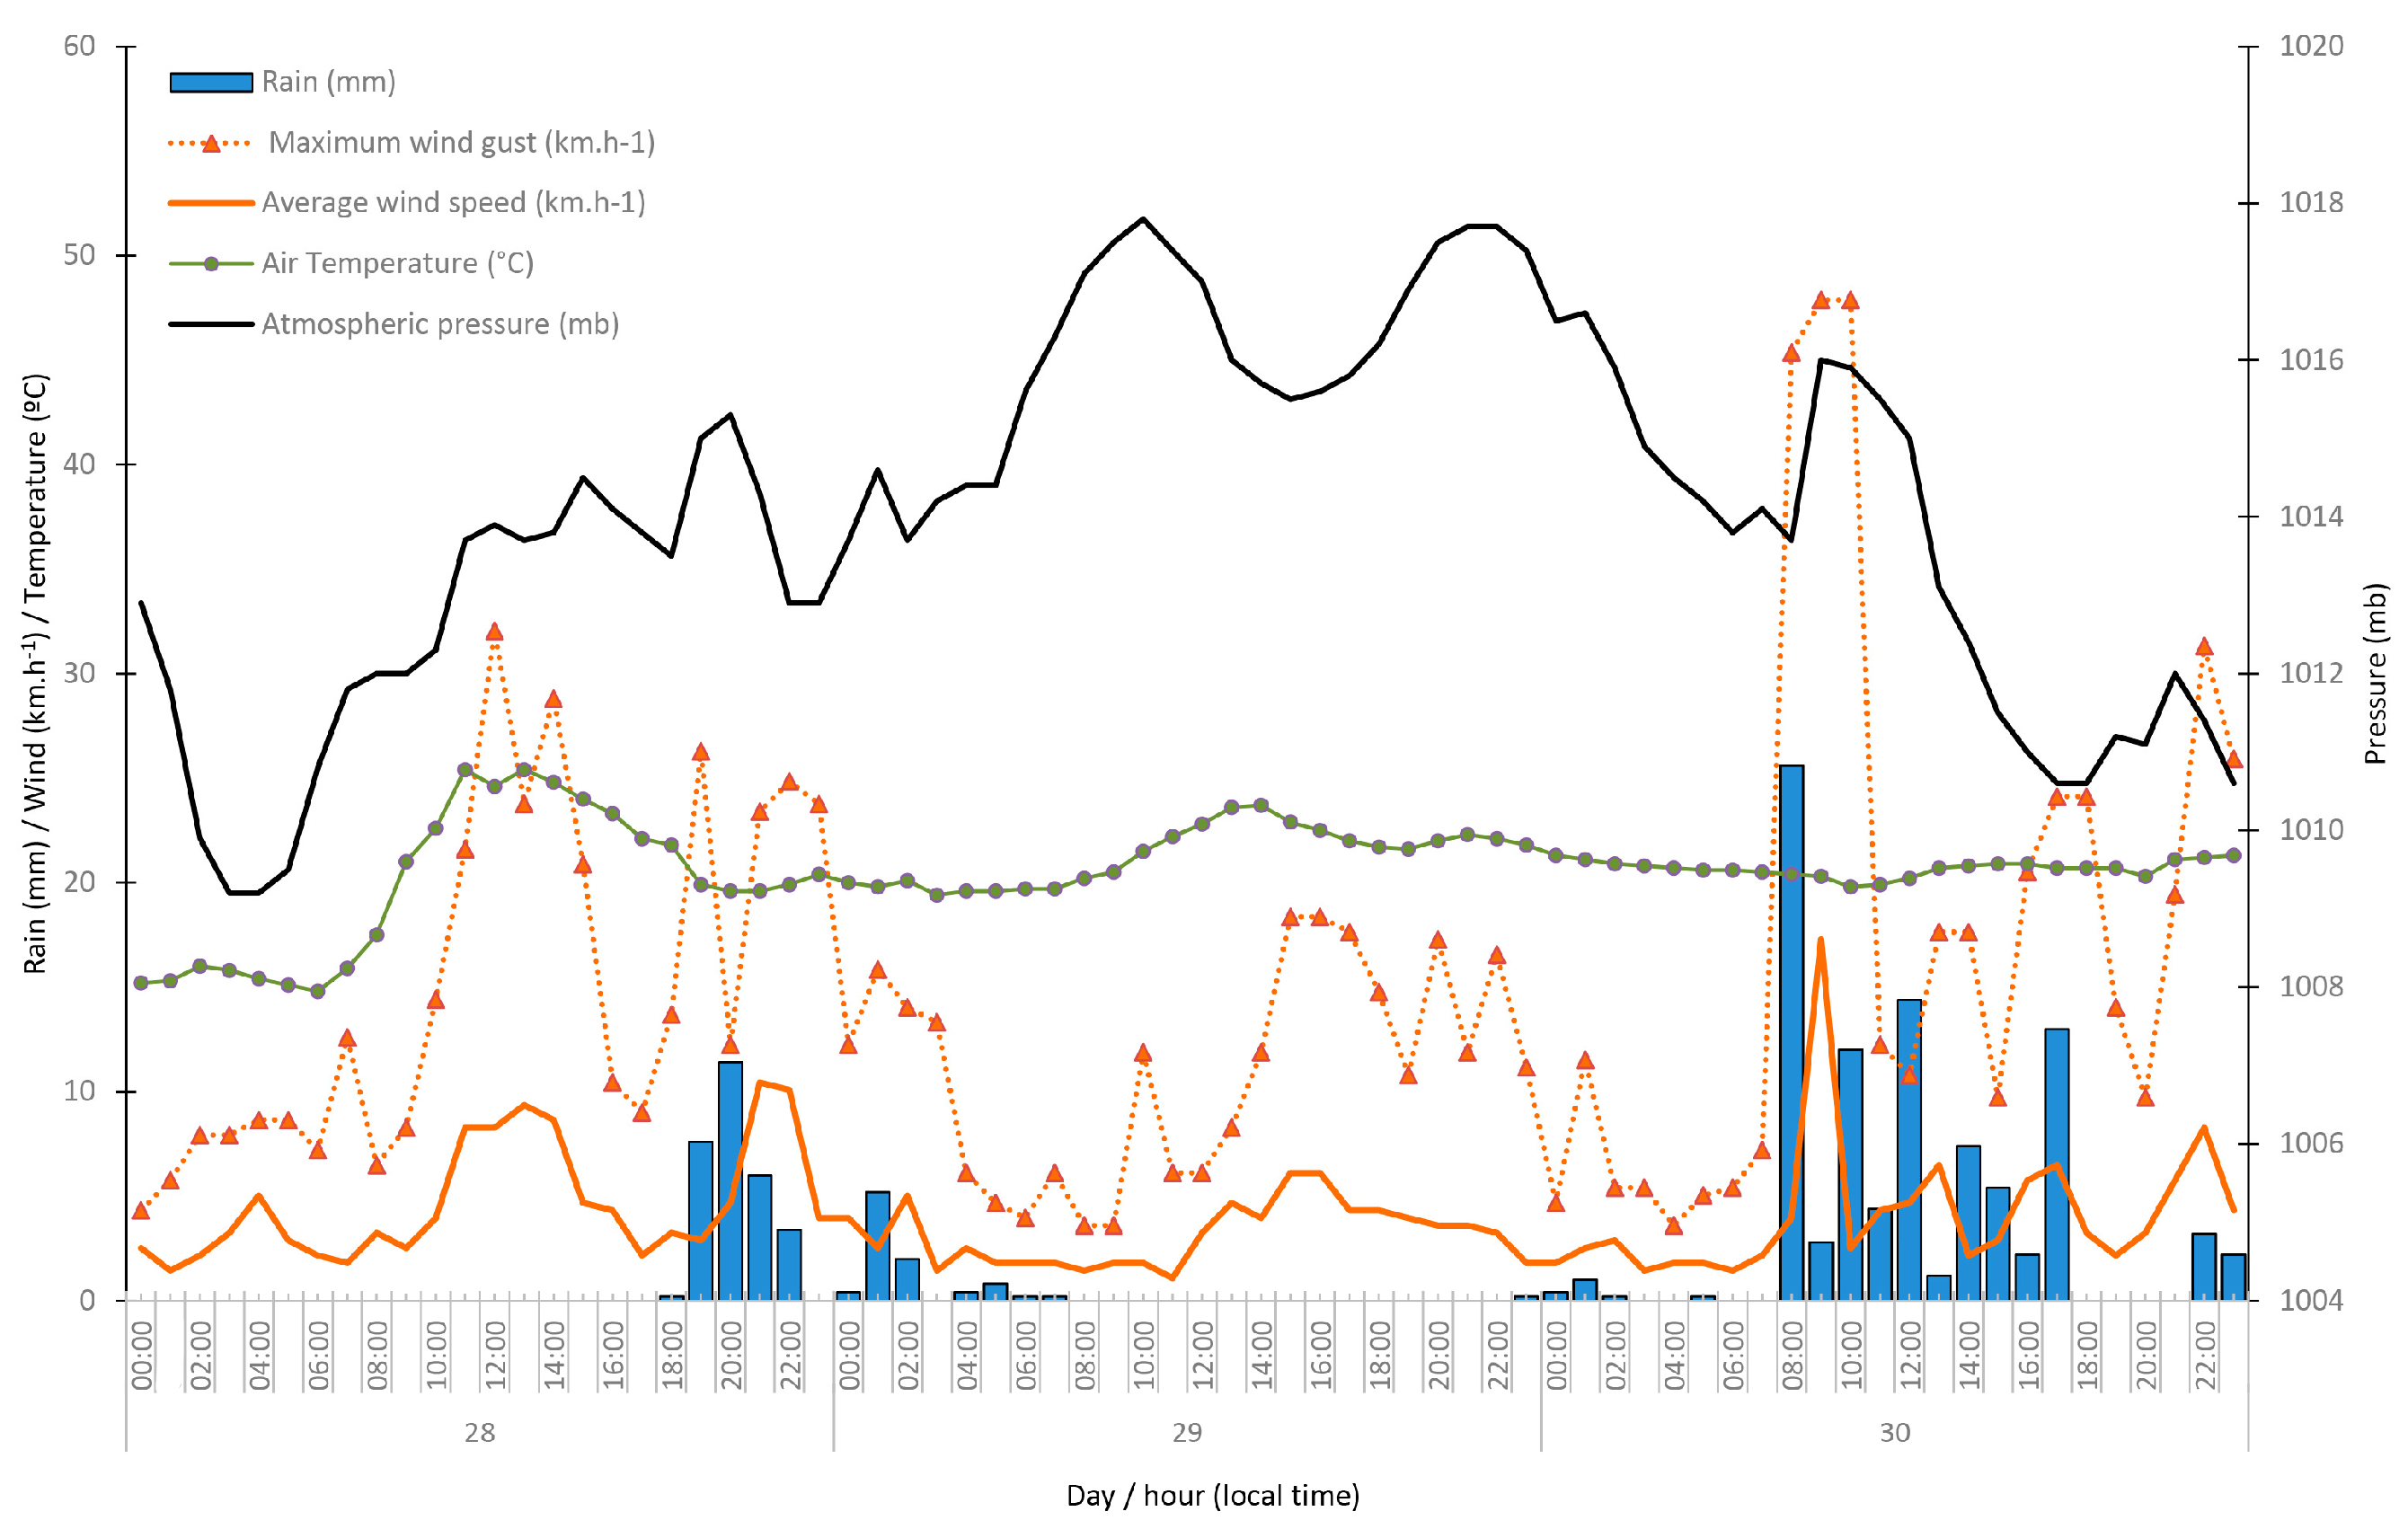
In Iguape, the daily rain on 30 May 2019 was 95.6 mm (Figure 4). The average air temperature was 20.7 °C, with an absolute maximum of 21.8 °C and an absolute minimum of 19.6 °C. The recorded maximum wind gust was 48 km·h−1.
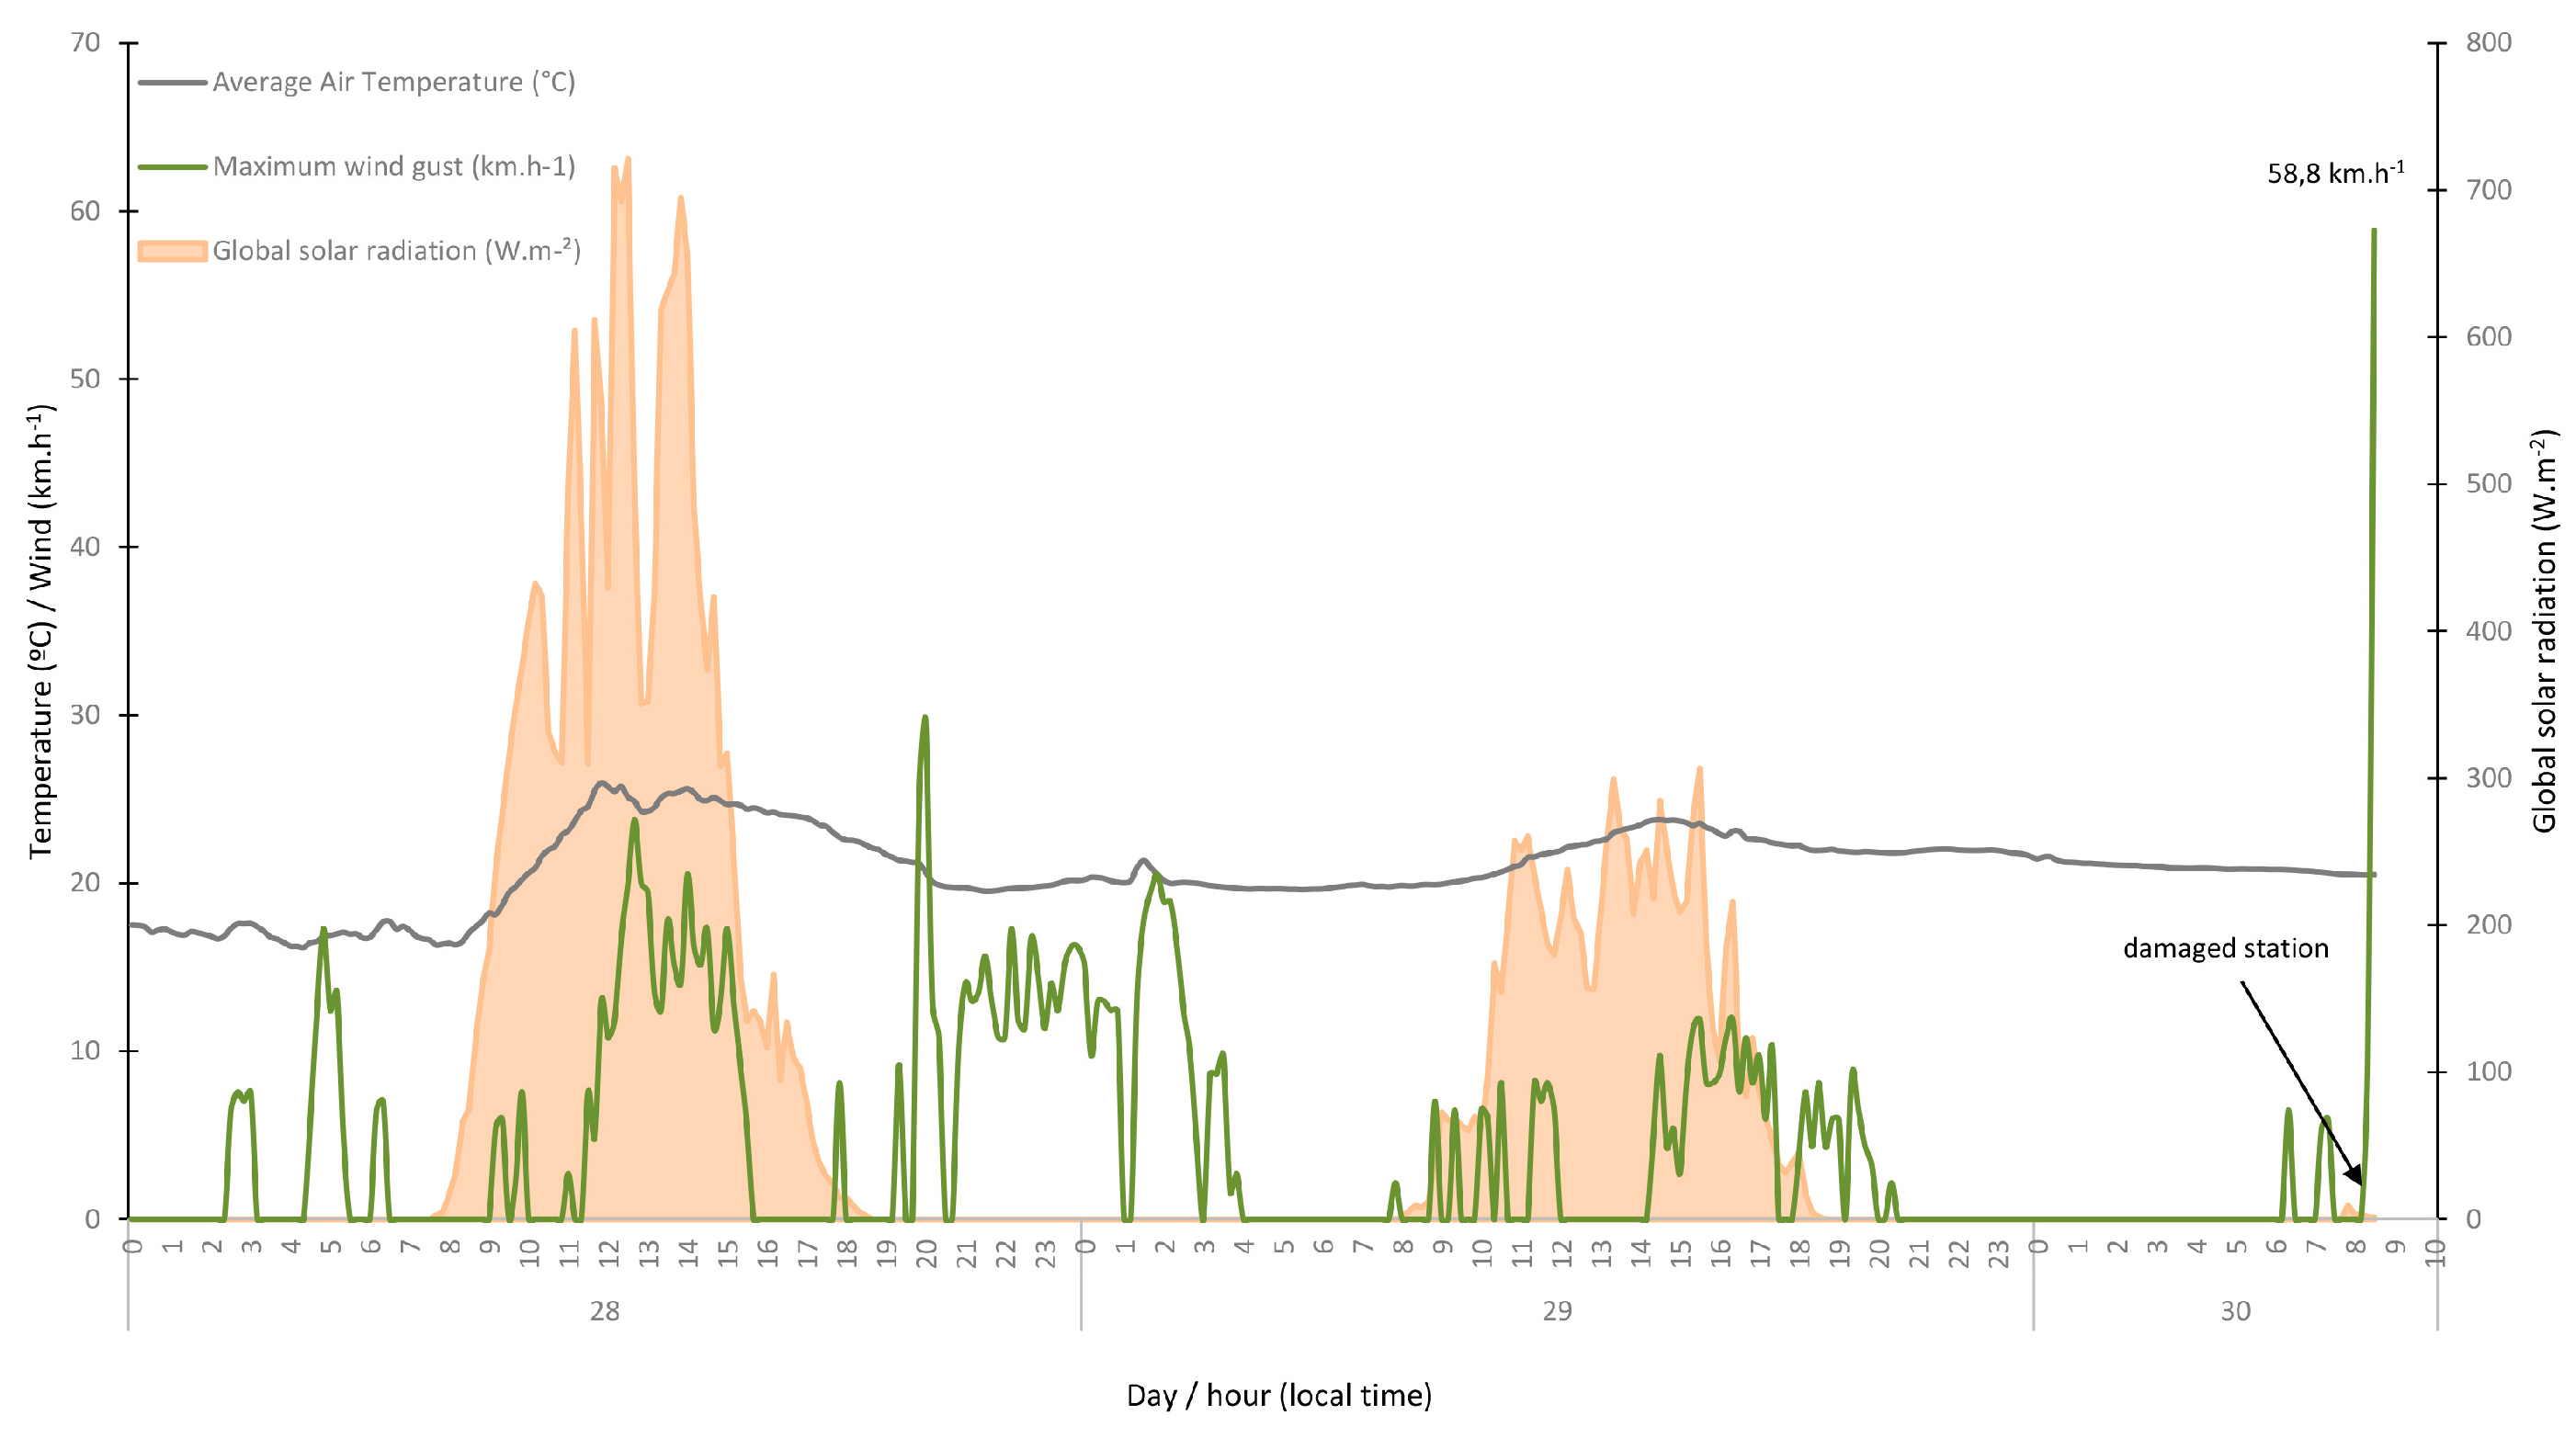
Figure 5 shows the record of the average air temperature, maximum wind gust, and global solar radiation in the microclimatic tower on 28, 29, and 30 May 2019. The station’s last record occurred at 8:30 a.m., when a 58.8 km·h−1 wind gust impacted the station. On the Beaufort scale, this speed is classified as strong wind. The storm and the action of this convective system associated with lightning and hail damaged the equipment installed in the forest. After this extreme weather event, the mangroves showed high mortality, as discussed in the following sections.

3.2. Mangrove Structural Vegetation

The red mangrove (Rhizophora mangle L., Rhizophoraceae) and the white mangrove (Laguncularia racemosa (L.) Gaertn. F., Combretaceae)) dominated the mangrove forests at this site in 2015 (Figure 6). This mangrove forest also has associated species of vegetation, such as the mangrove fern Acrostichum aureum and aquatic macrophytes. The occurrence of these species in this area has been associated with environmental change [35].
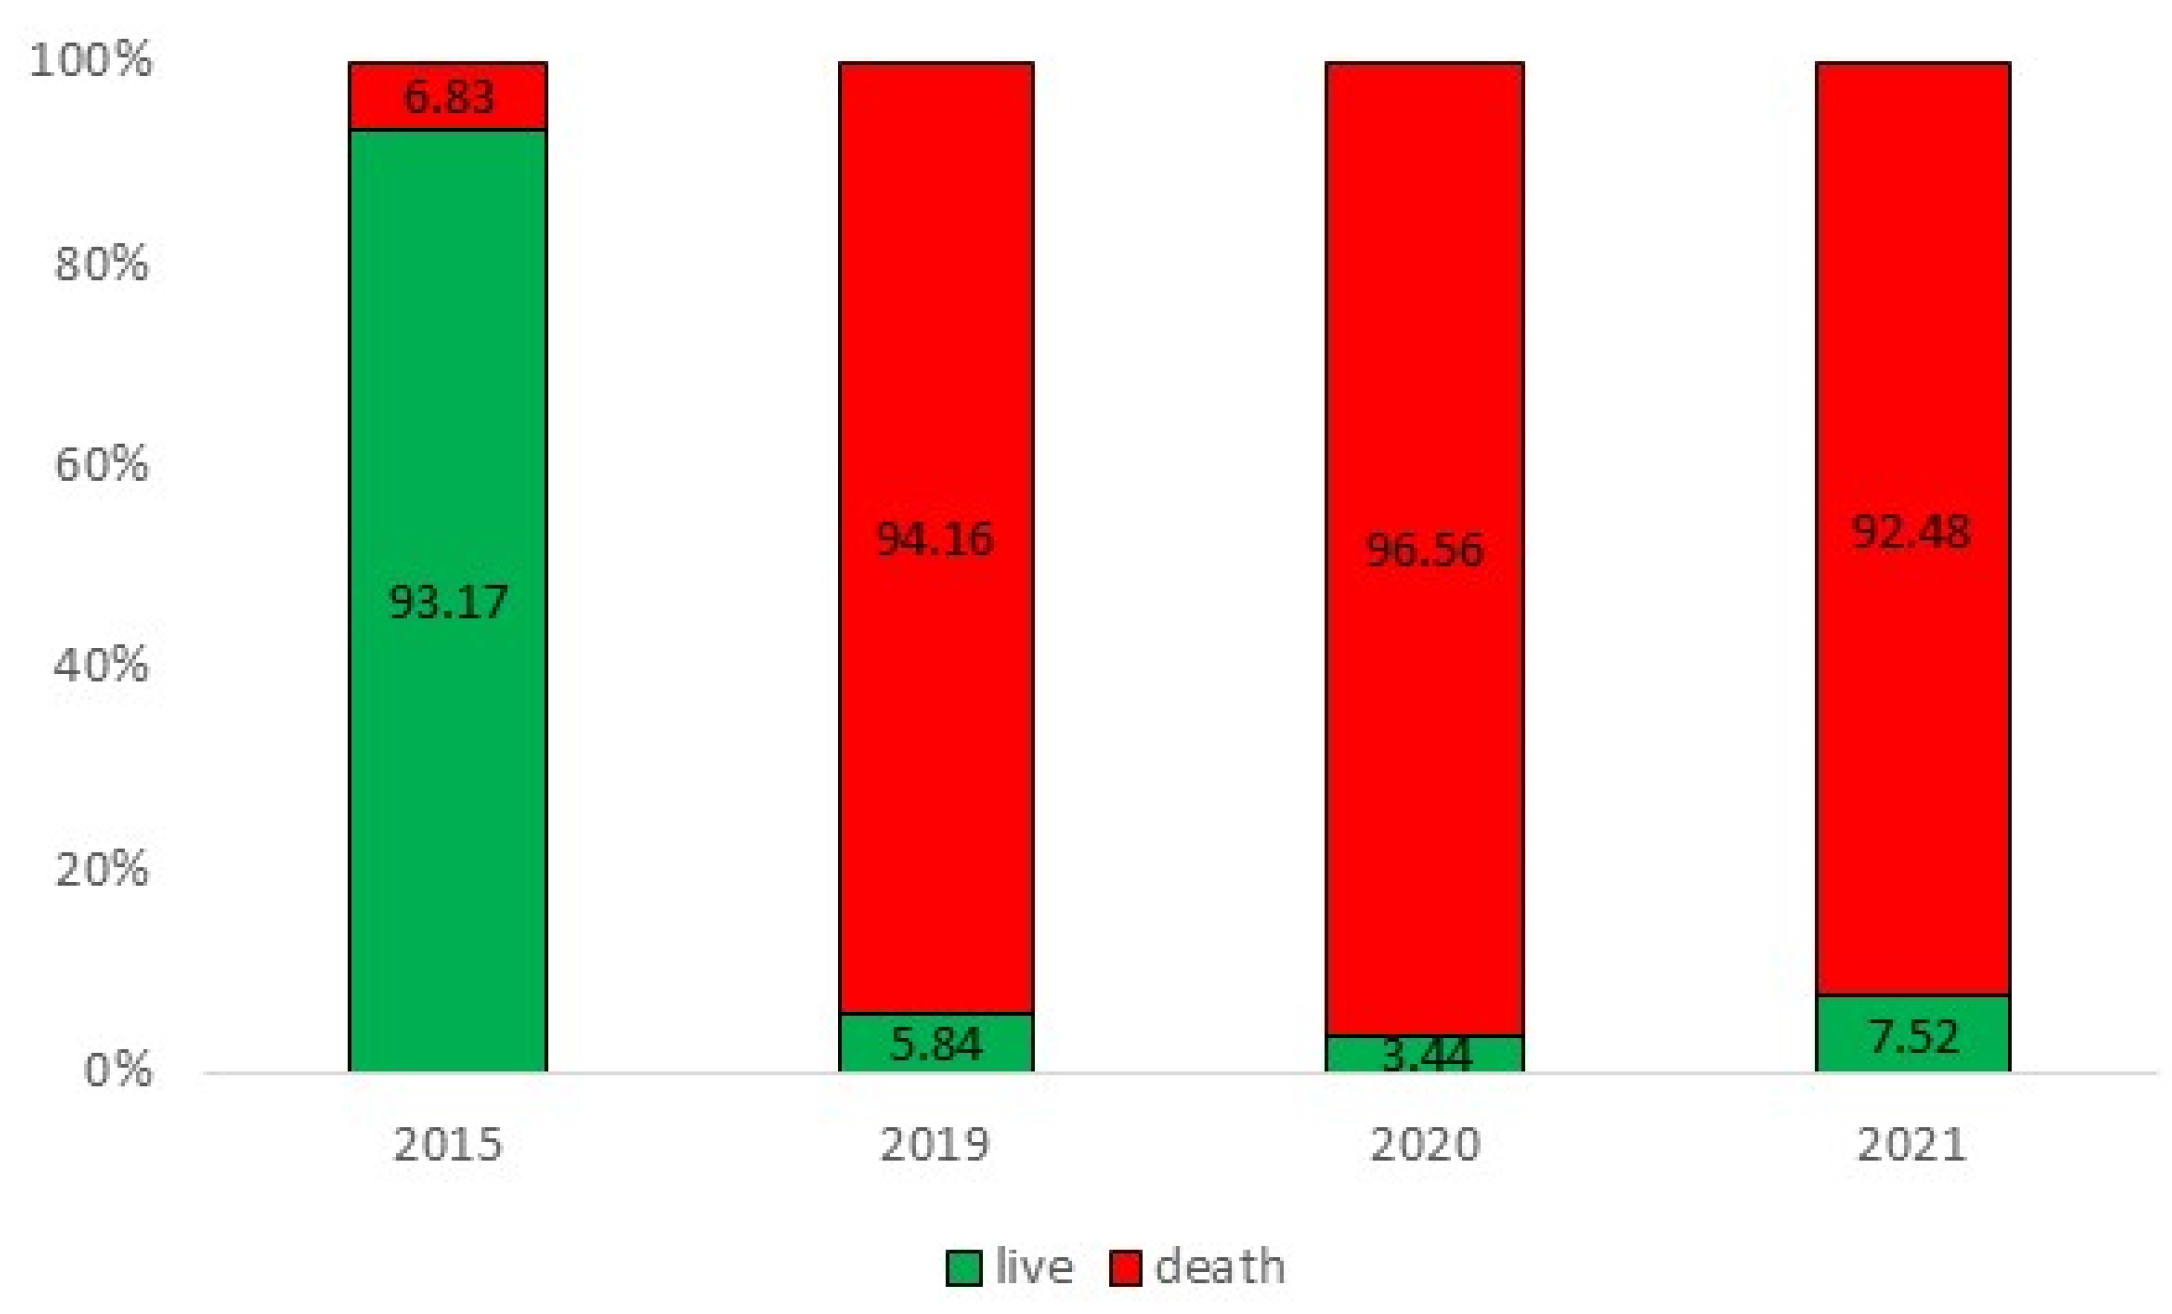
The basal area dominance of live trunks of mangrove species was 93.2% in 2015. After the extreme weather event, 94.2% and 96.6% of mangrove species trunks were dead (Figure 6 and Figure 7). The regressions show the change in the mangrove forest before and after the climate event (Figure 8).
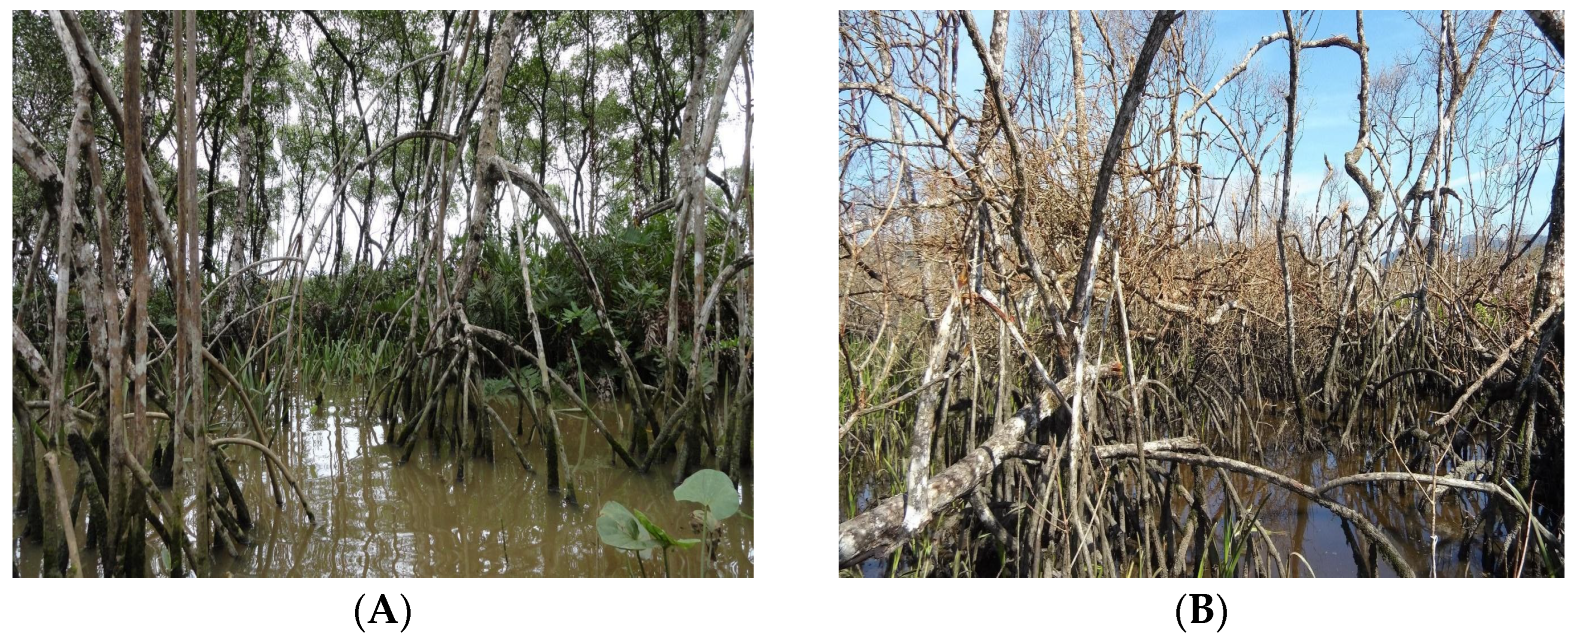
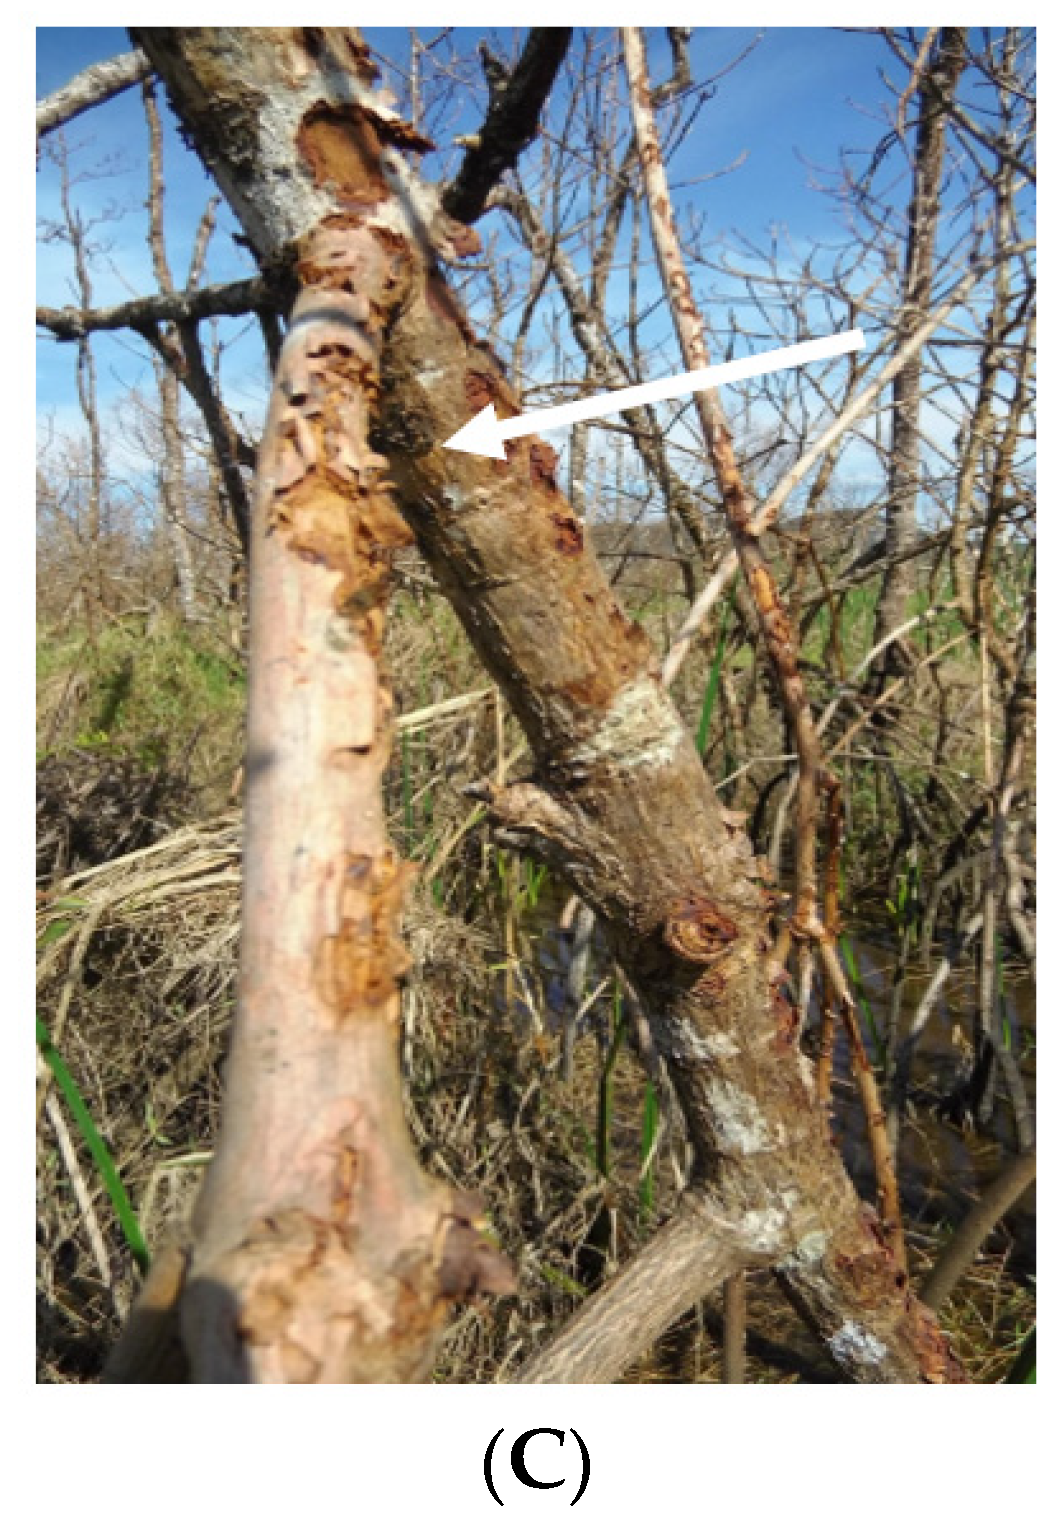
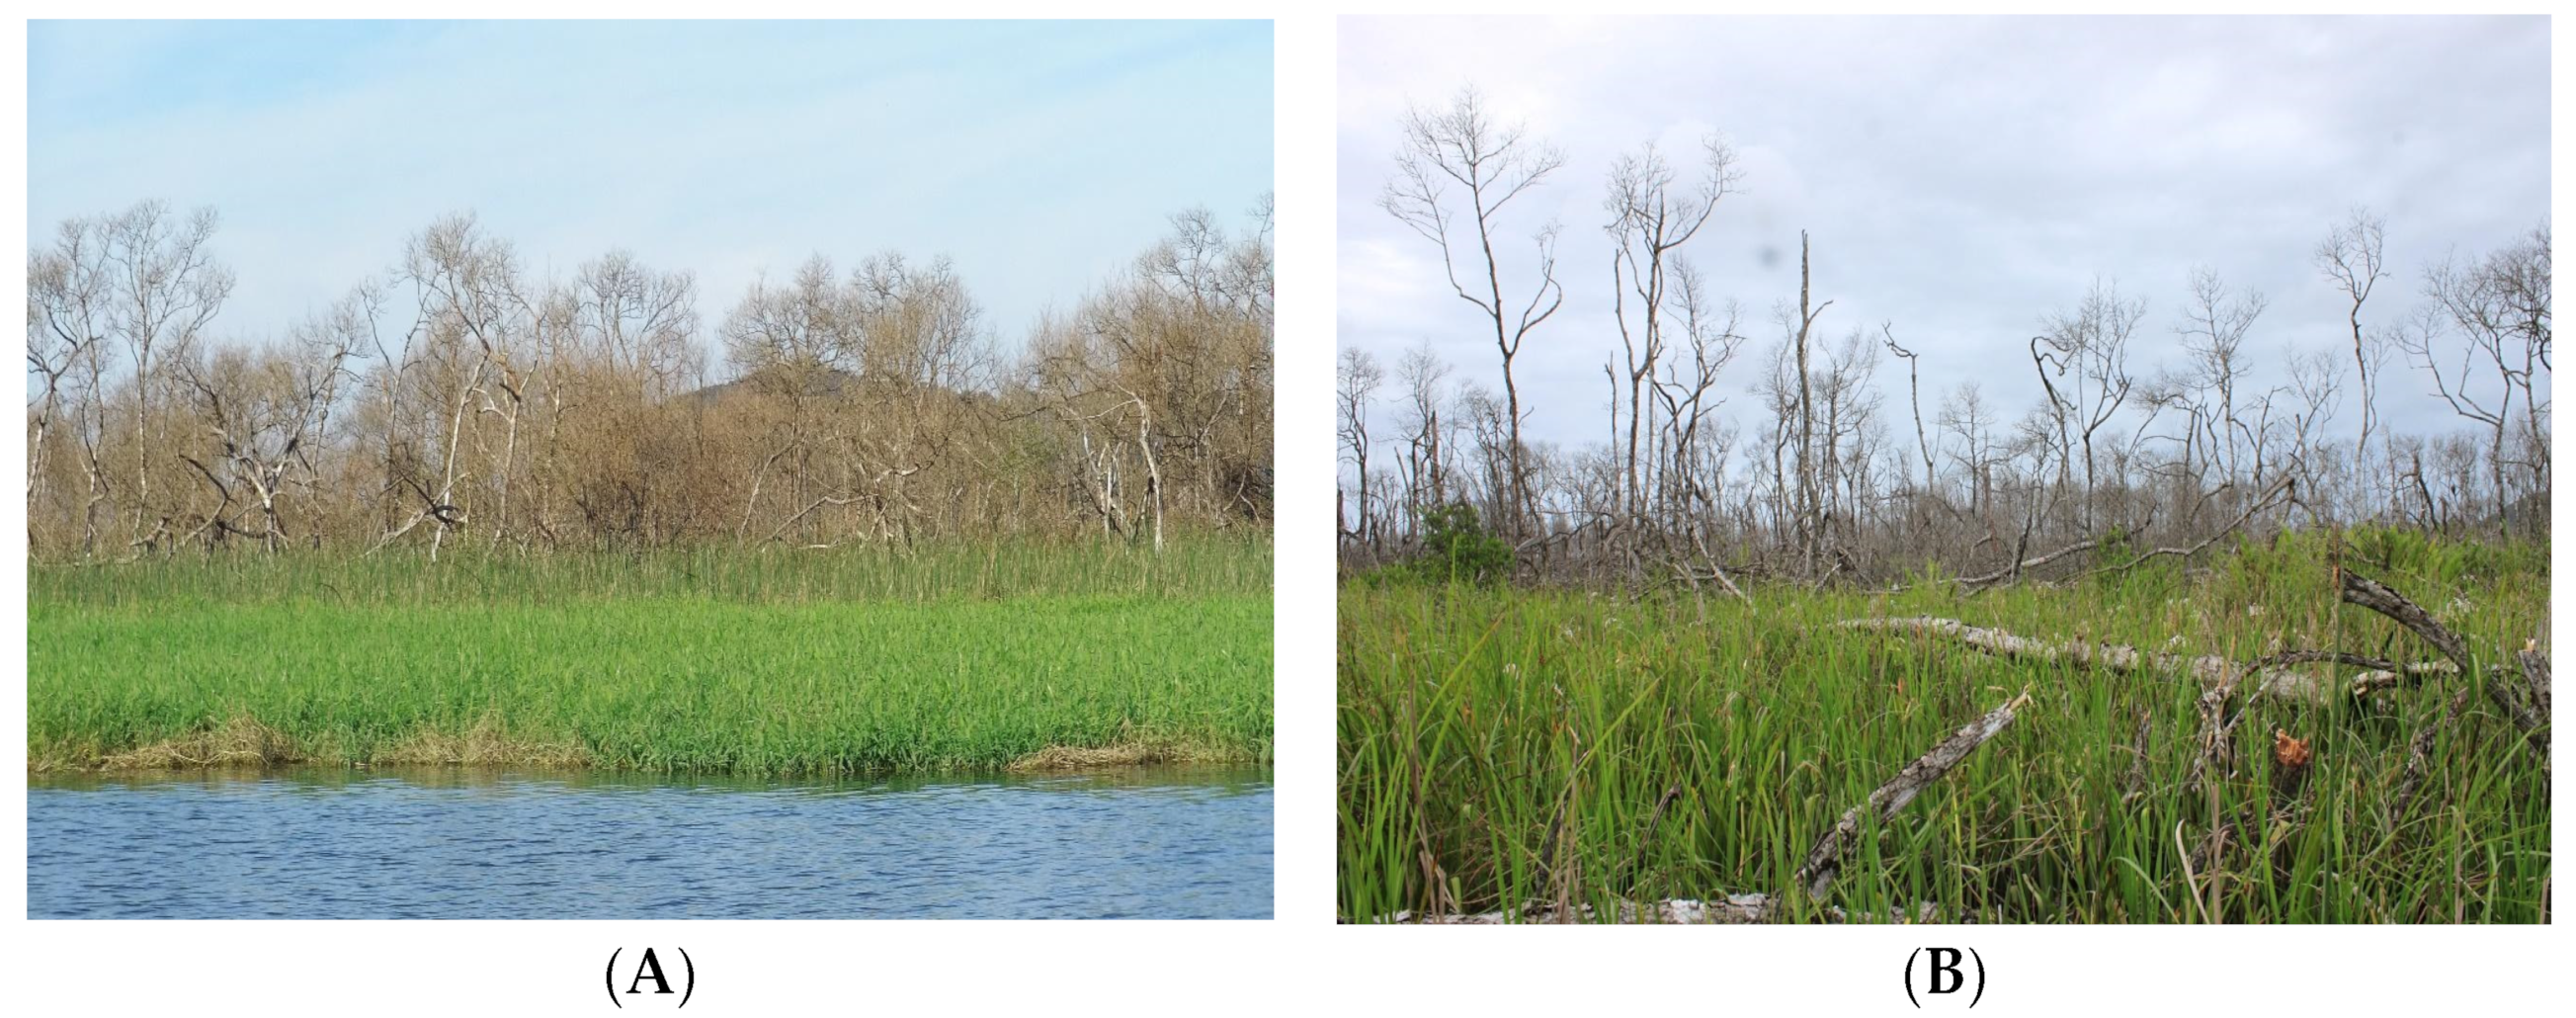
The extreme event caused defoliation, marks on mangrove tree trunks, and hail marks (Figure 9 and Figure 10).
In 2020, we counted 34 seedlings and saplings, 100% of which corresponded to R. mangle individuals, which may indicate the succession process and natural regeneration. However, in 2021, only eight seedlings of R. mangle were registered in the permanent plot, indicating the complex natural regeneration process in an affected site with an impact of this magnitude.

3.3. Remote Sensing

The average values of the NDVI and LAI indices for forest, mangrove, and water areas within a radius of 5 km from the micrometeorological tower were high and within the reference values on 25 May 2019 (Table 1). After the 14 June 2019 extreme weather event, the NDVI of the mangroves was reduced from 0.72 to 0.35, indicating an intense change in the canopy. The LAI confirms this premise, since there was a reduction from 4.25 to 0.63—a value similar to that found in natural pasture areas, indicating that only the macrophyte cover remained in place.
One year after the event, the NDVI was slightly increased due to mangrove vegetation. LAI increased from 0.63 to 0.91. In the forest areas, we identified recomposition with the increase in index vegetation values. Despite this, there was no recomposition of species in the affected mangrove areas. The study area was severely affected, with an increase of 891 ha (32%) in areas with NDVI values lower than 0.6, corresponding to areas with undergrowth and shrubby vegetation, corroborating the analysis of the area damaged by hail. On the other hand, in classes with NDVI values above 0.6, an area reduction equivalent to 15% (889 ha) occurred (Table 2). Between June 2019 and June 2020, there was a 7% increase in classes with NDVI values above 0.6.
More than 1000 ha presented with saturated LAI (>3.0) in May 2019, indicating a closed canopy, with a decrease in values in this class (Table 3).
The increase in areas with LAI values lower than 3.0 (unsaturated) was 1.390 ha (70%), also reflecting the damage suffered by forest areas. Analysis of LAI showed a 22% loss of leaf cover (IAF > 2), indicating that the event considerably affected the mangrove forest, as well as other vegetation in the area. There was an increase of 21% in areas with low leaf density (IAF < 1). Between June 2019 and June 2020, there was a recomposition of sites with LAI values greater than 3.0 of 827 ha, indicating the reestablishment of forest and an increase in the density of macrophytes in the affected mangrove areas.
To exemplify the presented values, Figure 11 and Figure 12 show a sequence of NDVI and LAI maps, respectively, for 25 May 2019, 14 June 2019, and 18 June 2019, highlighting Ilha dos Papagaios, where the micrometeorological tower is located.
In the map of the NDVI on 25 May 2019, a predominance of high values (higher than 0.6) is observed across almost the entire island where the microclimatic tower is located. However, on 14 June 2019, after the event, mainly near the microclimatic tower, the mangroves presented much lower NDVI values of between 0.2 and 0.4. There is no record of a class greater than 0.8 on that date. One year after the extreme weather event, on 18 June 2020, a recomposition of the NDVI is observed on the island but still with a marked presence of classes with NDVI values below 0.6.
It is noted that hail damage extended throughout the Ribeira de Iguape river valley, extending 8 to 10 km to the mouth of the Atlantic Ocean. When looking at the image of 18 June 2020, it is clear that areas under the effects of the impacts remain, especially where there were mangroves. In the June 2020 image, there is an area in the centre of the island of parrots with an LAI greater than 3.0, indicating a process of densification of mangrove species further away from the original site (Figure 12).

4. Discussion

The scale of damage caused by these disturbances varies considerably, from vast areas destroyed by hurricanes to single-tree incidents [13]. Recent events, such as the death of mangroves in Australia [5], suggest the growing importance of extreme climate mortality events and highlight mangroves can as sentinels of climate change [20]. In southeast Brazil, mangrove mortality was reported to be caused by drought events causing significant CO2 emissions [6].
The damage scale considers the percentage of the mangrove impacted by natural drivers (Table 4) [36].
However, the most common gaps in mangroves are small gaps comprising around 10 to 20 trees and are reputedly caused by lightning. The emergence of extreme natural events (including coastal erosion and climate events) presents an immediate challenge for coastal adaptation [1].
Damage caused by strong storms and hail damage is the cause of the severe impact in this mangrove area. The meteorological station installed in the mangrove since 2008 recorded a maximum gust of wind of 58 km·h−1 at 8 h 30 min a.m. on 30 May 2019. The equipment installed in the mangrove also suffered damage from the storm’s impact.
Red mangrove (R. mangle) dominated this area (84%) in 2015, with a basal area dominance of dead trunks of mangrove species of 23%. In 2019, after the storm damage, the basal area dominance of dead trunks of mangrove species was 93%. According to the classification of mangrove damage, the study area suffered a catastrophic impact, with more than 75% of trees fallen or broken [36]. This area will be monitored to assess the natural mangrove regeneration process.
The significant damage from the extreme weather event was concentrated near the Ribeira de Iguape River banks, directly affecting mangrove areas. We also observed the effects in areas covered by forest formations. Forests showed a reduction in NDVI value from 0.77 to 0.70 between 25 May and 14 June 2019, and LAI decreased to 3.56, indicating a significant loss of leaves without severe damage to the canopy. No significant changes were recorded in the indices calculated for water, which suggests that the event did not change these areas. After the climatic event, the storm caused a catastrophic impact on the mangrove, with more than 90% dead trunks. The reduction in the NDVI and LAI indices also proves this premise. This study indicates the vulnerability of mangroves, considering scenarios of increased extreme events.
Losses of mangroves can be attributed to multiple stressors on different scales, from localised threats of resource exploitation to global threats of climate change. In many cases, the impact can be enhanced when considering the sum of these phenomena. Research has been developed in the study area discussing the consequences of the accumulation of natural and anthropic impacts on mangrove forests due to human changes from the opening of the artificial canal in 1852 until today. The link between the Ribeira River and the coastal system through the artificial canal has led to significant environmental changes. The opening of this canal occurred between 1827 and 1852 and caused significant changes in salinity and sedimentation patterns, in addition to contributing heavy metals to the CICS [25]. The occurrence of aquatic macrophyte banks around and within mangrove forests alerts to environmental changes due to the reduction in salinity, leading to possible losses of mangrove ecosystem services [37,38]. In addition, the microclimate, which has been monitored since 2008, shows that climatic attribute variations can be interpreted as an indicator of changes in the structure on the edge and inside the mangrove, like the more significant solar radiation input into the forest over the years [27,28].
This situation of environmental change aligned with the impacts caused by the intense climatic event on the southeast coast of Brazil makes the mangrove swamp vulnerable, with an arduous recovery process. Although the entire forest was affected, some stretches have presented difficulty in recovery, reflecting the permanence of environmental conditions arising from the opening of the artificial canal. Therefore, governments need to implement legal frameworks that reduce the vulnerability of mangroves, which are considered essential for climate adaptation and mitigation. In light of their cumulative impact, climate change and anthropic action are fundamental, given the importance of mangrove ecosystem services. Some productive mangroves can recover the area, indicating enormous resilience, varying according to storm strength and environmental conditions [39]. Finally, it was found to be essential to maintain the good conservation status of the mangroves of the south coast of São Paulo and, consequently, of their ecosystem services, especially in the face of scenarios of a possible increase in the incidence of extreme weather events. Since the mangrove is essential both in terms of adaptation and mitigation and considering that Brazil is the second leading country in mangrove area, its adequate protection becomes even more urgent.

5. Conclusions

Extreme weather events have been occurring along coastal areas, drastically altering the landscape. Mangroves have been affected by these events, and depending on the health condition of the forests, they can recover naturally. Otherwise, if they are affected by human activities, they may scarcely recover and stop providing their ecosystem services to protect the coastal zone.
Our study exemplifies how climate events have affected mangrove forests and how natural recovery can be difficult for more than three years. This process can be even more time-consuming or even unfeasible, especially when there are anthropogenic changes in the sector. A climate event affected the mangrove forest in southeast São Paulo state with wind gusts and hail, eliminating more than 94% of individuals of mangrove forests in the study area.
The sue of a multiproxy approach including analyses of climatic attributes, structural vegetation in a permanent plot, and vegetation indices with remote sensing to evaluate these impacts proved suitable for this assessment. This analysis contributes to a more detailed understanding of the event and its impacts. Remote sensing provided details of how the storm impacted the landscape. The limitation of permanent plots allowed for analysis of the impact of vegetation cover, whereas the characterization of the extreme weather event allowed for a better understanding of the phenomenon on a regional scale and its impact on a local scale.

Author Contributions

Conceptualization, M.C.-L. and N.L.; methodology, M.C.-L., N.L., A.M., G.A. and E.G.; software, A.M.; validation, M.C.-L., N.L., A.M., G.A. and E.G.; formal analysis, M.C.-L., N.L., A.M., G.A. and E.G.; investigation, M.C.-L., N.L., A.M., G.A. and E.G.; resources, M.C.-L. and E.G.; data curation, M.C.-L. and N.L.; writing—original draft preparation, M.C.-L. and N.L.; writing—review and editing, M.C.-L. and N.L.; visualisation, N.L. and M.C.-L.; supervision, N.L. and M.C.-L.; project administration, M.C.-L. and N.L.; funding acquisition, M.C.-L. and E.G. All authors have read and agreed to the published version of the manuscript.

Funding

This study was supported by the Conselho Nacional de Desenvolvimento Científico e Tecnológico CNPq—Brazil (Projects 482819/2013-8 and 445418/2014-1) and the Fundação Grupo O Boticário (Project BL0006_2012_1). We especially thank CNPq for research grant 303676/2013-2.

Institutional Review Board Statement

Not applicable.

Informed Consent Statement

Not applicable.

Data Availability Statement

The original data referring to the research will be available on the website of the Laboratory of Climatology and Biogeography of the University of São Paulo (https://lcb.fflch.usp.br).

Acknowledgments

We would like to thank the Instituto Chico Mendes de Conservação da Biodiversidade (ICMBio—Brazil) for authorising this research at the Cananeia-Iguape-Peruíbe Protection Area (Process 37339). We thank fieldwork team members Ana Lucia Gomes dos Santos, Beatriz Eiko Kitagami, Carla dos Anjos Marchi, Israel de Souza, Jaqueline de Lima Perucello, Letícia Teixeira Cordeiro, Luciana Nascimento, Marina Paixão Gil, and Rogério Rozolen Alves, who participated in 2015, 2019, 2020, 2021 and 2022.

Conflicts of Interest

The authors declare no conflict of interest.

References

  1. Goldberg, L.; Lagomasino, D.; Thomas, N.; Fatoyinbo, T. Global declines in human-driven mangrove loss. Glob. Chang. Biol. 2020, 26, 5844–5855. [Google Scholar] [CrossRef] [PubMed]
  2. Jahfer, S.; Vinayachandran, P.N.; Nanjundiah, R.S. Long-term impact of Amazon River runoff on northern hemispheric climate. Sci. Rep. 2017, 7, 10989. [Google Scholar] [CrossRef] [PubMed] [Green Version]
  3. Friess, D.A.; Rogers, K.; Lovelock, C.E.; Krauss, K.W.; Hamilton, S.E.; Lee, S.Y.; Lucas, R.; Primavera, J.; Rajkaran, A.; Shi, S. The State of the World’s Mangrove Forests: Past, Present, and Future. Annu. Rev. Environ. Resour. 2019, 44, 89–115. [Google Scholar] [CrossRef] [Green Version]
  4. Lovelock, C.E.; Cahoon, D.R.; Friess, D.A.; Guntenspergen, G.R.; Krauss, K.W.; Reef, R.; Rogers, K.; Saunders, M.L.; Sidik, F.; Swales, A.; et al. The vulnerability of Indo-Pacific mangrove forests to sea-level rise. Nature 2015, 526, 559–563. [Google Scholar] [CrossRef] [PubMed] [Green Version]
  5. Duke, N.C.; Kovacs, J.M.; Griffiths, A.D.; Preece, L.; Hill, D.J.E.; van Oosterzee, P.; Mackenzie, J.; Morning, H.S.; Burrows, D. Large-scale dieback of mangroves in Australia’s Gulf of Carpentaria: A severe ecosystem response, coincidental with an unusually extreme weather event. Mar. Freshw. Res. 2017, 68, 1816–1829. [Google Scholar] [CrossRef]
  6. Gomes, L.E.d.O.; Sanders, C.J.; Nobrega, G.N.; Vescovi, L.C.; Queiroz, H.M.; Kauffman, J.B.; Ferreira, T.O.; Bernardino, A.F. Ecosystem carbon losses following a climate-induced mangrove mortality in Brazil. J. Environ. Manag. 2021, 297, 113381. [Google Scholar] [CrossRef]
  7. McKee, K.; Rogers, K.; Saintilan, N. Response of Salt Marsh and Mangrove Wetlands to Changes in Atmospheric CO2, Climate, and Sea Level. In Global Change and the Function and Distribution of Wetlands; Global Change Ecology and Wetlands; Springer: Dordrecht, The Netherlands, 2012; pp. 63–96. [Google Scholar] [CrossRef]
  8. Ellison, J.C.; Zouh, I. Vulnerability to Climate Change of Mangroves: Assessment from Cameroon, Central Africa. Biology 2012, 1, 617–638. [Google Scholar] [CrossRef] [Green Version]
  9. Osland, M.J.; Day, R.H.; From, A.S.; McCoy, M.L.; McLeod, J.L.; Kelleway, J.J. Life stage influences the resistance and resilience of black mangrove forests to winter climate extremes. Ecosphere 2015, 6, art160. [Google Scholar] [CrossRef] [Green Version]
  10. Ward, R.D.; Friess, D.A.; Day, R.H.; MacKenzie, R.A. Impacts of climate change on mangrove ecosystems: A region by region overview. Ecosyst. Health Sustain. 2016, 2, e01211. [Google Scholar] [CrossRef] [Green Version]
  11. Duke, N.C.; Meynecke, J.-O.; Dittmann, S.; Ellison, A.M.; Anger, K.; Berger, U.; Cannicci, S.; Diele, K.; Ewel, K.C.; Field, C.D.; et al. A World Without Mangroves. Science 2007, 317, 41–42. [Google Scholar] [CrossRef] [Green Version]
  12. Friess, D.A.; Yando, E.S.; Alemu, J.B.; Wong, L.W.; Soto, S.D.; Bhatia, N. Ecosystem services and disservices of mangrove forests and salt marshes. Oceanogr. Mar. Biol. Annu. Rev. 2020, 58, 107–142. [Google Scholar]
  13. Duke, N. Gap creation and regenerative processes driving diversity and structure of mangrove ecosystems. Wetl. Ecol. Manag. 2001, 9, 267–279. [Google Scholar] [CrossRef]
  14. Sandilyan, S.; Kathiresan, K. Mangrove conservation: A global perspective. Biodivers. Conserv. 2012, 21, 3523–3542. [Google Scholar] [CrossRef]
  15. McIvor, A.L.; Spencer, T.; Möller, I.; Spalding, M. Storm Surge Reduction by Mangroves; NCP Report 2012-02; The Nature Conservancy and Wetlands International: Wageningen, The Netherlands, 2012. [Google Scholar]
  16. Das, S.; Crépin, A.-S. Mangroves can provide protection against wind damage during storms. Estuar. Coast. Shelf Sci. 2013, 134, 98–107. [Google Scholar] [CrossRef]
  17. Marois, D.E.; Mitsch, W.J. Coastal protection from tsunamis and cyclones provided by mangrove wetlands—A review. Int. J. Biodivers. Sci. Ecosyst. Serv. Manag. 2015, 11, 71–83. [Google Scholar] [CrossRef]
  18. Villamayor, B.M.R.; Rollon, R.N.; Samson, M.S.; Albano, G.M.G.; Primavera, J.H. Impact of Haiyan on Philippine mangroves: Implications to the fate of the widespread monospecific Rhizophora plantations against strong typhoons. Ocean Coast. Manag. 2016, 132, 1–14. [Google Scholar] [CrossRef]
  19. Osland, M.J.; Feher, L.C.; Griffith, K.T.; Cavanaugh, K.C.; Enwright, N.M.; Day, R.H.; Stagg, C.L.; Krauss, K.W.; Howard, R.J.; Grace, J.B.; et al. Climatic controls on the global distribution, abundance, and species richness of mangrove forests. Ecol. Monogr. 2017, 87, 341–359. [Google Scholar] [CrossRef] [Green Version]
  20. Sippo, J.Z.; Lovelock, C.E.; Santos, I.R.; Sanders, C.J.; Maher, D.T. Mangrove mortality in a changing climate: An overview. Estuar. Coast. Shelf Sci. 2018, 215, 241–249. [Google Scholar] [CrossRef]
  21. Duke, N.C.; Field, C.; MacKenzie, J.R.; Meynecke, J.-O.; Wood, A.L. Rainfall and its possible hysteresis effect on the proportional cover of tropical tidal-wetland mangroves and saltmarsh–saltpans. Mar. Freshw. Res. 2019, 70, 1047. [Google Scholar] [CrossRef]
  22. Abhik, S.; Hope, P.; Hendon, H.H.; Hutley, L.B.; Johnson, S.; Drosdowsky, W.; Brown, J.R.; Duke, N.C. Influence of the 2015–2016 El Niño on the record-breaking mangrove dieback along northern Australia coast. Sci. Rep. 2021, 11, 20411. [Google Scholar] [CrossRef]
  23. Ramsar. Sites Information Service. 2017. Available online: https://www.ramsar.org/wetland/brazil (accessed on 19 April 2023).
  24. Vasquez, M.O.; Cunha-Lignon, M. Mangrove monitoring using a multi-temporal analysis of satellite imagery on the Cana-néia-Iguape Coastal System (BRAZIL). In SEMANGLARES IV: Curso? Seminario Nacional de Estuarios y Manglares, Eco-Sistemas de Manglar Para el Bienestar Humano en un Entorno Cambiante; Boletín del Postgrado en Ciencias-Biología; Universidad Nacional de Colombia: Bogotá, Colombia, 2021; Volume 9, p. 51. [Google Scholar]
  25. De Mahiques, M.M.; Burone, L.; Figueira, R.C.L.; Lavenére-Wanderley, A.A.d.O.; Capellari, B.; Rogacheski, C.E.; Barroso, C.P.; dos Santos, L.A.S.; Cordero, L.M.; Cussioli, M.C. Anthropogenic influences in a lagoonal environment: A multiproxy approach at the valo grande mouth, Cananéia-Iguape system (SE Brazil). Braz. J. Oceanogr. 2009, 57, 325–337. [Google Scholar] [CrossRef]
  26. Cunha-Lignon, M.; Kampel, M.; Menghini, R.P.; Schaeffer-Novelly, Y.; Cintrón, G.; Dahdouh-Guebas, F. Mangrove Forests Submitted to Depositional Processes and Salinity Variation Investigated using satellite images and vegetation structure surveys. J. Coast. Res. 2011, I, 344–348. [Google Scholar]
  27. Lima, N.G.B.; Galvani, E. Interaction of climatic attributes in the mangroves of the south coast of São Paulo and their relation with climatic controls. CONFINS 2018, 1, 1–23. [Google Scholar]
  28. De Lima, N.G.B.; Cunha-Lignon, M.; Galvani, E. Microclimatic analysis of mangroves in two distinct categories of Protected Areas and conserved status. Soc. Nat. 2021, 33, 1–16. [Google Scholar] [CrossRef]
  29. Schaeffer-Novelli, Y.; Vale, C.C.; Cintrón, G. Monitoramento do Ecossistema Manguezal: Estrutura e características funcionais. In Protocolos de Campo para o Monitoramento de Habitats Bentônicos Costeiros. Rede de Monitoramento de Habitats Bentônicos Costeiros—ReBentos; Turra, A., Dedanai, M.R., Eds.; IOUSP: São Paulo, Brazil, 2015; pp. 65–83. [Google Scholar] [CrossRef]
  30. Deering, D.W. Measuring “forage production” of grazing units from Landsat MSS data. In Proceedings of the 10th International Symposium on Remote Sensing of Environment, Ann Arbor, MI, USA, 6 October 1975; Volume 2, pp. 1169–1178. [Google Scholar]
  31. Rondeaux, G.; Steven, M.; Baret, F. Optimization of soil-adjusted vegetation indices. Remote Sens. Environ. 1996, 55, 95–107. [Google Scholar] [CrossRef]
  32. Allen, R.G.; Tasumi, M.; Trezza, R. SEBAL (Surface Energy Balance Algorithms for Land) Advanced Training and Users Manual—Idaho Implementation; Idaho University: Moscow, ID, USA, 2002; 98p. [Google Scholar]
  33. Instituto Nacional de Meteorologia—INMET. It Presents Weather Forecast Data and Climate Studies of Brazil. Available online: https://portal.inmet.gov.br (accessed on 10 December 2019).
  34. Centro de Previsão de Tempo e Estudos Climáticos—CPTEC/INPE. It Presents Weather Forecast Data and Climate Studies of Brazil. Available online: http://www.cptec.inpe.br (accessed on 22 December 2020).
  35. De Lima, N.G.B.; Galvani, E.; Falcão, R.M.; Cunha-Lignon, M. Air temperature and canopy cover of impacted and conserved mangrove ecosystems: A study of a subtropical estuary in Brazil. J. Coast. Res. 2013, 165, 1152–1157. [Google Scholar] [CrossRef]
  36. Smith, T.J., III; Roblee, M.B.; Wanless, H.R.; Doyle, T.W. Mangroves, hurricanes, and lightning strikes. BioScience 1994, 44, 256–262. [Google Scholar] [CrossRef]
  37. Cunha-Lignon, M.; Almeida, R.; Lima, N.G.B.; Galvani, E.; Menghini, R.P.; Coelho, C., Jr.; Schaeffer-Novelli, Y. Monitoramento de manguezais: Abordagem integrada frente às alterações ambientais. Anais. In Proceedings of theVIII Congresso Brasileiro de Unidades de Conservação—Fundação Grupo Boticário—Trabalhos Técnicos, Curitiba, Brazil, 21–25 September 2015; pp. 1–17. Available online: https://eventos.fundacaogrupoboticario.org.br/VIIICBUC (accessed on 1 June 2023).
  38. Cunha-Lignon, M.; Lima, N.G.B. Health Status of the Mangrove Forest on the Southeastern Coast of the State of São Paulo (Brazil): From the Bottom (Soil Salinity and Vegetation Biomass) to Upwards (Canopy). In Book of Abstracts—VLIZ Marine Science Day; Vlaams Instituut voor de Zee—Flanders Marine Institute (VLIZ): Oostende, Belgium, 2021; Volume 85, pp. 40–41. [Google Scholar]
  39. Castañeda-Moya, E.; Lagomasino, D.; Kominoski, J.; Troxler, T.; Sah, J. Effects of hurricane Irma on mangrove forest structure in the florida everglades, USA. Investigatio 2022, 17, 121–123. [Google Scholar]
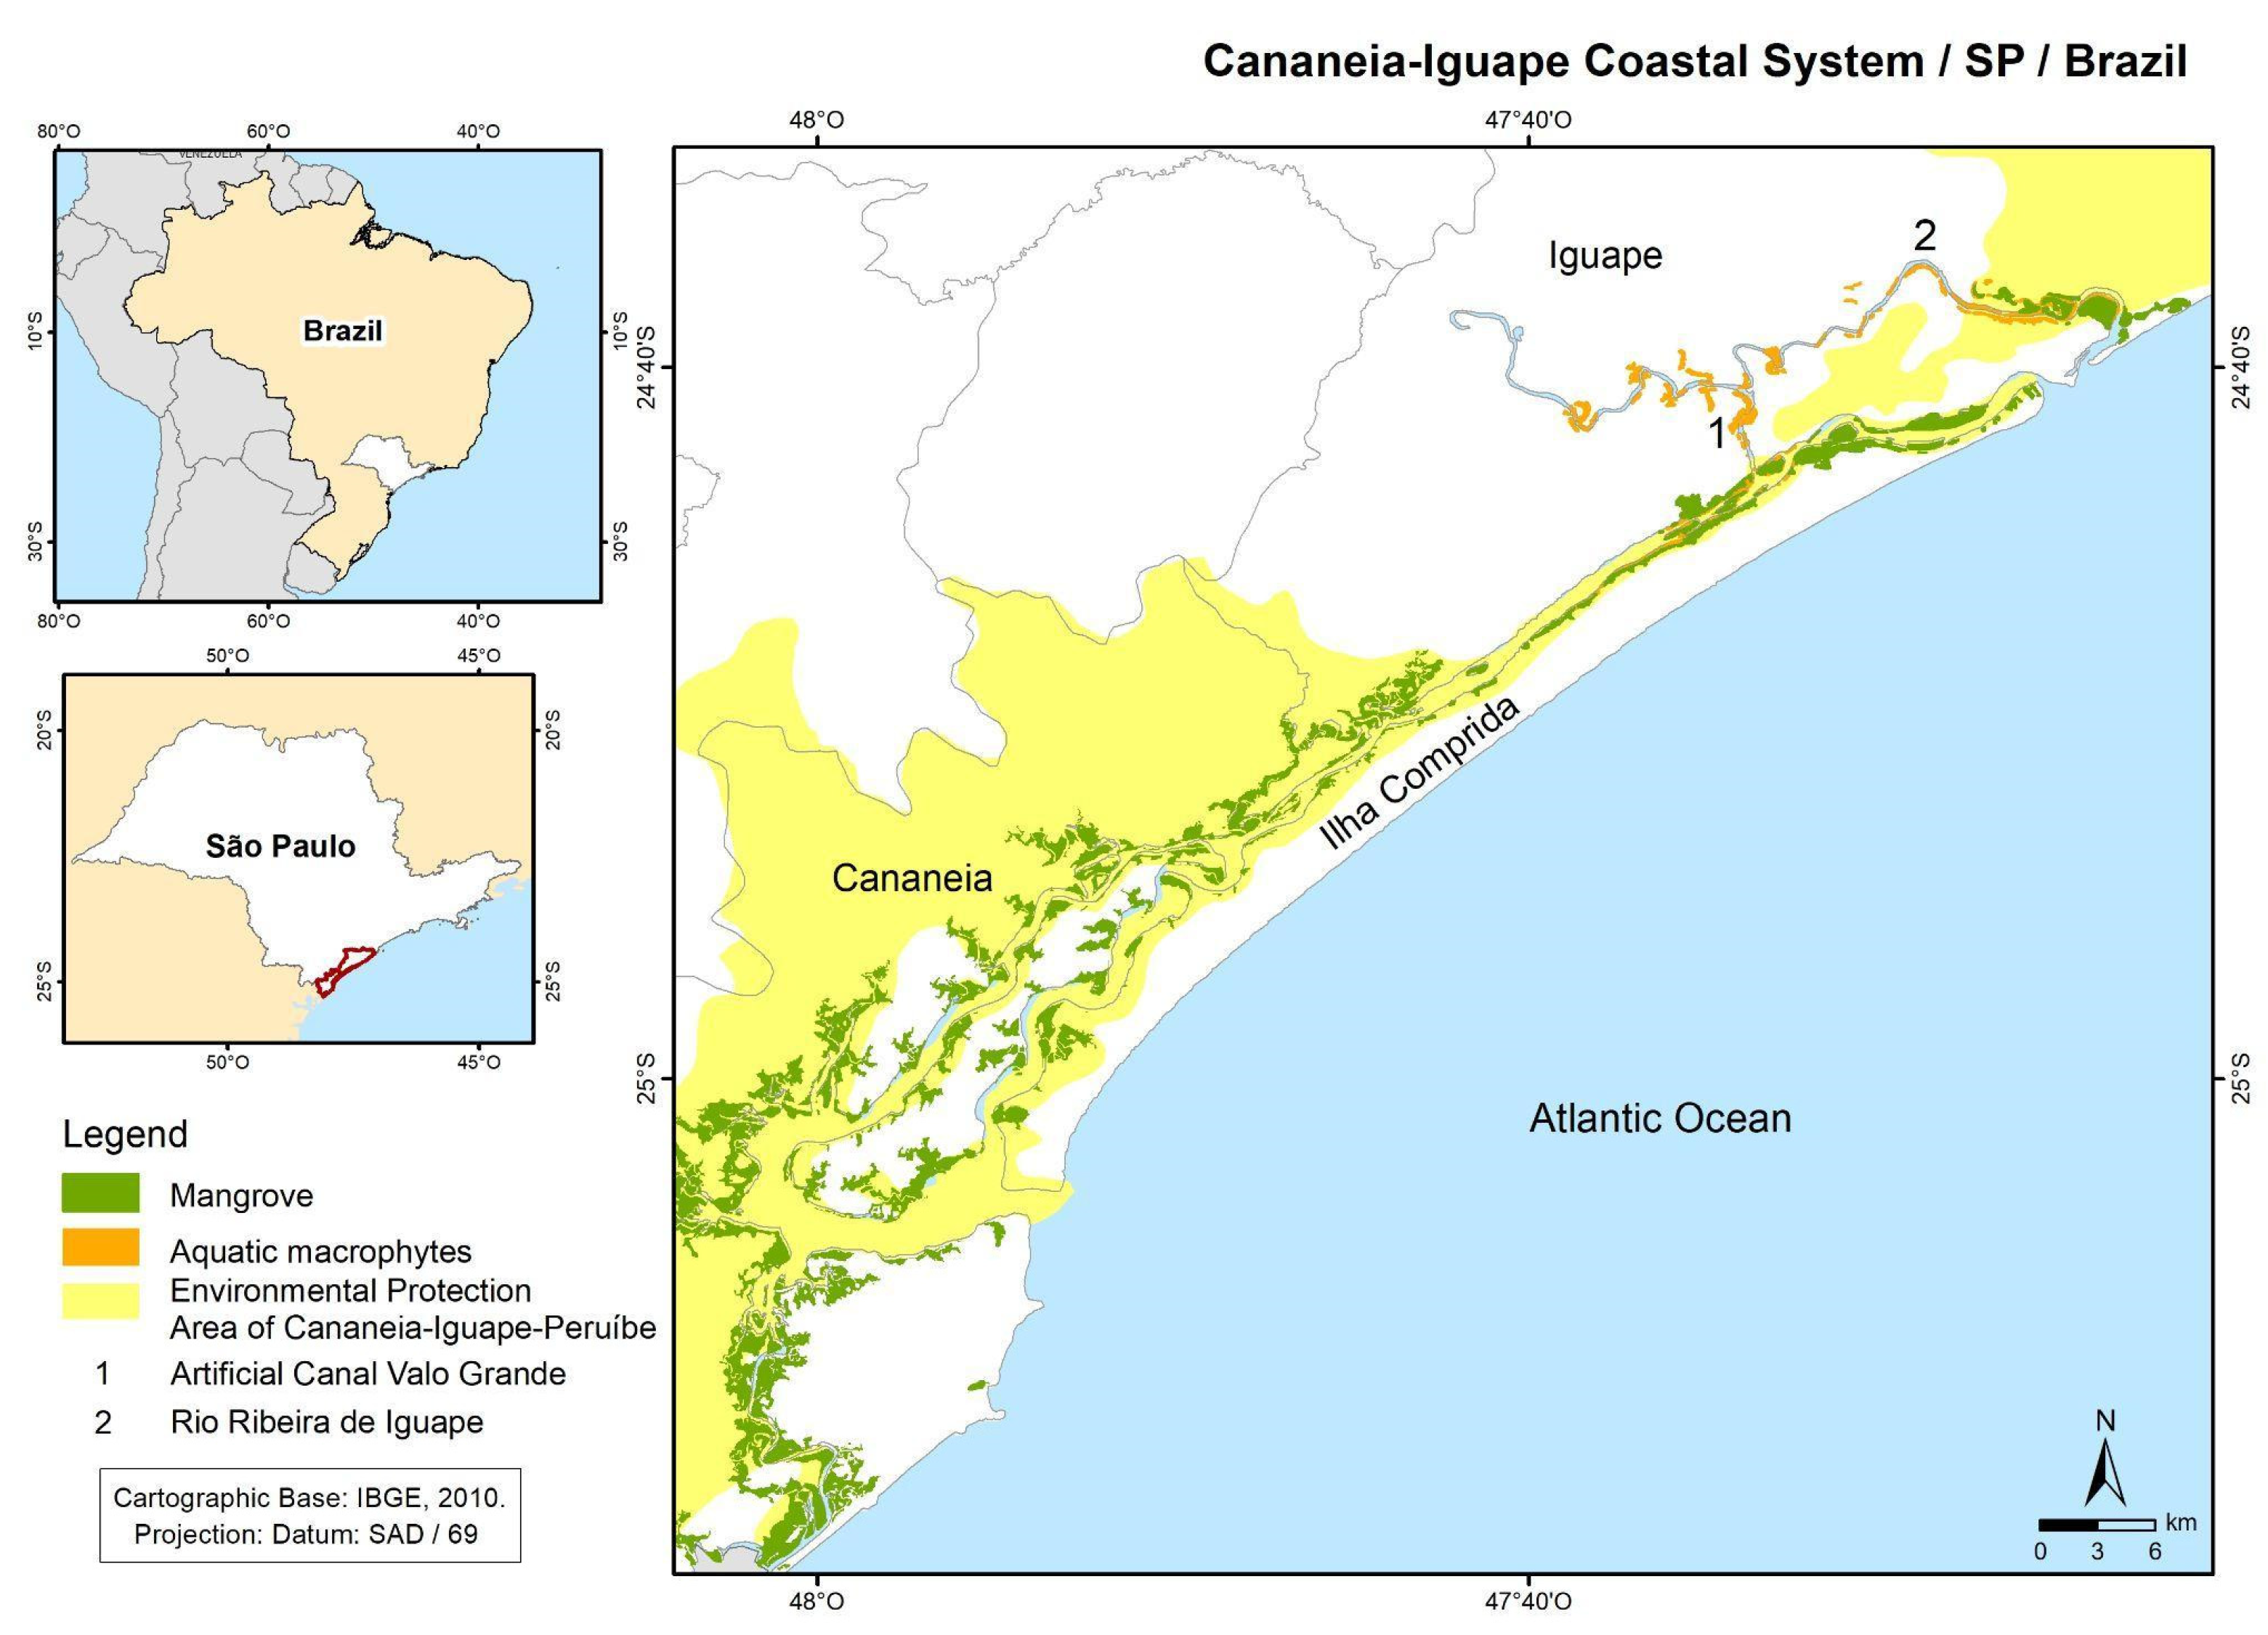
Figure 1. Location of the Cananéia-Iguape Coastal System in Southeast Brazil, as well as the mangroves and macrophytes.
Atmosphere 14 01195 g001
Figure 2. Surface pressure charts for 29 and 30 May 2019 at 00Z [34].
Atmosphere 14 01195 g002
Figure 3. Visible image (a) and enhanced image (b) for 30 May 2019 at 8:30 a.m. The meteorological tower is indicated as a red circle [34].
Atmosphere 14 01195 g003
Figure 4. Variation of climatic attributes (air temperature, atmospheric pressure, precipitation, average speed, and maximum wind gust) from 28 to 30 May 2019 at the Iguape/SP meteorological station.
Atmosphere 14 01195 g004
Figure 5. Variation of climatic attributes (air temperature, maximum wind gust, and global solar radiation) from 28 to 30 May 2019 at the microclimatic station installed in the mangrove.
Atmosphere 14 01195 g005
Figure 6. Basal area dominance of live and dead trunks per species in 2015, 2019, 2020, and 2021. Rh: Rhizophora mangle; Lg: Laguncularia racemosa.
Atmosphere 14 01195 g006
Figure 7. Basal area dominance of live and dead trunks in 2015, 2019, 2020, and 2021.
Atmosphere 14 01195 g007
Figure 8. Regression of height and diameter at breast height (DBH) of trees monitored in the permanent plot before and after the climate event.
Atmosphere 14 01195 g008
Figure 9. Monitored mangrove forest in 2015 (A), after the extreme event in 2019 (B), and hail marks on dead trunks of Rhizophora mangle (C). Photos: Marília Cunha-Ligon.
Atmosphere 14 01195 g009aAtmosphere 14 01195 g009b
Figure 10. General view of the monitored mangrove forest in July 2019 (A), after the extreme event, and in December 2020 (B). Photos: Marília Cunha-Lignon.
Atmosphere 14 01195 g010
Figure 11. NDVI maps indicating the study site before (May 2019) and after (June 2019 and June 2020) the extreme weather event.
Atmosphere 14 01195 g011
Figure 12. LAI maps indicating the study site before (May 2019) and after (June 2019 and June 2020) the climate event.
Atmosphere 14 01195 g012
Table 1. Normalized difference vegetation index (NDVI) and leaf area indices (LAI) calculated within a radius of 5 km from the micrometeorological tower on 25 May 2019, 14 June 2019, and 18 June 2020. Optimized soil-adjusted vegetation index (OSAVI).
DataClassNDVI/OSAVILAI
25 May 2019Mangrove0.724.25
Forest0.774.25
Water−0.35−0.62
14 June 2019Mangrove0.350.63
Forest0.703.56
Water−0.35−0.62
18 June 2020Mangrove0.400.91
Forest0.734.61
Table 2. NDVI values calculated for 25 May 2019, 14 June 2019, and 18 June 2020.
NDVI/OSAVI
Class
Area (ha)
25 May 2019
Area (ha)
14 June 2019
Area (ha)
Difference
25 May–14 June 2019
Area (ha)
18 June 2020
<0.01.2821.29191.271
0.0–0.211613115157
0.2–0.4144368224307
0.4–0.6310953643544
0.6–0.85.6145.110−5045.509
0.8–1.03905−38570
Table 3. LAI values calculated for 25 May 2019, 14 June 2019, and 18 June 2020.
LAI ClassArea (ha)
25 May 2019
Area (ha)
14 June 2019
Area (ha)
Difference
Area (ha)
18 June 2020
>0.01.3421.359171.365
0.0–0.512821587202
0.5–1.0140400260294
1.0–1.5134355221220
1.5–2.0100372272182
2.0–2.582371289155
2.5–3.070314244139
>3.05.5624.473−1.0895.300
Table 4. Damage scales [36].
Level Condition
None or partialLess than 25% leaf loss
Major25–50% defoliation, some loss of branches, and scattered fallen trees
SevereMore than 75% defoliation, some fallen trees
TotalMore than 50% of trees down
CatastrophicMore than 75% of trees fallen or broken
Disclaimer/Publisher’s Note: The statements, opinions and data contained in all publications are solely those of the individual author(s) and contributor(s) and not of MDPI and/or the editor(s). MDPI and/or the editor(s) disclaim responsibility for any injury to people or property resulting from any ideas, methods, instructions or products referred to in the content.