Article

Assessment of Cloud Resources and Potential for Rain Enhancement: Case Study—Minas Girais State, Brazil

1
Hail Suppression Research Center “Antigrad”, 198 Chernishevsky Street, Nalchik 360004, Russia
2
Agency of Atmospheric Technologies, Novoslobodskaya, 3, Moscow 127030, Russia
3
Unit for Environmental Sciences and Management, Faculty of Environmental Sciences, North-West University, Potchefstroom 2531, South Africa
4
National Center of Meteorology, Abu Dhabi P.O. Box 4815, United Arab Emirates
5
Faculty of Environmental Sciences, National University of Architecture and Construction of Armenia Foundation, Teryan 105, Yerevan 0009, Armenia
6
S.C. Intervenții Active în Atmosferă S.A., 031827 Bucharest, Romania
7
Stroyproject, Budapest 68 Str., 1202 Sofia, Bulgaria
*
Author to whom correspondence should be addressed.
Atmosphere 2023, 14(8), 1227; https://doi.org/10.3390/atmos14081227
Submission received: 5 June 2023 / Revised: 14 July 2023 / Accepted: 18 July 2023 / Published: 30 July 2023
(This article belongs to the Section Meteorology)

Abstract

:
Water scarcity due to rainfall variability, and exacerbated by climate change, is prevalent in many regions of the world. Lack of precipitation and excessive water extraction contribute to the intensification of the problem. Among different mitigation measures, rain enhancement through cloud seeding could be a tool as part of a water management strategy to replenish ground water sources. However, implementation of this technology requires proper preliminary analysis of the available cloud data and specific meteorological conditions under which rainfall forms. The aim of this paper is to assess the potential of for rain enhancement in Minas Gerais State in Brazil. The paper focuses on analysis of multiyear climate reanalysis ERA-5, upper air sounding, weather radar and ground stations data. Analysis showed that, between 2000 and 2019, precipitation declined on average by 212 mm per annum or 21% compared to the long term climatological mean. The natural precipitation, however, remains sufficiently high to implement weather modification technology. Assuming an increase of 15–20% could be achieved on a catchment area basis, the increases would be significant and could offset the recently observed decline in natural precipitation. The methodology proposed in this study can be used as a baseline for similar analysis in other vulnerable regions of the world experiencing freshwater shortages or declines. Its shortcomings and uncertainties are also discussed.

1. Introduction

Over the past decades, water scarcity has become prevalent in many regions of the world. Climate change and the increasing demand for freshwater due to recent population growth and urbanization are recognized as a key challenge to sustainable development [1]. As water is key to life, water scarcity is likely to provoke social unrest and conflicts within and between countries [2,3,4]. Fresh water reserves in lakes, rivers and underground sources are being depleted due to poor water management practices and in many places and the lack of precipitation [5]. Conventional water resources such as atmospheric precipitation, river runoff and easily accessible groundwater are overexploited and insufficient to meet growing freshwater demand in arid and semi-arid regions. Thus, water-scarce areas and mitigation strategies must sustainably access and utilize every available option for water resources in order to minimize the pressure that continues to grow.
Recently United Nations University Institute for Water, Environment and Health in collaboration with Food and Agriculture Organization (FAO) of the United Nations (UN), World Meteorological Organization (WMO) and other organizations on behalf of the UN-Water Task Force analyzed sustainability of replenishing fresh water from unconventional water resources [6,7], such as tapping low-saline offshore and onshore deep groundwater, use of treated municipal wastewater, collecting of fog water, shipping towed icebergs from Antarctica and ballast water held in tanks and cargo holds of ships, and also rain enhancement (RE) technology through cloud seeding (CS) [8,9]. There are also known attempts to stimulate clouds and precipitation development with the help of jet and thermal meteotrons [10,11,12,13].
RE can be considered one management tool as a part of a general solution to tackling water scarcity [8,14,15,16,17,18,19]. The methodology is based on dispersing of glaciogenic or hygroscopic aerosol into suitable clouds through artillery rockets, airborne seeding, autonomous uncrewed aircraft systems or ground-based interventions [8,15] with the intention of modifying a chain of microphysical processes resulting in the stimulation of additional precipitation.
This technology has been developed since the middle of the last century, and in a number of successful experiments, a statistically significant increase in precipitation from clouds by 5–20% was obtained compared to the amount produced by untreated naturally developing clouds [8,9,14,15,19,20,21,22]. Analysis of the extra area effect of CS on precipitation [23] showed positive (5–15%) increases on the downwind side of the experimental area, for both winter orographic cloud seeding and summer convective cloud seeding projects which may extend to a couple of hundred kilometers.
Previous estimates show that only up to 10–15% of the total cloud water content of typical cumulonimbus convective clouds is released to the ground as precipitation, while the rate of precipitation from these clouds varies in the range of 1 × 10⁴–5 × 10⁵ ton/min [24]. This amount of water exceeds the capacity of all currently operational desalination plants [25] by a factor of 3–30 and points to the huge potential of RE technologies.
The effectiveness of weather modification for RE depends on many factors, including cloud resources [26,27].
One of the key factors determining the success of RE application is the assessment of the region’s cloud climatology. It is important to evaluate the annual, monthly and daily trends in the occurrence of seedable clouds, their types (warm, cold or mixed phase), liquid water content and lifetime etc. This, in turn, makes it possible to assess the prospects and profitability of operational projects to cause measurable increases in annual precipitation. In regions where the frequency of suitable clouds is insufficient, the magnitude of the costs may exceed the expected benefits, manifested as additional rainwater. However, the methodology for conducting such an analysis is not well described in the literature and varies greatly between projects.
WMO in its Executive Summary of statement on weather modification [28] recommends a detailed examination of the suitability of the site for cloud seeding to increase the chances of success in a specific situation. It should be verified through preliminary studies of climatology and characteristics of clouds and precipitation at the site indicating the possibility of amenable conditions for weather modification.
In this analysis, we tried to assess the cloud occurrence and characteristics of a selected area in Minas Girais state, Brazil (Figure 1a), where precipitation is distributed unevenly, and in some years is observed to be quite dry [29].
The article follows the following structure. A brief description of the geographic area of study and its climatology are presented in Section 2. In Section 3 we describe the analysis of datasets: upper air sounding, ground stations, climate reanalysis and radar data. The results and problems are discussed in Section 4. Finally, in Section 5, we conclude with a summary of the results and recommendations for future research.

2. Study Area

2.1. Geographic Location

The study area is located in the municipality Januária in northern Minas Gerais state of Brazil, on the left bank of the São Francisco River (center of the area is the San-Francisco weather radar site: 16°0′32.03″ S and 44°41′45.37″ W).
An area of radius 120 km around the radar site was chosen as Januária territory. The territory is characterized by heterogeneous topography with heights from 400 to 1000 m above the sea level (Figure 1b).

2.2. Climatology

Brazil’s vast territory is a home to an extraordinary variety of ecosystems, which parallel its climatic and topographic diversity. Brazil experiences equatorial and tropical, as well as subtropical, climates.
According to recent climate classification by Beck et al. [30] and Peel et al. [31], the study region (Figure 2a) is an equatorial desert climate (Aw—Warm temperate with dry winter). Aw climates have a pronounced dry season, with the driest month having precipitation less than 60 mm.
Climate variability across the country is driven by the South American Monsoon System, the El Niño Southern Oscillation and the Inter Tropical Convergence Zone. Typically, early October marks the beginning of monsoon season in tropical Brazil.
Minas Gerais province has highly variable precipitation with two distinct seasons, the wet season with the highest average monthly precipitation between November and March and the dry season between April and October (Figure 2b). This pattern is largely affected by the country’s monsoon regime and inter-annual climate variability plays a vital role in affecting the seasonal cycle of precipitation [32,33].
The amount of monthly average rainfall for the period 1991–2020 is presented in Figure 2b. During the wet season the average monthly precipitation varies from approximately 250 mm in December and between 140 and 190 mm in February, March and November. During the dry season the precipitation amounts decline dramatically to ~10 mm per month from June to August. August is the coldest month of the year, with mean temperatures around 20 °C, while February is the warmest (average of ~25 °C). There is a directly proportional relationship between temperature and precipitation in this region of Brazil.
Since 1950, a decreasing trend in annual precipitation (Figure 2c) has been observed which has accelerated during the last 2 decades. Beginning from 1970 the annual number of dry days has had a stable increasing trend (Figure 2d). The number of warm days and nights increased significantly, particularly during the dry season, with a slight increase in the number of warm days also occurring during winter seasons. Temperatures across the region have risen by 0.5 °C since 1980, with greater rates of warming observed during the dry season (August to November). Winter temperatures are rising, while the frequency of cool nights across the country have decreased. Given the country’s high humidity, rising temperatures have also increased values for critical heat indexes, particularly in low-lying areas.

3. Data analysis

3.1. Dry and Rainy Periods

In order to determine differences between atmosphere states in dry and rainy periods limiting precipitation formation processes we conventionally accept the monthly precipitation threshold of 150 mm as a transition between two periods. According to Figure 2b the first group includes 7 months (from April to October) and the second group includes 5 months (from November to March) (Table 1), indicating that, typically, the dry season is longer than the rainy season for the studied region.

3.2. Upper Air Sounding

Upper air sounding data from the database of the University of Wyoming (http://weather.uwyo.edu/, accessed on 15 June 2022) are used in this study. There are three sounding stations within a radius of 500 km from the weather radar located at the center of the studied area. The closest one is SBBR Brasilia-Aeroporto (WMO Station Identifier 83378; 15.86º S, 47.93º W, and elevation 1061.0 m), located 320 km west of the studied area center. It is assumed that this station’s data are representative for the study area and can adequately reflect the atmosphere state in the cloud formation and growth layer. In this analysis, we processed and summarized data from 22,379 sondes from 1974 to 2022 (49 years).
Atmosphere humidity–temperature stratification plays a decisive role in the process of cloud formation, their phase and microphysical state. A warm cloud layer generally contains a liquid-drop fraction, while a cold layer usually contains both drops and solid particles (ice crystals, snowflakes, ice pellets, hailstones).
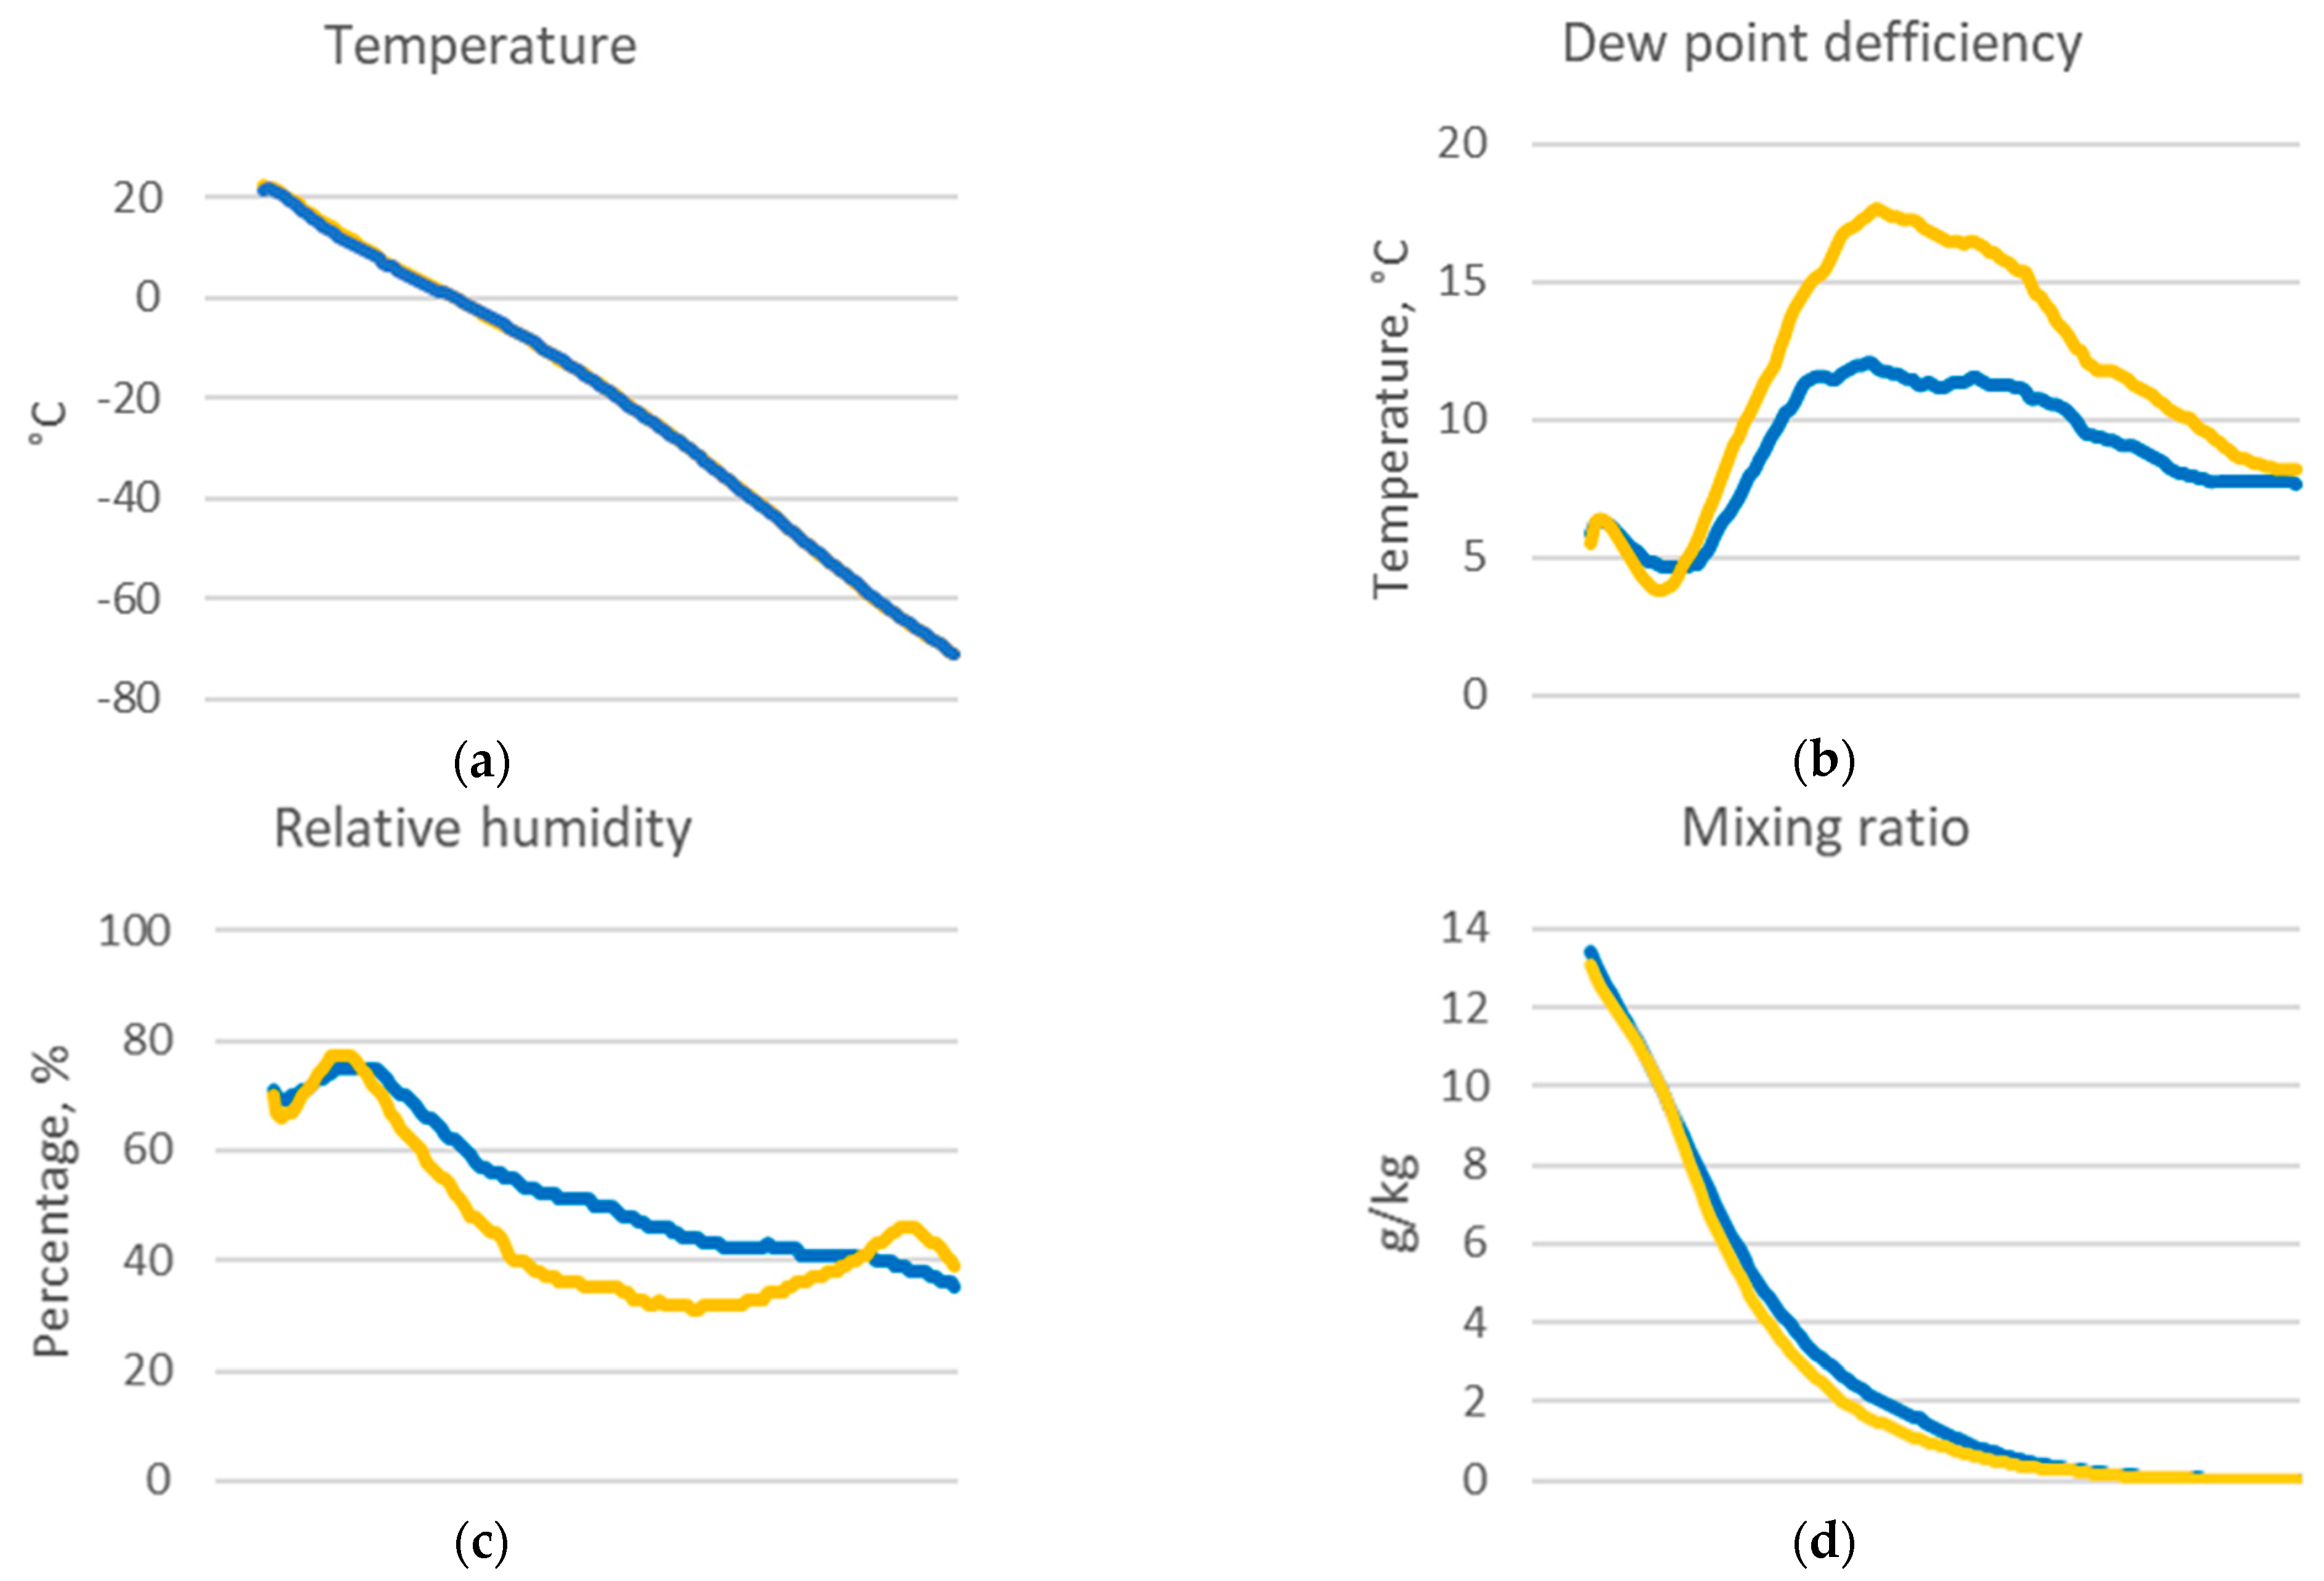
The distribution of average monthly temperatures by heights in the study area, as shown in Figure 3a, is not different for the wet and the dry rainfall periods. The variation of average monthly temperatures is maximum in the lower 3–5 km layer and is about 5–6 degrees. Higher in the troposphere, the change in temperature in different months does not exceed 3 degrees. Figure 7 also shows the same according to the ERA-5 reanalysis data. The warmest month is December, and the coldest month is June.
This figure also shows that the depth of the cloud warm layer (where temperature exceeds 0 °C) is up to 5 km ASL, which is higher than in the middle latitudes. It is known that the higher the temperature, the higher the saturation vapor density (Figure 3d), with which the cloud droplet water content and droplet diameter directly correlate due to the effect of temperature on the density of the aqueous phase [34]. Taking this into account, it can be expected that the main liquid droplet water content will be concentrated in this lower 5 km layer.
It can be seen from Figure 3b that, during the dry period, the dew point deficit increases sharply (by 5–6 degrees). Air relative humidity during the specified period (Figure 3c) is reduced by 10–20%, and the air absolute humidity is reduced by 0.3–0.5 g/kg. These differences between dry period and rainy period are strongest in the layer from 2.5 to 12 km ASL, typically the layer in which convective clouds will form in the atmosphere. The drier atmosphere during the dry seasons explains the drop in precipitation during these months.
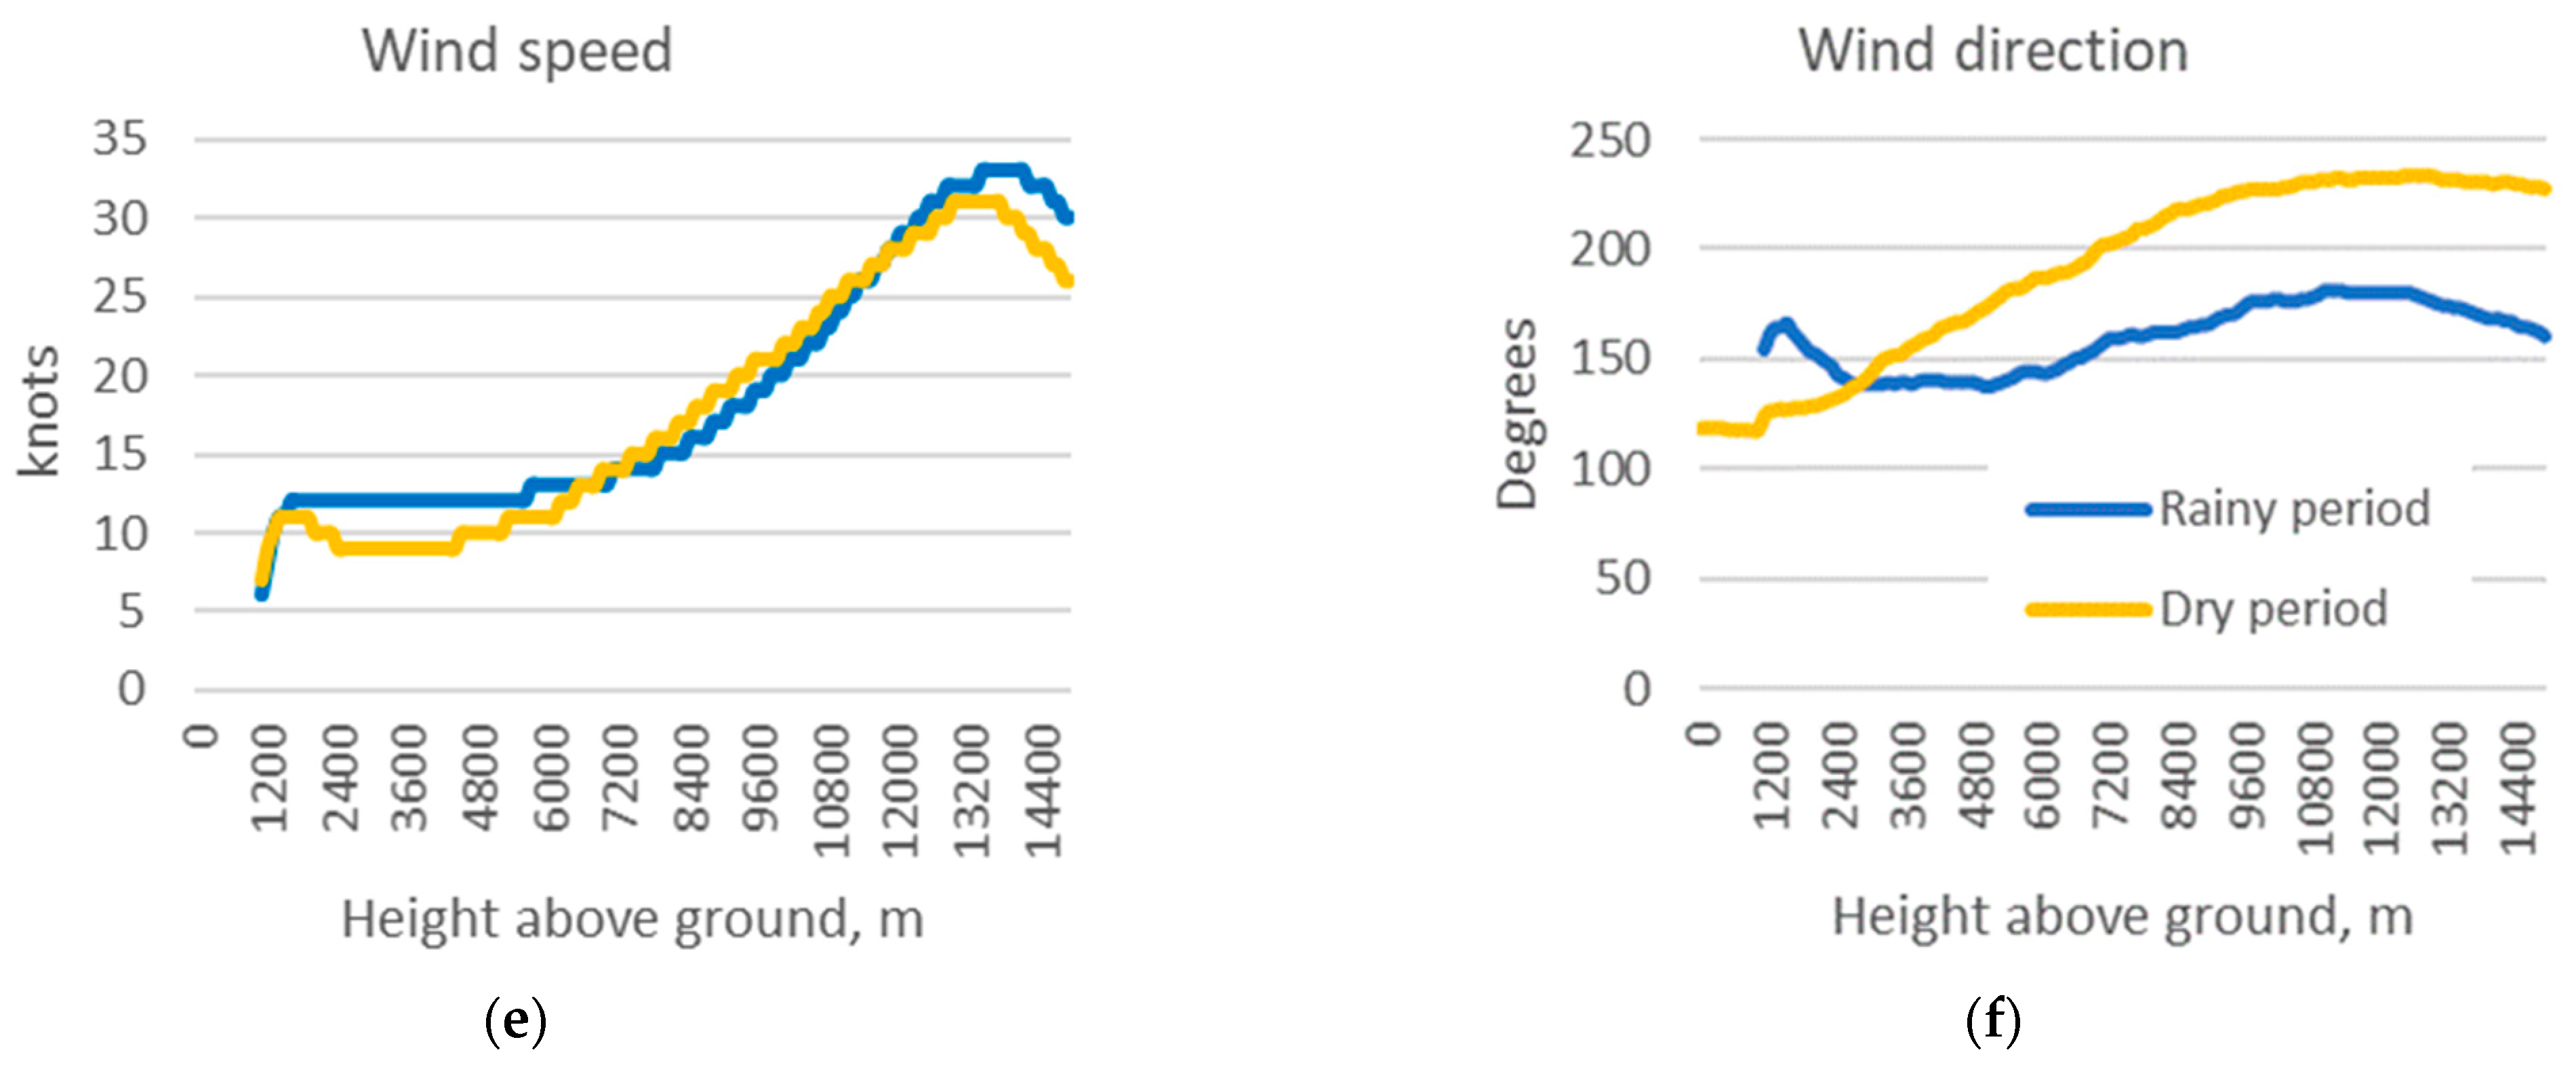
Analyzing the wind speed and direction (Figure 3e–f), it can be noted that the wind weakens during the dry period between 1 and 6 km ASL. Wind direction changes from a height of 2 km to 14 km from 145–160 degrees to 150–240 degrees. Thus, during the dry period, slowly moving dry continental air masses begin to dominate the middle atmosphere, as well as, apparently, anticyclonic conditions resulting in a stable and fine weather with clear skies.
The annual trends for relative humidity, temperature, dew point temperature, absolute humidity, in the surface layer of the atmosphere (from 1000 to 800 mb) for the period 1974–2022, also indicate negative trends, further decreasing favorable conditions for the formation of precipitation-forming clouds. Over the past 49 years, the average air temperature in the surface layer (Figure 4a) has varied from 20 to 22 °C and has increased by about 1 degree both in dry and rainy periods. Relative humidity (Figure 4b) decreased by 3–4% at an average value of 70%. An interesting observation is a slight increase in the absolute humidity of the air in the surface layer (Figure 4c). Its average value varied between 12 and 13 g/kg, and the increase was about 0.2–0.3 g/kg. This moderate increase was facilitated by an increase in the temperature of the layer, at which the surface of the ocean and water bodies releases more vapor due to the evaporation. However, a general characterization of the surface atmosphere in terms of changes in the probability of water drop formation can probably be obtained from the dew point deficit diagram (Figure 4d). It shows that the dew point deficit increased from 5.2 to 6.6 °C over the specified period, which undermines the activation of water droplets on aerosol particles and should lead to a decrease in the water content of the clouds in the study area.
Trends in convective instability indices such as Convective Available Potential Energy (CAPE) and Lifted index (LIFT) are represented in Figure 5.
The CAPE index shows the maximum buoyancy of an undiluted air parcel, related to the potential updraft strength of thunderstorms. We calculated year-averaged CAPE values by summing non-zero values and then dividing the sum by the length of the series. Figure 5a shows that the average CAPE tends to decrease by 50–70 J/kg over a period of 49 years.
The LIFT index indicates the potential for convective storm development. For it, we also calculated average annual values for non-zero values. Its trend (Figure 5b) shows a decrease, which indicates an increase in convective instability.
Comparing both of these indices does not provide a general picture that characterizes the conditions for the formation of convective clouds, which usually make the greatest contribution to the balance of precipitation.

3.3. Ground Stations—Assessment of Precipitation Climatology

Data from 14 weather stations located in the 120 km vicinity of the Sao Francisco radar (Figure 1b) and having continuous observations from 2000 to 2019 are used to analyze the climatic characteristics of precipitation. Understanding the precipitation trend is essential for long-term planning of RE programs. Trend of increasing precipitation makes use of these technologies irrelevant, while at long-term reduction amplified with low natural rainfall amounts the hypothetically enhanced rain rate may not cover all the costs incurred during the implementation of the technology. For a more detailed assessment of the precipitation characteristics of the study area, we estimated the following periods: hydrological year (October–September); six months of the wet season (October–March) and the four most rainy months (November–February).
According to the data for 2000–2018, the average interpolated field of annual precipitation (hydrological year) for 14 weather stations is shown in Figure 6. There is a clear east–west precipitation gradient across the study region. The maximum precipitation, exceeding 1095 mm (Fazenda Concei station), is located on the western side of the experimental area, which is just south-east of some elevated terrain (Figure 1b). Further, precipitation decreases to the level of 900–960 mm in the central part and to 800–900 mm in the east of the territory (838 mm in Bom Jardim station) (Figure 6, Table 2). Thus, for a hydrological year the amount of precipitation in the west of the territory is 25–30% greater than in the eastern part.
Analysis of monthly precipitation amounts (Table 2) showed that for the 6 months (October–March), rainfall amounts accumulated from 781 mm at Bom Jardim to 1000 mm at Fazenda Concei. Overall, 91 to 93% of the annual precipitation falls on the project territory for six months of wet period.
For the 4-month period from November to February accumulated rainfall of 616 mm occurs at Bom Jardim to 770 mm at Fazenda Concei (Table 2). Moreover, 69 to 74% of the annual precipitation falls on the project territory for four months of rainy period.
Figure 6b depicts the monthly precipitation course for the Bom Jardim ground station with a peak of around 200 mm in December and almost zero in July–August. For the same meteorological station, a long-term trend of precipitation decrease was found in all three periods (hydrological, wet and rainy periods) (Figure 6c).
An analysis of historical precipitation data (Table 3) showed that the average number of rainy days is 57–83 days per year (mean value 69 days), 51–72 days for 6 months of the wet period (mean value 61 days) and 37–54 days for 4 months of rainy period (mean value 45 days) (Table 3).
The mean number of rainy days is 69 for the whole year, 61 for the wet period and 45 for the rainy period (Table 3). At the same time the decline in precipitation amount for all three periods was found as 21–22% or 162–212 mm (Table 3).
The station precipitation data shows a decline in precipitation amounts at all weather stations over the 19-year period (Table 4). It can be seen from the table that:
-
Annual precipitation (hydrological period) is reduced from 12 to 38% (an average of 212 mm or 21%);
-
Six-month precipitation (wet period) is reduced from 9 to 36% (an average of 208 mm or 21%);
-
Four-month precipitation (rainy period) is reduced from 3 to 37% (an average of 162 mm or 22%).

3.4. Global Climate Reanalysis ERA-5

Reanalyses are among the most-used climate datasets in geophysical sciences. They provide a comprehensive description of the observed climate as it has evolved during recent decades, on 3D grids at sub-daily intervals. Climate reanalysis combines past observations with models to generate a consistent time series of multiple climate variables. ERA-5 is the latest climate reanalysis produced by European Center for Meteorological Weather Forecast (ECMWF), providing hourly data on many atmospheric, land-surface and sea-state parameters together with estimates of uncertainty for all variables [35].
In this section, we aimed to determine the characteristics of the clouds and cloud resources of the region under study based on long-term data from 1979 to 2019.
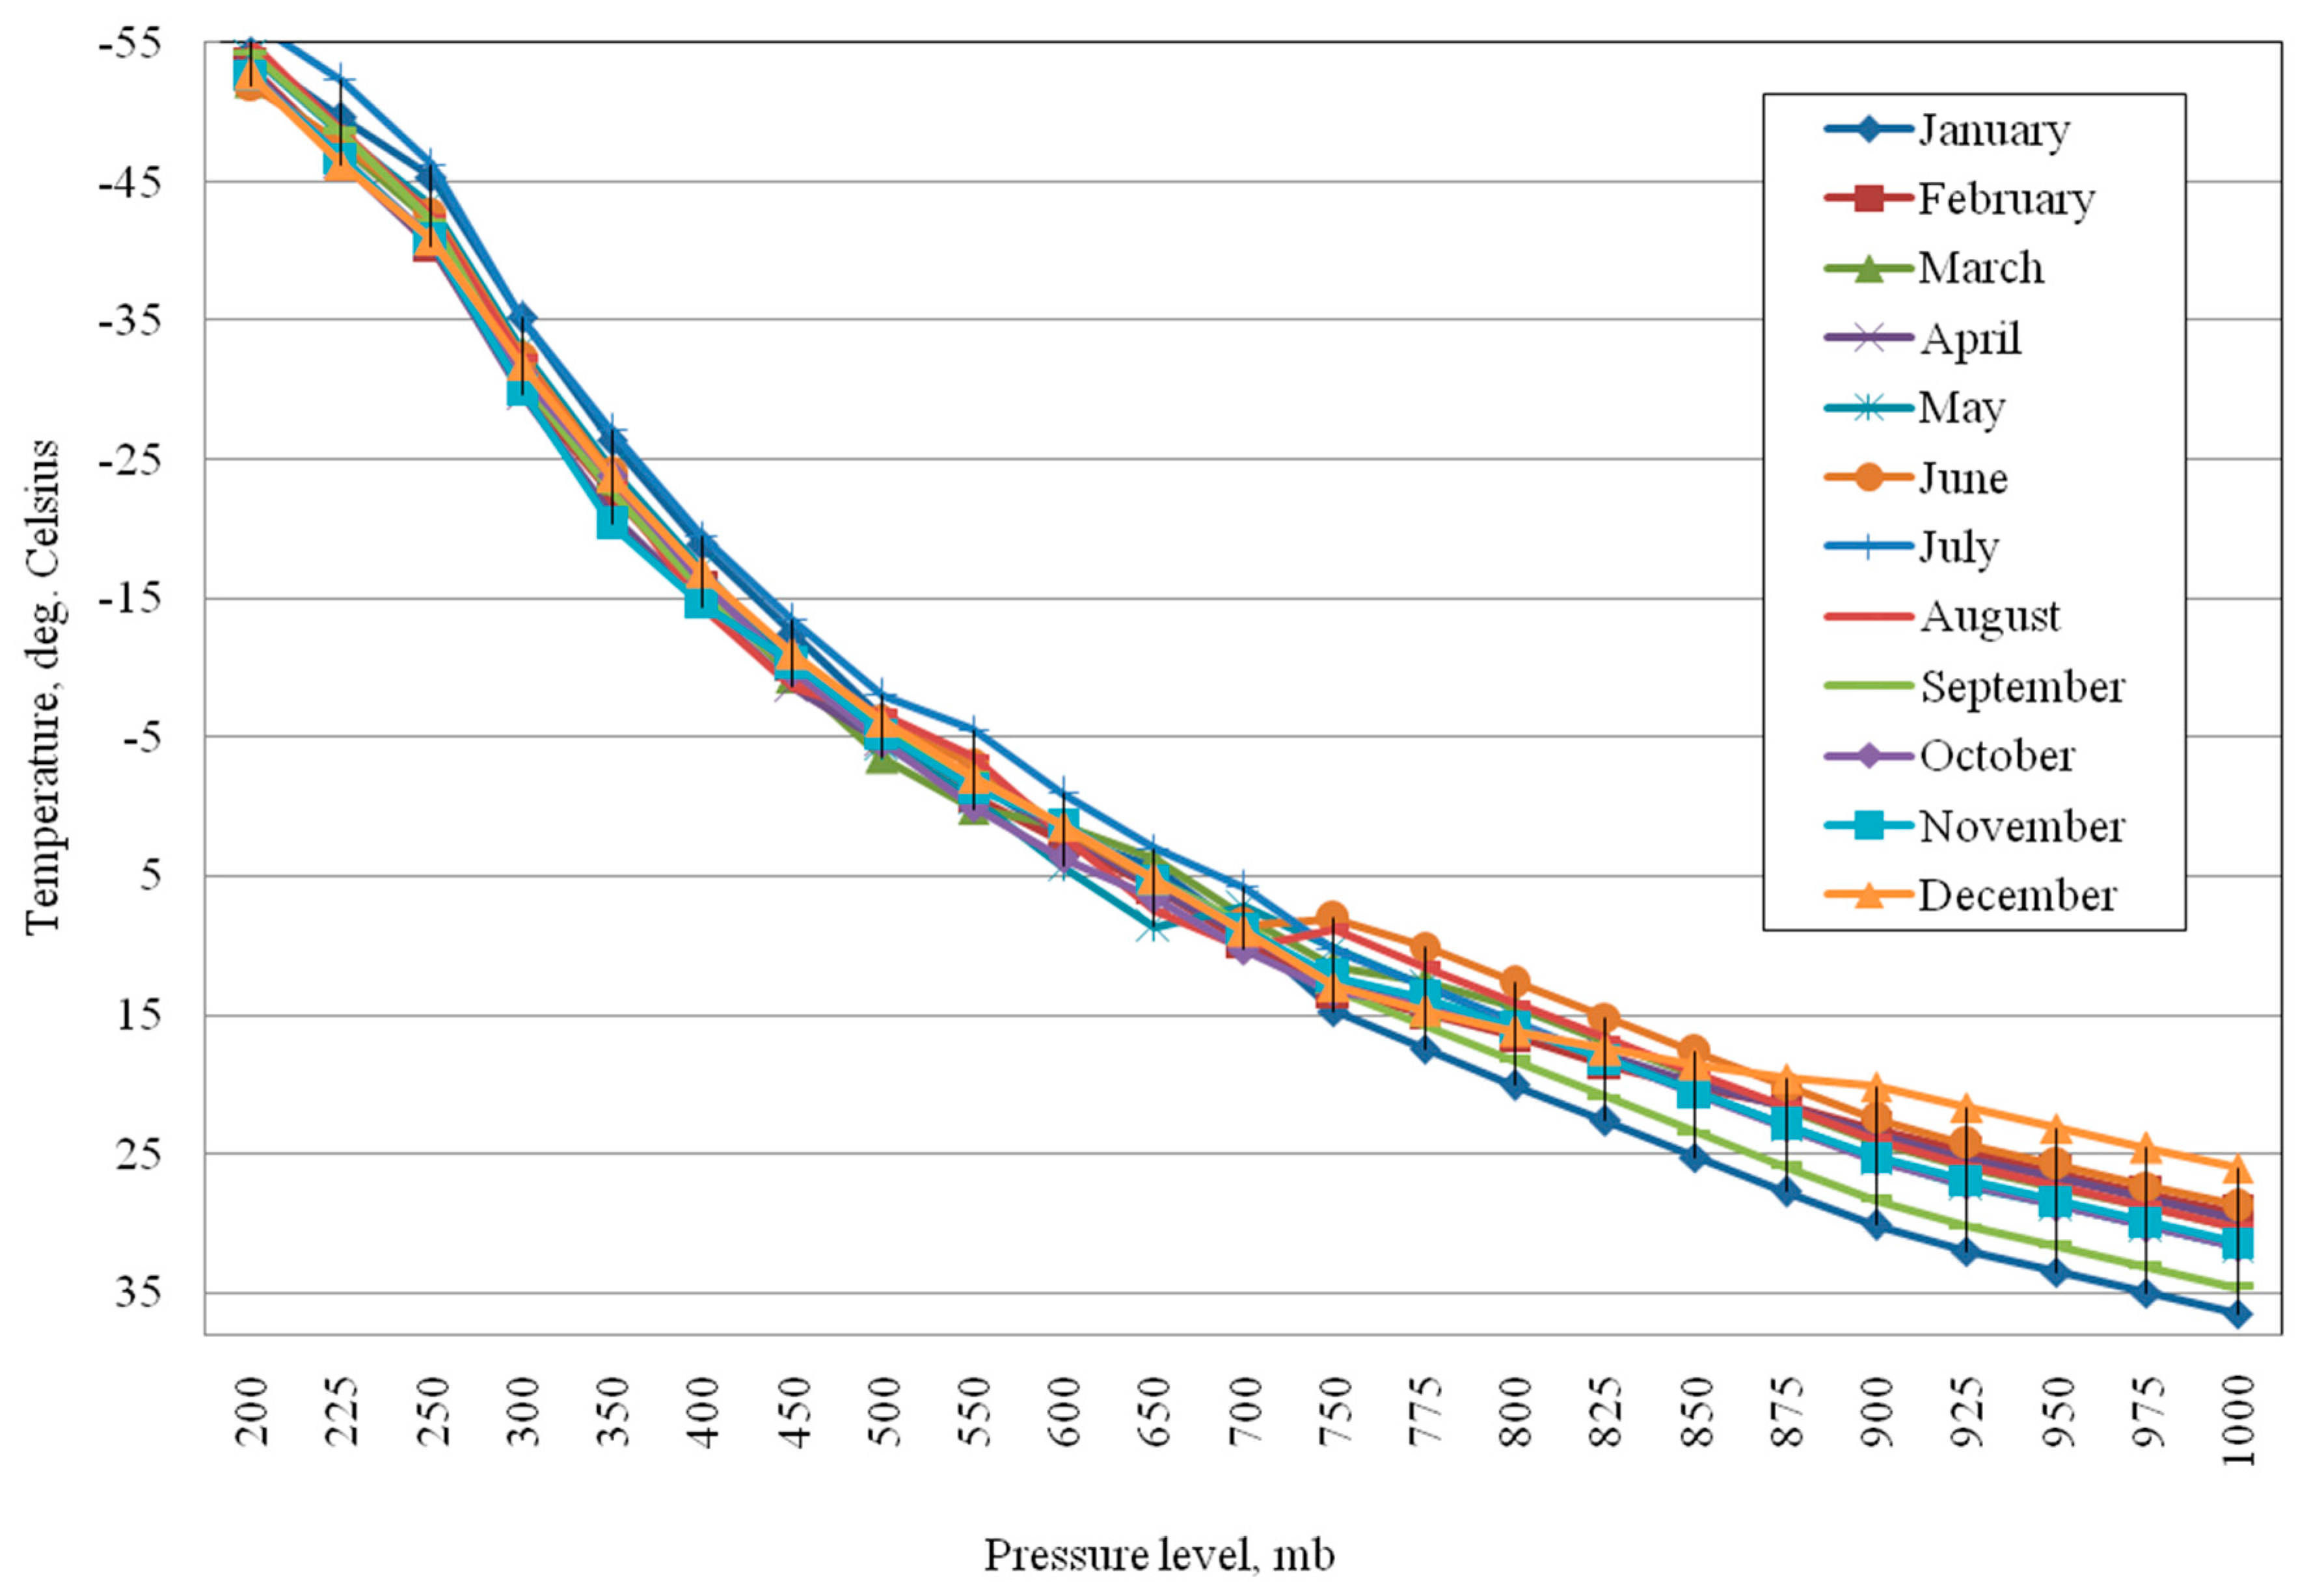
Figure 7 shows the variation in monthly average temperature profiles over a 40-year period. It can be seen that the greatest difference is noted in the lower layer from 1000 to 700 millibars and is up to 10 degrees between the coldest and warmest months. Higher in the atmosphere, the variation in average monthly temperatures is no longer so great.
Altitude dependence of specific water content for three cloud substances (rain drops, ice and cloud droplets) is represented in Figure 8. The main water content of the clouds of the study region is located in the liquid-drop phase in the form of cloud droplets. Droplet water content (red curve) is located mainly from 1 to 8 km above sea level and has two maxima in its height distribution. The first mode is located at an altitude of about 3 km, and the second is at 4.5 km. Looking at the rainwater content (blue curve), we can see that it is located in the layer from 0 to 4.9 km, with a maximum at 3.6 km. Apparently, the saddle in the distribution of droplet water content (red curve) between its two maxima is associated with the formation of raindrops by coagulation of large cloud droplets. For this reason, liquid water content here decreases, while rainwater content increases. This generally indicates that the warm mechanism of precipitation formation probably prevails in the region under study. However, these heights are quite close to the 0 C isotherm.
From the ice water content (green curve), it can be seen that it exceeds the rainwater content but is much less than the liquid water content. This suggests that the clouds in the region are predominantly warm-type clouds, although they are (i.e., mixed phase clouds). Ice water is located from heights of 3.6 to 15.8 km with a unimodal maximum at a height of 10.4 km. At 5.5–7 km in the altitudinal distribution of ice water content there is a visible change in the direction of increase. This is likely due to the capture of cloud droplets by ice crystals, which increases the ice content of the cloud in a thin layer but scavenges other particles.
Figure 9 shows the distribution of the integrated water content for three fractions (droplets, ice and rain) on the geographic projection of the region. It can be seen that despite the spatial smallness of the study area, these distributions are uneven over the territory. The ice fraction is especially unevenly distributed (Figure 9b), having a maximum in the northeast of the territory and a minimum in the southwest. But looking at the relief map, one can note some correlation between the topography and the water content of the ice fraction. A slightly inverted distribution in space has a droplet water content (Figure 9a), having a maximum in the west of the region. The rain fraction is most evenly distributed (Figure 9c).
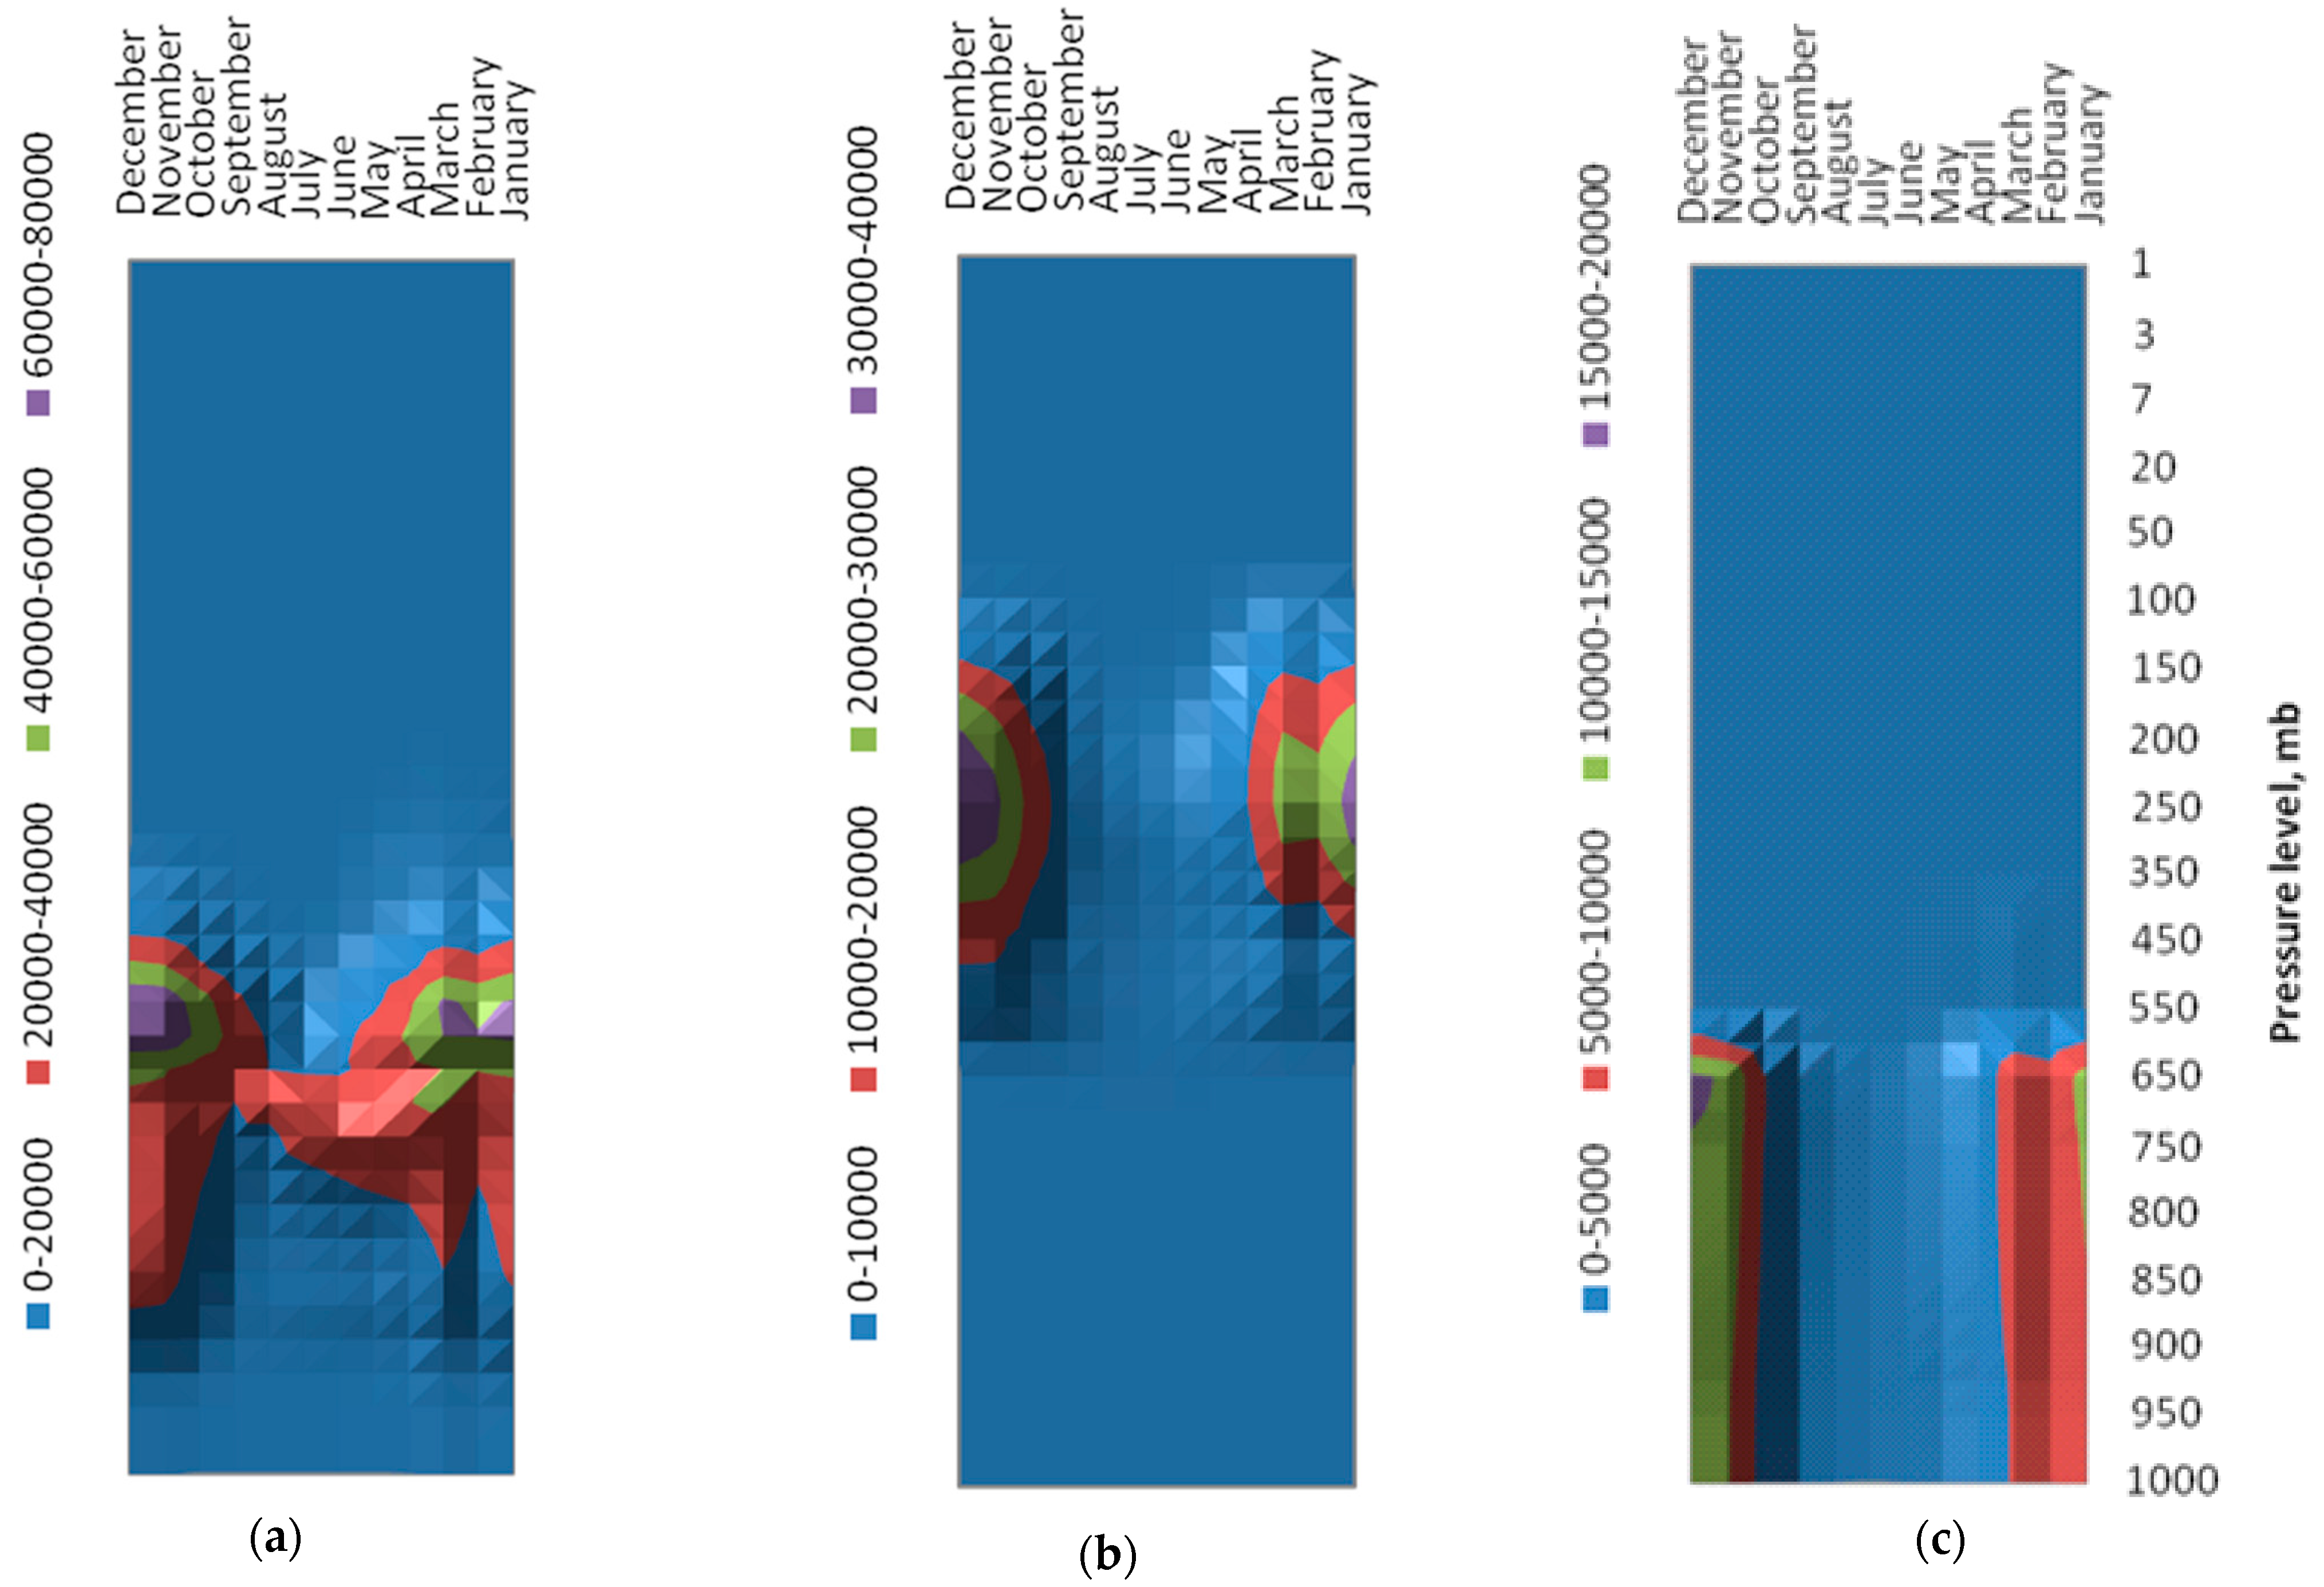
Figure 10 shows the altitude-monthly distributions of all three fractions. All three fractions are well separated by heights from each other with some area of intersection between them. As in Figure 8, the ice phase region is pronounced Annual distributions of these parameters correlate well with the data from ground-based weather stations on the separation of dry and rainy periods.
In Figure 11 combined the temperature distribution in height in different months and the height distribution of droplet water content. This made it possible to estimate the ratio of liquid water content in the region of positive and negative temperatures. It can be seen that the maximum droplet water content is located in the cold layer slightly above the zero isotherm, by about 0.3–0.7 km.

3.5. Weather Radar Data

The weather radar at San-Francisco (Lat 16°0′32.03″ S; Lon 44°41′45.37″ W) is located in the middle of the study area. We were provided with raw radar data for 2 years from 2017 to 2019. This radar operates at a wavelength of 5.6 cm and generates radar scan files every 10 min. Storms were identified using the Thunderstorm Identification Tracking and Analysis (TITAN) algorithm [36]. The default parameters, similar to the South African Rainfall Enhancement Program (SAREP), were used to initialize TITAN [37]. TITAN tracks the three-dimensional storm body and calculates statistics like radar reflectivity, cloud water contents, lifetime, cloud top and maximum intensity.
The paragraph below details the results of processed radar information for identifying the main characteristics and patterns of clouds with their separation by vertical distribution, height and depth of development, time of occurrence and distribution by months.
Figure 12a shows distribution of cloud reflectivity, cloud top height and time of occurrence. The horizontal axis shows the distribution of the maximum reflectivity MaxDBZ of clouds in gradations increasing by 5 decibel relative to Z (dBZ) from 30 to 65 dBZ, the vertical axis shows the distribution of clouds along the height of the upper boundary from 0 to 20 km, and additionally the color palette indicates the time of day from 0 to 24 h. This shows that low clouds of stratus and stratocumulus type with a reflectivity of less than 40 dBZ, which usually produce weak precipitation, are observed at night and in the morning. Mid-tier clouds with maximum reflectivity (40–50 dBZ) form on average in the midday and in the afternoon producing the highest precipitation. Once organized, the clouds can form clouds of large vertical extent (more than 5–8 km) with an upper boundary of up to 8–15 km and a reflectivity of up to 50–60 dBZ; these form mostly in the second half of the day and in the late afternoon, typical of afternoon convection
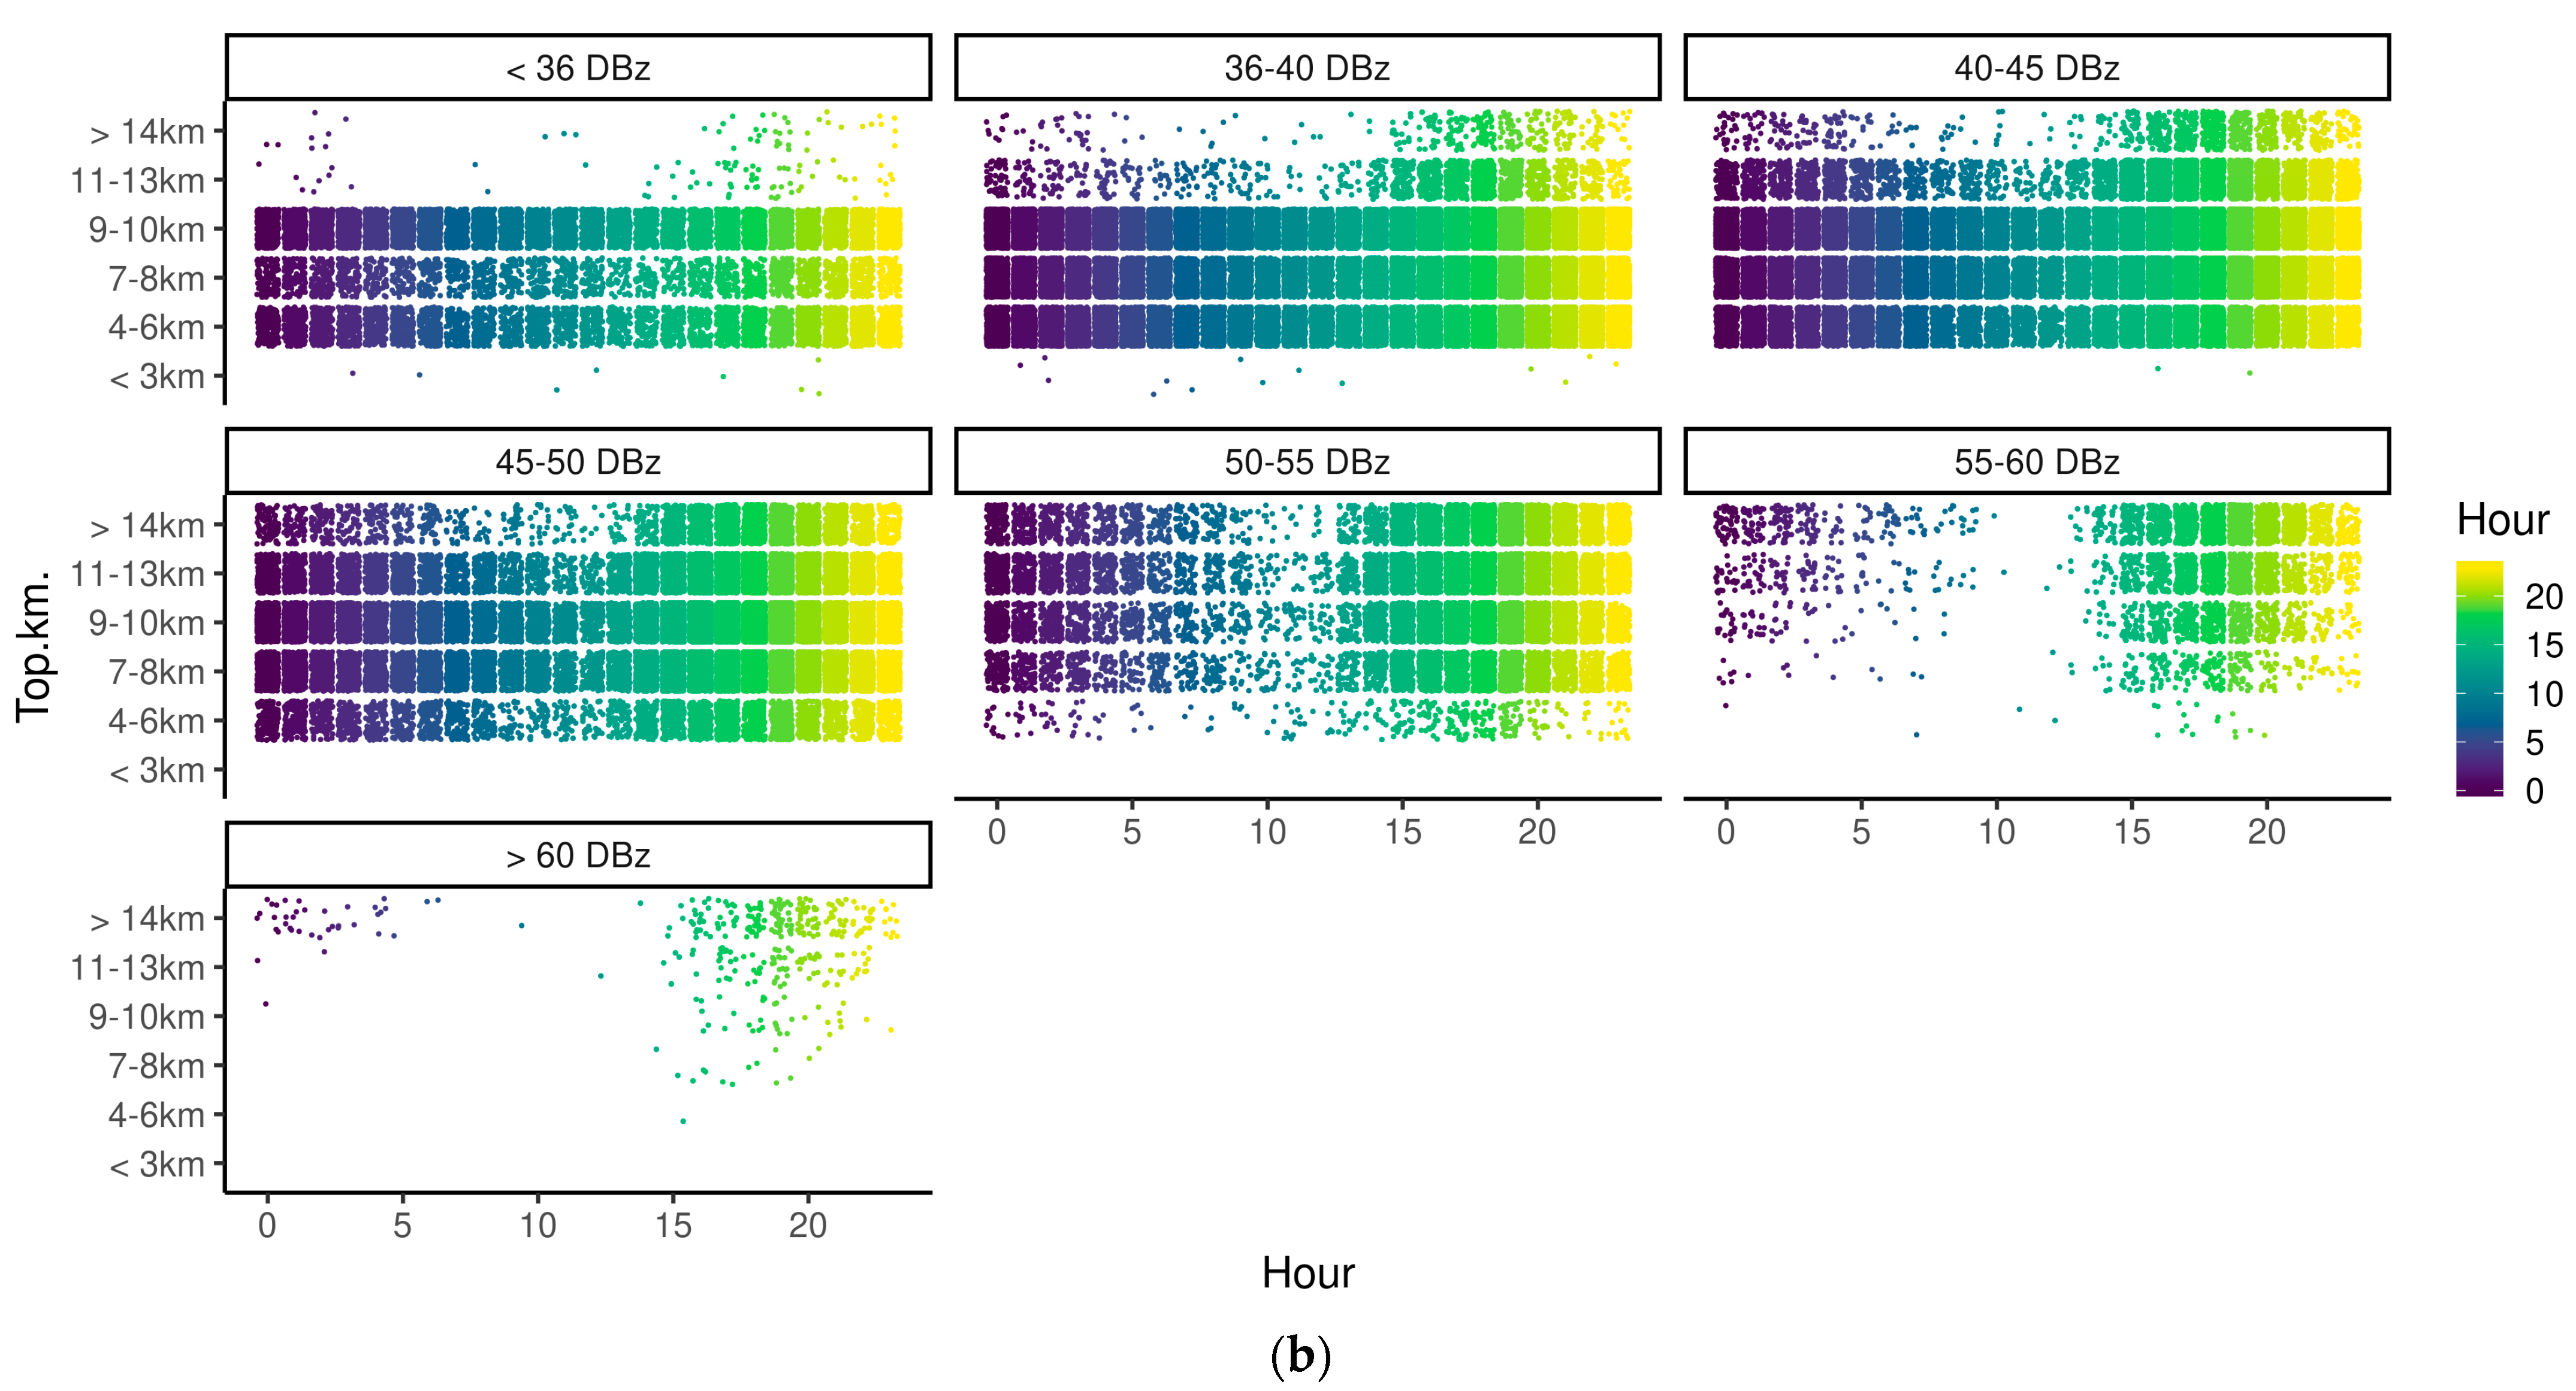
Figure 12b shows a similar distribution, but the time of day is plotted along the abscissa axis and the daily regularities of the distribution of the height of the upper boundary of the clouds and the maximum reflectivity of clouds from the time of day are more clearly traced. The main consequence of this diagram is the pronounced dependence of the time of development of powerful cumulus clouds with a reflectivity of more than 50 dBZ, the afternoon period prevails, but such clouds can also appear in the early morning and even at night. Even more powerful clouds with a reflectivity of more than 55 dBZ develop mainly after midday, as convective process reach a peak, these clouds would typically be cumulonimbus clouds. At the same time, smaller clouds such as cumulus and isolated thunderstorm clouds with a reflectivity of less than 40–45 dBZ can appear and develop at any time of the day. This is likely to include both stratus and convective clouds.
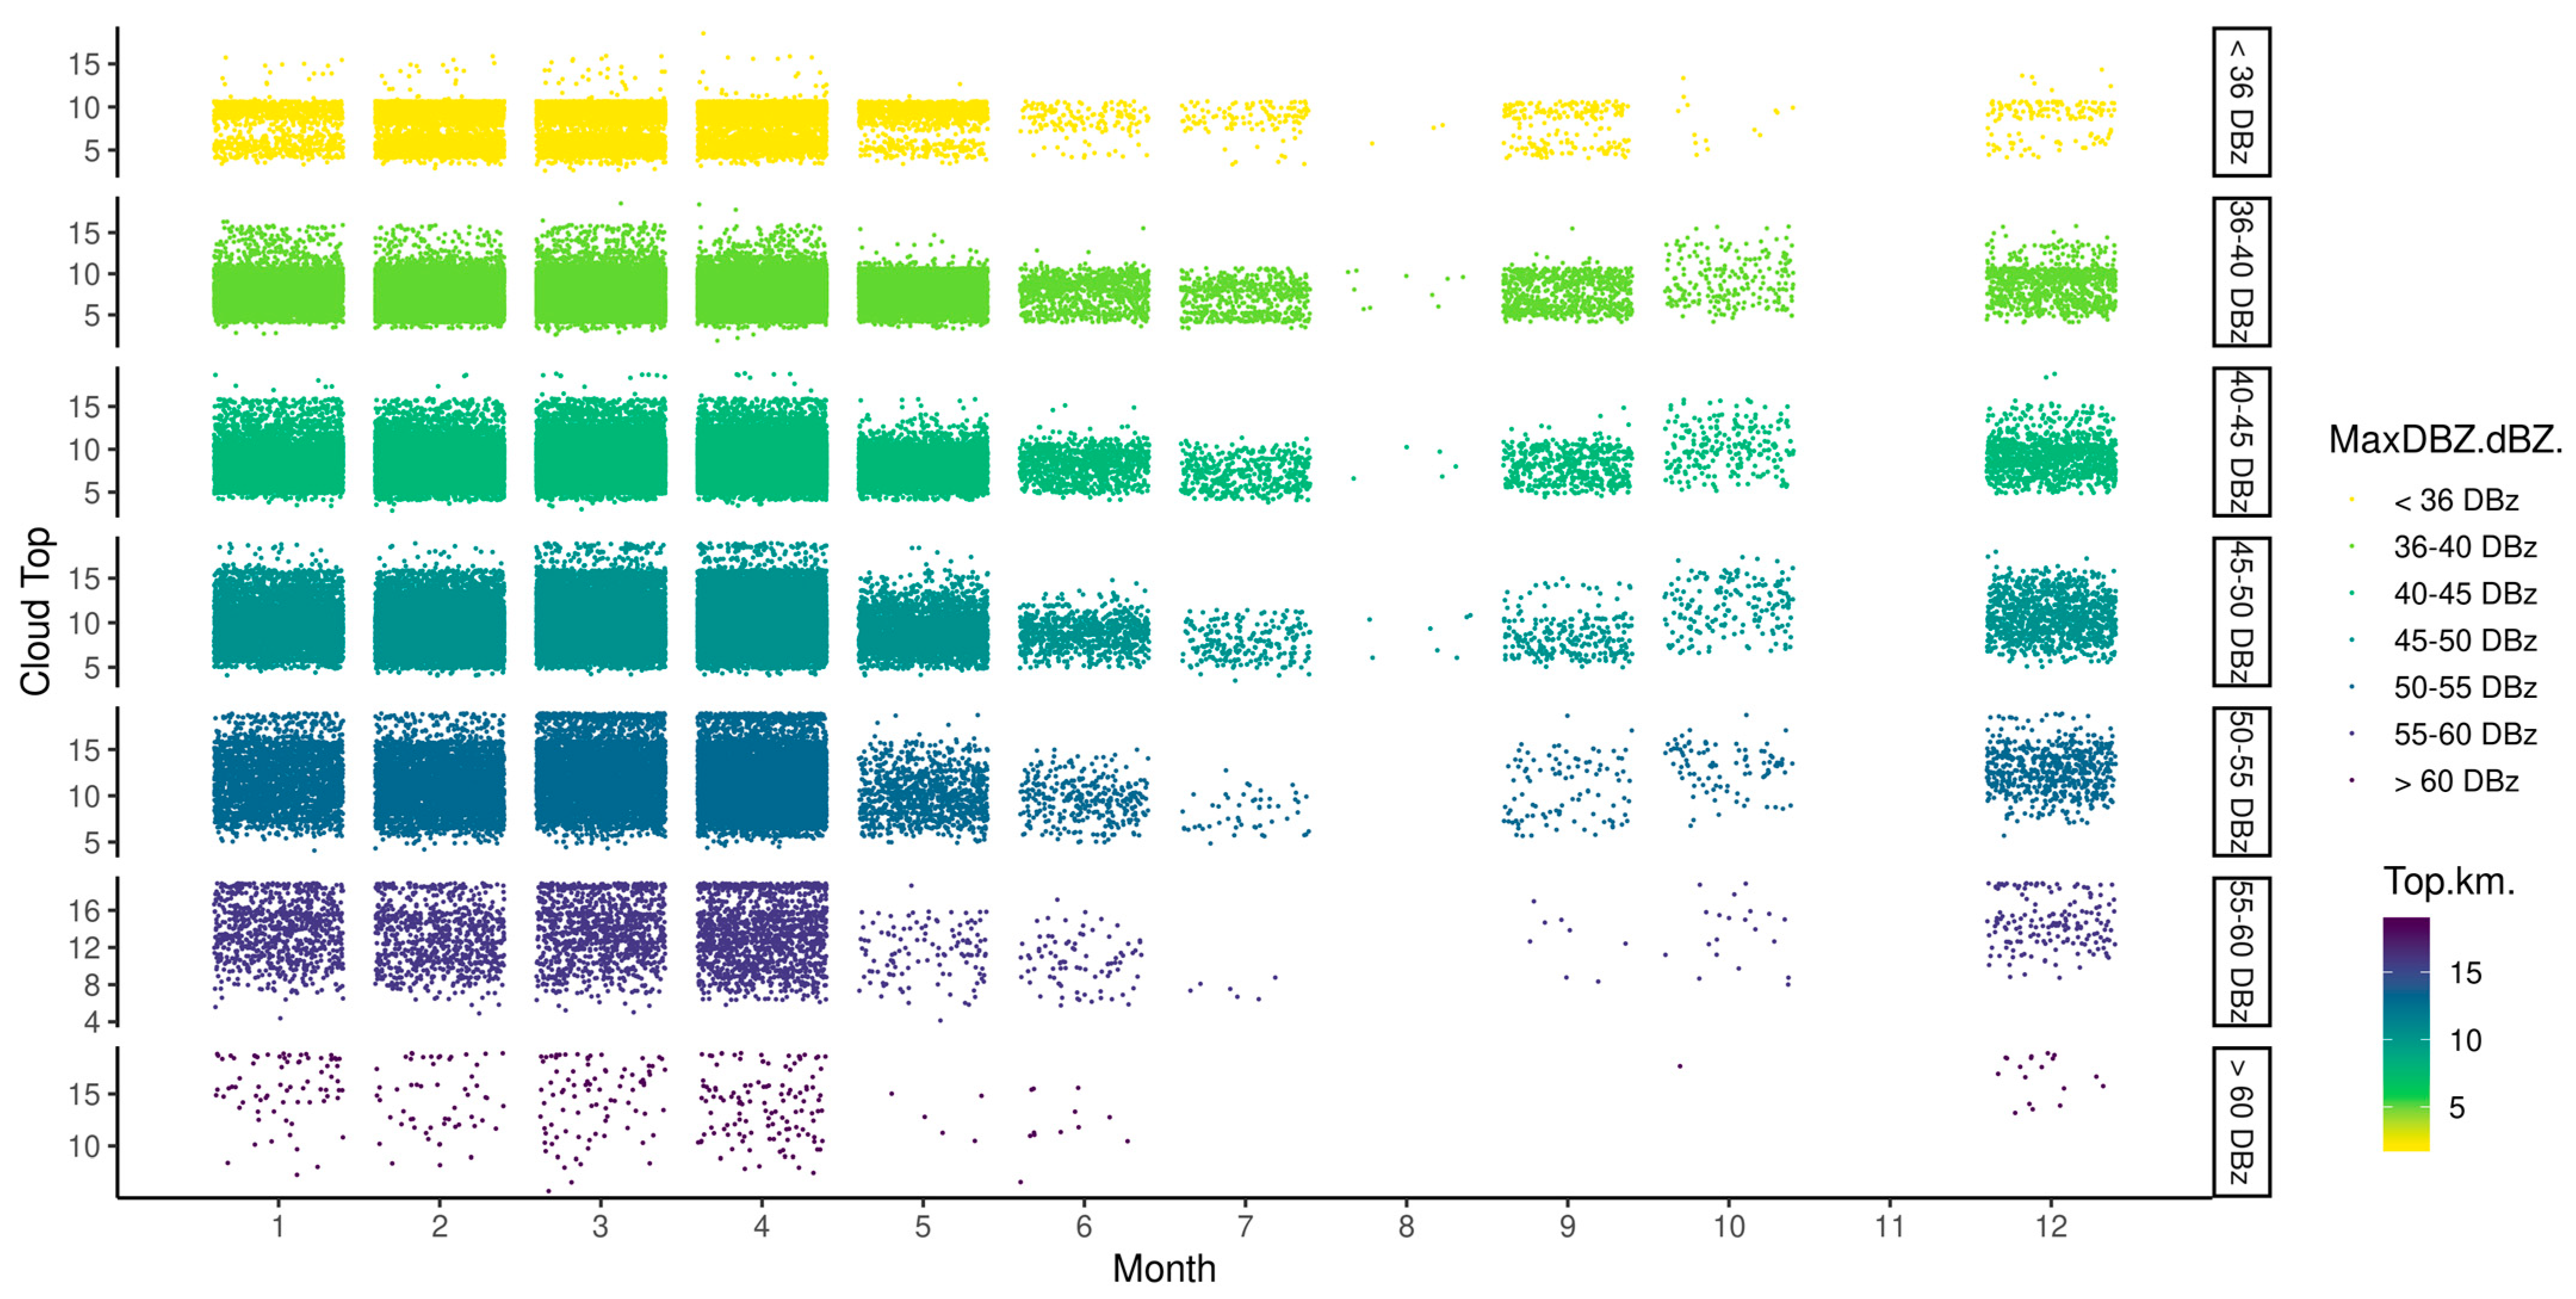
Figure 13 depicts monthly average distributions of cloud top height for different reflectivity levels. It shows that mature cumulonimbus clouds with reflectivity exceeding 60 dBZ can form mainly from December to April and reach heights of 9–15 km. Further, the lower the cloud reflectivity, the less pronounced is the annual seasonality of their formation. Weak low-rain clouds can form at almost any time of the year except August and November.
Very similar patterns in the temporal and monthly distribution of clouds of different thicknesses follow from Figure 14. It shows that the main daily maximum, when clouds of various thicknesses develop, is observed in the afternoon and evening from 15:00 to 20:00 (Figure 14a). Cloud processes that develop during this period can exist until 10 am the next day.

4. Discussion

Minas Gerais province has highly variable precipitation patterns. The amount of monthly average rainfall varies tremendously over the year. Monthly mean precipitation is approximately 250 (Std dev) mm in December, 140–190 (Std dev) mm in February, March and November constituting the wet season and drops dramatically to 10 mm in June–August, during the dry season. This seasonal rainfall variability is largely affected by the country’s monsoon regime, the El Niño Southern Oscillation, Inter Tropical Convergence Zone and topography diversity [32,33].
The highly uneven annual distribution of precipitation in the region and its impacts is exacerbated by long-term decreasing trends of precipitation observed at all surface stations, since 1950 and especially in the last 2 decades. Meteorological stations data showed precipitation decrease trend over a 19-year period in hydrological, wet and rainy periods. At the same time annual precipitation amount reduction for all three periods was found as 21–22% or 162–212 mm.
Intercomparison of monthly averaged lower troposphere temperature atmosphere and precipitation amount suggests a directly proportional relationship between these two parameters in a given region. The higher the temperature near the ground, the more precipitation and vice versa. This is due to thermal convection triggered during the warm and humid period of the year and leading to the formation of precipitation-forming clouds.
Furthermore, temperature has risen by 0.5 °C since 1980 in the region, with greater rates of warming observed during the dry season. The average air temperature in the surface layer from 1000 to 800 millibar has increased by about 1 degree both in dry and rainy periods, while relative humidity has decreased by 3–4%. Probably for these reasons, the dew point deficit increased from 5.2 to 6.6 °C. Such conditions worsen the formation of precipitation-producing clouds, and even a slight increase of air specific humidity by 0.2–0.3 g/kg does not correct the situation.
This is confirmed by an increase in the dew point deficit by 1.4 °C over the specified period, which complicates the activation of water droplets on aerosol particles and should lead to a decrease in the water content of the clouds in the study area. It should be noted here that, if there are a large number of hygroscopic condensation nuclei in the atmosphere of the region that effectively absorb water vapor from the air at relative humidity much less than 100%, then such an increase in the dew point deficit may not be so critical. However, to obtain a more accurate picture, it is recommended to conduct a case study of the type and properties of aerosols in a given region. This task was not included in our current analysis.
These unfavorable trends should motivate scientists and stake holders to solve the problem and evaluate the prospects for the use of RE through CS [8] as one of the possible solutions. Ideally, its use should fully or partially compensate for the precipitation reduction trend and even exceed it.
Application of the CS method requires extensive knowledge about cloud climatology. Not all clouds are suitable for seeding, and only those of them that meet a set of special conditions, such as sufficient water content, vertical depth of cold and/or warm parts and development dynamics, can be considered as favorable objects [15]. The huge energy associated with natural cloud systems means that it is not feasible to RE through changes to the mass or energy balance of the system, but only through unstable states in clouds (convective, phase and colloidal instabilities). Thus, only a precise knowledge of the system and a careful intervention via seeding with appropriate aerosol particles that augment or substitute for natural particles provide this opportunity to enhance precipitation from the clouds.
The small amount of precipitation during the dry months suggests RE during these months will not be viable and certainly not cost effective. However, during the wet season, (November, December and January) a 20% increase in precipitation from cloud seeding would be equivalent to between 40 and 50 mm per month, which is of practical interest. Therefore, the implementation of CS in the wet season would be profitable for at least 3 months and uncertain in a further 3 months. During the dry season CS would not be profitable. Despite the fact that such arguments and assessments are highly idealized and simplified, it is very convenient to carry out further analysis and draw conclusions about the appropriateness of using CS technologies in the region under consideration.
Small changes in monthly averaged temperatures over 3–5 km level in ranges of 2–3 degrees suggests that the phase composition of clouds throughout the year will be approximately the same with some variation, which to some extent simplifies the choice of cloud seeding strategy.
A typical cloud warm layer in the region is propagated up to 5 km from the sea level. This exceeds similar values for the middle and high latitudes of both hemispheres. Since cloud liquid water content is maximum in this layer, then optimal CS strategy to enhance precipitation which makes the maximum use of available cloud resources, should focus on droplets coarsening in this deep warm layer so that when they pass into the cold layer, the particle size is the largest.
There is a sharp increase of dew point deficit by 5–6 degrees, a decrease of relative humidity by 10–20% and a decrease of specific humidity by 0.3–0.5 g/kg in a dry period in the cloud formation and development layers makes it clear why clouds form less often in dry periods. Unfortunately, when the atmosphere is dry and stable, seeding technologies cannot work. This suggests that they can be used during the rainy season (November–March), when precipitation itself develops in a natural way, or during transitions between dry and rainy periods (February, March, October).
The analysis of the convective instability indexes CAPE and LIFT over 49 years period unfortunately turned out to be ambiguous. CAPE tends to decrease by 50–70 J/kg, reducing the likelihood of convection formation while LIFT indicates the potential for convective storm development.
Variation in monthly average temperature profiles over a 40-year period according to ERA-5 data show the greatest difference in the lower layer from 1000 to 700 millibars. Higher in the atmosphere this variation is no longer so great. Likely due to the proximity to the ocean. In terms of RE planning, this simplifies the choice of cloud seeding strategy, seeding material types and means of their delivery.
An important consideration in CS is the proportion of precipitation in the total water content of the cloud. Looking at the curves in Figure 8, it can be seen that the water content of the rainy part (blue curve) is less than the water content of the liquid phase and even the ice phase of the clouds. It is possible to approximately estimate the ratio between rain and drop fractions as 1:10–1:5, that is, only 10–20% of the liquid-drop water content of the cloud is converted into precipitation. If we add the ice fraction here, then the share of the rain fraction will be even less and will be only 5–10% of the total water content of the cloud. This indicates the low efficiency of precipitation formation of clouds in the region. We cannot give an unequivocal explanation for this phenomenon, but there may be several reasons. This may be the influence of aerosol in a given area and the decrease in air humidity shown above. But the main factor is probably the weak participation of the ice fraction (crystals, graupels, snowflakes, etc.) in the formation of large precipitation particles, which usually accelerates the growth of large hydrometeors, in contrast to the slow condensation growth of liquid droplets. This fact must be taken into account when choosing a cloud seeding technology to increase precipitation. It is possible that the introduction of additional artificial crystals, with glaciogenic seeding, can also give the increase in the efficiency of precipitation, which is pursued in such works. However, unambiguous conclusions can only be drawn by carrying out model calculations and field experiments.
The maxima of the drop water content of clouds are observed from November to May, and the minima from June to October (Figure 10). The maxima of the ice fraction are observed from November to February. The maximum rainfall occurs from November to March. From this point of view, it is advisable to carry out CS work to intensify and increase precipitation from October to April.
From Figure 11 we roughly estimated the ratio of liquid water content in the region of positive and negative temperatures. It can be seen that the maximum droplet water content is located in the cold layer slightly above the zero isotherm, at about 0.3–0.7 km. This indicates that droplets, after rising above zero degrees, begin to actively increase in size. In this thin layer, water droplets and crystals interact in a complex way. However, the most important circumstance arising from Figure 11 is the applicability of certain seeding materials in different parts of the cloud. Under these circumstances hygroscopic seeding of the warm part can be carried out at altitudes from 1.5 to 3.5 km from sea level, and glaciogenic into a layer from 4.2 to 5.5 km. However, the droplet water content of the cold layer is greater, which means that, probably, glaciogenic seeding can be more successful than hygroscopic.
Radar data revealed that deep convective clouds with vertical extent of more than 5–8 km, top of up to 8–15 km and reflectivity of up to 50–60 dBZ form mostly in the second half of the day and in the late afternoon. These clouds usually produce showers. Considering that the zero isotherm is located approximately from 4 to 5 km (Figure 11), we can conclude that the cumulonimbus clouds of this region have a deep supercooled part. This is in agreement with the data from the analysis of the charts in Figure 10 and Figure 11. It also follows that glaciogenic seeding is a viable option and has a potential for efficient cloud seeding in the given region.
Another important pattern for planning convective clouds seeding follows from Figure 13. It shows that the most powerful and most rain producing cumulonimbus clouds with a reflectivity of more than 60 dBZ can form mainly from December to April and reach heights of 9–15 km.
From Figure 14 it follows that decline in the development of clouds is observed from about 10 am to 1 pm. Such information is very valuable when planning CS. This is especially important for flight planning and execution, where it is necessary to estimate and predict the time of takeoff and landing as accurately as possible. Based on this information, the optimal time for seeding is the period of 2 to 3 pm. At this time the earth has already received a maximum amount of solar radiation and most effectively transfers the accumulated heat to the atmosphere, initiating the development of clouds of all types, and especially convective ones, which make the greatest contribution to the balance of precipitation.
It also follows from Figure 14b that the main efforts in planning work to increase precipitation should be concentrated from January to April–May, that is, five months a year. It does not make sense to work in other months, since the probability of the appearance of clouds suitable for seeding is minimal.
This selection of a favorable period for seeding, when the probability of a working situation is high, simplifies the logistical aspects of the RE technology and shows when to try to mobilize all available resources in order to achieve maximum additional precipitation.

5. Conclusions

In this case study we carried out analysis of multi-year meteorological ground stations, upper air sounding, global reanalysis ERA-5 and radar data for the Minas Gerais State in Brazil to identify the main patterns and features in cloud climatology. Including the types and levels of cloud development, the frequency by month and during the day; the ratio of clouds warm and cold parts in different periods of the year; the ratio of clouds liquid, ice and rainwater content; average characteristics of precipitation by months of the year and time of day; multiyear trends of meteorological parameters and other characteristics.
Such detailed information is necessary when planning work on cloud seeding in order to increase precipitation. As the analysis showed, the efficiency of precipitation formation in the selected region does not exceed 5–20%, that is, only a small fraction of all cloud moisture turned into precipitation on the ground. This indicates great potential for RE works if cloud seeding can improve the efficiency of precipitation formation. Even a small change can bring a significant increase in the balance of precipitation.
Theoretically, if the estimates are correct, ideally precipitation can be increased by up to 5–20 times or by 500–2000%, instead of the 10–20% increase usually obtained in well-organized cloud seeding projects in different regions. This indicates that at this stage we are still very far from the limit of perfection of RE technologies. More precisely speaking, we are at the very beginning of their development.
At the same time, a number of important results in this paper show that cloud seeding in the study region is possible and justified.
It was found that the atmosphere during the dry season is characterized by a decrease in relative air humidity and an increase in the dew point deficit, which can complicate the activation of cloud droplets on aerosol particles.
An increase in the long-term average air temperature in the 1000–800 millibar layer by 1.1 degrees and its decrease in higher layers indicate the greenhouse effect in the near ground atmosphere, where natural and anthropogenic aerosols and gases are concentrated due to gravitational forces. This circumstance should be taken into account when choosing one or another type of seeding material for CS, which should be more efficient than the available one to produce large hydrometeors. It is advisable to conduct a separate study of the characteristics of natural and anthropogenic aerosol in the region.
The small amount of precipitation during 6 dry months suggests that RE can be very inefficient. The optimistic 20% increase in precipitation in November, December and January can add up to 40–50 mm of precipitation per month, which is of practical interest. Therefore, implementation of CS would be profitable in at least 3 months of the year, while unobvious in other 3 months.
Analysis of data from ground-based weather stations showed that there is a sufficient level of natural precipitation in the study area, which allows for hope for their significant increase, assuming that it will be possible to achieve an increase of 15–20%. In this case, the detected long-term decrease in precipitation at a level of about 20% can be partially or completely compensated. When evaluating the effect of seeding, it is necessary to take into account the trend of decreasing precipitation.
The maxima of the cloud liquid water content are observed from November to May, maxima of the ice fraction are observed from November to February and maxima of rainfall are observed from November to March. From this point of view, it is advisable to carry out CS from October to April.
Deep convective clouds form mostly in the second half of the day till the late afternoon. Most powerful and rainy producing cumulonimbus clouds form mainly from December to April. Considering that the zero isotherm is located approximately from 4 to 5 km, we can conclude that the cumulonimbus clouds of this region have a deep supercooled part.
Maximum droplet water content is located in the cold layer slightly above the zero isotherm, by about 0.3–0.7 km. Therefore, hygroscopic seeding of the warm part can be carried out at altitudes from 1.5 to 3.5 km from the sea level, and glaciogenic into a layer from 4.2 to 5.5 km. However, the droplet water content of the cold layer is greater, which means that, probably, glaciogenic seeding can be more efficient than hygroscopic.
Convective clouds producing maximum precipitation most often form at 14–15 h, which may be the most optimal time for seeding.
The weakness of the performed analysis is the lack of instrumental measurement of the typical aerosol composition, phase composition and the spectrum of cloud particles. Comparison of these characteristics for dry and rainy periods can help to identify main drivers affecting precipitation formation in the region.
Further work on the development and testing of the RE technology in the selected region can be continued along the path of numerical simulations on the scale resolving single cumulus, stratus and stratocumulus clouds in order to assess effects of hygroscopic and glaciogenic seeding on improving precipitation formation efficiency. Sensitivity numerical tests of precipitation amount at different intensities of seeding and by seeding different places of clouds (base, top, inside on different levels) would be of particular interest.
The next step may be full-scale cloud seeding field tests, the purpose of which will be to assess the agreement with the theoretical provisions obtained in the previous stages, including in this particular study. After obtaining positive field results, it will be possible to develop a strategy and logistics for large-scale work to increase precipitation in the most optimal way, justified and tested in the previous stage.

Author Contributions

Conceptualization, methodology, data curation, original draft preparation A.M.A.; supervision M.T.A.; data curation, B.P.K.; methodology, investigation, S.J.P. and R.P.B.; data curation, H.H.; writing—review and editing A.A.M. and O.A.Y.; data curation, S.R.H.; formal analysis, E.S.; data curation D.A.S.; visualization S.E.; project administration H.K. All authors have read and agreed to the published version of the manuscript.

Funding

This research received no external funding.

Informed Consent Statement

Not applicable.

Data Availability Statement

Upper air sounding data are available on the University of Wyoming site https://weather.uwyo.edu/upperair/sounding.html, accessed on 2 July 2023, global climate ECMWF reanalysis dataset ERA-5 is available on the Copernicus Climate Data Store https://cds.climate.copernicus.eu/cdsapp#!/dataset/reanalysis-era5-pressure-levels, accessed on 2 July 2023. Readers can request the ground stations and radar datasets by contacting [email protected].

Acknowledgments

The radiosonde and reanalysis data used in this manuscript are publicly available at the online Data Pools of the University of Wyoming and European Centre for Medium-Range Weather Forecasts. Radar and ground station data were kindly provided by the Brazilian National Institute of Meteorology. The authors thankfully acknowledge all technicians, engineers and meteorologists who were responsible for collecting the primary data, for maintaining and calibrating the instruments and the technical systems that served as the data sources in this analysis.

Conflicts of Interest

The authors declare no conflict of interest.

Abbreviations

RERain enhancement
CSCloud seeding
UNUnited Nations
WMOWorld Meteorological Organization
FAOFood and Agriculture Organization
3DThree-dimensional space
ERAEuropean Environment Agency
ECMWFEuropean Center for Meteorological Weather Forecast
ASLAbove sea level
dBZDecibels relative to equivalent radar reflectivity factor Z
CAPEConvective Available Potential Energy (J/kg)
LIFTConvective Available Potential Energy (J/kg)

References

  1. UN-Water. Policy Brief Climate Change and Water; UN-Water: Geneva, Switzerland, 2019; pp. 1–8. [Google Scholar]
  2. Unfried, K.; Kis-Katos, K.; Poser, T. Water scarcity and social conflict. J. Environ. Econ. Manag. 2022, 113, 102633. [Google Scholar] [CrossRef]
  3. Ito, S.; El Khatib, S.; Nakayama, M. Conflict over a hydropower plant project between Tajikistan and Uzbekistan. Int. J. Water Resour. Dev. 2016, 32, 692–707. [Google Scholar] [CrossRef]
  4. Murthy, S.L.; Mendikulova, F. Water, Conflict, and Cooperation in Central Asia. Vt. J. Environ. Law 2017, 18, 400–454. [Google Scholar]
  5. Wyman, R.J. The Effects of Population on the Depletion of Fresh Water. Popul. Dev. Rev. 2013, 39, 687–704. [Google Scholar] [CrossRef]
  6. UN-Water. UN-Water Analytical Brief on Unconventional Water Resources; UN-Water: Geneva, Switzerland, 2020; 59p, Available online: https://www.unwater.org/app/uploads/2020/08/UN-Water-Analytical-Brief-on-Unconventional-Water-Resources.pdf (accessed on 15 March 2022).
  7. Qadir, M.; Smakhtin, V.; Koo-Oshima, S.; Guenther, E. (Eds.) Unconventional Water Resources; Springer Nature AG: Basel, Switzerland, 2022; Available online: https://link.springer.com/book/9783030901455#aboutBook (accessed on 20 January 2023).
  8. Abshaev, A.M.; Flossmann, A.; Siems, S.T.; Prabhakaran, T.; Yao, Z.; Tessendorf, S. Rain Enhancement through Cloud Seeding. In Unconventional Water Resources; Qadir, M., Smakhtin, V., Koo-Oshima, S., Guenther, E., Eds.; Springer: Cham, Switzerland, 2022. [Google Scholar] [CrossRef]
  9. Abshaev, A.M.; Abshaev, M.T.; A Adzhiev, K.; Gekkieva, J.M.; A Sinkevich, A.; Mikhailovskii, Y.P. On the influence of glaciogenic seeding on the radar characteristics of hail clouds. IOP Conf. Series Earth Environ. Sci. 2021, 840, 012025. [Google Scholar] [CrossRef]
  10. Abshaev, M.T.; Zakinyan, R.G.; Abshaev, A.M.; Zakinyan, A.R.; Ryzhkov, R.D.; Wehbe, Y.; Al Mandous, A. Atmospheric conditions favorable for the creation of artificial clouds by a jet saturated with hygroscopic aerosol. Atmospheric Res. 2022, 277, 106323. [Google Scholar] [CrossRef]
  11. Abshaev, M.T.; Abshaev, A.M.; Aksenov, A.A.; Fisher, J.V.; Shchelyaev, A.E.; Al Mandous, A.; Wehbe, Y.; El-Khazali, R. Study of the Possibility of Stimulating Cloud Convection by Solar Radiation Energy Absorbed in an Artificial Aerosol Layer. Atmosphere 2023, 14, 86. [Google Scholar] [CrossRef]
  12. Abshaev, M.T.; Abshaev, A.M.; Aksenov, A.A.; Fisher, J.V.; Shchelyaev, A.E.; Al Mandous, A.; Al Yazeedi, O.; Wehbe, Y.; Sîrbu, E.; Sîrbu, D.A.; et al. Results of Field Experiments for the Creation of Artificial Updrafts and Clouds. Atmosphere 2023, 14, 136. [Google Scholar] [CrossRef]
  13. Abshaev, M.T.; Abshaev, A.M.; Aksenov, A.A.; Fisher, I.V.; Shchelyaev, A.E.; Al Mandous, A.; Wehbe, Y.; El-Khazali, R. CFD simulation of updrafts initiated by a vertically directed jet fed by the heat of water vapor condensation. Sci. Rep. 2022, 12, 9356. [Google Scholar] [CrossRef] [PubMed]
  14. Cheng, P.; Shen, T.; Luo, H.; Chen, Q.; Pang, C.; Huang, S. Statistical test and analysis of artificial rainfall enhancement effect in the upper Shiyang River Basin. Arid. Land Geogr. 2021, 44, 962–970. [Google Scholar] [CrossRef]
  15. Flossmann, A.I.; Manton, M.; Abshaev, A.; Bruintjes, R.; Murakami, M.; Prabhakaran, T.; Yao, Z. Review of Advances in Precipitation Enhancement Research. Bull. Am. Meteorol. Soc. 2019, 100, 1465–1480. [Google Scholar] [CrossRef]
  16. Liang, H.; Abshaev, M.T.; Abshaev, A.M.; Huchunaev, B.M.; Griffiths, S.; Zou, L. Water vapor harvesting nanostructures through bioinspired gradient-driven mechanism. Chem. Phys. Lett. 2019, 728, 167–173. [Google Scholar] [CrossRef]
  17. Abshaev, M.T.; Abshaev, A.M.; Barekova, M.V.; Malkarova, A.M. Manual on Organization and Execution of Hail Suppression Projects; Pechatniy Dvor ltd.: Nalchik, Russia, 2014; 508p. [Google Scholar]
  18. DeFelice, T.; Axisa, D. Modern and prospective technologies for weather modification activities: Developing a framework for integrating autonomous unmanned aircraft systems. Atmos. Res. 2017, 193, 173–183. [Google Scholar] [CrossRef]
  19. Al Hosari, T.; Al Mandous, A.; Wehbe, Y.; Shalaby, A.; Al Shamsi, N.; Al Naqbi, H.; Al Yazeedi, O.; Al Mazroui, A.; Farrah, S. The UAE Cloud Seeding Program: A Statistical and Physical Evaluation. Atmosphere 2021, 12, 1013. [Google Scholar] [CrossRef]
  20. Manton, M.J.; Warren, L. A Confirmatory Snowfall Enhancement Project in the Snowy Mountains of Australia. Part II: Primary and Associated Analyses. J. Appl. Meteorol. Clim. 2011, 50, 1448–1458. [Google Scholar] [CrossRef]
  21. Freud, E.; Koussevitzky, H.; Goren, T.; Rosenfeld, D. Cloud microphysical background for the Israel-4 cloud seeding experiment. Atmospheric Res. 2015, 158–159, 122–138. [Google Scholar] [CrossRef]
  22. List, R.; Gabriel, K.R.; Silverman, B.A.; Levin, Z.; Karacostas, T. The Rain Enhancement Experiment in Puglia, Italy: Statistical Evaluation. J. Appl. Meteorol. 1999, 38, 281–289. [Google Scholar] [CrossRef]
  23. DeFelice, T.; Golden, J.; Griffith, D.; Woodley, W.; Rosenfeld, D.; Breed, D.; Solak, M.; Boe, B. Extra area effects of cloud seeding—An updated assessment. Atmospheric Res. 2014, 135-136, 193–203. [Google Scholar] [CrossRef]
  24. Abshaev, M.T.; Abshaev, A.M.; Malkarova, A.M.; Mizieva, Z.Y. Radar estimation of water content in cumulonimbus clouds. Izv. Atmospheric Ocean. Phys. 2009, 45, 731–736. [Google Scholar] [CrossRef]
  25. Eke, J.; Yusuf, A.; Giwa, A.; Sodiq, A. The global status of desalination: An assessment of current desalination technologies, plants and capacity. Desalination 2020, 495, 114633. [Google Scholar] [CrossRef]
  26. Wehbe, Y.; Temimi, M. A Remote Sensing-Based Assessment of Water Resources in the Arabian Peninsula. Remote Sens. 2021, 13, 247. [Google Scholar] [CrossRef]
  27. Wehbe, Y.; Temimi, M.; Ghebreyesus, D.T.; Milewski, A.; Norouzi, H.; Ibrahim, E. Consistency of precipitation products over the Arabian Peninsula and interactions with soil moisture and water storage. Hydrol. Sci. J. 2018, 63, 408–425. [Google Scholar] [CrossRef]
  28. WMO. Documents on Weather Modification. In Proceedings of the Expert Team on Weather Modification Research, Phitsanulok, Thailand, 17–19 March 2015. [Google Scholar]
  29. Cunha, A.P.M.A.; Zeri, M.; Leal, K.D.; Costa, L.; Cuartas, L.A.; Marengo, J.A.; Tomasella, J.; Vieira, R.M.; Barbosa, A.A.; Cunningham, C.; et al. Extreme Drought Events over Brazil from 2011 to 2019. Atmosphere 2019, 10, 642. [Google Scholar] [CrossRef] [Green Version]
  30. Beck, H.E.; Zimmermann, N.E.; McVicar, T.R.; Vergopolan, N.; Berg, A.; Wood, E.F. Present and future Köppen-Geiger climate classification maps at 1-km resolution. Sci. Data 2018, 5, 180214. [Google Scholar] [CrossRef] [PubMed] [Green Version]
  31. Peel, M.C.; Finlayson, B.L.; McMahon, T.A. Updated world map of the Köppen-Geiger climate classification. Hydrol. Earth Syst. Sci. 2007, 11, 1633–1644. [Google Scholar] [CrossRef] [Green Version]
  32. The World Bank Climate Change Knowledge Portal 2.0. Available online: https://climateknowledgeportal.worldbank.org/ (accessed on 28 January 2022).
  33. World Bank Group. World Bank Group Climate Change Action Plan 2021–2025: Supporting Green, Resilient, and Inclusive Development; World Bank: Washington, DC, USA, 2021; Available online: http://hdl.handle.net/10986/35799 (accessed on 2 July 2023).
  34. Khater, A.; Mohammadi, M.; Mohamad, A.; Nezhad, A.S. Dynamics of temperature-actuated droplets within microfluidics. Sci. Rep. 2019, 9, 3832. [Google Scholar] [CrossRef] [Green Version]
  35. Hersbach, H.; Rosnay, P.; Bell, B.; Schepers, D.; Al, E. Operational global reanalysis: Progress, future directions and synergies with NWP. ERA Rep. Ser. 2018, 27, 1–63. [Google Scholar]
  36. Dixon, M.; Wiener, G. TITAN: Thunderstorm identification, tracking, analysis, and nowcasting—A radar-based methodology. J. Atmos. Ocean. Technol. 1993, 10, 785–797. [Google Scholar] [CrossRef]
  37. Mather, G.K.; Terblanche, D.E.; Steffens, F.E.; Fletcher, L. Results of the South African Cloud-Seeding Experiments Using Hygroscopic Flares. J. Appl. Meteorol. 1997, 36, 1433–1447. [Google Scholar] [CrossRef]
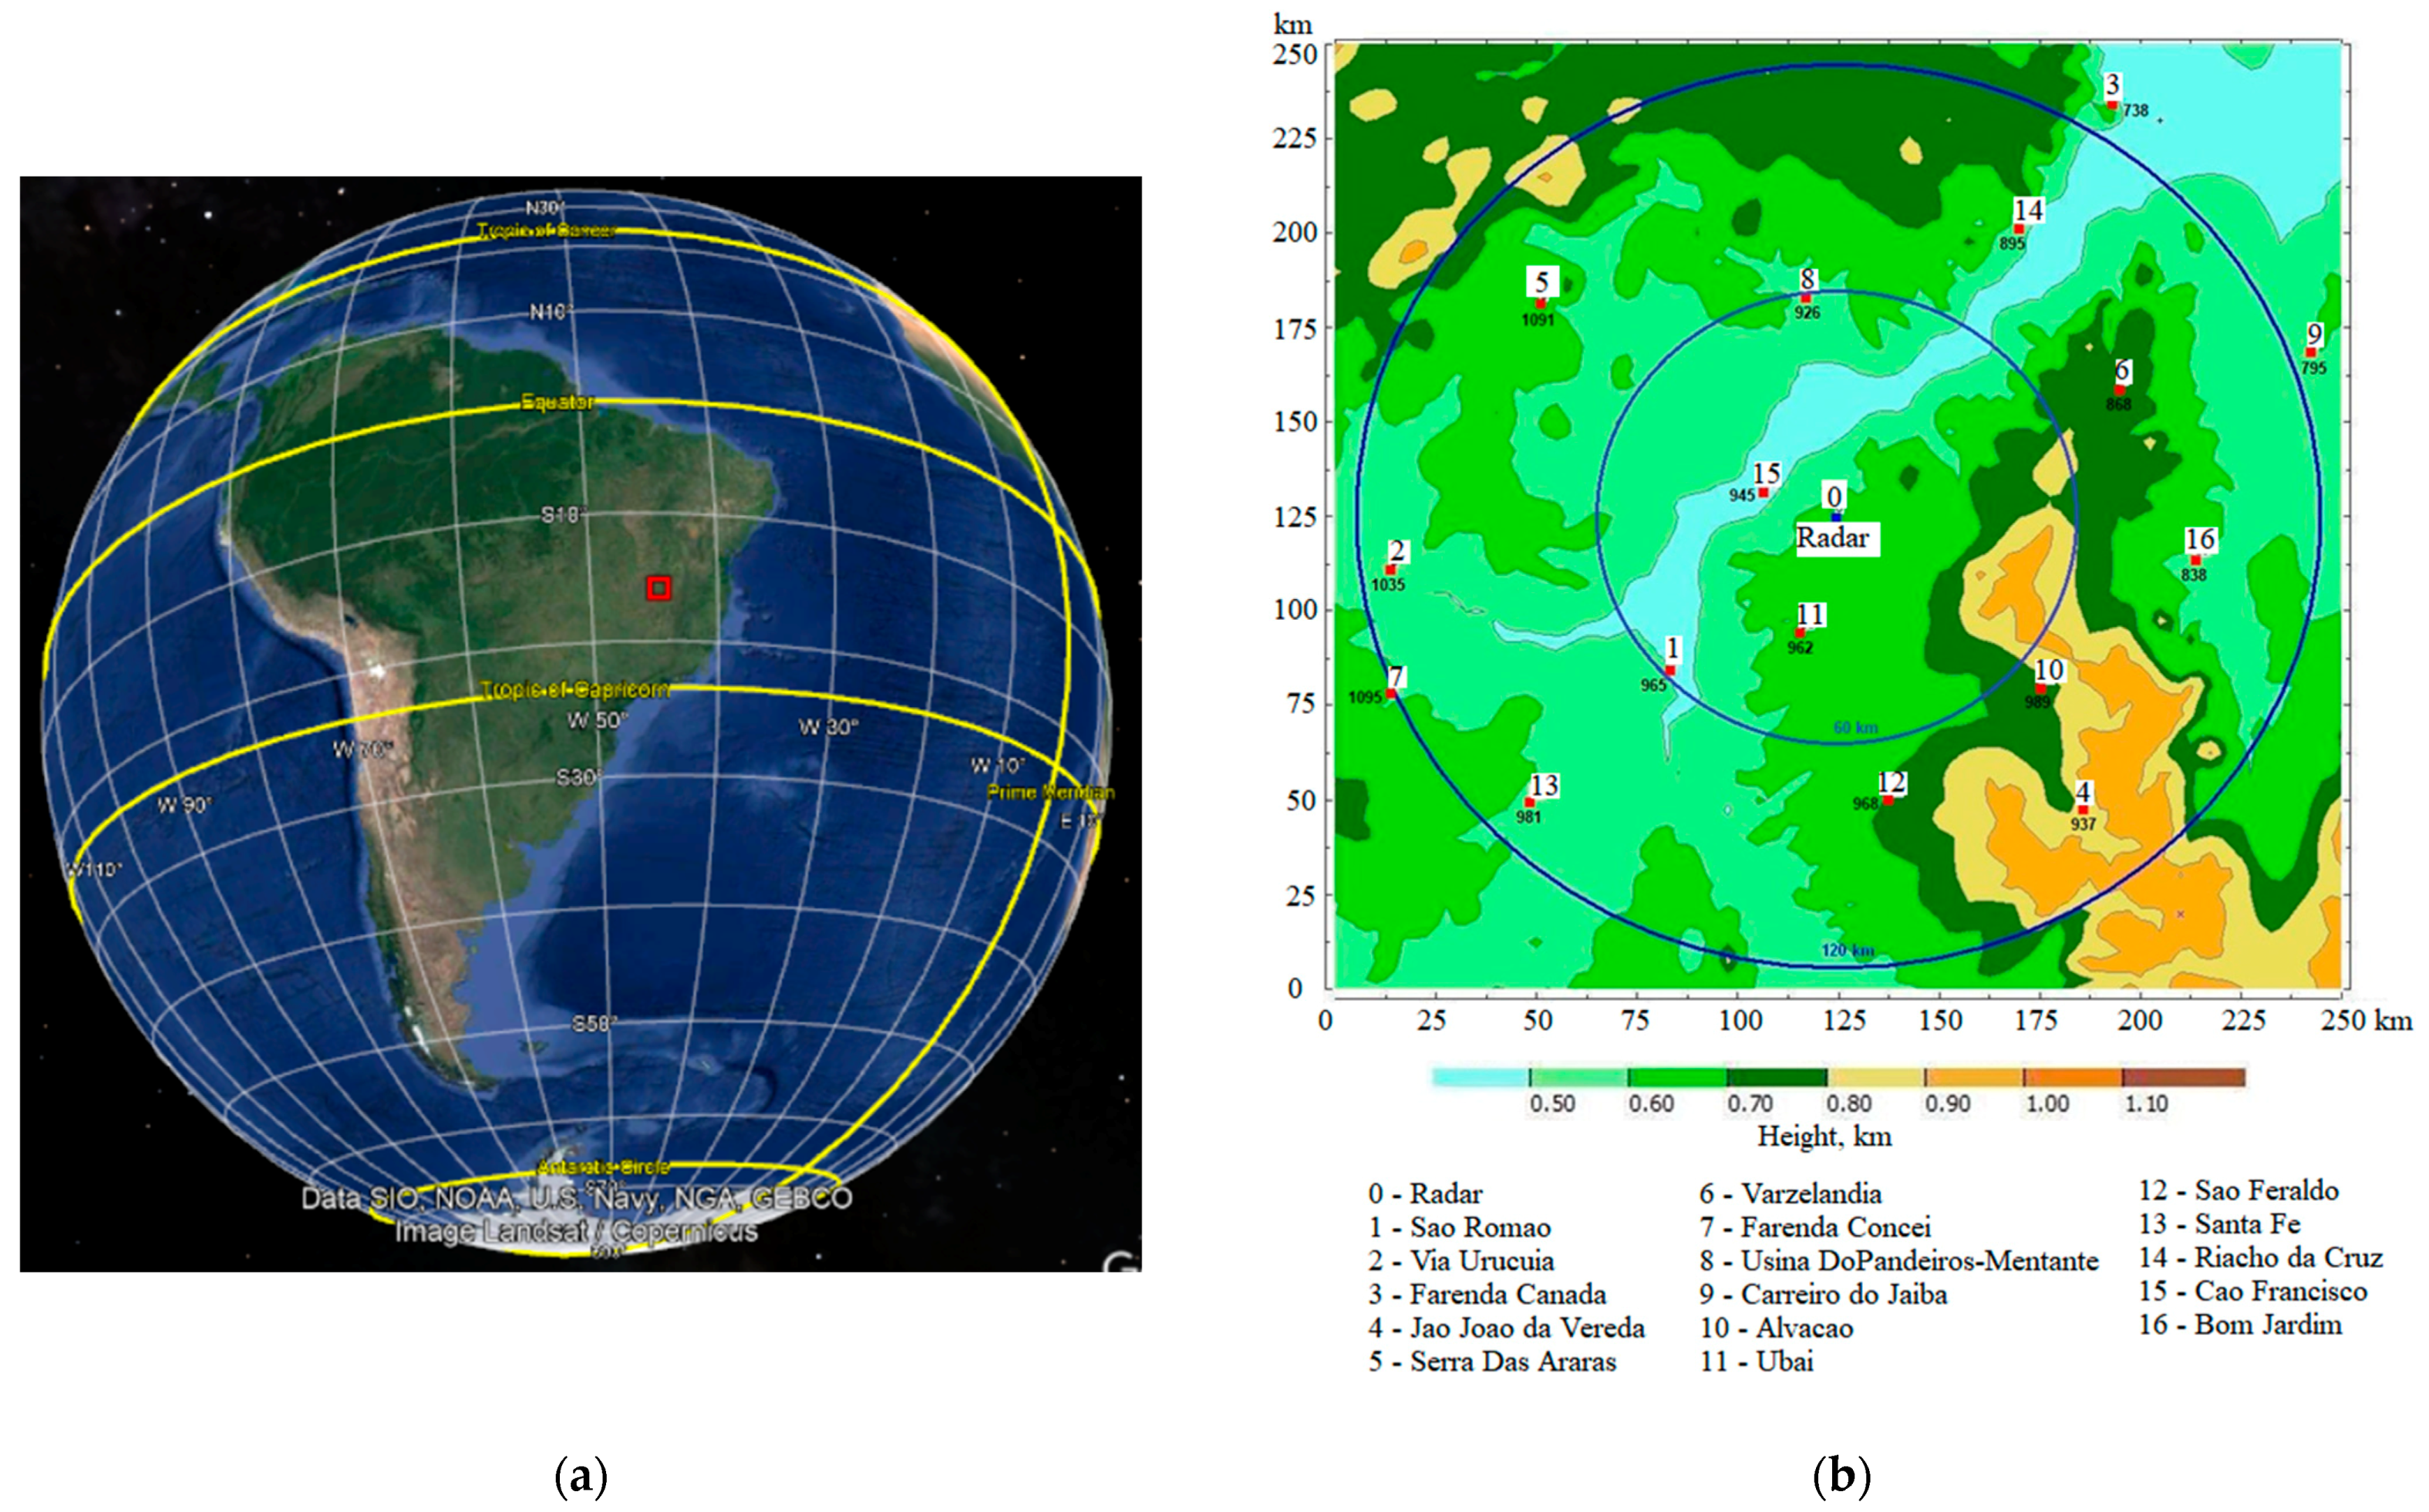
Figure 1. Study area marked by red square (a) on a Google Map [online], South America. Available through: https://earth.google.com/ (accessed on 28 June 2022) and on Topographical map (b) of Januária territory with numbered radar and ground weather stations names.
Atmosphere 14 01227 g001
Figure 2. State of Minas Gerais, Brazil: (a)—Climate type bounded by the red crest of the region of concern; (b)—monthly precipitation distribution in the period 1991–2020; trends of annual precipitation (c) and maximum number of consecutive dry days (d) in the period 1970–2020. Data source for (bd)—World Bank, https://climateknowledgeportal.worldbank.org/country/brazil/climate-data-historical, accessed on 15 June 2022.
Atmosphere 14 01227 g002
Figure 3. Average monthly profiles of meteorological parameters derived from radiosonde data for dry and rainy periods: (a)—temperature; (b)—dew point deficit; (c)—relative humidity; (d)—absolute humidity; wind speed (e) and direction (f).
Atmosphere 14 01227 g003aAtmosphere 14 01227 g003b
Figure 4. Trends of sounding derived parameters over 1973–2022 period in the near surface atmosphere layer 1000–800 mb: (a)—Temperature, deg. C; (b)—Relative humidity, %; (c)—Absolute humidity, g/kg; (d)—Dew point deficit, deg. C. Curve breaks are due to missing radiosounding data.
Atmosphere 14 01227 g004aAtmosphere 14 01227 g004b
Figure 5. Trends of sounding derived convective instability indices over 1974–2022 period: (a)—CAPE Convective Available Potential Energy (J/kg) and (b)—LIFT index. Curve breaks are due to missing radiosounding data.
Atmosphere 14 01227 g005
Figure 6. Annual averaged precipitation for the study area (a); monthly averaged precipitation (b) and annual precipitation trends (c) for meteorological station Bom Jardim (code 1643026). Period 2000–2018.
Atmosphere 14 01227 g006
Figure 7. Average monthly temperature stratification of the atmosphere according to ERA-5 reanalysis data for the period 1979–2019.
Atmosphere 14 01227 g007
Figure 8. Vertically integrated specific rain, liquid droplets and ice water content (g/kg) over the period 1979–2019.
Atmosphere 14 01227 g008
Figure 9. Geographical distribution of integrated: (a)—cloud liquid water content; (b)—cloud ice water content and (c)—specific rainwater content over the period of 1979–2019. Here the horizontal axis is longitude and vertical is latitude.
Atmosphere 14 01227 g009
Figure 10. Altitude-monthly distributions of integrated fractions of: (a)—cloud liquid water content; (b)—cloud ice water content and (c)—specific rainwater content over the period of 1979–2019.
Atmosphere 14 01227 g010
Figure 11. Altitude-monthly distributions of temperature and cloud liquid water content.
Atmosphere 14 01227 g011
Figure 12. Cloud maximum reflectivity, top height and time of occurrence distribution. Here the vertical axis is height above sea level in km, color palette—time and horizontal axis is: (a)—radar reflectivity in dBZ and (b)—time of day.
Atmosphere 14 01227 g012aAtmosphere 14 01227 g012b
Figure 13. Monthly average distributions of cloud top height for different reflectivity levels.
Atmosphere 14 01227 g013
Figure 14. Storm frequency distribution from time of day (a) and month (b) for different values of radar reflectivity.
Atmosphere 14 01227 g014
Table 1. Conditional division of the year by dry and rainy months according to the criterion of 150 mm of average (for period 1991–2020) monthly precipitation.
MonthAverage Monthly Precipitation, mmGroupOptimistic 20% Increase, mmIdeal Cloud Seeding Benefit
1January226.79Rainy45.4High
2February144.34Rainy28.9Average
3March163.11Rainy32.6Average
4April74.8Dry15.0Low
5May29.52Dry5.9Extremely low
6June11.94Dry2.4Extremely low
7July10.57Dry2.1Extremely low
8August12.61Dry2.5Extremely low
9September42.69Dry8.5Low
10October108.61Dry21.7Average
11November194.8Rainy39.0High
12December245.98Rainy49.2High
Table 2. Annual, six- and four-month precipitation amount given as a total observed precipitation in each time period.
NNCodeNameDatePrecipitation, mm (%)
October–SeptemberOctober–MarchNovember–February
11645000Sao Romao2000–2019
(1952–2019)
964.8875.1
(90.7%)
692.2
(71.7%)
21645005Via Urucuia2000–2019
(1967–2019)
1034.9951.8
(92.0%)
734.3
(71.0%)
41644028Jao Joao da Vereda2000–2019
(1975–2019)
936.7858.1
(91.6%)
669.2
(71.4%)
51545002Serra Das Araras2000–2019
(1992–2019)
1090.6988.9
(90.7%)
759.7
(69.7)
61544030Varzelandia2000–2019
(1993–2019)
868.4805.6
(92.8%)
637.6
(73.4%)
71645019Fazenda Concei2000–2019
(1984–2019)
1094.8999.7
(91.3)
770.1
(70.3)
81544032Usina Do Pandeiros2000–2019
(1994–2019)
926.2842.4
(90.9%)
644.3
(69.6%)
101644032Alvacao2000–2019
(2000–2019)
988.7909.9
(92.0%)
716.8
(72.5%)
111644033Ubai2000–2019
(2000–2019)
961.5880.6
(91.6%)
671.6
(69.8%)
121644034Sao Geraldo2000–2019
(2000–2019)
968.4896.3
(92.5%)
683.6
(70.6%)
131645020Santa Fe2000–2019
(2000–2019)
981.0901.6
(91.9%)
711.6
(72.5%)
141544037Riacho da Cruz2000–2019
(2000–2019)
894.5817.7
(91.4%)
630.7
(70.5%)
151544012Sao Francisco2001–2019)
(1938–2019)
945.2876.5
(91.8%)
653.2
(69.1%)
161643026Bom Jardim2000–2019
(1999–2019)
837.7781.2
(93.3%)
615.5
(73.5%)
Note: The Date column shows the years for which the analysis was conducted (from 2000 to 2019), in brackets are the years for which meteorological observations are available for a given weather station.
Table 3. The average number of days with precipitation in the period 2000–2019.
NNCodeNameNumber of Rainy Days
October–SeptemberOctober–MarchNovember–February
11645000Sao Romao81.771.553.0
21645005Via Urucuia56.954.241.3
41644028Jao Joao da Vereda72.061.843.2
51545002Serra Das Araras83.172.354.0
61544030Varzelandia60.252.339.8
71645019Fazenda Consei77.170.752.4
81544032Usina Do Pandeiros67.960.445.1
101644032Alvacao74.764.947.4
111644033Ubai75.365.948.1
121644034Sao Geraldo58.650.636.7
131645020Santa Fe57.353.740.8
141544037Riacho da Cruz63.554.740.7
151544012Sao Francisco74.162.946.7
161643026Bom Jardim62.555.141.4
Mean
(min–max)
69
(57–83)
61
(51–72)
45
(37–54)
Table 4. Decline of annual, six- and four-month precipitation amount given as a total observed precipitation in each time period from 2000 to 2019.
NNCodeNameOctober–SeptemberOctober–MarchNovember–February
Δ (mm)Δ (%)Δ (mm)Δ (%)Δ (mm)Δ (%)
11645000Sao Romao357312882823429
21645005Via Urucuia125121621611115
41644028Jao Joao da Vereda272252522625232
51545002Serra Das Araras136121621519823
61544030Varzelandia357312882823429
71645019Fazenda Consei14012919243
81544032Usina Do Pandeiros17017144169013
101644032Alvacao204192522519825
111644033Ubai204191261312617
121644034Sao Geraldo1361316217548
131645020Santa Fe180172162219825
141544037Riacho da Cruz238231802019827
151544012Sao Francisco448383743628937
161643026Bom Jardim187202162516224
Mean 212212082116222
Disclaimer/Publisher’s Note: The statements, opinions and data contained in all publications are solely those of the individual author(s) and contributor(s) and not of MDPI and/or the editor(s). MDPI and/or the editor(s) disclaim responsibility for any injury to people or property resulting from any ideas, methods, instructions or products referred to in the content.