Abstract
Particulate matter (PM) pollution is a crucial environmental issue. Considering its adverse health impacts, especially on children’s immune systems, Korean regulations require annual PM2.5 measurements in daycare centers. Therefore, we developed a low-cost PM2.5 sensor calibration model for measuring the indoor PM concentrations in daycare centers using long short-term memory (LSTM) algorithms. Moreover, we trained the model to predict the PM2.5 based on temperature and humidity, and optimized its hyperparameters. The model achieved a high accuracy and outperformed traditional calibration methods. The optimal lookback period was 76, which led to a high calibration performance with root mean and mean squared errors, a coefficient of determination, and mean absolute errors of 3.57 and 12.745, 0.962, and 2.7, respectively. The LSTM model demonstrated a better calibration performance than those of the linear (r2 = 0.57) and multiple (r2 = 0.75) linear regression models. The developed calibration model provided precise short-term measurement values for the optimal management of indoor PM concentrations. This methodology can be applied to similar environments to obtain new learning and hyper-parameters. Our results will aid in improving the accuracy of low-cost sensors for measuring indoor PM concentrations, thereby providing cost-effective solutions for enhancing children’s health and well-being in daycare centers and other multiuse facilities.
1. Introduction
Recently, particulate matter (PM) warnings have increased in South Korea, leading to growing concerns regarding the harmful effects of PM10 and PM2.5 [1]. In particular, PM2.5 pollution has become a substantial environmental issue and caused an increased interest in the social costs associated with PM because of its severe health consequences. According to the World Health Organization (WHO), Geneva, Switzerland, air pollution contributes to approximately three million premature deaths globally, and approximately 70% of these deaths occur in southeast Asia and the Western Pacific. Globally, only 1 out of every 100,000 individuals residing in cities lives under conditions that meet the WHO air quality standards [2]. Furthermore, infants and young children have more vulnerable immune systems than those of adults and are therefore susceptible to pollutants, owing to their high air intake per unit of body weight [3].
A study investigating the impact of PM2.5 concentration on asthma hospitalization rates elucidated that the probability of hospitalization increased by 1.05% for every 10 μg/m3 increment in the under 15 age group. Furthermore, the risk of hospitalization increased significantly in the 0–4 age group, with a 1.60% increase in risk for every 10 μg/m3 increment [4]. Thus, accurate and timely information regarding changes in PM concentrations is urgently required to enable effective and timely responses to these changes.
The Ministry of Environment of South Korea has recently reinforced the PM10 and PM2.5 standards for indoor air in five facility groups, including daycare and postpartum care centers, indoor child playing and older adult care facilities, and medical institutions. To protect vulnerable groups, the standards have been lowered from 100 to 75 μg/m3 and from 70 to 35 μg/m3 for PM10 and PM2.5, respectively. Moreover, local governments have been asked to strengthen the supervision and management of these facilities. Furthermore, the Indoor Air Quality Control in Public-Use Facilities Act (2014) states that a measuring network should be installed in multi-use facilities to determine the actual state of the indoor air quality at all times. The indoor measurement network comprises national and local government networks. The National Automatic Measurement Network operates in 14 public-use facilities, such as underground subway stations, underground commercials, and daycare centers, whereas the local government network operates in 35 public-use facilities, which primarily comprise underground stations. For the measurements, they consider the characteristics of these facilities and the PM10, PM 2.5, CO2, CO, and NO2 concentrations. Based on these data, indoor air quality information (www.inair.or.kr (accessed on 14 June 2023)) is provided to the users of the multi-use facilities and the general public [5].
PM measurement techniques include gravimetric, beta-ray, and light-scattering methods. In South Korea, the national PM air quality is assessed using gravimetric and beta-ray methods. The gravimetric method quantifies the concentration of PM2.5 by weighing the fine dust collected using filter paper. In contrast, the beta-ray method automatically measures the concentration by determining the amount of beta rays absorbed by the PM [6,7]. Although the gravimetric method is notably precise, it first collects PM for 24 h and then requires a considerable amount of time to measure the weight at a constant temperature and humidity. In contrast, the beta-ray method is less accurate than the gravimetric method, but can produce measurements at hourly intervals. Light-scattering low-cost PM2.5 sensors are a paradigm for solving the cost problem [8]. Morawska et al. [9] conducted a thorough literature review and reported that low-cost sensors perform well in the laboratory, with a high degree of linearity, but suffer considerable performance degradation when used under natural conditions.
Real-time concentration measurements using low-cost sensors are crucial, because indoor PM concentrations change dynamically depending on anthropogenic activity. Recent technological advancements have made the distribution of portable and low-cost air pollution sensors possible over wide areas for source and personal exposure estimations, epidemiological investigations, air monitoring, and citizen science applications [10,11,12,13,14,15]. However, a general approach is used for sensor calibration in low-cost air pollution sensors, which involves conducting step-by-step repeatability experiments in a controlled laboratory environment, such as the standard calibration methods used in atmospheric chemistry and meters. The second method involves calibrating the sensors through comparative measurements at the same location via an automatic Federal Equivalent Method (FEM) monitoring device, which has already been corrected for the national air quality standard using the Federal Reference Method (FRM). To assess the applicability of these low-cost sensors, their performance (accuracy, bias, and reproducibility, etc.) and calibration have been evaluated by placing them at the same location as FEM monitoring devices [9,16,17,18].
In South Korea, a performance certification system has been implemented for PM2.5 low-cost sensor measuring instruments, which allocates a grade (ranging from 1–3, with an out-of-grade option) based on the performance evaluation of the instrument. This system provides PM meter quality information to users, enabling them to make accurate decisions regarding their use [19].
In recent studies, long short-term memory (LSTM) has been used for air pollution prediction, such as traffic volume and wind-power prediction via machine learning methods. The use of weather data, weather forecasts, and air measurement network data for predicting more than 48 h air quality is being further explored [20,21,22,23,24].
Castell et al. [12] installed low-cost sensors for NO2 monitoring in 17 Oslo kindergartens and generated a detailed air quality map by merging the sensor data with urban model data, thereby improving the map and providing information to the staff and parents of the participating kindergartens. Park et al. [22] collected fine dust data from the Seoul area from 2005 to 2016 and evaluated the performance of a fine dust prediction model using linear regressions, reproducible neural networks, and LSTM. They found that LSTM improved the performance of the root mean squared error (RMSE) by 500% compared to the prior regressions. In a large building at Qatar University, Doha, a low-cost sensor-based internet of things (IoT) system was used to measure the indoor air quality (CO2, CO, SO2, NO2, O3, and Cl2) and evaluate its suitability and scalability [25].
Hagan et al. [26] evaluated the performance of low-cost electrochemical sensors for SO2 measurements in Hawaii and compared them with that of a regulatory-grade instrument based on the FRM. To calibrate the sensors, they tested the performance of three algorithms: linear and hybrid linear nonparametric regressions and k-nearest neighbor (k-NN). The k-NN correction performed exceptionally well, with the RMSE, MAE, and coefficient of determination (r2) being less than 7 ppb and 4 ppb and greater than 0.997, respectively.
Sayahi et al. [27] conducted a study in Salt Lake City over a period of 320 d from 2016 to 2017. They evaluated the performances of low-cost fine PM sensors (Plantower PMS), comparing them with that of a reference instrument (TEOM) at the same location. During the winter, PMS-1003 overestimated the PM2.5 concentrations by a factor of 1.89 (compared to TEOM (PM2.5 < 40 μg/m3)), whereas PMS-5003 overestimated the PM2.5 concentrations by a factor of 1.47. Furthermore, one of the sensors exhibited a similar performance to that of the reference instrument. This study emphasized that various correction factors and seasonal and conditional calibrations are required for the same sensor model.
Zimmerman et al. [28] used low-cost sensors and reference equipment for measuring the air quality (CO2, CO, NO2, and O3) at the Carnegie Mellon University Campus, Pittsburgh, from August 2016 to February 2017. They calibrated the low-cost sensors using linear and multiple linear regression analyses and machine-learning-based random forest (RF) models of the data obtained in the laboratory and field. The RF model matched the other calibration models for the CO measurement and performed substantially better than the other models for the NO2, CO2, and O3 measurements. Furthermore, its accuracy and precision improved over the 16-week testing period.
To understand the characteristics of fine dust, this study evaluated the performance and calibration of low-cost fine dust sensors in the indoor environment of child daycare centers, where FEM meters were installed. Furthermore, we used these results as basic data for improving and managing future indoor air quality.
Our findings will aid in the development of indoor activity guidelines for the optimal management of indoor PM concentrations.
2. Materials and Methods
2.1. Location and Design
To analyze the PM characteristics, we measured the PM10 concentration from 6 October to 31 December 2018 (86 d) at a daycare center in Incheon Metropolitan City, South Korea, where an indoor air quality measurement network was established (Figure 1). Furthermore, we evaluated and calibrated a beta-ray absorption method (FEM) meter and low-cost PM sensor. Table 1 represents the specific specifications and characteristics of the equipment (low-cost sensor and FEM) used in this study.
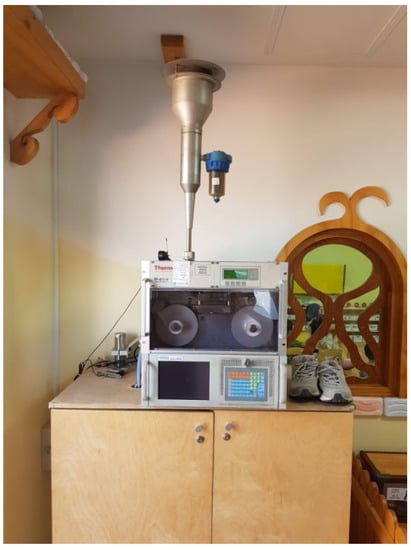
Figure 1.
Particulate matter 2.5 (PM2.5)-measuring instrument in the daycare center.

Table 1.
Specifications of the low-cost sensor and Federal Equivalent Method (FEM) meter.
2.2. Evaluation and Calibration of Sensor Performance Data
The performance evaluation and calibration of the low-cost fine dust sensors were conducted using repeatability experiments performed in laboratory chambers and comparison measurements via automatic beta-ray meters, which were calibrated using the national reference system in the environmental atmosphere. Based on the results of the comparative measurements at the same location as a beta-ray meter in an indoor environment, multiple regressions and recurrent neural networks (RNNs) were calibrated and used for the performance evaluation and calibration of the low-cost fine dust sensors [26,28,29,30].
2.2.1. Multiple Regression Analysis
A regression analysis is a statistical method that predicts how explanatory variables (of a response variable) affect a response variable, where changes in the response variable can be interpreted with respect to the explanatory variable [31]. A multiple regression analysis and the least squares method, which minimizes the sum-of-squares errors and predictor variables, were used to derive a linear regression equation (Equation (1)) that predicted the change in the dependent variable, owing to the changes in two or more independent variables [32].
In addition, when Equation (2) is calculated for n data points, the regression equation has the same matrix form as that in Equation (3).
where x denotes the value describing the variable to be predicted as the kth predictor and is a response variable associated with the predictors.
In this study, corrections were made using the temperature, humidity, CO2, and holiday (no school) data measured at the daycare centers.
2.2.2. RNN and LSTM
RNNs can process long sequence information; however, their performance decreases as the length of this sequence information increases. This is called the long-term dependency problem. LSTM is a variant of the RNN model used to overcome this problem [8,33]. The FEM meter and low-cost sensor measurements were corrected based on LSTM (Figure 2) and an artificial neural network that recognized patterns in the time-series data.
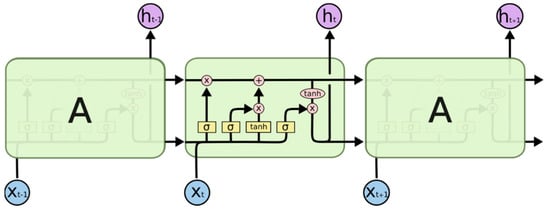
Figure 2.
Long short-term memory (LSTM) architecture.
LSTM comprises four layers with a recursive architecture. The core of LSTM is a continuous cell state called a conveyor belt that enters through the gate. The data from the conveyor belt are transmitted without any changes. LSTM can add or delete information through the input, forget, and output gates. The gates transmit information preemptively and continue learning by removing previous data. The mathematical formula for LSTM, which is calculated using the LSTM gate vector, is as follows.
where is a forget gate vector weight that remembers the previous cell state; is an input gate vector weight that obtains new information; is an output gate vector that selects an output candidate; is the input vector; is the output vector; is a cell state vector; are a parameter matrix and vector, respectively; and , , and are the gate vectors. and tanh are the sigmoid and hyperbolic tangent functions, respectively, which are the two types of activation functions used in LSTM.
2.2.3. Sequence Data Generation
LSTM learns data using sequence data. Therefore, the stream of fine dust measurement data was first converted into sequence data for use as input data. We used the Riding Studio method to convert the time-series data stream into a sequential dataset (Figure 3).
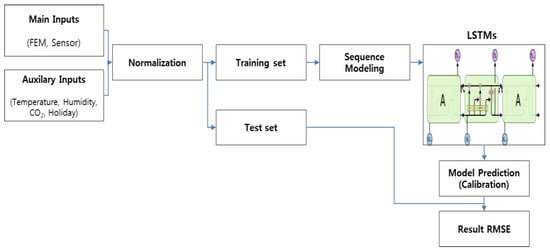
Figure 3.
Flow chart of the suggested PM2.5 calibration long short-term memory (LSTM) model.
2.2.4. Outlier Removal
Outliers are observations that are out of touch with most data values and are likely to distort the analysis results. Therefore, it is important to identify outliers before performing data modeling or an analysis. We removed outliers using the Grubb test, which detects the outliers in a dataset.
3. Results and Discussion
3.1. Measurement Results
Figure 4 presents the measurement results of the beta-ray absorption and light-scattering methods. The statistical values of the measurement results are summarized in Table 2. In the indoor environment of the daycare center, the average concentrations of fine dust were 28.9 μg/m3 and 41.9 μg/m3 for the beta-ray absorption and light-scattering methods, respectively. Generally, the light-scattering method exhibited a higher level of measurement than that of the beta-ray absorption method. Light-scattering methods yield higher values than those of beta-absorption methods. The beta-ray absorption equipment was not operational during the device inspection and stabilization from 12 to 21 November 2018 (until 17:00). Thus, this period was excluded from the analysis, and corrections were performed accordingly. Table 2 represents the statistical information for the data sets sampled from the low-cost PM2.5 sensors and FEM (beta-ray) instruments. The data (temperature, humidity, CO2, and weekdays) set is used to verify the accuracy performance of the calibrated results.
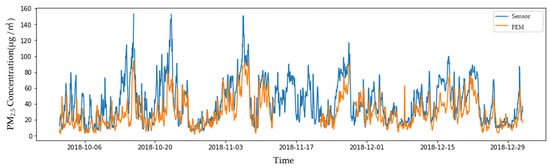
Figure 4.
Comparison of PM2.5 concentrations between the sensor and federal equivalent method (FEM).
Table 2.
Statistical results for the sensor and federal equivalent method (FEM) meter used in this study.
3.2. Calculation of Correction Factor
3.2.1. Linear Regression
Using the hourly measurement data obtained from the beta-ray absorption method as a reference, a scatter plot was generated by averaging the 1 min data obtained from the light-scattering method. The resulting scatter plot is illustrated in Figure 4. A linear regression analysis of the data yielded a regression formula similar to Equation (10). The correlation coefficient (R) and r2 between the beta-ray absorption and light-scattering methods were 0.76 and 0.57, respectively. The comparison tests between the light-scattering method sensor used in this study and similar sensors tested using the FEM equipment in the field exhibited slightly higher performances, with PMS1003 at R2 = 0.73–0.97 and PMS3003 (r2) (Figure 5) [34]. Additionally, the comparison analyses between the PM2.5 sensors located at the same position as the FEM equipment had r2 values in the range of 0.33–45 [33].
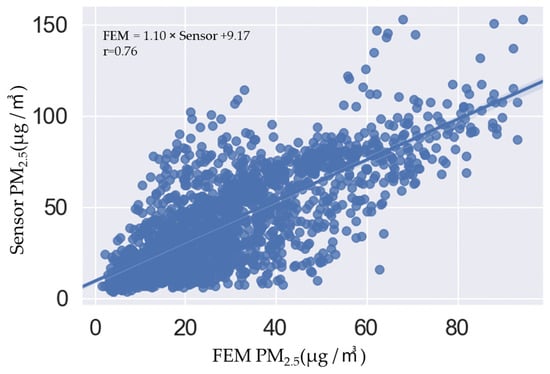
Figure 5.
Comparison of PM2.5 mass concentration between the federal equivalent method (FEM) meter (beta-ray) and low-cost sensor.
3.2.2. Multiple Linear Regression
A multiple regression analysis was performed to determine the influence of environmental factors (temperature, humidity, CO2, and holiday information, etc.) on the FEM and light-scattering fine dust concentrations in the daycare centers. The r2 for each influencing factor is indicated in Table 3, and the regression equation is as follows.
Table 3.
Summary of multiple linear regression analysis for the sensor and federal equivalent method (FEM) meter.
The relationship between the FEM and light-scattering fine dust concentrations was significant, with a modified r2 of 0.75. It was at the Tier II level, as suggested by the US Environmental Protection Agency’s “Air Sensor Guidebook”. The multiple regression analysis correction results based on the correction formula are illustrated in Figure 6.
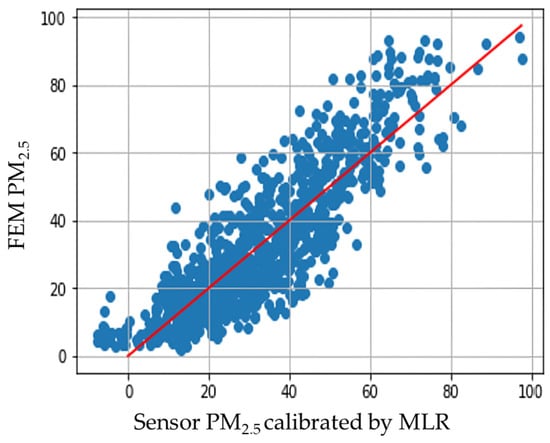
Figure 6.
Multiple linear regression analysis results.
Figure 7 exhibits the low-cost sensor and reference equipment measurements corrected using the multiple regression analysis.
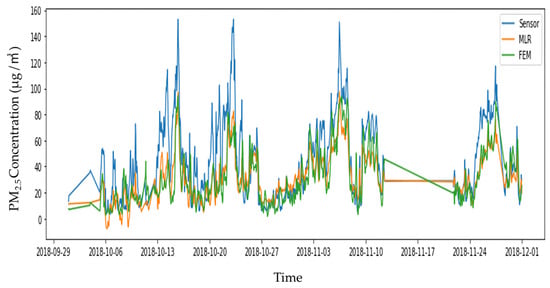
Figure 7.
Comparison between the reference monitor data (green) and statistically averaged sensor (blue) using multiple linear regression (MLR) model (orange) through example time series and regressions.
3.2.3. RNN
For training the data, the hourly measurement data from 6 October to 31 December 2018, were considered as a single instance, resulting in 1675 instances. Generally, deep learning models require separate sets of training and testing data to evaluate the prediction performance of an algorithm. However, this method is susceptible to overfitting, which occurs when a model is overly optimized for training data and therefore performs poorly when applied to new data. Consequently, a cross-validation process was used to evaluate the model performance in the first round and was then applied to the testing dataset for the final evaluation. The final training dataset comprised 64%, 16%, and 20% training, validation, and testing data, respectively. TensorFlow version 1.10 and Keras version 2.2.2 were used to implement the prediction and calibration models, and the results were generated accordingly.
The input data, including the FEM and sensor measurements, temperature, humidity, and CO2, were diverse. Therefore, normalization was performed to convert all the training data into values between 0 and 1 and achieve accurate learning [34]. The values of the LSTM network parameters are crucial for obtaining a good calibration and prediction model. The LSTM parameters used in this study are listed in Table 4.
Table 4.
Long short-term memory (LSTM) parameter settings.
To obtain a highly accurate calibration and prediction model, it is important to determine the hyperparameter values and select an optimizer that minimizes the cost function. In this study, we used Adam, Adamax, and RMSprop for optimization, which exhibited a good performance. The hyperparameters for configuring the model to calibrate the measured values of the low-cost PM sensors based on the FEM data are listed in Table 5.
Table 5.
Long short-term memory (LSTM) model hyperparameters.
The LSTM model was evaluated using an evaluation algorithm based on the difference between the predicted and actual values. Generally, the mean squared error (MSE), RMSE, and square root of MSE are used to measure the error between the two values. Because the prediction can also produce negative results, the RMSE is more suitable than the MSE for measurement. Thus, the RMSE was used as an error measurement tool in this study, and RMSE values close to zero indicated a better performance.
Lookback is a coefficient that determines how much past time interval data should be used for training compared to the reference time of the training data. In this study, the minimum RMSE value over the past 76 h of data collection was determined to be the optimal lookback for calculating the optimal lookback value (Figure 8).
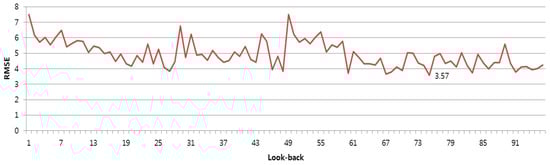
Figure 8.
Root mean squared error (RMSE) versus lookback for the long short-term memory (LSTM) model.
Figure 9 compares the FEM measurements with the low-cost sensor measurements predicted using the LSTM–RNN model. The FEM measurements and the predicted and calibrated values exhibited no significant differences.
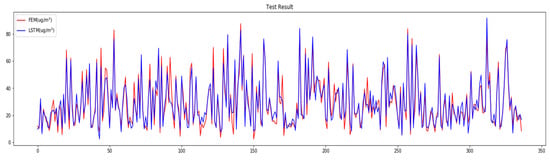
Figure 9.
Predicted and observed values for the test set.
Figure 10 compares the FEM data with the low-cost sensor measurements calibrated using the LSTM model. The r2 was 0.962, which was more accurate than that of the regression analysis (r2 = 0.76).
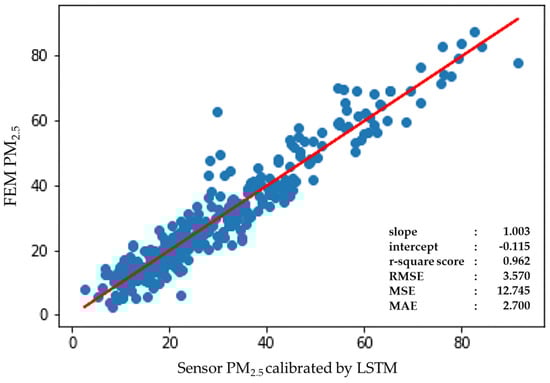
Figure 10.
Comparison of the long short-term memory (LSTM) and Federal Equivalent Method (FEM) meter.
Thus, more accurate values could be obtained using this model by correcting the measured low-cost sensor fine dust data in real time and monitoring these data. The use of low-cost IoT-sensor-based indoor environmental measurement instruments is an economical and user-friendly solution for indoor environment management. However, there are concerns regarding the reliability of the measured values, instability owing to environmental conditions, periodic sensitivity, fatigue testing, and sensor replacement cycles, which have been identified as limitations of low-cost sensors. Therefore, further research is required to address these issues and improve the overall effectiveness of low-cost sensor-based indoor environmental measuring instruments.
4. Conclusions
In this study, the performance of a low-cost fine dust sensor was evaluated with respect to PM reference measuring equipment by measuring the fine dust in the indoor environment of a daycare center for 3 months (October–December 2018). Furthermore, we developed a correction model based on an LSTM algorithm to improve the accuracy of low-cost sensors for measuring the PM concentrations in daycare centers. The optimal hyperparameters were analyzed, and the performance of the LSTM model was compared with those of the linear and multiple linear regression models. The LSTM model was trained using the data collected via the low-cost sensors and FEM methods. The optimal lookback period was determined to be 76, which resulted in a high calibration performance, with an RMSE, r2, MSE, and MAE of 3.57, 0.962, 12.745, and 2.7, respectively. The LSTM model demonstrated a better calibration performance than that of the linear (r2 = 0.57) and multiple linear regression models (r2 = 0.75).
These results suggest that LSTM-based correction methods and optimized hyperparameters can be applied to low-cost sensors for measuring short-term changes in the indoor PM concentrations of daycare centers. Furthermore, the calibration model developed in this study can be used to obtain precise short-term measurements of indoor PM concentrations. If the measurement environment of a low-cost PM sensor differs, the methodology used in this study can be similarly applied to obtain new learning and hyperparameter values. Our findings will aid in the development of indoor activity guidelines for the optimal management of indoor PM concentrations.
Author Contributions
Conceptualization, H.J., K.M.K. and J.A.; methodology, H.J. and K.M.K.; validation, H.J.; investigation, H.J. and J.R., resources, H.J.; data curation, J.R.; writing—original draft preparation, J.R.; writing—review and editing, H.J., J.R., K.M.K. and J.A.; supervision, K.M.K. All authors have read and agreed to the published version of the manuscript.
Funding
This study is based on the findings of the research “Development of integrated decision support model for environmental impact assessment project”, (2022-003(R)) which was conducted by the Korea Environment Institute (KEI) and funded by research and development project (Project No. 2020002990007) of the Environmental Industry & Technology Institute (KEITI) and the Ministry of Environment (MOE).
Institutional Review Board Statement
Not applicable.
Informed Consent Statement
Not applicable.
Data Availability Statement
All data analyzed or generated during the study are included in the manuscript. The URLs of the data used in the study are provided for access to the detailed data.
Acknowledgments
We thank the Korean Ministry of Environment for providing the air quality index data (http://www.inair.or.kr; accessed on 6 September 2022).
Conflicts of Interest
The authors declare no conflict of interest.
References
- Brienza, S.; Galli, A.; Anastasi, G.; Bruschi, P. A low-cost sensing system for cooperative air quality monitoring in urban areas. Sensors 2015, 15, 12242–12259. [Google Scholar] [CrossRef] [PubMed]
- World Health Organization. Ambient Air Pollution-A Global Assessment of Exposure and Burden of Disease; World Health Organization: Geneva, Switzerland, 2016; ISBN 9789241511353. [Google Scholar]
- Graham, L.M. All I need is the air that I breath: Outdoor air quality and asthma. Paediatr. Respir. Rev. 2004, 5 (Suppl. A), S59–S64. [Google Scholar] [CrossRef]
- Bae, H.-J. Effects of short-term exposure to PM10 and PM2.5 on mortality in Seoul. Korean J. Environ. Health Sci. 2014, 40, 346–354. [Google Scholar] [CrossRef]
- Kim, J.B.; Park, S.; Lee, Y.; Lee, S.; Kim, J.; Park, D. Prediction of concentration change and influence analysis of indoor/outdoor in subway station using indoor air quality monitoring data. J. Korean Soc. Atmos. Environ. 2022, 38, 30–45. [Google Scholar] [CrossRef]
- Kim, S.; Kang, H.-S.; Son, Y.S.; Yoon, S.-L.; Kim, J.-C.; Kim, G.-S.; Kim, I. Compensation of light scattering method for real-time monitoring of particulate matters in subway stations. J. Korean Soc. Atmos. Environ. 2010, 26, 533–542. [Google Scholar] [CrossRef]
- Ryu, J.; Jeong, S.; Kim, G.; Park, W.; Park, S. Evaluation of measurement reliability of light-scattering PM2.5 monitor applied with referenced-channel calibration technology. J. Korean Soc. Atmos. Environ. 2022, 38, 341–353. [Google Scholar] [CrossRef]
- Park, D.; Yoo, G.W.; Park, S.H.; Lee, J.H. Assessment and calibration of a low-cost PM2.5 sensor using machine learning (hybridlSTM neural network): Feasibility study to build an air quality monitoring system. Atmosphere 2021, 12, 1306. [Google Scholar] [CrossRef]
- Morawska, L.; Thai, P.K.; Liu, X.; Asumadu-Sakyi, A.; Ayoko, G.; Bartonova, A.; Bedini, A.; Chai, F.; Christensen, B.; Dunbabin, M.; et al. Applications of low-cost sensing technologies for air quality monitoring and exposure assessment: How far have they gone? Environ. Int. 2018, 116, 286–299. [Google Scholar] [CrossRef]
- Maag, B.; Zhou, Z.; Thiele, L. A survey on sensor calibration in air pollution monitoring deployments. IEEE Internet Things J. 2018, 5, 4857–4870. [Google Scholar] [CrossRef]
- Castell, N.; Dauge, F.R.; Schneider, P.; Vogt, M.; Lerner, U.; Fishbain, B.; Broday, D.; Bartonova, A. Can commercial low-cost sensor platforms contribute to air quality monitoring and exposure estimates? Environ. Int. 2017, 99, 293–302. [Google Scholar] [CrossRef]
- Castell, N.; Schneider, P.; Grossberndt, S.; Fredriksen, M.F.; Sousa-Santos, G.; Vogt, M.; Bartonova, A. Localized real-time information on outdoor air quality at kindergartens in Oslo, Norway using low-cost sensor nodes. Environ. Res. 2018, 165, 410–419. [Google Scholar] [CrossRef]
- Matte, T.D.; Ross, Z.; Kheirbek, I.; Eisl, H.; Johnson, S.; Gorczynski, J.E.; Kass, D.; Markowitz, S.; Pezeshki, G.; Clougherty, J.E. Monitoring intraurban spatial patterns of multiple combustion air pollutants in New York City: Design and implementation. J. Expo. Sci. Environ. Epidemiol. 2013, 23, 223–231. [Google Scholar] [CrossRef] [PubMed]
- Kumar, P.; Morawska, L.; Martani, C.; Biskos, G.; Neophytou, M.; Di Sabatino, S.; Bell, M.; Norford, L.; Britter, R. The rise of low-cost sensing for managing air pollution in cities. Environ. Int. 2015, 75, 199–205. [Google Scholar] [CrossRef]
- Rai, A.C.; Kumar, P.; Pilla, F.; Skouloudis, A.N.; Di Sabatino, S.; Ratti, C.; Yasar, A.; Rickerby, D. End-user perspective of low-cost sensors for outdoor air pollution monitoring. Sci. Total Environ. 2017, 607–608, 691–705. [Google Scholar] [CrossRef]
- Jovašević-Stojanović, M.; Bartonova, A.; Topalović, D.; Lazović, I.; Pokrić, B.; Ristovski, Z. On the use of small and cheaper sensors and devices for indicative citizen-based monitoring of respirable particulate matter. Environ. Pollut. 2015, 206, 696–704. [Google Scholar] [CrossRef]
- Kelly, K.E.; Whitaker, J.; Petty, A.; Widmer, C.; Dybwad, A.; Sleeth, D.; Martin, R.; Butterfield, A. Ambient and laboratory evaluation of a low-cost particulate matter sensor. Environ. Pollut. 2017, 221, 491–500. [Google Scholar] [CrossRef]
- Gillooly, S.E.; Zhou, Y.; Vallarino, J.; Chu, M.T.; Michanowicz, D.R.; Levy, J.I.; Adamkiewicz, G. Development of an in-home, real-time air pollutant sensor platform and implications for community use. Environ. Pollut. 2019, 244, 440–450. [Google Scholar] [CrossRef] [PubMed]
- Kim, M.; Lee, J.; Woo, U.; Choi, H. Evaluation of Low-cost Light Scattering Devices for Ultrafine Dust Based on Relative Humidity. J. Korean Soc. Living Environ. Syst. 2022, 29, 271–280. [Google Scholar] [CrossRef]
- Reddy, V.; Yedavalli, P.; Mohanty, S.; Nakhat, U. Deep Air: Forecasting Air Pollution in Beijing, China. Available online: https://www.ischool.berkeley.edu/sites/default/files/sproject_attachments/deep-air-forecasting_final.pdf (accessed on 14 June 2023).
- Ahn, J.; Shin, D.; Kim, K.; Yang, J. Indoor air quality analysis using deep learning with sensor data. Sensors 2017, 17, 2476. [Google Scholar] [CrossRef] [PubMed]
- Park, J.H.; Yoo, S.J.; Kim, K.J.; Gu, Y.H.; Lee, K.H.; Son, U.H. PM10 density forecast model using long short term memory. In Proceedings of the 2017 Ninth International Conference on Ubiquitous and Future Networks (ICUFN), Milan, Italy, 4–7 July 2017; pp. 576–581. [Google Scholar] [CrossRef]
- Zhao, J.; Deng, F.; Cai, Y.; Chen, J. Long short-term memory–Fully connected (LSTM-FC) neural network for PM2.5 concentration prediction. Chemosphere 2019, 220, 486–492. [Google Scholar] [CrossRef] [PubMed]
- Li, X.; Peng, L.; Yao, X.; Cui, S.; Hu, Y.; You, C.; Chi, T. Long short-term memory neural network for air pollutant concentration predictions: Method development and evaluation. Environ. Pollut. 2017, 231, 997–1004. [Google Scholar] [CrossRef]
- Benammar, M.; Abdaoui, A.; Ahmad, S.H.M.; Touati, F.; Kadri, A. A modular IoT platform for real-time indoor air quality monitoring. Sensors 2018, 18, 581. [Google Scholar] [CrossRef] [PubMed]
- Hagan, D.H.; Isaacman-VanWertz, G.; Franklin, J.P.; Wallace, L.M.M.; Kocar, B.D.; Heald, C.L.; Kroll, J.H. Calibration and assessment of electrochemical air quality sensors by co-location with regulatory-grade instruments. Atmos. Meas. Tech. 2018, 11, 315–328. [Google Scholar] [CrossRef]
- Sayahi, T.; Butterfield, A.; Kelly, K.E. Long-term field evaluation of the Plantower PMS low-cost particulate matter sensors. Environ. Pollut. 2019, 245, 932–940. [Google Scholar] [CrossRef]
- Zimmerman, N.; Presto, A.A.; Kumar, S.P.N.; Gu, J.; Hauryliuk, A.; Robinson, E.S.; Robinson, A.L.; Subramanian, R. A machine learning calibration model using random forests to improve sensor performance for lower-cost air quality monitoring. Atmos. Meas. Tech. 2018, 11, 291–313. [Google Scholar] [CrossRef]
- Kim, G. Implementation of indoor air quality monitoring system for subway stations. J. Semicond. Technol. Sci. 2013, 50, 294–301. [Google Scholar] [CrossRef]
- Spinelle, L.; Aleixandre, M.; Gerboles, M. Protocol of Evaluation and Calibration of Low- Cost Gas Sensors for the Monitoring of Air Pollution; Publications Office of the European Union: Luxembourg, 2013. [Google Scholar] [CrossRef]
- Ryu, N.; Kim, H.; Kang, P. Evaluating variable selection techniques for multivariate linear regression. J. Korean Inst. Ind. Eng. 2016, 42, 314–326. [Google Scholar] [CrossRef][Green Version]
- Kim, H. Subway PM10 measurement and development of correction equation using the light scattering method. J. Odor Indoor Environ. 2018, 17, 45–53. [Google Scholar] [CrossRef]
- Jiao, W.; Hagler, G.; Williams, R.; Sharpe, R.; Brown, R.; Garver, D.; Judge, R.; Caudill, M.; Rickard, J.; Davis, M.; et al. Community Air Sensor Network (CAIRSENSE) project: Evaluation of low-cost sensor performance in a suburban environment in the southeastern United States. Atmos. Meas. Tech. 2016, 9, 5281–5292. [Google Scholar] [CrossRef]
- Hong, H.; Choi, I.; Jeon, H.; Kim, Y.; Lee, J.; Park, C.H.; Kim, H.S. An air pollutants prediction method integrating numerical models and artificial intelligence models targeting the area around Busan port in Korea. Atmosphere 2022, 13, 1462. [Google Scholar] [CrossRef]


Disclaimer/Publisher’s Note: The statements, opinions and data contained in all publications are solely those of the individual author(s) and contributor(s) and not of MDPI and/or the editor(s). MDPI and/or the editor(s) disclaim responsibility for any injury to people or property resulting from any ideas, methods, instructions or products referred to in the content. |
© 2023 by the authors. Licensee MDPI, Basel, Switzerland. This article is an open access article distributed under the terms and conditions of the Creative Commons Attribution (CC BY) license (https://creativecommons.org/licenses/by/4.0/).