Article

Variations in Key Factors at Different Explosive Development Stages of an Extreme Explosive Cyclone over the Japan Sea

1
College of Ocean and Meteorology, Guangdong Ocean University, Zhanjiang 524088, China
2
South China Sea Institute of Marine Meteorology (SIMM), Guangdong Ocean University, Zhanjiang 524088, China
3
CMA-GDOU Joint Laboratory for Marine Meteorology, Guangdong Ocean University, Zhanjiang 524088, China
4
Key Laboratory of Climate, Resources and Environment in Continental Shelf Sea, Deep Sea of Department of Education of Guangdong Province, Guangdong Ocean University, Zhanjiang 524088, China
*
Author to whom correspondence should be addressed.
Atmosphere 2023, 14(9), 1327; https://doi.org/10.3390/atmos14091327
Submission received: 12 July 2023 / Revised: 10 August 2023 / Accepted: 15 August 2023 / Published: 23 August 2023

Abstract

:
Explosive cyclones (ECs) occur frequently over the Japan Sea. The most rapidly intensifying EC over the Japan Sea during the 44-year period 1979–2022, in the cold season (October–April), was examined to reveal the variations in the key factors at different explosive development stages. The EC deepened at a maximum deepening rate of 3.07 bergerons and explosive development lasted for 15 h. At the initial moment of explosive development, the EC had distinctive low-level baroclinicity, the low-level water vapor convergence was weak, and mid-level cyclonic vorticity advection was far away from the EC’s center. At the moment at which the EC reached the maximum deepening rate, the low-level water vapor convergence and mid-level cyclonic vorticity advection increased distinctly and approached the EC’s center. A diagnostic analysis using the Zwack–Okossi equation showed that the main contributor to the initial explosive development was warm-air advection. Through the evolutionary process of the explosive development, the non-key factors of the cyclonic vorticity advection and diabatic heating at the initial explosive development stage increased quickly and became key factors contributing to the maximum explosive development. The key factors contributing to the explosive development varied with the stage of explosive development. The cross-section and vertical profile of each term suggested that the cyclonic vorticity advection was enhanced in the upper troposphere and diabatic heating increased in the middle troposphere.

1. Introduction

An explosive cyclone (EC), also called a “meteorological bomb” [1], refers to a rapidly deepening extratropical cyclone associated with strong winds, heavy precipitation and high waves, which usually causes serious damage to life and property [2,3,4]. Sanders and Gyakum [1] defined an EC as an extratropical cyclone whose central sea level pressure (SLP) dropped at a rate of more than 1 bergeron (greater than 24 hPa within 24 h when the geostrophically equivalent rate is adjusted to 60° N). Some studies modified this definition by adjusting the geostrophically equivalent rate at 42.5° N [5], 45° N [6], or “dropped pressure” of 12 hPa within 12 h [7,8].
Statistical analyses have indicated that the Japan Sea, off the East Asian coast, is a region with frequent occurrences of the rapid intensification of ECs [9,10,11,12]. The synoptic atmospheric environments strongly influenced the spatial distribution of ECs. Cold air masses intrude into the East Asian coast, leading to strong baroclinicity over the Japan Sea, favoring the rapid intensification of ECs [7,11]. ECs occur frequently downstream of the 500 hPa trough [1,13]. The 500 hPa mean trough usually exists off the East Asian coast in the cold season and the Japan Sea is located downstream of it [14]. ECs occur frequently within or poleward of the upper-level jet stream [1,7]; the East Asian subtropical westerly jet stream provided the upper-level forcing for ECs over the Japan Sea [8]. Those atmospheric environmental conditions favored the rapid intensification of ECs over the Japan Sea.
The physical factors involved in the development of ECs are complicated. They include low-level baroclinicity [15,16], latent heat release [3,17,18], vorticity advection [19,20], and the upper-level jet stream [21,22,23]. Previous studies have emphasized that the relative importance of these factors strongly depends on the region of the EC [24,25,26]. Kuwano-Yoshida and Asuma [27] indicated that ECs over various regions were characterized by different meso-scale structures and development processes. ECs over the Pacific Ocean (formed and developed over the northwestern Pacific Ocean) were associated with strong latent heat release, ECs over the Okhotsk–Japan Sea (originating over the East Asian continent and developing over the Japan Sea or Okhotsk Sea) had a distinct upper-level shortwave trough, clear lower-level cold front, and weak latent heat release. While Heo et al. [28] suggested that latent heat release was an important factor in explosive cyclogenesis of ECs over the Japan Sea.
How the factors of temperature advection, vorticity advection, and latent heat release contribute to the most rapid intensification of ECs has been examined [17,24,29,30,31]; however, the variations in these key factors during the different explosive development stages are still unclear. ECs frequently occur over the Japan Sea and extreme ECs usually cause serious damage due to a much stronger destructive power. The purpose of this study is to examine and compare the physical factors in the development of an extreme EC at different explosive development stages over the Japan Sea. In this paper, the data and methods are introduced in Section 2. Section 3 analyzes the evolutionary processes and synoptic-scale environment for an extreme EC over the Japan Sea. The diagnostic results for the EC are presented in Section 4, based on the Zwack and Okossi (Z-O) equation. Finally, discussion and conclusions are given in Section 5.

2. Data and Methods

2.1. Data

The ERA5 reanalysis data, provided by the European Centre for Medium-Range Weather Forecasts (ECMWF), are used to examine the atmospheric environmental conditions and diagnose the contributions of the physical processes to EC development. The ERA5 reanalysis data have a 0.25° × 0.25° horizontal resolution and 37 vertical levels, including hourly fields of the SLP, air temperature, horizontal wind, vertical velocity, relative humidity, and geopotential height.

2.2. Methods

2.2.1. EC Identification

An objective approach is utilized to identify ECs off the East Asian coast using the ERA5 data. An algorithm developed by Hart [32] was used to automatically detect and track cyclones deepened on the minimum SLP. Zhang et al. [8] modified the meaning of one “bergeron” to a “dropped pressure” of 12 hPa within 12 h when adjusted to a geostrophically equivalent rate at 45° N, which was taken as the threshold for identifying ECs from detecting and tracking cyclones. There were 207 ECs over the Japan Sea during the cold seasons (October–April) of the 44-year period 1979–2022. The most rapidly intensifying EC over the Japan Sea occurred around 3 April 2012, with a maximum deepening rate of 3.07 bergerons, which was defined as an extreme EC.

2.2.2. Z-O Equation

The simplified Z-O equation is used to diagnose the forcing factors of the extreme EC over the Japan Sea [33,34]. It is an effective method for diagnosing synoptic-scale development of ECs [20,35,36]. The simplified Z-O equation can be written as:
ζ g l t = 1 P l P t P t P l V ζ a d P 1 P l P t P t P l [ R f p P l 2 ( V T ) P d P ] d P 1 P l P t P t P l [ R f p P l 2 ( Q / C P ) P d P ] d P 1 P l P t P t P l [ R f p P l 2 ( S ω ) P d P ] d P = 1 P l P t P t P l ( VADV + TADV + DIAB + ADIA ) d P
where ζ g l is the geostrophic vorticity at the low boundary, P l and P t are the pressures at the lower (950 hPa) and upper boundaries (100 hPa), respectively [34,37], ζ a is the absolute vorticity, V is the horizontal wind, ω is the vertical velocity in isobaric coordinates, C P is the specific heat at constant pressure, S is the static stability parameter, Q is the diabatic heating rate [38], R is the dry air gas constant, f is the Coriolis parameter, and T is the air temperature. The first term on the right-hand side of Equation (1) (VADV) represents the horizontal absolute vorticity advection. The second term (TADV) reflects the horizontal temperature advection, and the third term (DIAB) is the diabatic heating. The fourth term (ADIA) describes the adiabatic temperature change due to the vertical motion [7]. A second-order finite difference method calculates the horizontal and vertical derivatives and the trapezoidal rule estimates the vertical integrals. In order to reduce the subsynoptic-scale noise, each term is smoothed by a two-dimensional second-order filtering scheme [39]. The vertical profiles of each term in Equation (1) were constructed by Rausch and Smith [38] to investigate the forcing processes at different pressure levels.

3. Synoptic Overview

Among all of the ECs over the Japan Sea, the most rapidly intensifying EC case attracted our attention and was selected as the specific case in the present study due to the following considerations: (1) The East Asian coast region is a densely populated region with frequent shipping and many human activities, extreme ECs with much stronger destructive power usually cause serious damage over this region. (2) Many previous studies have examined the characteristics of ECs with the maximum deepening rate, but investigations on the development mechanisms of ECs at different development stages are quite rare.

3.1. Evolutionary Processes

The most rapidly intensifying EC was formed over the eastern China continent around 00 UTC 2 April 2012 and dissipated over the northeast of the Okhotsk Sea with a northeastward moving track (Figure 1a). About 15 h after its formation, its deepening rate reached 1.25 bergerons and reached the point of explosive development over the Bohai Sea around 15 UTC 2 April (the initial explosive development moment) (Figure 1b). Around 00 UTC 3 April, the EC moved to the southwest of the Japan Sea, where it deepened most rapidly, with a maximum deepening rate of 3.07 bergerons. About 27 h after the maximum deepening rate was reached, the EC moved to the southwest of the Okhotsk Sea and its central SLP dropped to the minimum of 948.0 hPa around 03 UTC 4 April. The explosive development stage (deepening rate larger than 1.0 bergeron) lasted for 18 h and mainly occurred after moving from the land to the sea.

3.2. Synoptic-Scale Atmospheric Environmental Conditions

The synoptic-scale environmental conditions dominate the physical processes of ECs [16,27]. The synoptic-scale atmospheric environmental conditions for the EC at the initial explosive development moment and maximum-deepening-rate moment, which represent the initial explosive development stage and maximum-deepening stage, respectively, were examined to compare the contributions of the environmental conditions at different explosive development stages (Figure 2). In order to focus on the EC’s evolution, an analysis of the domain of 20° latitudes × 30° longitudes is selected to move with the EC’s center.
At the initial explosive development moment (Figure 2a–d), a tilted “S” shape of the 850 hPa baroclinic zone was distinctive to the southwest and northeast of the EC center (Figure 2a). The temperature trough had a deeper amplitude and lagged by about one-quarter wavelength of the 850 hPa geopotential height, which favored the baroclinic development [40,41]. The moist tongue of the specific humidity and the water vapor convergence of the EC was small (Figure 2b). The shallow 500 hPa height trough associated with the weak cyclonic vorticity upstream of the EC (Figure 2c). At 300 hPa (Figure 2d), the pattern of the geopotential height trough was similar to that at 500 hPa but much deeper. The jet stream extended southwest–northeast, with the EC center located in the right of the jet stream.
Approaching the maximum-deepening-rate moment (Figure 2e–h), the atmospheric environmental conditions favoring the development of the EC were generally enhanced. The temperature wave became severely distorted, resulting in stronger baroclinicity (Figure 2e). The 850 hPa water vapor convergence for the EC increased obviously due to the growing southwesterly winds associated with the moist tongue of specific humidity (Figure 2f). The 500 hPa trough in the upstream of the EC centers deepened and moved closer (Figure 2g). The cyclonic vorticity advection increased and mainly distributed near the upstream. The upper-level trough at 300 hPa for the EC evolved similarly to the 500 hPa trough with evident amplification (Figure 2h). The EC moved to the left of the jet stream exit, which is usually associated with strong upper-level dynamic forcing [21].

4. Diagnostic Analyses

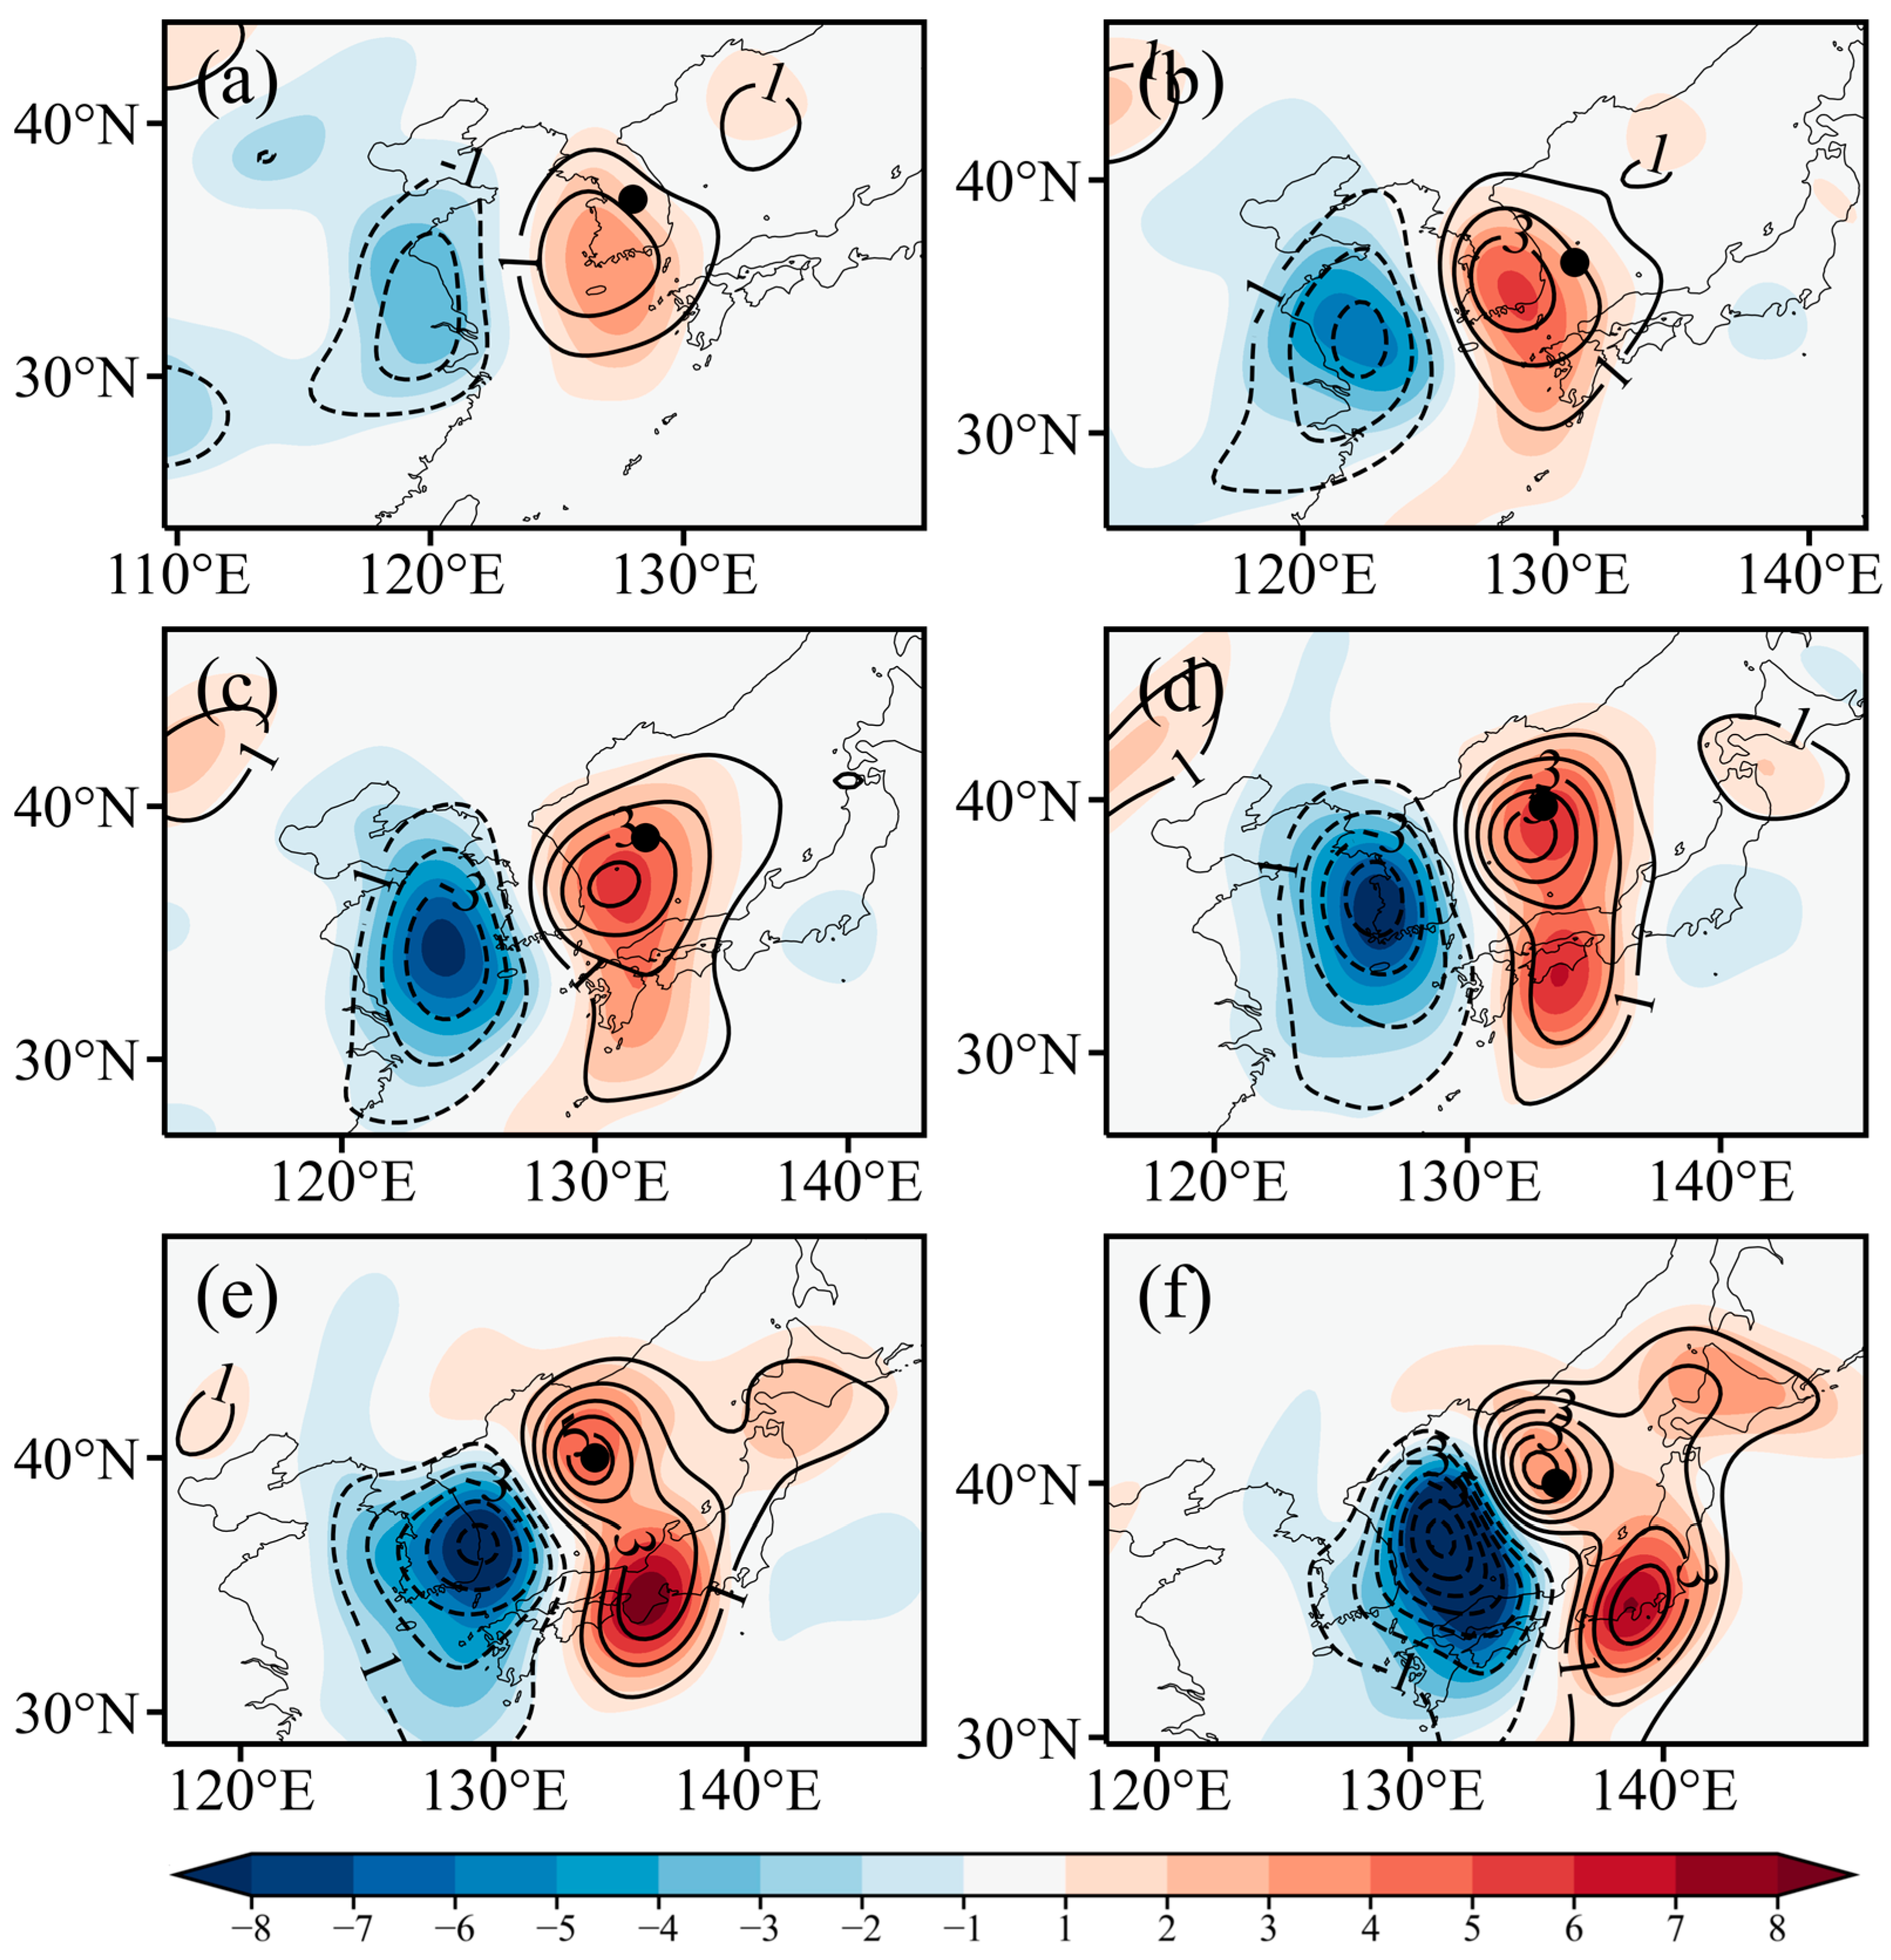
The characteristics of the synoptic-scale environmental conditions for the EC have been investigated qualitatively. The Z-O equation is utilized to diagnose the vorticity advection, temperature advection, diabatic heating, and adiabatic heating, in order to examine and compare the variations in key factors at different explosive development stages. The geostrophic vorticity tendency at 950 hPa is evaluated by using the finite difference method with 12 h intervals, and the contribution of each term around the EC’s center 6 h after the analyzed moment is discussed [7]. Because of the nonlinearity factor and certain inevitable discrepancies of each term in Equation (1), the two-dimensional second-order filtering scheme [40] cannot filter out all noise. However, the sum of the four terms (Figure 3, shaded) and the geostrophic vorticity tendency at 950 hPa (Figure 3, contour) of Equation (1) from 15 UTC 2 to 06 UTC 3 April 2012 for the EC had quite similar patterns and magnitudes in general, which suggests that the result was reasonable.

4.1. Vertically Integrated Characteristics

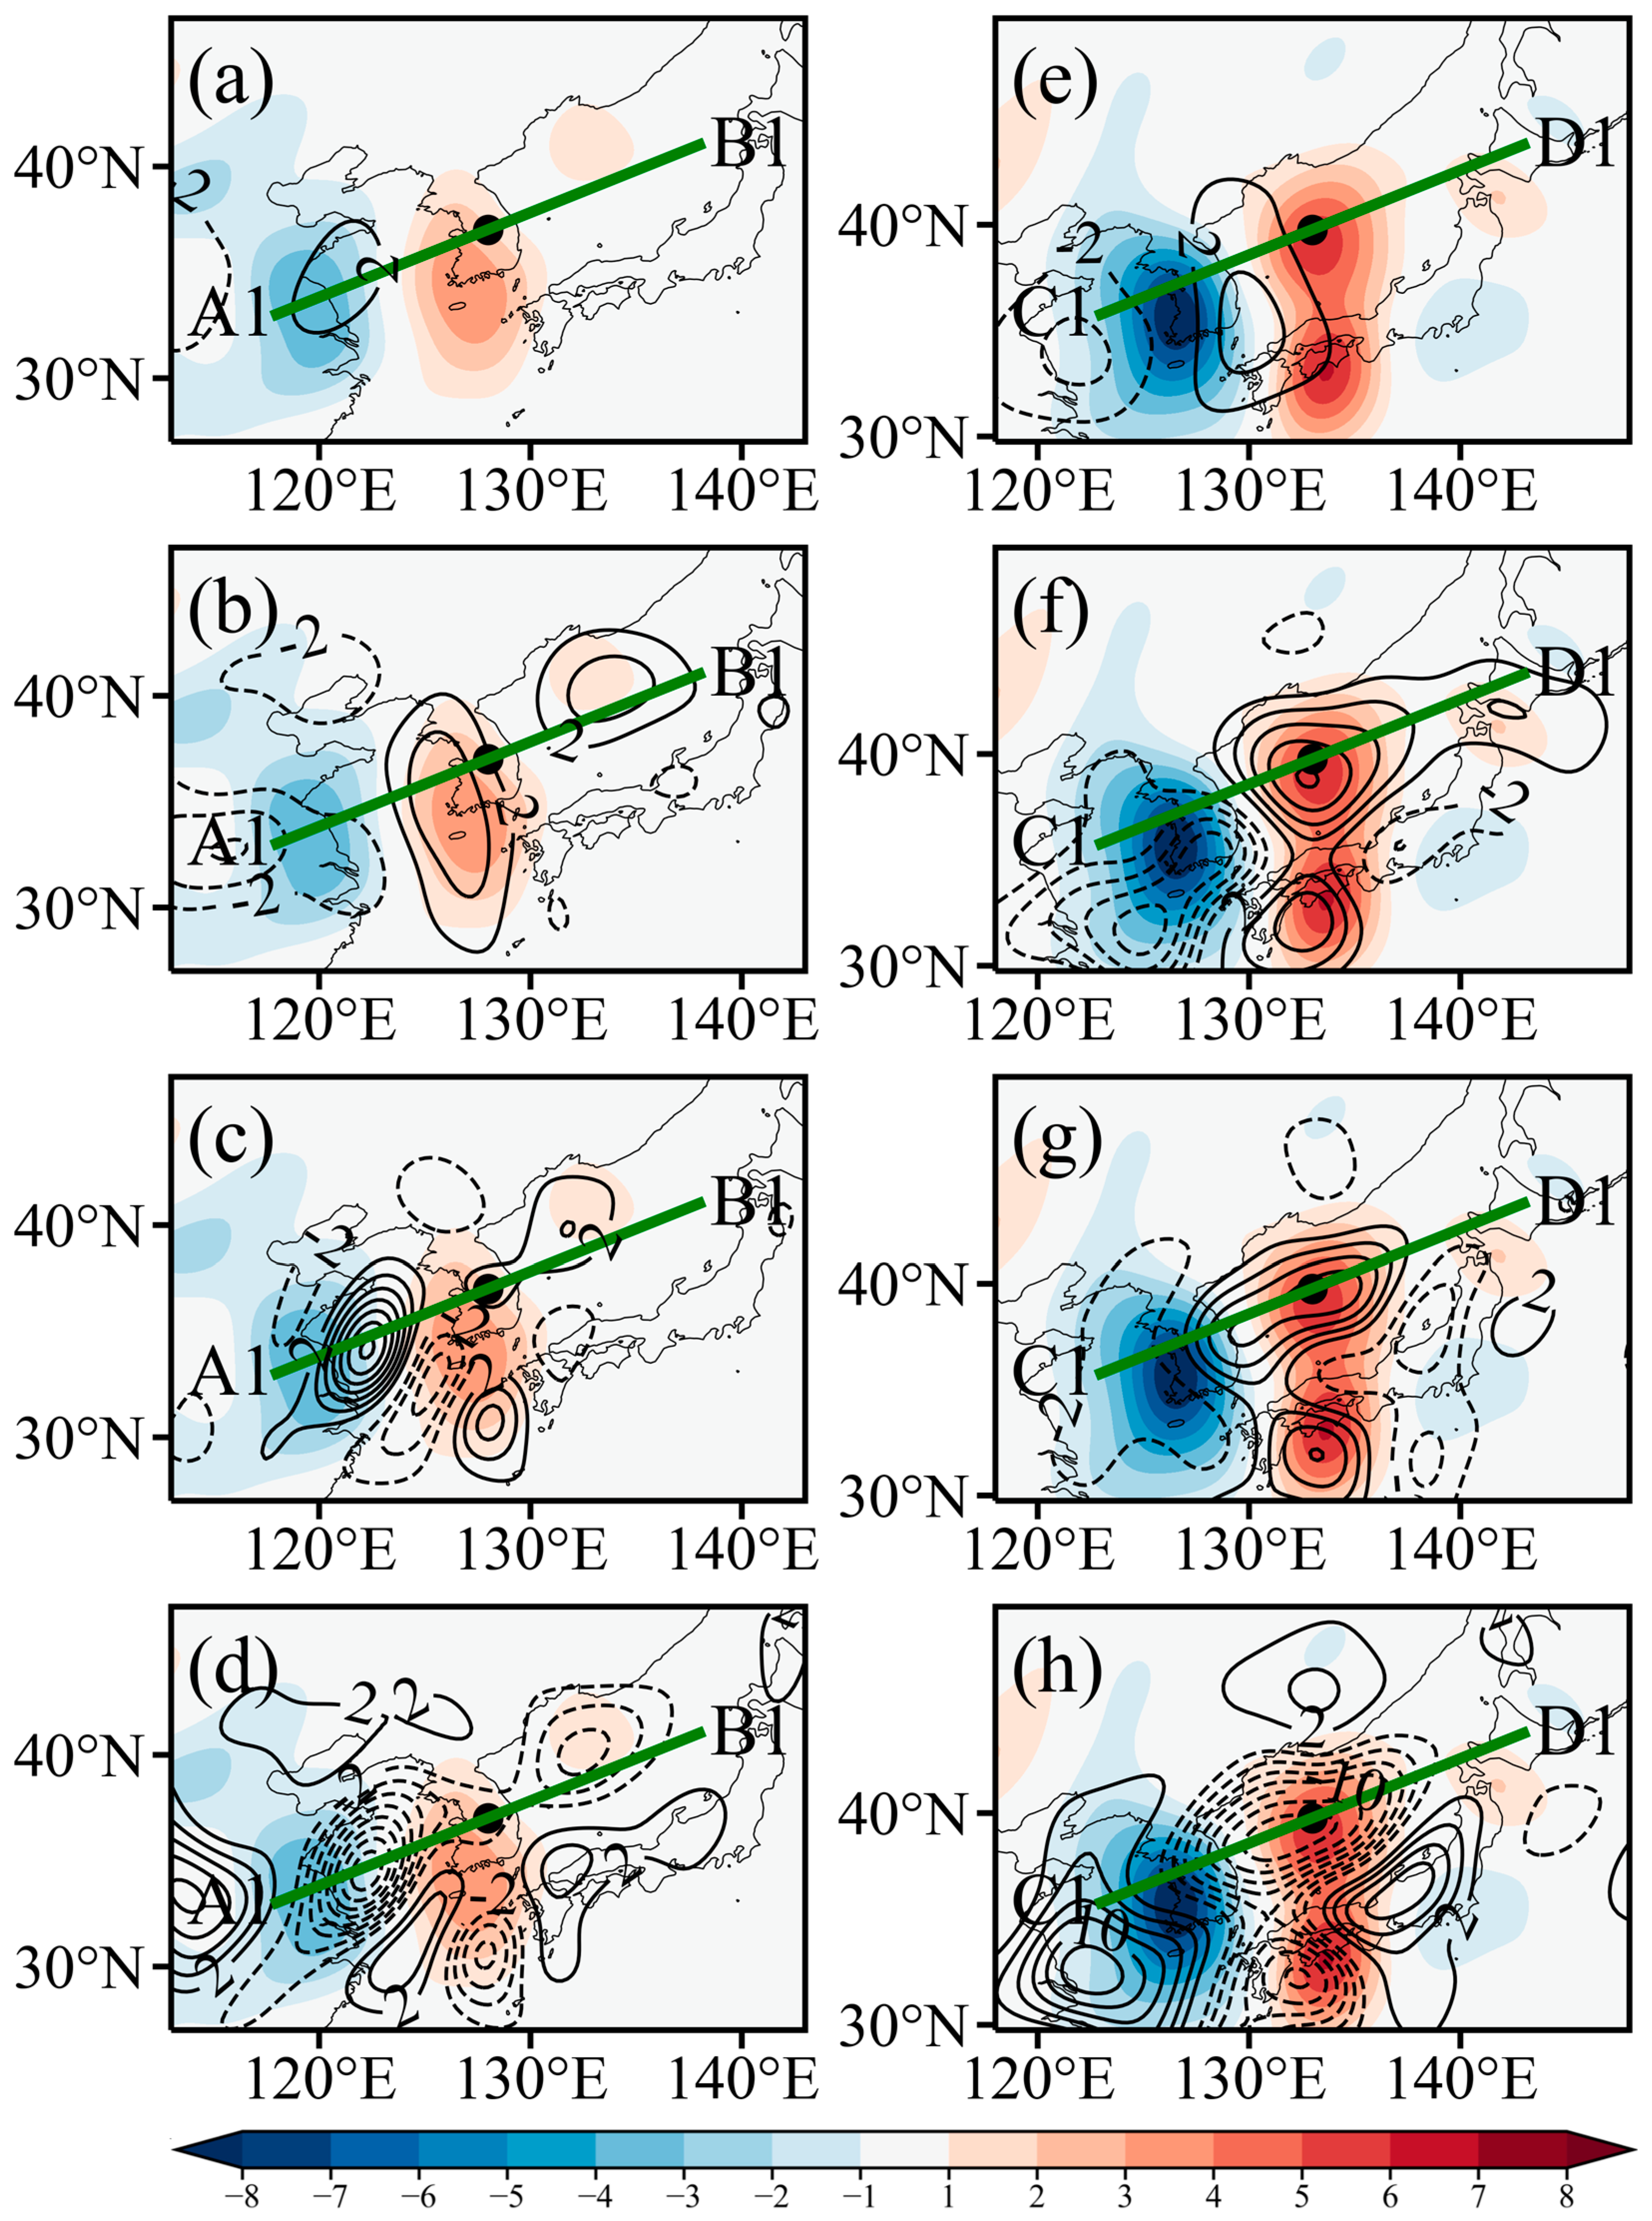
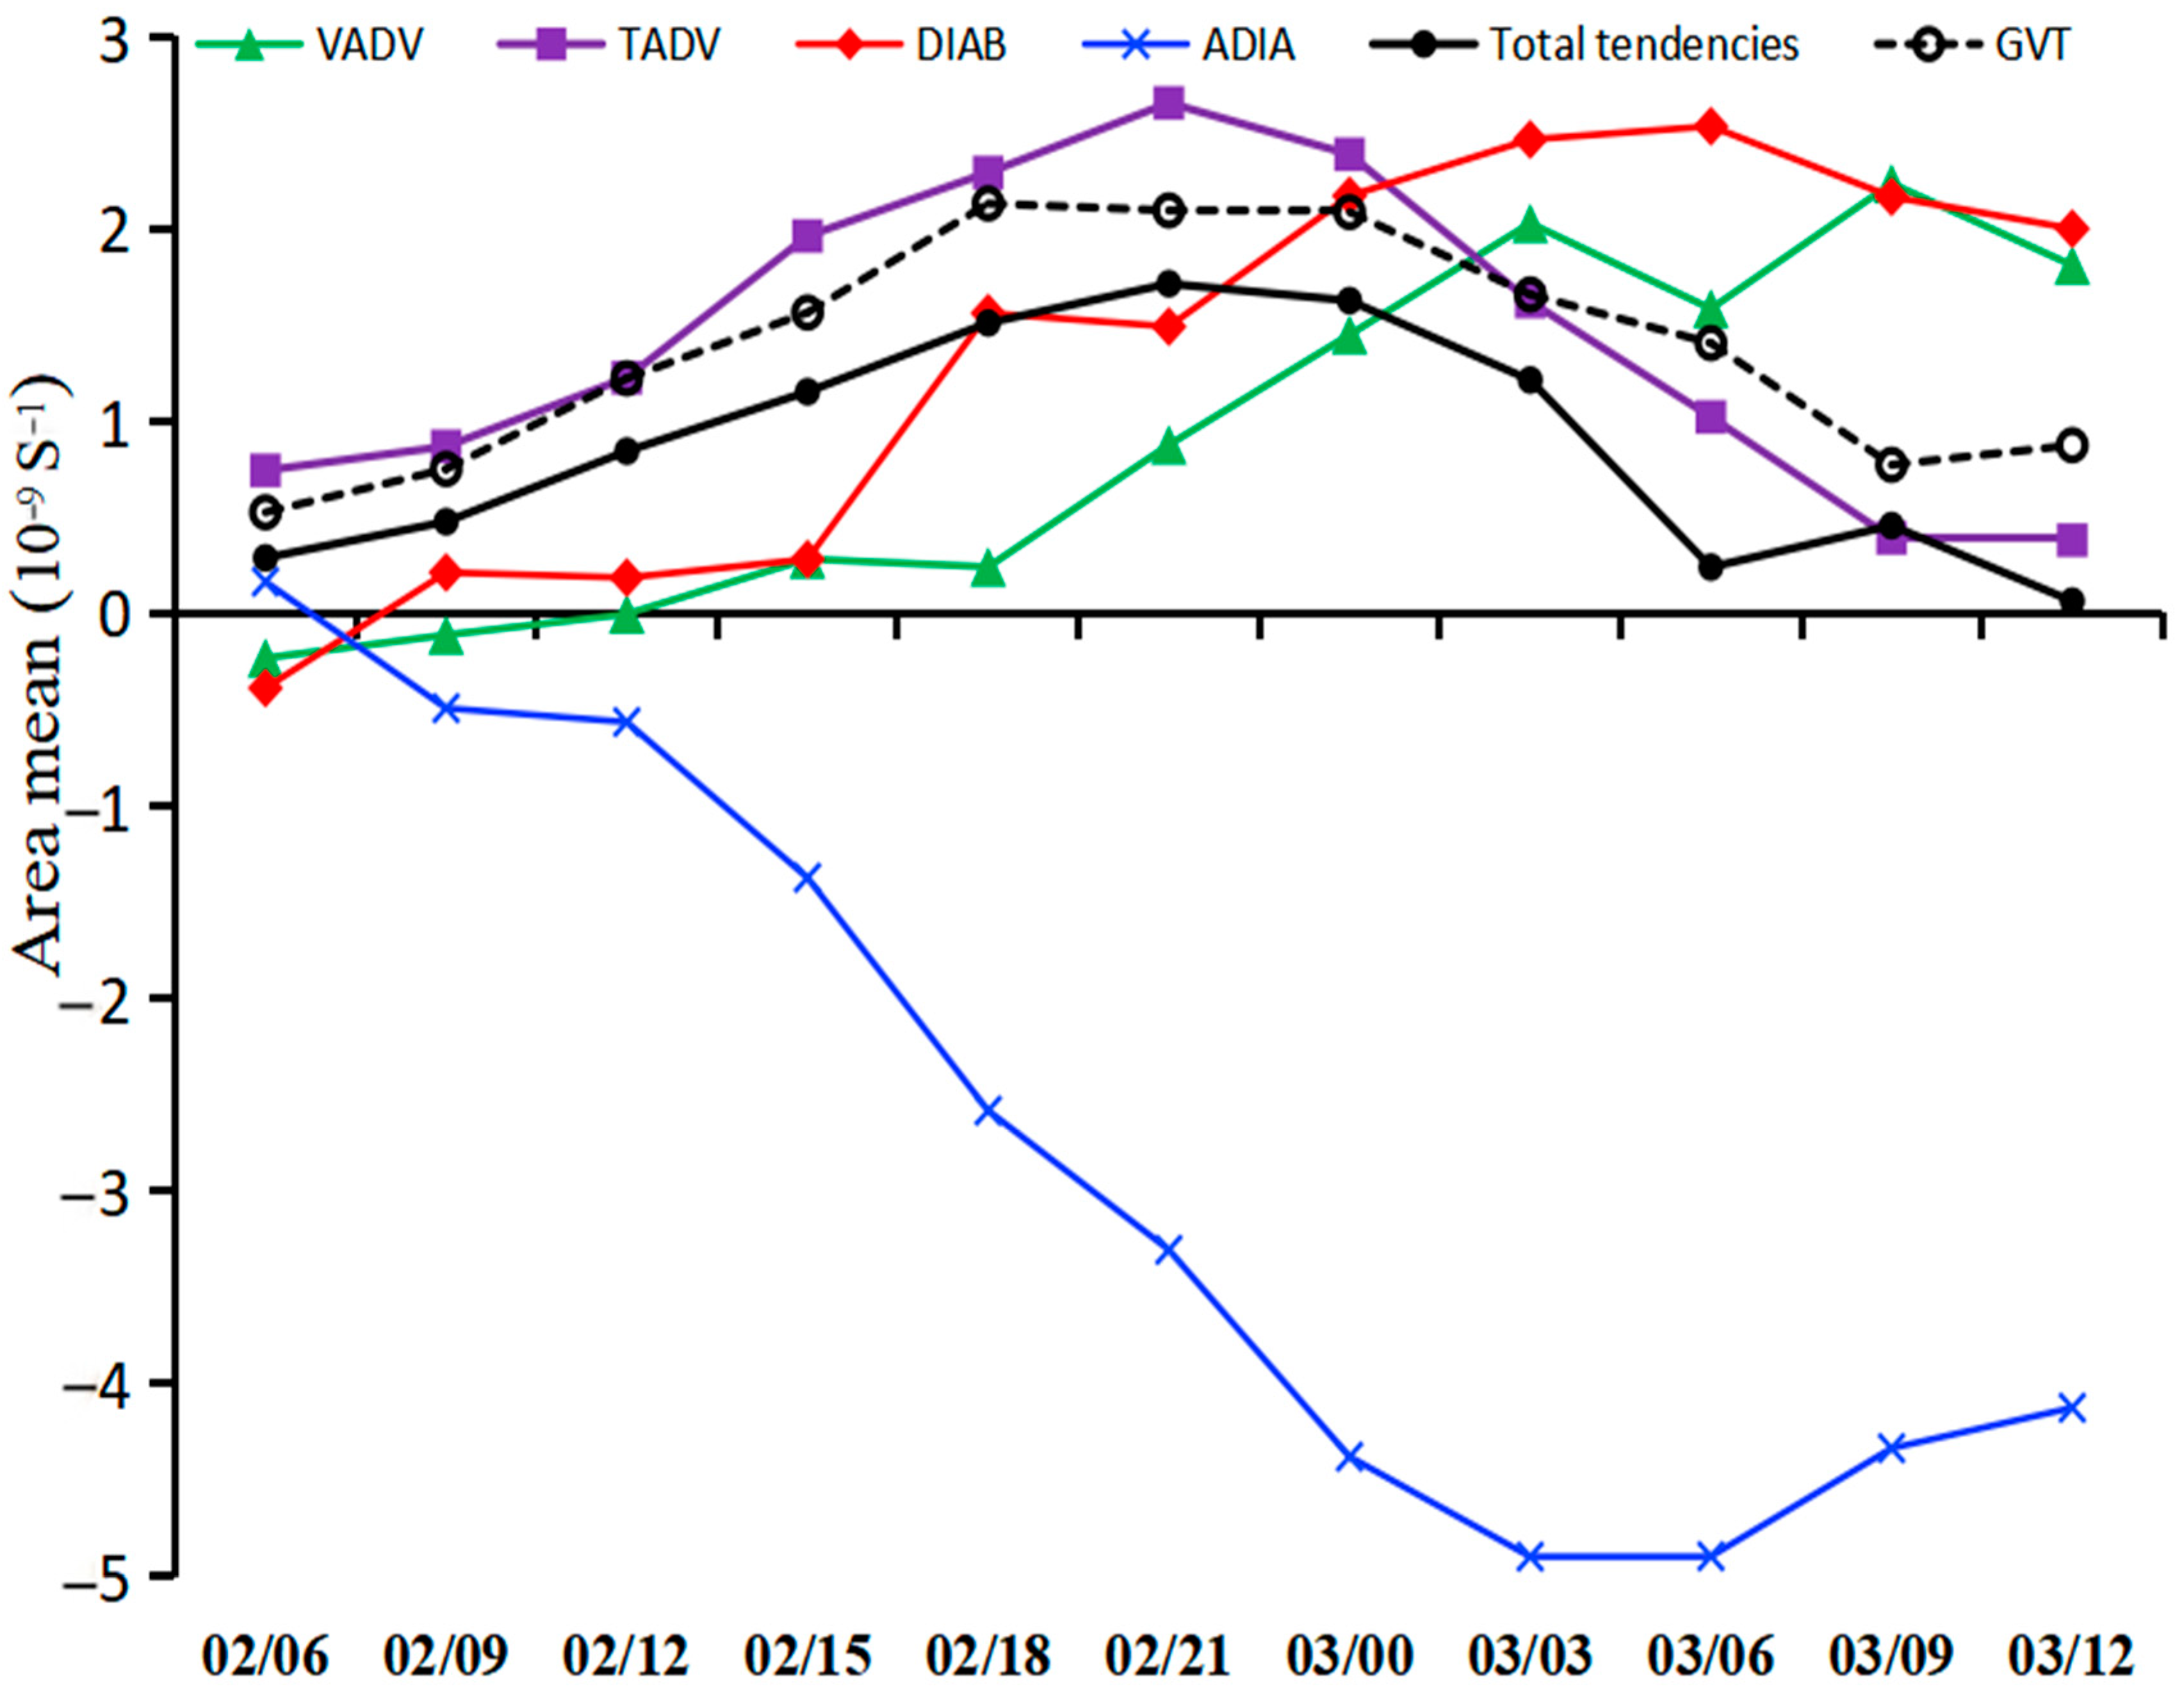
Figure 4 displays the contributions of each term to the total tendency at the initial explosive development moment and the maximum-deepening-rate moment of the EC. At the initial explosive development moment, the integrated cyclonic vorticity advection center (positive VADV in Equation (1)) of 2 × 10⁻⁹ s−2 was distributed far away from the EC’s center (Figure 4a). The integrated warm-air advection center (positive TADV in Equation (1)) of 3 × 10⁻⁹ s−2 was located close to the EC’s center (Figure 4b), and a distant center of 3 × 10⁻⁹ s−2 in the northeast. The integrated diabatic heating (positive DIAB in Equation (1)) from the latent heat release around the EC center was weak (Figure 4c), a distant center existed to the northwest of the EC’s center with a value of 8 × 10⁻⁹ s−2. The integrated adiabatic heating (negative ADIA in Equation (1)) was negative around the EC’s center (Figure 4d). The mean contributions of each term were calculated in a 10° × 10° domain moving with the EC’s center 6 h after the analyzed moment [7]. The results are displayed in Figure 5. For the EC at the initial explosive development moment (15 UTC 2, i.e., “02/15”), it can be seen that the warm-air advection was 1.96 × 10⁻⁹ s−2, which is much larger than the cyclonic vorticity advection (0.28 × 10⁻⁹ s−2) and diabatic heating (0.27 × 10⁻⁹ s−2). These results indicate that the warm-air advection triggered the initial explosive development of the EC.
Approaching the maximum-deepening-rate moment, the integrated cyclonic vorticity advection increased and moved closer to the EC’s center, the central value was 4 × 10⁻⁹ s−2 to the southwest of the EC (Figure 4e). The integrated warm-air advection superposed on the EC center and increased to 10 × 10−9 s−2 (Figure 4f). The integrated diabatic heating, resulting from the latent heat release near the EC’s center, strengthened greatly to 8 × 10⁻⁹ s−2 (Figure 4g). The integrated adiabatic cooling was generally opposite to the diabatic heating (Figure 4h). For the mean values of each term for the EC (00 UTC 3, i.e., “03/00” in Figure 5), the warm-air advection was still the maximum (2.38 × 10⁻⁹ s−2), followed by the diabatic heating (2.17 × 10⁻⁹ s−2) and cyclonic vorticity advection (1.45 × 10⁻⁹ s−2).
Figure 5 displays the evolution of the area mean value of each term. For the EC, from the initial explosive development moment (15 UTC 2) to the maximum-deepening-rate moment (00 UTC 3), the cyclonic vorticity advection, warm-air advection, and diabatic heating increased. The non-key factors of the diabatic heating and cyclonic vorticity advection at the initial explosive development moment had increased to 1.90 × 10⁻⁹ s−2 and 1.17 × 10⁻⁹ s−2, respectively, while the warm-air advection had increased slightly (0.42 × 10⁻⁹ s−2). These results suggest that the non-key factors at the initial moment of explosive development tended to increase evidently and contributed most to the explosive development. Thus, it can be inferred that the key factors for the explosive development of ECs are different at different explosive development stages. These diagnostic results are consistent with the synoptic-scale atmospheric environmental conditions. The mid-upper trough, baroclinicity, and water vapor convergence, which were linked to the increase in the cyclonic vorticity advection, warm-air advection, and diabatic heating, increased and approached the EC’s center (Figure 2). The cyclonic vorticity advection, warm-air advection, and diabatic heating can increase near-surface convergence and vorticity, which favors the rapid development of ECs.

4.2. Vertical Structure

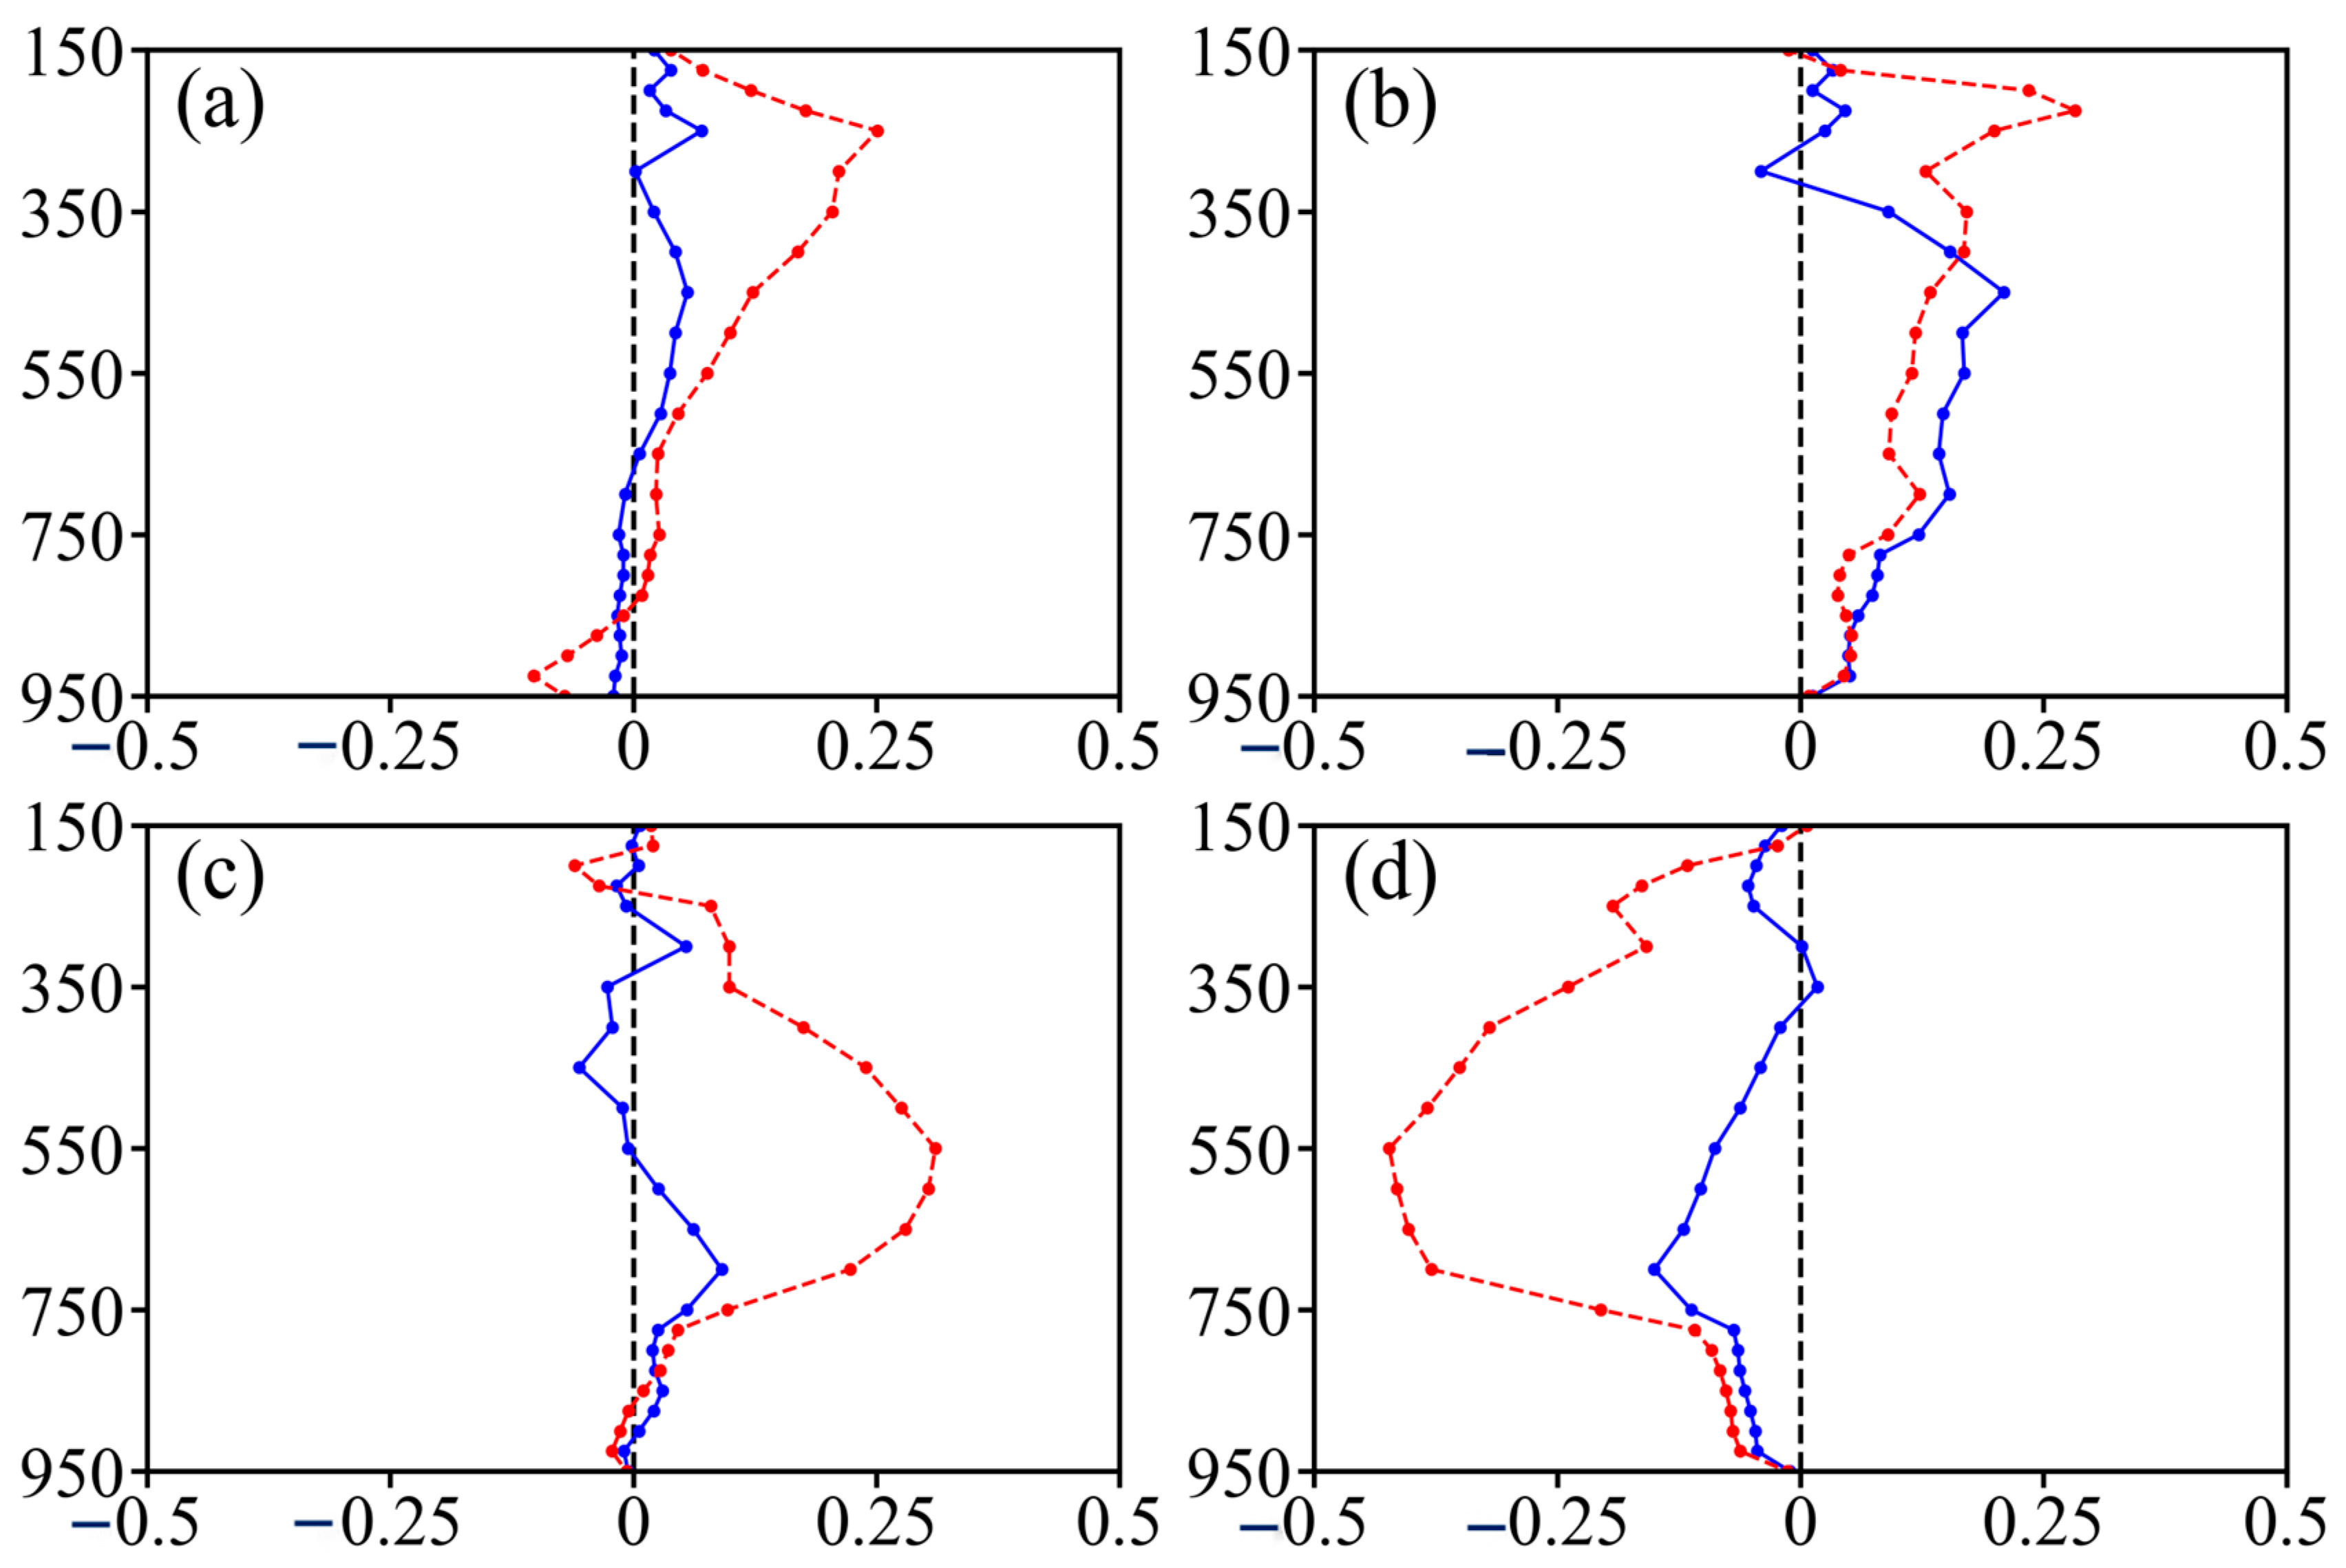
A cross-section along the green lines in Figure 4 was made for each term of Equation (1) at the initial explosive development moment and the maximum-deepening-rate moment. At the initial explosive development moment (Figure 6a–d), a cyclonic vorticity advection of more than 0.2 × 10⁻⁹ s−2 appeared at about 550–200 hPa and farther away from the EC’s center (Figure 6a). The warm-air advection had one stronger positive value region in the upper troposphere and two weaker positive value regions in the mid–low troposphere (Figure 6b). Although the one in the upper troposphere was stronger, it was far away from the EC’s center. The diabatic heating was stronger in the upstream near 750–350 hPa, while being weaker near the EC’s center (Figure 6c). The adiabatic cooling showed the opposite pattern to the diabatic heating, indicating that the ascending motion occurred over the area of diabatic heating (Figure 6d). Figure 7 shows the vertical profiles of the area mean (10° × 10°) of each term for the EC. At the initial explosive development moment (Figure 7, blue solid line), the vertical profile of the cyclonic vorticity advection and the diabatic heating were relatively small in the whole troposphere (Figure 7a,c). The EC had warm-air advection below 300 hPa, which was much stronger than the cyclonic vorticity advection and the diabatic heating (Figure 7b). There was adiabatic cooling in the whole troposphere (Figure 7d).
From the initial explosive development moment to the maximum-deepening-rate moment, the cyclonic vorticity advection, the warm-air advection, and the diabatic heating generally increased around the EC’s center. The cyclonic vorticity advection increased to 0.4 × 10⁻⁹ s−2 near 350 hPa and approached the EC’s center (Figure 7e). The warm-air advection decreased in the upper troposphere but increased slightly in the mid–low troposphere above the EC’s center (Figure 7f). The diabatic heating, the intensity of which increased, superposed on the EC center and dominated 800–300 hPa (Figure 7g). The adiabatic cooling also showed the opposite pattern to the diabatic heating terms (Figure 7h). The vertical profile of each term at the maximum-deepening-rate moment is shown in Figure 7 (red dashed line). Compared with the initial explosive development moment (blue solid line), the cyclonic vorticity advection and warm-air advection for the EC increased in the upper troposphere (Figure 7b,c). The vertical profile of the diabatic heating for the EC was enhanced obviously between 750 and 400 hPa. The cyclonic vorticity advection, warm-air advection, and diabatic heating increased and approached the EC’s center, which favored the rapid development of the EC. Based on the area mean (Figure 5) and the vertical profile (Figure 7) of each term from the initial explosive development moment to the maximum-deepening-rate moment, the cyclonic vorticity advection and warm-air advection increased in the upper troposphere and diabatic heating increased in the middle troposphere.

5. Discussion and Conclusions

The Japan Sea is a region with frequent occurrences of ECs off the East Asian coast. The variations in the key factors of the most rapidly intensifying EC over the Japan Sea in the cold season (October–April) during the 44-year period 1979–2022 at different explosive development stages were examined and compared based on the ERA5 data and the diagnostic method.
The most rapidly intensifying EC was formed over the eastern China continent; it began explosive development when it moved from being over the land to over the sea. The EC deepened rapidly, with the maximum deepening rate of 3.07 bergerons occuring to the southwest of the Japan Sea. The explosive development stage lasted for 18 h. The central SLP dropped to a minimum of 948.0 hPa to the southwest of the Okhotsk Sea. At the initial explosive development moment, the baroclinic zone was distinctive to the southwest and northeast. The specific humidity and the water vapor convergence were weak. The shallow 500 hPa height trough associated with the weak cyclonic vorticity distributed to the upstream. These environmental parameters were generally enhanced and approached the EC’s center from the initial explosive development moment to the maximum-deepening-rate moment. The temperature wave became severely distorted, resulting in stronger baroclinicity. The water vapor convergence increased obviously. The 500 hPa trough and the cyclonic vorticity advection increased. The EC moved to the left of the jet stream exit, which is usually associated with strong upper-level dynamic forcing.
A diagnostic analysis using the Z-O equation was further employed to investigate the key thermodynamic and dynamic factors contributing to the explosive development of the EC at various explosive development stages quantitatively. Warm-air advection dominated the initial explosive development of the EC. From the initial explosive development moment to the maximum-deepening-rate moment, the cyclonic vorticity advection and diabatic heating for the EC increased greatly to become the key factors and combined with the warm-air advection to produce the maximum explosive development. The non-key factors at the initial explosive development moment had been strengthened evidently at the maximum-deepening-rate moment, providing increasing contributions to the rapid intensification. Therefore, the factors favoring the rapid intensification of the EC varied with the explosive development stage. The serious damage due to the strong destructive power of ECs usually occurs during the most rapid development. To forecast the rapid intensification, more attention should be paid to the non-key factors at the initial explosive development stage. The cross-section and vertical profile of each term suggested that from the initial explosive development moment to the maximum-deepening-rate moment, the cyclonic vorticity advection increased in the upper troposphere and diabatic heating increased in the middle troposphere.
Previous studies generally focused on the development mechanisms of ECs at the maximum-deepening-rate moment [7,23,24,28], they seldom discussed the variations in the forcing factors during the different explosive development stages. It was interesting to find that the non-key factors of the extreme EC at the initial explosive development stage increased and approached the EC’s center, and became key factors favoring the most rapid development. For example, although the latent heat release was a non-key factor for the EC at the initial explosive development moment, it increased quickly and contributed to the most rapid intensification, which was consistent with Heo et al. [28] but inconsistent with Kuwano-Yoshida and Asuma [27], who found that the extreme case over the Okhotsk–Japan Sea was insensitive to the latent heat release. This difference may be due to the individual case with a different intensity. Moreover, the latent heat release played a more and more important role with the rapid intensification. Yoshida and Asuma [7] suggested that ECs over the Japan Sea had a small contribution from latent heat release using the composite analyses of moderate ECs at the maximum-deepening-rate moments. Several studies also showed that the specific humidity or water vapor convergence over the Japan Sea were generally weak during EC development [8]. While the latent heat release was a key factor for the rapid development of the extreme EC in the present study, which seem to have similar key factors with ECs over the northwestern Pacific [3,17,30]. Probably, the extreme EC in the present study differed from the general ECs over the Japan Sea, and the special key factors had a significant influence on the rapid development. The development mechanisms of ECs are complex; the key factors vary during the evolutionary process. The thermodynamic and dynamic factors of large cases require further investigation to gain a comprehensive understanding of them. Furthermore, numerical simulations need to be used to examine the development mechanisms in subsequent work.

Author Contributions

Conceptualization, S.Z. and T.Z.; methodology, S.Z. and T.Z.; software, Y.T., Q.L. and L.Z.; formal analysis, S.Z., Y.T. and T.Z.; data curation, Y.T.; writing—original draft preparation, S.Z., T.Z. and Y.T.; writing—review and editing, S.Z., T.Z. and Q.L.; visualization, S.Z., Q.L. and L.Z. All authors have read and agreed to the published version of the manuscript.

Funding

This research was jointly funded by the National Key Research and Development Program of China (Grant number 2021YFC3101801); the Youth Innovative Talents Program of Guangdong Colleges and Universities (Grant number 2022KQNCX026, 030302032301); the Project of Enhancing School with Innovation of Guangdong Ocean University (Grant number 230419106); Guangdong Science and Technology Plan Project (Observation of Tropical marine environment in Yuexi); the National Natural Science Foundation of China (Grant number 41976200, 42276019); the State Key Program of National Natural Science Foundation of China (Grant number 42130605); the College Student Innovation Team Project of Guangdong Ocean University (Grant number 010404032101, 010413032201); and Guangdong Ocean University PhD. Scientific Research Program (Grant number R19045, 060302032106).

Institutional Review Board Statement

Not applicable.

Informed Consent Statement

Not applicable.

Data Availability Statement

Acknowledgments

Special thanks to the funding organizations and ECMWF for providing the ERA5 data.

Conflicts of Interest

The authors declare no conflict of interest.

References

  1. Sanders, F.; Gyakum, J.R. Synoptic-dynamic climatology of the “bomb”. Mon. Weather Rev. 1980, 108, 1589–1606. [Google Scholar] [CrossRef]
  2. Katsafados, P.; Mavromatidis, E.; Papadopoulos, A.; Pytharoulis, I. Numerical simulation of a deep Mediterranean storm and its sensitivity on sea surface temperature. Nat. Hazards Earth Syst. Sci. 2011, 11, 1233–1246. [Google Scholar] [CrossRef]
  3. Fink, A.; Pohle, S.; Pinto, J.G.; Knippertz, P. Diagnosing the influence of diabatic process on the explosive deepening of extratropical cyclones. Atmos. Sci. Lett. 2012, 39, 7. [Google Scholar]
  4. Liberato, M.L.R. The 19 January 2013 windstorm over the North Atlantic: Large scale dynamics and impacts on Iberia. Weather Clim. Extrem. 2014, 5, 16–28. [Google Scholar] [CrossRef]
  5. Roebber, P.J. Statistical analysis and updated climatology of explosive cyclones. Mon. Weather Rev. 1984, 112, 1577–1589. [Google Scholar] [CrossRef]
  6. Gyakum, J.R.; Anderson, R.; Grumm, H.; Gruner, E.L. North Pacific cold-season surface cyclone activity: 1975–1983. Mon. Weather Rev. 1989, 117, 1141–1155. [Google Scholar] [CrossRef]
  7. Yoshida, A.; Asuma, Y. Structures and environment of explosively developing extratropical cyclones in the Northwestern Pacific region. Mon. Weather Rev. 2004, 132, 1121–1142. [Google Scholar] [CrossRef]
  8. Zhang, S.; Fu, G.; Lu, C.; Liu, J. Characteristics of explosive cyclones over the Northern Pacific. J. Appl. Meteor. Clim. 2017, 56, 3187–3210. [Google Scholar] [CrossRef]
  9. Iwao, K.; Inatsu, M.; Kimoto, M. Recent changes in explosively developing extratropical cyclones over the winter Northwestern Pacific. J. Clim. 2012, 25, 7282–7296. [Google Scholar] [CrossRef]
  10. Seiler, C.; Zwiers, F.W. How well do CMIP5 climate models reproduce explosive cyclones in the extratropics of the Northern Hemisphere? Clim. Dyn. 2016, 46, 1241–1256. [Google Scholar] [CrossRef]
  11. Seiler, C.; Zwiers, F.W. How will climate change affect explosive cyclones in the extratropics of the Northern Hemisphere? Clim. Dyn. 2016, 46, 3633–3644. [Google Scholar] [CrossRef]
  12. Fu, G.; Sun, Y.W.; Sun, J.L.; Li, P.Y. A 38-year climatology of explosive cyclones over the Northern Hemisphere. Adv. Atmos. Sci. 2020, 37, 143–159. [Google Scholar] [CrossRef]
  13. Chen, S.J.; Dell’osso, L. A numerical case study of East Asian coastal cyclogenesis. Mon. Weather Rev. 1987, 115, 477–487. [Google Scholar] [CrossRef]
  14. Chen, S.J.; Kuo, Y.H.; Zhang, P.Z.; Bai, Q.F. Climatology of explosive cyclones off the East Asian coast. Mon. Weather Rev. 1992, 120, 3029–3035. [Google Scholar] [CrossRef]
  15. Sanders, F.; Davis, C.A. Patterns of thickness anomaly for explosive cyclogenesis over the West-Central North Atlantic Ocean. Mon. Weather Rev. 1988, 116, 2725–2730. [Google Scholar] [CrossRef]
  16. Wang, C.C.; Rogers, J.C. A composite study of explosive cyclogenesis in different sectors of the North Atlantic. Part I: Cyclone structure and evolution. Mon. Weather Rev. 2001, 129, 1481–1499. [Google Scholar] [CrossRef]
  17. Hirata, H.; Kawamura, R. Influential role of moisture supply from the Kuroshio/Kuroshio Extension in the rapid development of an extratropical cyclone. Mon. Weather Rev. 2015, 143, 4126–4144. [Google Scholar] [CrossRef]
  18. Zhang, S.; Liu, C.; Xu, J.; Zhang, S.; Tang, R.; Huang, Z.; Zheng, Y.; Guan, Z.; Mao, H.; Xue, Y. Physical process contributions to the development of a super explosive cyclone over the Gulf Stream. Front. Earth Sci. 2021, 9, 722555. [Google Scholar] [CrossRef]
  19. Sanders, F. Explosive cyclogenesis in the West-Central North Atlantic Ocean, 1981–1984. Part I: Composite structure and mean behavior. Mon. Weather Rev. 1986, 114, 1781–1794. [Google Scholar] [CrossRef]
  20. Azad, R.; Sorteberg, A. The vorticity budgets of North Atlantic winter extratropical cyclone life cycles in MERRA reanalysis. Part I: Development phase. J. Atmos. Sci. 2014, 71, 3109–3128. [Google Scholar] [CrossRef]
  21. Uccellini, L.W.; Kocin, P.J. The interaction of jet streak circulations during heavy snow events along the east coast of United States. Weather Forecast. 1987, 2, 289–308. [Google Scholar] [CrossRef]
  22. Wash, C.H.; Peak, J.E.; Calland, W.E.; Cook, W.A. Diagnostic study of explosive cyclogenesis during FGGE. Mon. Weather Rev. 1988, 116, 431–451. [Google Scholar] [CrossRef]
  23. Wang, S.; Fu, G.; Pang, H. Structure analyses of the explosive extratropical cyclone: A case study over the Northwestern Pacific in March 2007. J. Ocean Univ. China 2017, 16, 933–944. [Google Scholar] [CrossRef]
  24. Kuwano-Yoshida, A.; Enomoto, T. Predictability of explosive cyclogenesis over the Northwestern Pacific region using ensemble reanalysis. Mon. Weather Rev. 2013, 141, 3769–3785. [Google Scholar] [CrossRef]
  25. Zhang, S.; Fu, G. Structures and evolution of explosive cyclones over the Northwestern and Northeastern Pacific. J. Ocean Univ. China 2018, 17, 581–593. [Google Scholar] [CrossRef]
  26. Kang, J.M.; Lee, J.; Son, S.W.; Kim, J.; Chen, D. The rapid intensification of East Asian cyclones around the Korean Peninsula and their surface impacts. J. Geophys. Res. Atmos. 2020, 125, e2019JD031632. [Google Scholar] [CrossRef]
  27. Kuwano-Yoshida, A.; Asuma, Y. Numerical study of explosively developing extratropical cyclones in the Northwestern Pacific region. Mon. Weather Rev. 2008, 136, 712–740. [Google Scholar] [CrossRef]
  28. Heo, K.Y.; Seo, Y.W.; Ha, K.J.; Park, K.S.; Kim, J.; Choi, J.W.; Jun, K.; Jeong, J.K. Development mechanisms of an explosive cyclone over East Sea on 3–4 April 2012. Dyn. Atmos. Ocean. 2015, 70, 30–46. [Google Scholar] [CrossRef]
  29. Hirata, H.; Kawamura, R.; Kato, M.; Shinoda, T. Response of rapidly developing extratropical cyclones to sea surface temperature variations over the western Kuroshio-Oyashio confluence region. J. Geophys. Res. Atmos. 2016, 121, 3843–3858. [Google Scholar] [CrossRef]
  30. Hirata, H.; Kawamura, R.; Kato, M.; Shinoda, T. A positive feedback process related to the rapid development of an extratropical cyclone over the Kuroshio/Kuroshio Extension. Mon. Weather Rev. 2018, 146, 417–433. [Google Scholar] [CrossRef]
  31. Yokoyama, Y.; Yamamoto, M. Influences of surface heat flux on twin cyclone structure during their explosive development over the East Asian marginal seas on 23 January. Weather Clim. Extrem. 2019, 23, 100198. [Google Scholar] [CrossRef]
  32. Hart, R.E. A cyclone phase space derived from thermal wind and thermal asymmetry. Mon. Weather Rev. 2003, 131, 585–616. [Google Scholar] [CrossRef]
  33. Zwack, P.; Okossi, B. A new method for solving the quasi-geostrophic omega equation by incorporating surface pressure tendency data. Mon. Weather Rev. 1986, 114, 655–666. [Google Scholar] [CrossRef]
  34. Lupo, A.R.; Smith, P.J.; Zwack, P. A diagnosis of the explosive development of two extratropical cyclones. Mon. Weather Rev. 1992, 120, 1490–1523. [Google Scholar] [CrossRef]
  35. Strahl, J.L.S.; Smith, P.J. A diagnostic study of an explosively developing extratropical cyclone and an associated 500-hPa trough merger. Mon. Weather Rev. 2001, 129, 2310–2328. [Google Scholar] [CrossRef]
  36. Morris, W.E.; Smith, P.J. Cyclolysis: A diagnosis of two extratropical cyclones. Mon. Weather Rev. 2001, 129, 2714–2729. [Google Scholar] [CrossRef]
  37. Rausch, R.L.M.; Smith, P.J. A diagnosis of a model simulated explosively developing extratropical cyclone. Mon. Weather Rev. 1996, 124, 875–904. [Google Scholar] [CrossRef]
  38. Holton, J.R. An Introduction to Dynamic Meteorology, 4th ed.; International Geophysics Series; Academic Press: Cambridge, MA, USA, 2004; Volume 88, p. 535. [Google Scholar]
  39. Shapiro, R. Smoothing, filtering, and boundary effects. Rev. Geophys. 1970, 8, 359–387. [Google Scholar] [CrossRef]
  40. Sanders, F. Analytic solutions of the nonlinear omega and vorticity equations for a structurally simple model of disturbances in the baroclinic westerlies. Mon. Weather Rev. 1971, 99, 393–408. [Google Scholar] [CrossRef]
  41. Warrenfeltz, L.L.; Elsberry, R.L. Superposition effects in rapid cyclogenesis-Linear model studies. J. Atmos. Sci. 1989, 46, 789–802. [Google Scholar] [CrossRef]
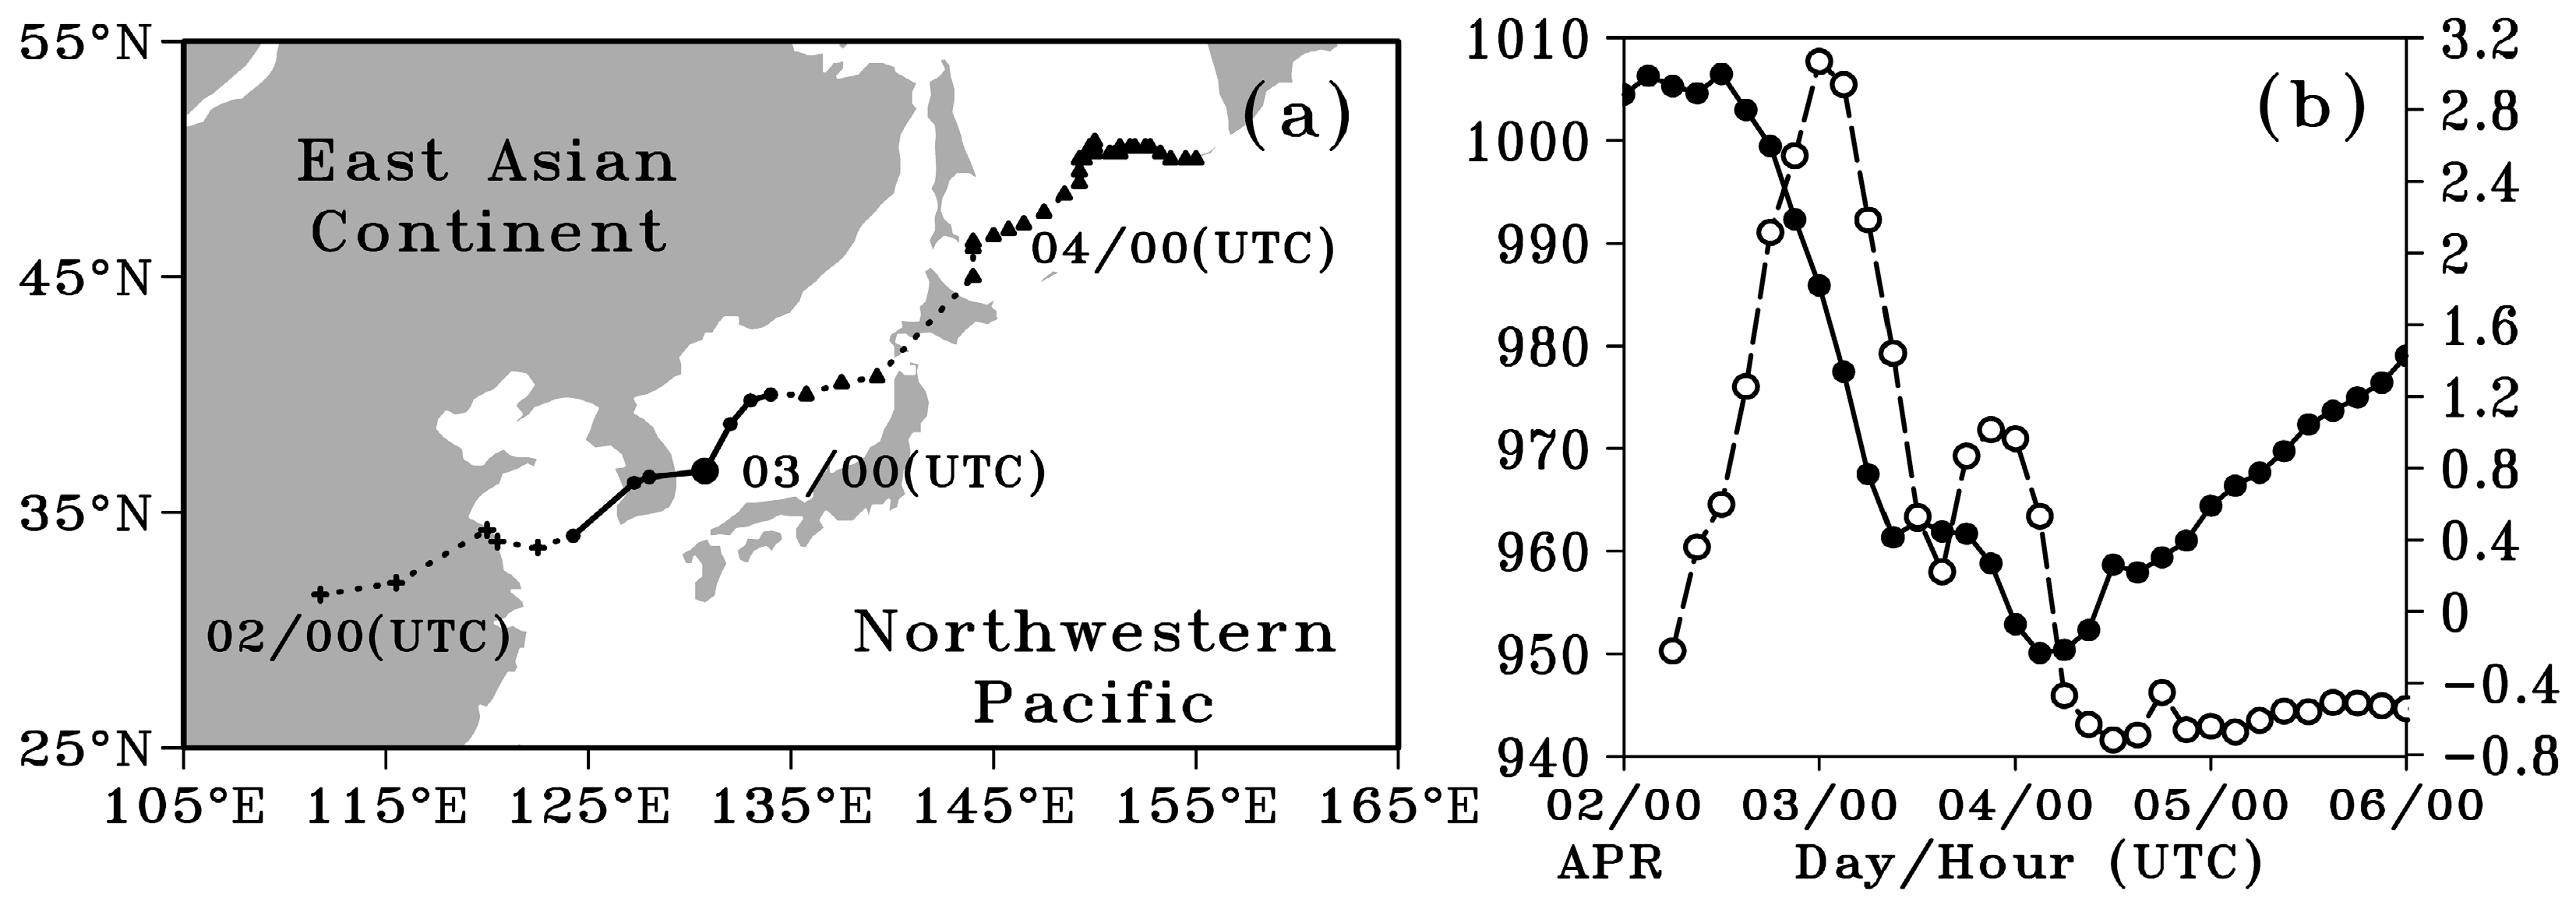
Figure 1. (a) Movement track of the EC (3 h intervals). “+” is the EC center before the explosive development stage with deepening rate smaller than 1.0 bergeron, “•” is the EC center during the explosive development stage with deepening rate larger than 1.0 bergeron, “▲” is the EC center after the explosive development stage with deepening rate smaller than 1.0 bergeron. The larger “•” indicates the cyclone center at the maximum-deepening-rate moment. (b) Time series of the central sea level pressure (solid line, hPa) and its deepening rate (dashed line, bergerons).
Atmosphere 14 01327 g001
Figure 2. Synoptic weather charts for (ad) at 15 UTC 2, and (eh) at 00 UTC 3 April 2012. (a,e) 850 hPa geopotential height (solid, 40 gpm intervals), potential temperature (dashed, 4 °C intervals), temperature advection (shaded, 4 × 10⁻⁴ k s−1 intervals); (b,f) 850 hPa horizontal wind vector (arrow, ≥16 m s−1), specific humidity (solid, 2 g kg−1 intervals) and water vapor convergence (shaded, 2 × 10⁻⁴ g kg−1 s−1 intervals); (c,g) 500 hPa geopotential height (solid, 60 gpm intervals), temperature (dashed, 4 °C intervals) and vorticity advection (shaded, 2 × 10⁻⁸ s−2 intervals); (d,h) 300 hPa geopotential height (solid, 120 gpm intervals), horizontal wind vector (arrow, ≥40 m s−1) and jet stream (shaded, ≥40 m s−1, 10 m s−1 intervals). The solid square indicates the center of the EC.
Atmosphere 14 01327 g002
Figure 3. The geostrophic vorticity tendency at 950 hPa (contour, the term on the left-hand side of Equation (1), 1 × 10⁻⁹ s−2 intervals) and the total tendency (shaded, the sum of the four terms on the right-hand side of Equation (1), 1 × 10⁻⁹ s−2 intervals) at (a) 15 UTC 2, (b) 18 UTC 2, (c) 21 UTC 2, (d) 00 UTC 3, (e) 03 UTC 3, and (f) 06 UTC 3 April 2012 for the EC. The large solid dot denotes the center of the EC at 6 h after the corresponding moment.
Atmosphere 14 01327 g003
Figure 4. Contributions of individual terms (contours, 2 × 10⁻⁹ s−2 intervals) to the total tendency (shaded, 1 × 10⁻⁹ s−2 intervals) for the EC (ad) at 15 UTC 2, and (eh) at 00 UTC 3 April 2012. The large solid dot denotes the center of the EC at 6 h after the corresponding moment. (a,e) The vorticity advection, (b,f) the temperature advection, (c,g) the diabatic heating, and (d,h) the adiabatic heating. Lines A1–B1 and C1–D1 cross the center of the EC and the total tendency center is used for vertical cross-section analysis later in Figure 6.
Atmosphere 14 01327 g004
Figure 5. Time series of the area mean vorticity advection (VADV, green), temperature advection (TADV, purple), diabatic heating (DIAB, red), adiabatic heating (ADIA, blue), the sum of the four terms on the right-hand side of Equation (1) (the total tendency, black), and the geostrophic vorticity tendency at 950 hPa on the left-hand side of Equation (1) (GVT, dashed) for the EC. The horizontal axis represents the “day/hour”, for example, “02/06” means “06 UTC 02”. The area is selected to be 10° × 10°, which moved with the center of the EC.
Atmosphere 14 01327 g005
Figure 6. Vertical cross-section along the lines A1–B1 and C1–D1 as illustrated in Figure 4. (ad) for the EC at 15 UTC 2, and (eh) at 00 UTC 3 April 2012. (a,e) vorticity advection (0.2 × 10⁻⁹ s−2 intervals), (b,f) temperature advection (0.2 × 10⁻⁹ s−2 intervals), (c,g) diabatic heating (0.2 × 10⁻⁹ s−2 intervals), (d,h) adiabatic heating (0.2 × 10⁻⁹ s−2 intervals). The solid semicircle denotes the center of the EC.
Atmosphere 14 01327 g006
Figure 7. Vertical profiles of area mean individual terms within a bin of 10° × 10° in Equation (1) for the EC at 15 UTC 2 (blue solid line), and 00 UTC 3 April 2012 (red dashed line). (a) Vorticity advection (10−9 s−2), (b) temperature advection (10−9 s−2), (c) diabatic heating (10−9 s−2), and (d) adiabatic cooling (10−9 s−2).
Atmosphere 14 01327 g007
Disclaimer/Publisher’s Note: The statements, opinions and data contained in all publications are solely those of the individual author(s) and contributor(s) and not of MDPI and/or the editor(s). MDPI and/or the editor(s) disclaim responsibility for any injury to people or property resulting from any ideas, methods, instructions or products referred to in the content.