Article

Characteristics of Biometeorological Conditions in Poland during the Long May Weekend Based on the Universal Thermal Climate Index

by
Arkadiusz Marek Tomczyk
* and
Karolina Mendel
Department of Meteorology and Climatology, Adam Mickiewicz University, 61-680 Poznań, Poland
*
Author to whom correspondence should be addressed.
Atmosphere 2023, 14(9), 1334; https://doi.org/10.3390/atmos14091334
Submission received: 18 July 2023 / Revised: 14 August 2023 / Accepted: 20 August 2023 / Published: 24 August 2023
(This article belongs to the Section Biometeorology)

Abstract

:
The study objective was to characterise biometeorological conditions during the long May weekend (1–3 May) in Poland in the period 1966–2020 and determine baric conditions causing their variability. The conducted research employed data such as air temperature, relative humidity, wind speed, and total cloudiness. The aforementioned data were collected at 12:00 UTC. In the first year of the conducted study, the Universal Thermal Climate Index (UTCI) was calculated for the period of 1–3 May in the years 1966–2020. Next, circulation conditions were analysed in the designated groups based on daily sea level atmospheric pressure values and isobaric surface height of 500 hPa. This study evidenced the occurrence of variable biometeorological conditions during the long May weekend in Poland. The lowest index values were recorded at the coast of the Baltic Sea and in Northeast Poland, and the highest in the southern and western regions. On the analysed days of May in the years 1966–2020, days classified as days with no thermal stress were recorded the most frequently, followed by days with cold stress, and days with warm stress that occurred sporadically. People planning tourist activity on the analysed days should be prepared for diverse biometeorological conditions, from those causing cold stress to those causing heat stress.

1. Introduction

The human organism present in the atmospheric environment is affected by many co-occurring meteorological factors, e.g., air temperature and humidity, wind, precipitation, etc. Therefore, research on biometeorological conditions is recommended to employ indices that simultaneously consider different meteorological elements. Due to the necessity to apply many frequently largely unavailable meteorological data, however, biometeorological indices are not in common use. Despite these difficulties, a number of papers from Poland have been published in recent years such as analysing weather conditions based on biometeorological indices. The studies primarily focus on the analysis of the occurrence of extreme conditions that cause at least strong cold [1,2,3,4,5] or heat stress [2,5,6,7,8,9]. An important group of studies are publications discussing biometeorological conditions during heat waves [10,11] that constitute a serious threat to human health and life. According to Tomczyk et al. [10] in the case of the two longest HWs (from 1994, 2015) biometeorological conditions were similar, although more burdensome during the heat wave of 1994. During this wave, much higher maximum index values were recorded, but there were also more days with strong heat stress and extreme heat stress. During the first wave, there were also longer periods with severely aggravating conditions in one day and strong heat stress or extreme heat stress were recorded. In addition, in the case of the 2015 wave, there were more cases of extreme cold stress during the night hours.
According to Matzarakis et al. [12], the effect of weather or climate on tourist activity cannot be estimated only based on the analysis of air temperature and precipitation. As mentioned above, such research should employ various biometeorological indices. Papers have been published in recent years that use this type of indices to assess atmospheric conditions from the point of view of tourists and sports people. The studies were related to the organisation of international sporting events such as the FIFA World Cup in Qatar [13], or the Olympic Games in Tokyo [12,14,15] and Paris [16]. Research by Kosak et al. [14] allowed for the identification of places where runners can be exposed to extreme heat stress and the designation of sections of the route that require mitigating activities to the greatest degree, such as starting the race an hour earlier, enabling running in the shade of buildings, or use of urban greenery, including expanding tree crowns. The study confirms that weather and climate conditions can be an important factor in determining travel plans or outdoor and sporting events [16].
Similar conclusions have been drawn in Poland, where the seasonality of tourist traffic is primarily determined by the climate and the course of weather in a year [17,18]. The main elements affecting the intensity and variability of tourist traffic include sunshine duration, cloudiness, air and water temperature, wind speed, and number of days with precipitation [17,18]. Weather conditions particularly affect the number of non-organised tourists, including weekend and holiday visitors [17,18,19]. An example of such short-term tourist activity in Poland is trips during the so-called long May weekend (1–3 May). According to research conducted in the Świętokrzyski National Park, tourist traffic intensity largely depended on the weather factor [20,21]. Auguścik [22] also evidenced that weather conditions were one of the factors determining the number of tourists during the long May weekend in the Forest Arboretum of Warmia and Mazury in Kudypy.
Considering the effect of weather conditions on tourist activity, it is justified to characterise weather conditions in Poland based on one of the biometeorological indices and determine the causes of the occurrence of such conditions during one of the most popular weekends in Poland. The period from 1 to 3 May in Poland is a holiday: 1 May is celebrated as International Workers Day, 2 May is the Day of the Flag of the Republic of Poland, and 3 May is the National Third of May Holiday. Further, 1 and 3 May are days free from work. It is the first spring period after Easter dedicated to recreation. Moreover, it offers an opportunity to have a long (several-days-long) weekend by using single days of leave.
As already mentioned, weather conditions are an important factor that affects tourist traffic; therefore, the presented results can be of interest to both those planning holidays in the first days of May and to those dealing with tourist traffic management. Detailed investigation of biometeorological conditions offers a possibility of their optimal use from the point of view of tourism and recreation. Due to this, the objective of the study was to characterise biometeorological conditions in the period in Poland in the years 1966–2020 and to determine baric conditions causing their variability. The analysis of biometeorological conditions was based on the Universal Thermal Climate Index—one of the most popular indices applied in biometeorological research in Poland.

2. Research Area, Materials and Data Analysis
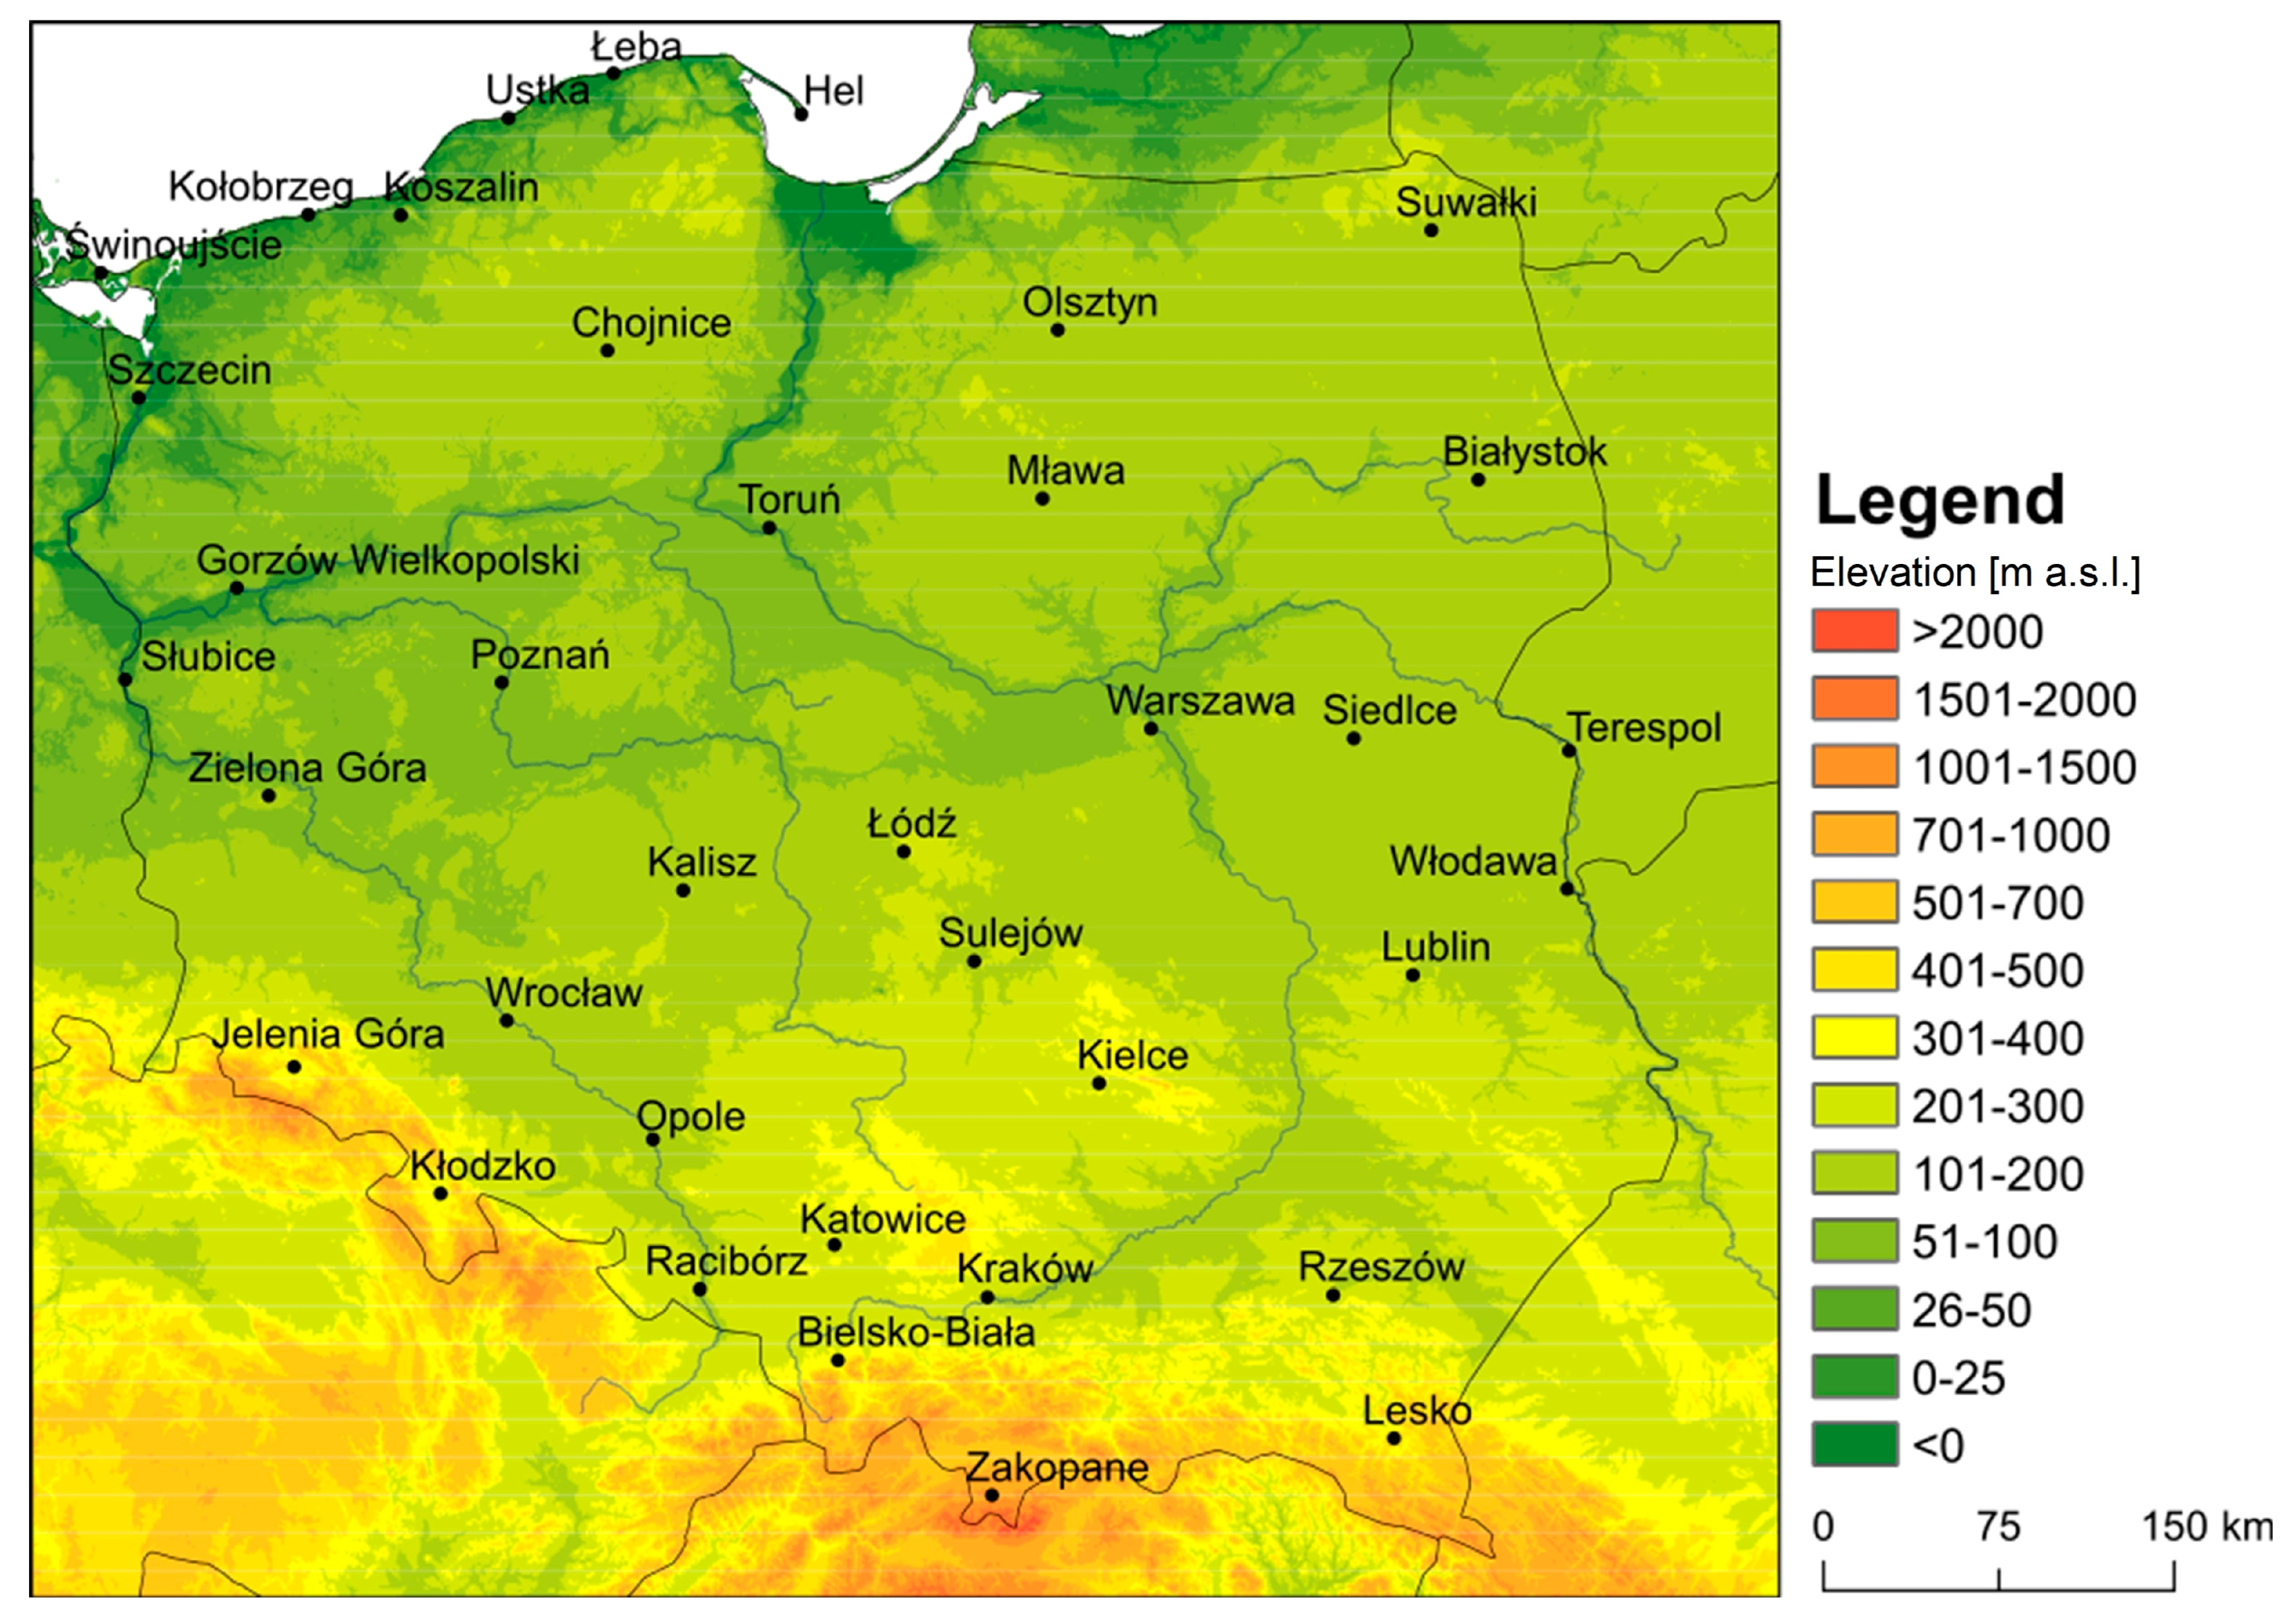
2.1. Research Area

According to the classification of climate by Köppen-Geiger [23], Poland is within the range of two types of climates, namely Cfb (oceanic climate) and Dfb (humid continental climate). The latter type only covers the eastern parts of the country. Research from the period 1991–2020 points to considerable variability of climatic conditions in Poland. Mean annual air temperature decreased from the west and southwest towards the northeast and with an increase in height above sea level [24]. The lowest mean annual air temperature was recorded in high mountain stations with a minimum on Kasprowy Wierch (0.2 °C). The most strenuous thermal conditions in summer were observed in West, Southwest, and South Poland, where hot days were the most frequent, and the most acute conditions in winter occurred in the mountains and northeastern regions with numerous very frosty days. Mean annual cloudiness showed no considerable spatial variability [25]. The highest number of cloudy days was recorded in mountain areas and sunny days in southeastern and northwestern regions. Atmospheric precipitation showed high variability [26]. The highest mean annual precipitation totals were recorded in the south of Poland—in mountain areas (on Kasprowy Wierch 1763.1 mm) and at the coast of the Baltic Sea. The area of Central Poland was characterised by low totals below 550 mm. The persistence of snow cover increased from the northwest (<30 days) towards the northeast (>70 days) and south with an increase in height above sea level (Kasprowy Wierch 217 days, Śnieżka 186 days) [27].

2.2. Materials

The study was based on data obtained from the resources of the Institute of Meteorology and Water Management—National Research Institute from the years 1966–2020 for 37 stations located in Poland (Figure 1). The conducted research employed data such as air temperature (°C), relative humidity (%), wind speed (m∙s−1), and total cloudiness (okta). The aforementioned data were collected at 12:00 UTC.

2.3. Data Analysis

In the first stage of the conducted study, the Universal Thermal Climate Index (UTCI) was calculated for the period of 1–3 May in the years 1966–2020. The index is defined as equivalent air temperature at which in reference conditions the basic physiological parameters of the organism would adopt the same values as in actual conditions. It is a one-dimensional value reflecting the response of the organism to the multidimensionally described meteorological and physiological information [28,29]. It is assumed that heat exchange between human organisms and the surroundings depends only on air temperature (Ta), at a constant level of the remaining meteorological parameters [28,29]. The index is based on Fiala’s multi-node human thermoregulation model [30,31] composed of two subsystems of heat exchange regulation: passive and active. UTCI values are a measure of heat stress of the organism and are expressed in °C. The calculation of UTCI values employed the BioKlima 2.6 package [32] with implemented calculation algorithms with the application of the sixth-degree exponential function [33]. A detailed description of the index is described in the publication by Błażejczyk et al. [33]. As shown by Błażejczyk et al. [28] UTCI correlated very well with all the indices that were derived from various human heat budget models (physiological equivalent temperature—PET, perceived temperature—PT, standard effective temperature—SET*, physiological subjective temperature—PST, physiological strain—PhS). The best relationships with UTCI were found for SET*, ET (effective temperature) and PT indices; they represented high correlation coefficients with slopes of regression lines close to 1.
The aforementioned data provided the basis for the analysis of the course of UTCI averaged for three days in the analysed multiannual period. The rate and direction of changes were assessed by means of linear regression, and the statistical significance of trends was verified by means of a t-Student test. The frequency of occurrence of particular UTCI categories was then determined (Table 1).
In the subsequent year, particular years were grouped in terms of average UTCI values by means of the Ward method [34]. The method is based on Euclidean distances. It involves combining two clusters A and B that combined into a single cluster to ensure a minimum of the sum of squares of deviations of all objects from the centre of gravity of the new cluster [35]. This is a hierarchical clustering technique, most frequently used for climatic classification [36] for identifying the atmospheric circulation patterns associated with the occurrence of specific weather phenomena [37,38]. Next, circulation conditions were analysed in the designated groups based on daily sea level atmospheric pressure values (SLP) and isobaric surface height of 500 hPa (z500 hPa). Data for nodes of the geographic grid 2.5 × 2.5° for the area 25–75° N and 35° W–65° E were obtained from the resources of the National Centre for Environmental Prediction/National Centre for Atmospheric Research (NCEP/NCAR) Reanalysis [39] available in the archives of NOAA ESRL PSD (Earth System Research Laboratory Physical Science Division). Based on the data, maps were prepared with average SLP and z500 hPa in particular types, and maps with average SLP and SLP and z500 hPa anomalies. The anomalies were calculated as the difference between the average value of SLP and z500 hPa on a specific day and the average value of the above elements on a given day in the analysed multiannual period.

3. Results

The average UTCI during the long May weekend in the period 1966–2020 in Poland was 11.8 °C. In the study area, the index values increased from the north towards the south and west of the country (Figure 2). The minimum value was recorded in Łeba (5.1 °C), and maximum in Opole (14.3 °C) (Figure 3). In the analysed stations, the variability of UTCI was at an approximate level, as confirmed by the value of the standard deviation within a range of 6.2–8.9 °C. Lower values were primarily observed in the northern and western regions.
At the scale of the entire area, the lowest average UTCI occurred in 1985 (−2.0 °C), and the highest in 2012 (24.8 °C) (Table 2). In the former year, the index values showed considerable spatial variability. The study area covered several regions with low UTCI. They were southwestern, southeastern, and northeastern regions, and a substantial central western part of the country (Figure 2). Considerably higher values were recorded in the upper and lower stretch of the Oder River and in North Poland. In particular stations, the average UTCI varied from −8.1 °C in Kłodzko and Lesko to 5.7 °C in Szczecin. A total of 35% of stations recorded the lowest index value in the entire multiannual period in that year. In the remaining stations, the minimum value was determined among others in 1970, 1971, 1979, and 1981.
In 2012, biometeorological conditions were approximate over a major area. The lowest index values were recorded in the eastern and western parts of the coast, and increased southwards, with a maximum in southeastern regions of the country (Figure 2). In particular stations, the average UTCI varied from 2.5 °C in Ustka to 32.8 °C in Rzeszów. In 60% of stations in that year, the highest index value in the entire multiannual period was recorded.
In the analysed multiannual period, an increase in UTCI was recorded with the exception of the station in Ustka. The most intensive changes occurred in the eastern and southeastern regions of the country, with a maximum in Lesko (1.88 °C/10 years) (Figure 3, Table 2). Statistically significant changes were observed in only three stations.
In the analysed period, days classified as days with no thermal stress were recorded the most frequently (Figure 4). Apart from the two stations (Łeba, Ustka), they occurred on more than half of the analysed days. In particular stations, their share varied from 36% in Łeba to 67% in Katowice. A share exceeding 60% was also determined in Białystok, Bielsko-Biała, Gorzów Wielkopolski, Kraków, Opole, Racibórz, Siedlce, Słubice, Terespol, Toruń, Wrocław, and Zakopane. Their frequency was followed by that of days with cold stress, and considerably more seldom days with heat stress. In the two aforementioned stations, i.e., in Łeba and Ustka, days with cold stress occurred the most frequently, accounting for 63% and 55%, respectively. Days with cold stress usually covered days with slight cold stress, accounting for 17% of Opole up to 36% in Łeba. Further, the share of days with moderate cold stress varied from 5% in Gorzów Wielkopolski, Katowice, Kraków, and Wrocław to 24% in Łeba. Days with strong cold stress occurred sporadically, mostly in Łeba (four cases). A day with very strong cold stress was only recorded in Ustka throughout the study period. No days with heat stress were observed in Kołobrzeg. Days with moderate heat stress constituted from 1% in Koszalin, Łeba, and Ustka to 10% in Kraków and Opole. In 32% of stations, days with strong heat stress were observed, although they were scarce (1–2 days throughout the period).
Type 1 (T1) covered nine analysed long May weekends. This type also included the May weekend with the lowest average UTCI, i.e., that from 1985. The average UTCI in this type changed from the north and northeast towards the southwest and west (Figure 5). The lowest index value was recorded in Łeba (−3.3 °C), and the highest in Opole (4.8 °C). The average UTCI for the entire study area reached 0.9 °C and was lower by 10.8 °C than on average in the analysed multiannual period. The area of Central, Northeast, and East Poland was covered by the highest negative UTCI anomalies. In particular stations, they varied from −13.6 °C in Łódź to −6.2 °C in Ustka. On the analysed days over Central East Europe, a low-pressure system persisted with a centre covering among others Southeast Poland and West Ukraine (<1010 hPa) (Figure 6). SLP was then lower than on average, and the anomaly centre was located at the border of Belarus and Ukraine. High-pressure systems simultaneously persisted over the Atlantic (>1021 hPa) and Russia (>1019 hPa). Such a pressure distribution generated an advection of cool air masses from the northern sector. Moreover, the considerable variability of the baric field contributed to an increase in wind speed which substantially affected the UTCI value. The presence of cool air masses was suggested by the system of isohypses of z500 hPa, evidently bent southwards over central Europe. The surface of z500 hPa persisted lower than on average, and the centre of the anomaly was situated over Poland (<−150 m).
The most abundant type 2 (T2) covered 29 of the analysed long May weekends during which biometeorological conditions were the most approximate to average conditions. The average UTCI increased from the north towards the southeast (Figure 5). The average index value for the entire area reached 10.7 °C and was lower than average by 1.1 °C. Average UTCI varied from 4.7 °C in Łeba to 13.6 °C in Katowice. Deviations from the average value from the multiannual period ranged from −1.9 °C in Wrocław to 0.8 °C in Świnoujście. The highest UTCI anomalies in this group were recorded in West Poland. Like UTCI, the baric conditions were approximate to the average conditions in the multiannual period (Figure 6). The study area remained under the influence of a weak gradient pressure field within the range of the baric col. SLP inconsiderably deviated from average values from the multiannual period, and the height of persistence of z500 hPa was similar.
Type 3 (T3) included 17 analysed long May weekends during which biometeorological conditions considerably exceeded average values from the multiannual period. This type covered the May weekend with the highest average UTCI in the studied multiannual period, i.e., from 2012. The lowest average UTCI were recorded in the northern regions, and the highest in the central and southeastern regions (Figure 5). In particular stations, the values varied from 10 °C in Ustka to 22.7 °C in Kraków. The average UTCI for Poland in this type reached 19.3 °C and was higher than average by 7.5 °C. The highest deviations from average values were recorded in Central Poland (>9 °C), and the lowest in the north (<4 °C). In particular stations, the values ranged from 3.5 °C in Ustka to 9.4 °C in Łódź. On the analysed days, Central East Europe was under the influence of a high-pressure system with a centre on the border of Belarus, Lithuania, and Russia (>1018 hPa) (Figure 6). Another high-pressure system was located over the Atlantic (>1023 hPa). West Europe was within the reach of a low-pressure trough. A major area of Europe was within the range of positive SLP anomalies at the time, in the centre of the system reaching > 3 hPa. The described baric situation caused the advection of warm air masses from the southeast. Moreover, high-pressure weather characterised by low or lack of cloudiness contributed to intensive inflow of solar radiation which considerably affected UTCI values. The presence of warm air masses is suggested by the arrangement of isohypses z500 hPa. The surface persisted higher than on average, and the centre of the anomaly was recorded over the Baltic Sea (>100 m).

4. Discussion

As evidenced in the introduction, weather conditions considerably affect the tourist activity of society. The long May weekend in Poland is an important tourist period, although the activity of the society is largely determined by the weather. This study showed the occurrence of variable biometeorological conditions during the long May weekend in Poland. The lowest index values were recorded at the coast of the Baltic Sea and in Northeast Poland, and the highest in the southern and western regions. Such a distribution of UTCI was in accordance with the distribution of mean annual UTCI determined among others in research by Kuchcik et al. [40] and Tomczyk and Bednorz [41]. According to the new bioclimatic division of Poland [41], the highest UTCI values were recorded in the southwestern region and in the western part of the northwestern region. In turn, the lowest in the coastal subregion is in the northwestern and northeastern regions. The mean annual distribution of UTCI values was approximate to the distribution of mean annual air temperature in Poland [24,42,43]. Low UTCI values in coastal stations result from the cooling effect of the Baltic Sea and increased wind speed and air humidity [44,45]. In Northeast Poland, the main factor affecting the index value was low air temperature values—next to the mountains, the area is among the coldest areas in the country [24,42,43]. In the study period, with the exception of one station, an increase in UTCI was observed, although statistically significant changes were only recorded in three stations. Changes in mean annual UTCI in the period 1951–2018 over a predominant area of Poland were statistically significant, and an increase in the index value was determined in each of the analysed stations [40]. The highest increase occurred in Suwałki (0.90 °C/10 years), Tarnów (0.89 °C/10 years) and Świnoujście (0.80 °C/10 years).
On the analysed days of May in the years 1966–2020, days classified as days with no thermal stress were recorded the most frequently, followed by days with cold stress, and days with warm stress that occurred sporadically. The obtained results are in accordance with earlier studies conducted in the territory of Poland that showed that days with no thermal stress and days with cold stress were recorded the most frequently throughout the country [2,5,46].
In terms of biometeorological conditions, long May weekends in the period 1966–2020 were divided into three groups. A feature shared by all groups was the spatial distribution of UTCI. The lowest index values were recorded in the north and northeast of the country, and the highest in the south and west. The variability of biometeorological conditions in the designated groups was high, and they deviated from the average conditions from the entire multiannual period to various degrees. In the first group (type), in Central Poland, UTCI was lower than average by more than 13 °C, and in the third group (type) in approximate regions, it was higher by more than 9 °C. In the first type, there was a long May weekend with the lowest UTCI (from 1985), and in the third type a long May weekend with the highest UTCI (from 2012).
Biometeorological conditions during the analysed periods were shaped by various baric situations. The occurrence of low UTCI values was related to the presence of a low-pressure system over Central East Europe and a high-pressure system in the west. The described baric situation contributed to the advection of cool air masses from the north. As evidenced in research by Owczarek and Tomczyk [4], the advection of air masses from that sector and the high horizontal pressure gradient favoured the occurrence of days with very strong and extreme cold stress in winter. Approximate results were also obtained by Kolendowicz et al. [47] who analysed biometeorological conditions at the coast of the Baltic Sea.
The occurrence of high UTCI values was related to the persistence of a high-pressure system over Central East Europe. High-pressure weather characterised by low or lack of cloudiness favoured intensive inflow of solar radiation. Similar baric conditions were determined by Kolendowicz et al. [47] as well as Tomczyk and Owczarek [7] who analysed the circulation conditions of the occurrence of days with strong and very strong heat stress in the former publication of the coast of the Baltic Sea, and in the latter throughout Poland. The authors evidenced that the occurrence of days with strong and very strong heat stress in Poland was related to the occurrence of high-pressure systems blocking zonal circulation. Three types were designated in the study in which the pressure field showed common features but differed in the location of anticyclonic systems.

5. Conclusions

The study showed a high range of variability of biometeorological conditions during the May weekend in Poland. It particularly concerned areas at the coast of the Baltic Sea and in those with higher locations. The lowest UTCI values were recorded in those areas in the studied years. Western and southern regions were characterised by the highest UTCI values. Biometeorological conditions most favourable for tourism and recreation occurred during high-pressure weather featuring low or lack of cloudiness and intensive solar radiation. Persons planning tourist activity on the analysed days should be prepared for various biometeorological conditions, from those causing cold stress to those causing heat stress. Unfortunately, a limitation of the study is the lack of determination of the effect of the recorded conditions on tourist traffic. It results from a high level of inaccessibility of such data. According to the authors, the development of research in this direction should be treated as a priority in the future.

Author Contributions

Conceptualization, A.M.T.; methodology, A.M.T.; formal analysis, A.M.T. and K.M.; investigation, A.M.T. and K.M.; writing—original draft preparation, A.M.T. and K.M.; writing—review and editing, A.M.T. and K.M.; visualization, A.M.T. and K.M. All authors have read and agreed to the published version of the manuscript.

Funding

This work was supported by the National Science Centre, Poland (grant number UMO-2020/37/B/ST10/00217).

Institutional Review Board Statement

Not applicable.

Informed Consent Statement

Not applicable.

Data Availability Statement

The data presented in this study are openly available at https://dane.imgw.pl/data/dane_pomiarowo_obserwacyjne/ and https://psl.noaa.gov/data/ (accessed on 4 June 2023).

Conflicts of Interest

The authors declare no conflict of interest.

References

  1. Wereski, S.; Krzyżewska, A.; Dobek, M. Winter UTCI variability in Poland in the 21st century. Misc. Geogr. 2020, 24, 128–137. [Google Scholar] [CrossRef]
  2. Miszuk, B. Multi-Annual Changes in Heat Stress Occurrence and Its Circulation Conditions in the Polish–Saxon Border Region. Atmosphere 2021, 12, 163. [Google Scholar] [CrossRef]
  3. Owczarek, M. The influence of air temperature diversity in Central Europe on the occurrence of very strong and extreme cold stress in Poland in winter months. Geogr. Pol. 2021, 94, 251–266. [Google Scholar] [CrossRef]
  4. Owczarek, M.; Tomczyk, A.M. Impact of Atmospheric Circulation on the Occurrence of Very Strong and Extreme Cold Stress in Poland. Quaest. Geogr. 2022, 41, 111–126. [Google Scholar] [CrossRef]
  5. Tomczyk, A.M.; Bednorz, E.; Szyga-Pluta, K.; Owczarek, M. Effect of regional baric systems on the occurrence of bioclimatic conditions in Poland. Quaest. Geogr. 2023, 42, 161–177. [Google Scholar]
  6. Owczarek, M. The influence of large-scale factors on the heat load on human beings in Poland in the summer months. Theor. Appl. Climatol. 2019, 137, 855–869. [Google Scholar] [CrossRef]
  7. Tomczyk, A.M.; Owczarek, M. Occurrence of strong and very strong heat stress in Poland and its circulation conditions. Theor. Appl. Climatol. 2020, 139, 893–905. [Google Scholar] [CrossRef]
  8. Krzyżewska, A.; Wereski, S.; Dobek, M. Summer UTCI variability in Poland in twenty-first century. Int. J. Biometeorol. 2021, 65, 1497–1513. [Google Scholar] [CrossRef]
  9. Tomczyk, A.M. Bioclimatic Conditions of June 2019 in Poland on a Multi-Year Background (1966–2019). Atmosphere 2021, 12, 1117. [Google Scholar] [CrossRef]
  10. Tomczyk, A.M.; Bednorz, E.; Matzarakis, A. Human-biometeorological conditions during heatwaves in Poland. Int. J. Climatol. 2020, 40, 5043–5055. [Google Scholar] [CrossRef]
  11. Krzyżewska, A.; Wereski, S.; Demczuk, P. Biometeorological conditions during an extreme heatwave event in Poland in August 2015. Weather 2019, 75, 183–189. [Google Scholar] [CrossRef]
  12. Matzarakis, A.; Fröhlich, D.; Bermon, S.; Adami, P.E. Visualization of climate factors for sports events and activities—The Tokyo 2020 Olympic Games. Atmosphere 2019, 10, 572. [Google Scholar] [CrossRef]
  13. Matzarakis, A.; Fröhlich, D. Sport events and climate for visitors—The case of FIFA world cup in Qatar 2022. Int. J. Biometeorol. 2015, 59, 481–486. [Google Scholar] [CrossRef] [PubMed]
  14. Kosaka, E.; Iida, A.; Vanos, J.; Middel, A.; Yokohari, M.; Brown, R. Microclimate variation and estimated heat stress of runners in the 2020 Tokyo Olympic marathon. Atmosphere 2018, 9, 192. [Google Scholar] [CrossRef]
  15. Wu, Y.; Graw, K.; Matzarakis, A. Comparison of thermal comfort between Sapporo and Tokyo—The case of the Olympics 2020. Atmosphere 2020, 11, 444. [Google Scholar] [CrossRef]
  16. Matzarakis, A.; Graw, K. Human Bioclimate Analysis for the Paris Olympic Games. Atmosphere 2022, 13, 269. [Google Scholar] [CrossRef]
  17. Koźmiński, C.; Michalska, B. The seasonal nature of tourist flows in relation to meteorological conditions as illustrated by the case of Zachodniopomorskie Voivodeship. Bull. Geography. Socio-Econ. Ser. 2016, 34, 33–45. [Google Scholar] [CrossRef]
  18. Koźmiński, C.; Michalska, B. Ocena długości sezonu kąpielowego na polskim wybrzeżu Bałtyku (Assessment of the length of bathing season on the Polish Baltic Sea coast). Eur. Reg. 2014, 24, 11–22. (In Polish) [Google Scholar]
  19. Borzyszkowski, J. Zjawisko sezonowości w turystyce—Istota problemu i działań krajowych podmiotów polityki turystycznej na rzecz jej ograniczania (Seasonality in tourism—The essence of the problem and the activities of national entities tourism policy to its limit). Rozpr. Nauk. Akad. Wych. Fiz. We Wrocławiu 2014, 45, 167. [Google Scholar]
  20. Janowski, I. Natężenie i struktura ruchu turystycznego na szlakach Świętokrzyskiego Parku Narodowego (Intensifying and structure of touristic movement on routes in the Świętokrzyski National Park). In Między Ochroną Przyrody a Gospodarką–Bliżej ochrony: Konflikty Człowiek—Przyroda na Obszarach Prawnie Chronionych w Polsce, Sosnowiec-Ojców; Hibszer, A., Partyka, J., Eds.; Polskie Towarzystwo Geograficzne Oddział Katowicki & Ojcowski Park Narodowy: Sosnowiec, Poland, 2005; pp. 96–107. [Google Scholar]
  21. Janowski, I. Funkcja turystyczna Muzeum Przyrodniczo-Leśnego na Świętym Krzyżu w Górach Świętokrzyskich. In Regionalne Oraz Lokalne Czynniki Rozwoju Turystyki; Wszechnica Świętokrzyska, Instytut Geografii AŚ, Oddział Kielecki PTG: Kielce, Poland, 2003; pp. 253–267. [Google Scholar]
  22. Auguścik, A. Natężenie i struktura ruchu turystycznego w Leśnym Arboretum Warmii i Mazur im. Polskiego Towarzystwa Leśnego w Kudypach (Intensity and structure of tourist traffic in the Forest Arboretum of Warmia and Mazury in Kudypy). Leśne Pr. Badaw. 2020, 81, 1–8. [Google Scholar]
  23. Kottek, M.; Grieser, J.; Beck, C.; Rudolf, B.; Rubel, F. World map of the Koppen-Geiger climate classification updated. Meteorol. Z. 2006, 15, 259–263. [Google Scholar] [CrossRef] [PubMed]
  24. Tomczyk, A.M. Temperatura powietrza. In Atlas klimatu Polski (1991–2020); Tomczyk, A.M., Bednorz, E., Eds.; Bogucki Wydawnictwo Naukowe: Poznań, Poland, 2022. [Google Scholar]
  25. Matuszko, D.; Bartoszek, K. Zachmurzenie. In Atlas klimatu Polski (1991–2020); Tomczyk, A.M., Bednorz, E., Eds.; Bogucki Wydawnictwo Naukowe: Poznań, Poland, 2022. [Google Scholar]
  26. Bednorz, E. Opady atmosferyczne. In Atlas klimatu Polski (1991–2020); Tomczyk, A.M., Bednorz, E., Eds.; Bogucki Wydawnictwo Naukowe: Poznań, Poland, 2022. [Google Scholar]
  27. Bednorz, E. Pokrywa śnieżna. In Atlas klimatu Polski (1991–2020); Tomczyk, A.M., Bednorz, E., Eds.; Bogucki Wydawnictwo Naukowe: Poznań, Poland, 2022. [Google Scholar]
  28. Błażejczyk, K.; Epstein, Y.; Jendritzky, G.; Staiger, H.; Tinz, B. Comparison of UTCI to selected thermal indices. Int. J. Biometeorol. 2012, 56, 515–535. [Google Scholar] [CrossRef] [PubMed]
  29. Bröde, P.; Fiala, D.; Błażejczyk, K.; Holmer, I.; Jendritzky, G.; Kampmann, B.; Tinz, B.; Havenith, G. Deriving the operational procedure for the Universal Thermal Climate Index (UTCI). Int. J. Biometeorol. 2012, 56, 481–494. [Google Scholar] [CrossRef]
  30. Fiala, D.; Lomas, K.J.; Stohrer, M. A computer model of human thermoregulation for a wide range of environmental conditions: The passive system. J. Appl. Physiol. 1999, 87, 1957–1972. [Google Scholar] [CrossRef] [PubMed]
  31. Fiala, D.; Lomas, K.J.; Stohrer, M. Computer prediction of human thermoregulatory and temperature responses to a wide range of environmental conditions. Int. J. Biometeorol. 2001, 45, 143–159. [Google Scholar] [CrossRef]
  32. Błażejczyk, K.; Błażejczyk, M. BioKlima, Version 2.6.; Polish Academy of Sciences: Warsaw, Poland, 2006. [Google Scholar]
  33. Błażejczyk, K.; Jendritzky, G.; Bröde, P.; Fiala, D.; Havenith, G.; Epstein, Y.; Psikuta, A.; Kampmann, B. An introduction to the Universal Thermal Climate Index (UTCI). Geogr. Pol. 2013, 86, 5–10. [Google Scholar] [CrossRef]
  34. Wilks, D.S. Statistical Methods in the Atmospheric Sciences, An Introduction. International Geophysics Series 59; Academic Press: Cambridge, MA, USA, 1995; p. 464. [Google Scholar]
  35. Ward, J.H. Hierarchical grouping to optimize an objective function. J. Am. Stat. Assoc. 1963, 58, 236–244. [Google Scholar] [CrossRef]
  36. Kalkstein, L.S.; Tan, G.; Skindlov, J.A. An evaluation of three Clustering procedures for use in synoptic climatological classification. J. Appl. Meteorol. Climatol. 1987, 26, 717–730. [Google Scholar] [CrossRef]
  37. Birkeland, K.W.; Mock, C.J. Atmospheric circulation patterns associated with heavy snowfall events, Bridger Bowl, Montana, U.S.A. Mt. Res. Dev. 1996, 16, 281–286. [Google Scholar] [CrossRef]
  38. Bednorz, E. Synoptic conditions of snow cover occurrence in central European lowlands. Int. J. Climatol. 2011, 31, 1108–1118. [Google Scholar] [CrossRef]
  39. Kalnay, E.; Kanamitsu, M.; Kistler, R.; Collins, W.; Deaven, D.; Gandin, L.; Iredell, M.; Saha, S.; White, G.; Woollen, J.; et al. The NCEP/NCAR 40-Year Reanalysis Project. Bull. Am. Meteorol. Soc. 1996, 77, 437–471. [Google Scholar] [CrossRef]
  40. Kuchcik, M.; Błażejczyk, K.; Halaś, A. Changes in Bioclimatic Indices. In Climate Change in Poland; Falarz, M., Ed.; Springer Climate: Katowice, Poland, 2021; pp. 471–491. [Google Scholar]
  41. Tomczyk, A.M.; Bednorz, E. Regional and seasonal variability in human thermal stress in Poland. Theor. Appl. Climatol. 2023, 152, 787–800. [Google Scholar] [CrossRef]
  42. Kejna, M.; Rudzki, M. Spatial diversity of air temperature changes in Poland in 1961–2018. Theor. Appl. Climatol. 2021, 143, 1361–1379. [Google Scholar] [CrossRef]
  43. Ustrnul, Z.; Wypych, A.; Czekierda, D. Air Temperature Change. In Climate Change in Poland—Past, Present, Future; Falarz, M., Ed.; Springer Climate: Katowice, Poland, 2021; pp. 275–330. [Google Scholar]
  44. Wibig, J. Change of Wind. In Climate Change in Poland—Past, Present, Future; Falarz, M., Ed.; Springer Climate: Katowice, Poland, 2021; pp. 391–420. [Google Scholar]
  45. Wypych, A. Wilgotność powietrza. In Atlas klimatu Polski (1991–2020); Tomczyk, A.M., Bednorz, E., Eds.; Bogucki Wydawnictwo Naukowe: Poznań, Poland, 2022. [Google Scholar]
  46. Rozbicka, K.; Rozbicki, T. Long-term variability of bioclimatic conditions and tourism potential for Warsaw agglomeration (Poland). Int. J. Biometeorol. 2021, 65, 1485–1495. [Google Scholar] [CrossRef] [PubMed]
  47. Kolendowicz, L.; Półrolniczak, M.; Szyga-Pluta, K.; Bednorz, E. Human-biometeorological conditions in the southern Baltic coast based on the universal thermal climate index (UTCI). Theor. Appl. Climatol. 2018, 134, 363–379. [Google Scholar] [CrossRef]
Figure 1. Location of the weather stations.
Atmosphere 14 01334 g001
Figure 2. Average UTCI during the long May weekend in Poland in the period 1966–2020 (upper map), in 1985 (lower left map) and in 2012 (lower right map).
Atmosphere 14 01334 g002
Figure 3. Average UTCI during the long May weekend in the period 1966–2020 in selected stations.
Atmosphere 14 01334 g003
Figure 4. Share of days with particular UTCI categories during the long May weekend in the years 1966–2020.
Atmosphere 14 01334 g004
Figure 5. Average UTCI (left column) and UTCI anomalies (right column) in designated types.
Atmosphere 14 01334 g005
Figure 6. Average SLP (colour scale) and z500 hPa (left column); SLP (colour scale) and z500 hPa anomalies (right column) in the distinguished types. H—a high-pressure system, L—a low-pressure system.
Atmosphere 14 01334 g006
Table 1. UTCI assessment scale of human heat stress [33].
UTCI (°C)Stress CategoryUTCI (°C)Stress Category
>+46Extreme heat stress0 to +9Slight cold stress
+38 to +46Very strong heat stress−13 to 0Moderate cold stress
+32 to +38Strong heat stress−27 to −13Strong cold stress
+26 to +32Moderate heat stress−40 to −27Very strong cold stress
+9 to +26No thermal stress<−40Extreme cold stress
Table 2. Characteristics of biometeorological conditions in Poland during the long May weekend in the period 1966–2020.
StationLowest
Average UTCI
Highest
Average UTCI
Changes (°C/10 Years)StationLowest Average UTCIHighest
Average UTCI
Changes (°C/10 Years)
Białystok198520120.85Opole197120120.64
Bielsko-Biała197120120.99Poznań198520050.81
Chojnice198120120.59Racibórz201120120.07
Gorzów Wielkopolski198520121.28Rzeszów198520121.05
Hel197919930.88Siedlce198120120.78
Jelenia Góra197919660.59Słubice197920010.64
Kalisz198120120.63Sulejów197120120.97
Katowice198520121.07Suwałki198119771.37
Kielce197120120.78Szczecin197919660.95
Kłodzko198520120.74Świnoujście198519660.89
Kołobrzeg201919980.70Terespol197019771.26
Koszalin197920000.72Toruń197020120.91
Kraków198520020.97Ustka20171988−0.53
Lesko198520121.88Warszawa197019770.59
Lublin198520121.25Włodawa198520121.17
Łeba198119660.22Wrocław198120120.54
Łódź198120120.88Zakopane198520120.59
Mława197020121.07Zielona Góra198520120.73
Olsztyn197019770.53
Disclaimer/Publisher’s Note: The statements, opinions and data contained in all publications are solely those of the individual author(s) and contributor(s) and not of MDPI and/or the editor(s). MDPI and/or the editor(s) disclaim responsibility for any injury to people or property resulting from any ideas, methods, instructions or products referred to in the content.

