Article

Effects of Climate Change and Nitrogen Addition on Carbon Loss in Alpine Wetland of Qinghai–Tibet Plateau

1
College of Geographic Science, Qinghai Normal University, Xining 810008, China
2
Key Laboratory of Tibetan Plateau Land Surface Processes and Ecological Conservation (Ministry of Education), Qinghai Normal University, Xining 810008, China
3
Qinghai Province Key Laboratory of Physical Geography and Environmental Process, Qinghai Normal University, Xining 810008, China
4
College of Life Science, Qinghai Normal University, Xining 810008, China
*
Authors to whom correspondence should be addressed.
Atmosphere 2023, 14(9), 1342; https://doi.org/10.3390/atmos14091342
Submission received: 1 August 2023 / Revised: 16 August 2023 / Accepted: 23 August 2023 / Published: 25 August 2023
(This article belongs to the Special Issue Nitrogen Emissions in Agricultural and Forest Ecosystems)

Abstract

:
Soil microorganisms and soil organic carbon (SOC) play important roles in ecosystem cycling, but there is a lack of clarity about the effects of nitrogen addition on soil microorganisms and SOC, as well as the key microbial taxa that influence SOC. This study was conducted in the alpine wetland of Xiaopo Lake in the Qinghai Lake basin, using NH4NO3 as the nitrogen source, three nitrogen addition gradients (N2: 2 g/m2, N5: 5 g/m2, N10: 10 g/m2), and a blank control treatment (N0: 0 g/m2), with three replicate experiments for each treatment. The main findings were as follows: (1) Both increased soil temperature and decreased precipitation reduced SOC content. SOC content gradually decreased with increasing nitrogen concentration; SOC was reduced by 3.36–29.54% and 8.57–26.66% at 0–15 cm and 15–30 cm soil depths, respectively. (2) Proteobacteria, Chloroflexi, Acidobacteria, and Actinobacteria were the main dominant species, and their changes determined the changes in the entire bacterial community. The relative abundance of Proteobacteria and Actinobacteria decreased under nitrogen addition; Acidobacteria increased significantly; and Chloroflexi did not change significantly. The overall abundance and diversity of soil bacteria showed an increasing trend. The number of soil bacteria is a key factor affecting SOC content, and an increase in the number and diversity of soil bacteria enhances their decomposition capacity, and thus, reduces SOC content. (3) Increased soil temperatures and decreased precipitation are associated with decreased SOC and are the main climatic factors affecting SOC. This study provides a reference for the rational utilization and management of wetland ecosystems under climate change.

1. Introduction

Soil is a huge carbon pool, and soil organic carbon (SOC) is an important component of the soil carbon pool, with the soil carbon cycle representing a key link in the exchange of carbon between land and the atmosphere [1,2]. SOC is an important soil physicochemical index, and is affected by various factors such as soil conditions, climate, and moisture [3]. It has become one of the research hotspots in the field of global change [4,5]. It is well known that SOC is closely related to soil conditions, the environment, water safety, etc. [6,7]. Climate change is an important factor in the variation of SOC, e.g., higher temperatures and lower precipitation can reduce SOC [8,9]. Therefore, considering the change in SOC under climate change is crucial for ecosystem carbon cycling.
Nitrogen is considered to be an important element that limits plant growth [10]. Since the last century, the massive burning of fossil fuels, the use of pesticides and fertilizers, and the rapid development of agriculture and animal husbandry have greatly increased nitrogen in ecosystems [11], with significant impacts on ecosystem structure and function [12]. It is estimated that anthropogenic inputs of nitrogen increased nearly tenfold from the mid-19th century to the end of the 20th century and are expected to continue to increase in the future [11]. Nitrogen addition can have serious impacts on the biochemical cycles of terrestrial ecosystems [13], such as altering microbial activity, plant communities, biodiversity, and ecosystem productivity [14,15]. Therefore, it is particularly important to explore the effects of atmospheric nitrogen deposition on the biochemical cycling of terrestrial ecosystems.
Currently, there is controversy about the effect of N addition on SOC. Most studies have shown that N addition increases SOC content [15,16,17]. Zak et al. [18] found that N addition increased forest SOC content by about 12%. This may be related to the ability of soil microorganisms to decompose SOC under N addition [19,20]. Some studies have also concluded that N addition reduces SOC content. Mack et al. [21] found that N addition promoted the decomposition of apoplastic litter, resulting in a net loss of nearly 2000 g of carbon per square meter of ecosystem over a 20-year period. Cleveland et al. [22] found that soil respiration was enhanced by N addition, increasing the outgassing of CO2 by 2% per year, thereby reducing SOC. And Fang et al. [23] found that medium and high nitrogen additions reduced SOC by 0.52 kg C m−2 and 0.85 kg C m−2, respectively. N addition changes soil pH, acidity, and alkalinity, thus affecting the microbial decomposition of SOC [24,25]. However, changes in SOC pools are also influenced by a variety of other factors, such as plant litter, vegetation root systems and soil microbial activities [26]. Therefore, the study of SOC in alpine wetlands using a variety of indicators enriches the research progress of SOC and provides a reference for the sustainable development of alpine wetlands.
The Qinghai Lake basin is a unique geographical location within the Tibetan Plateau and is the main alpine wetland distribution area in Qinghai Province [27]. It is also a natural protection barrier for ecological security in northwestern China, which is important for the overall ecological security of the Tibetan Plateau [28]. However, there is a lack of research on nitrogen addition. Based on this, this study was conducted in the Qinghai Lake Basin to address the following questions: (1) How does climate change affect the soil carbon pool? (2) How does SOC change under nitrogen addition? (3) What are the drivers of SOC change?

2. Materials and Methods
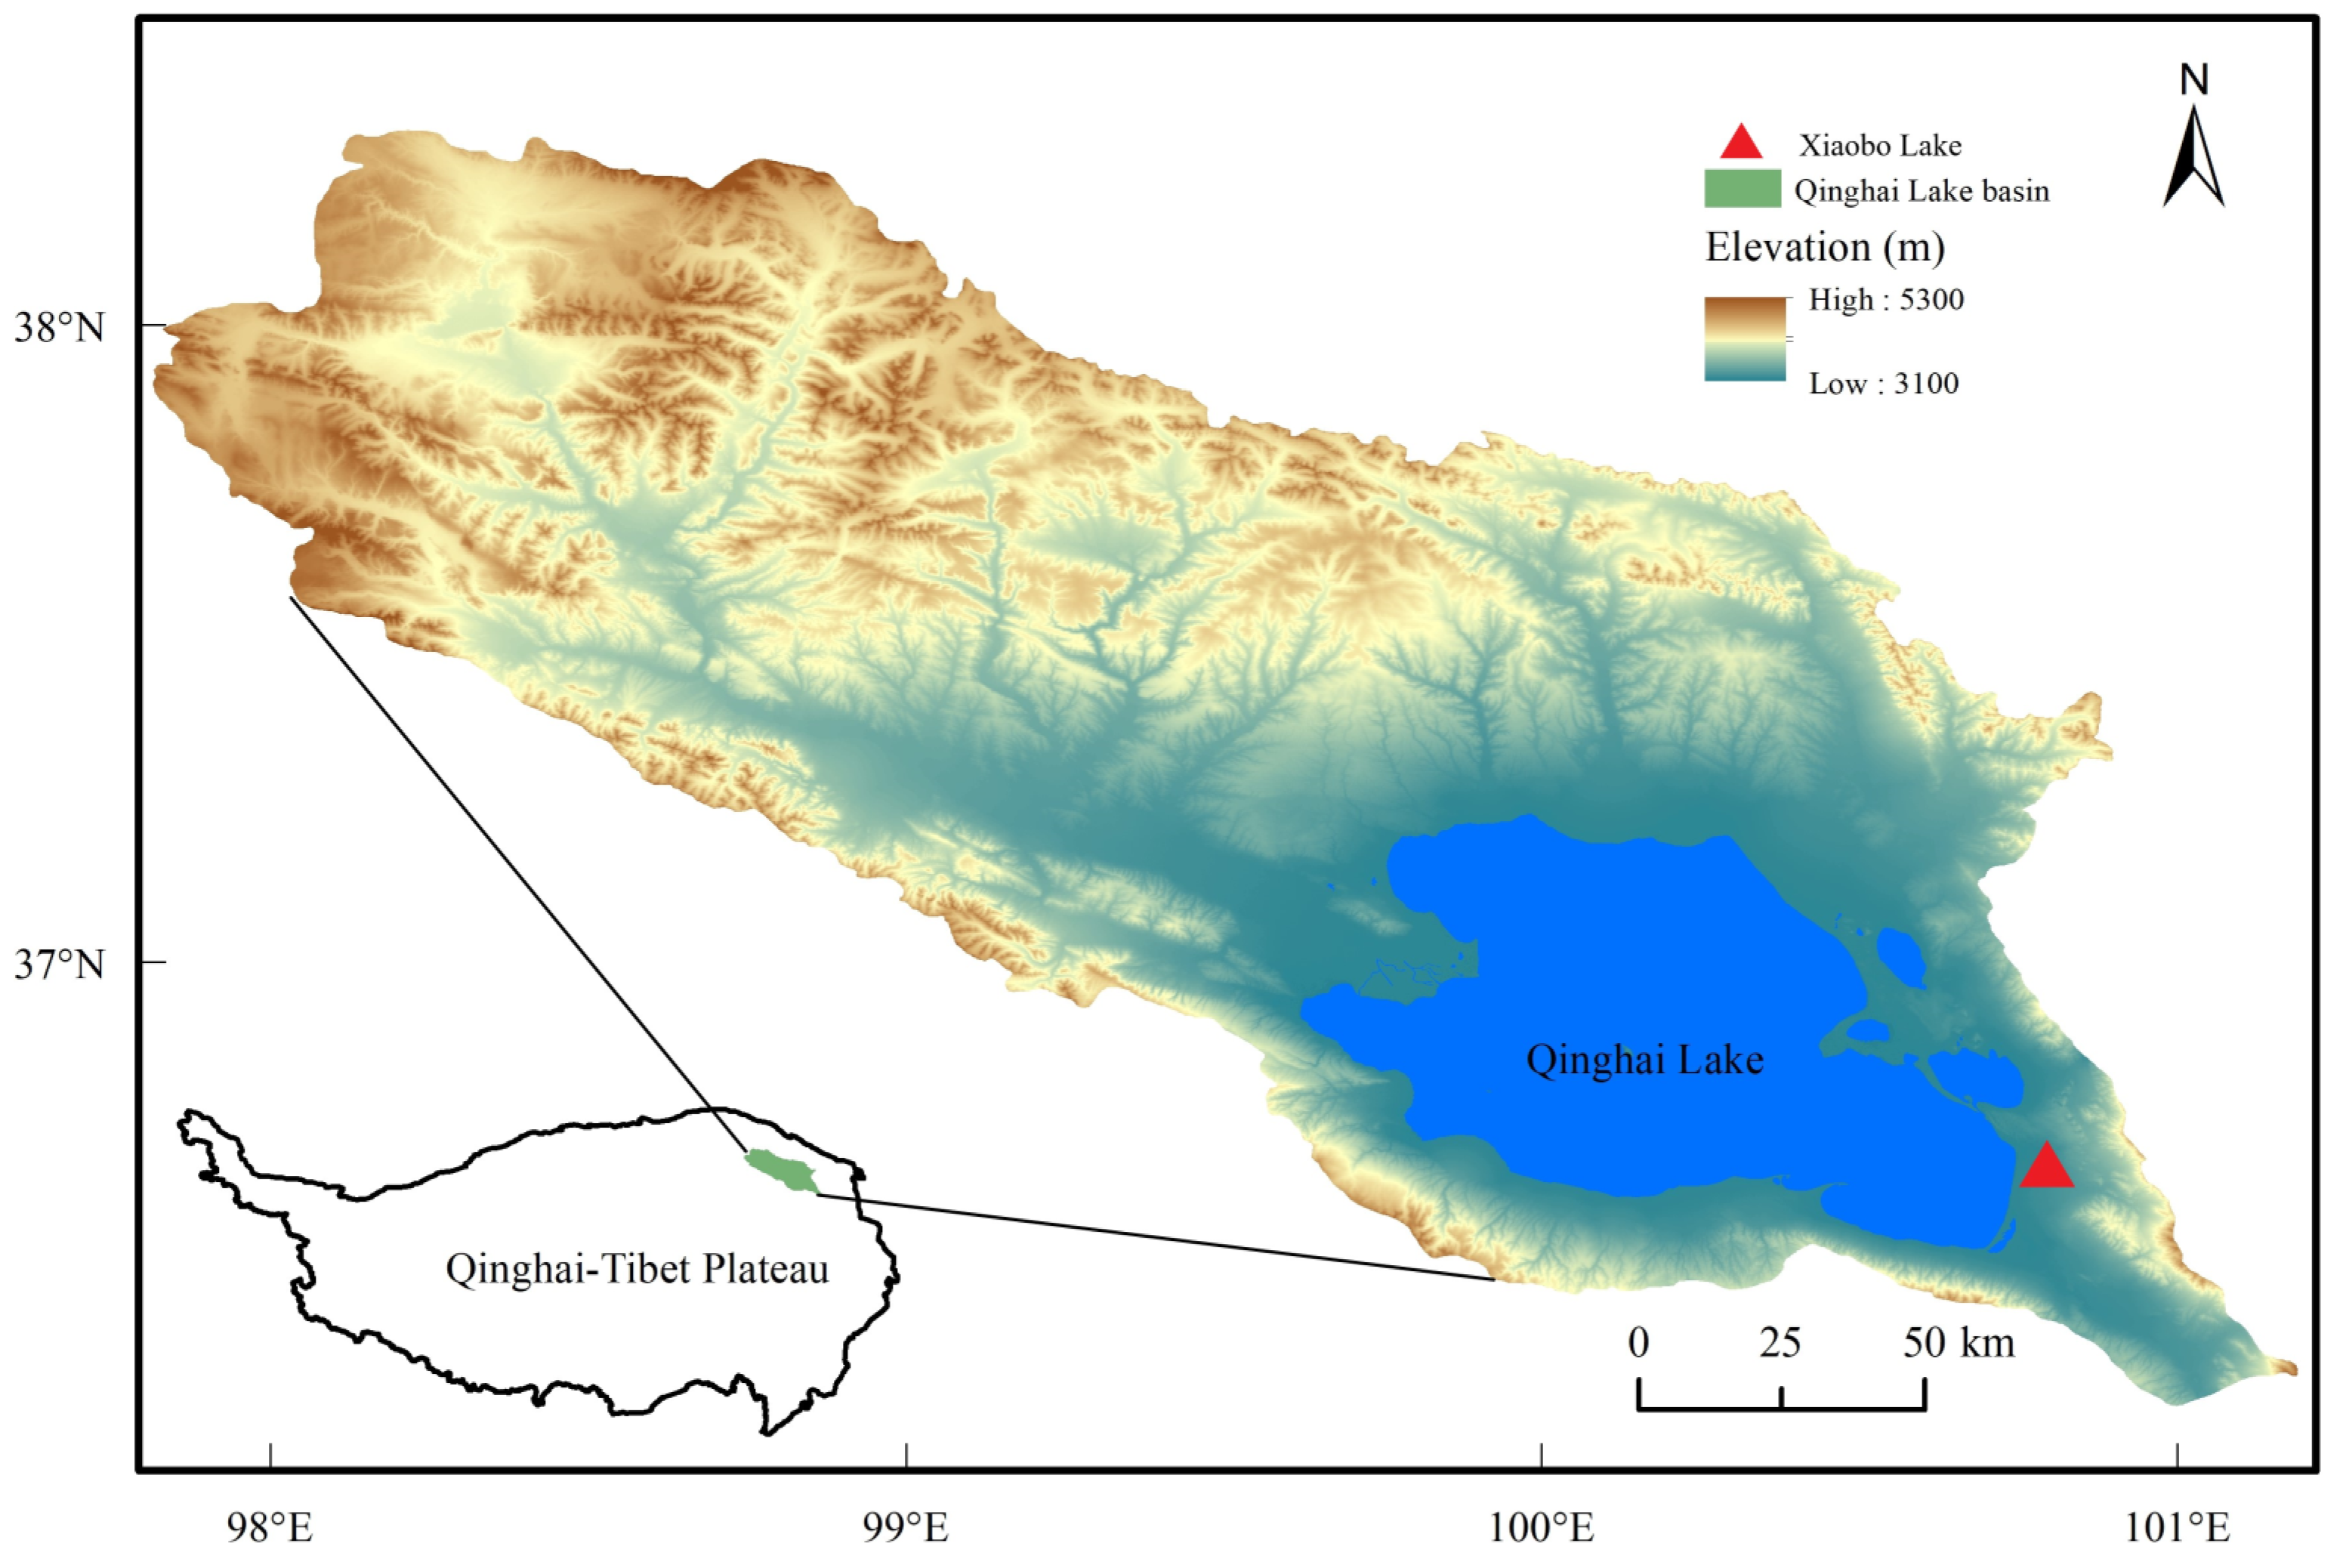
2.1. Study Area

The Qinghai Lake basin is in the northeastern part of the Tibetan Plateau, between 36°00′–38°20′ N and 97°00′–102°00′ E, with an elevation of about 3100–5200 m (Figure 1) and a total area of about 30,000 km2 [29,30]. It has a typical plateau semi-arid climate with dryness, little rain, strong light, and large temperature differences between day and night. The annual average temperature and precipitation in the basin range from −1.1 °C to 4.0 °C and from 290 to 580 mm, respectively [21,31,32].
The test area was in the alpine wetland of Xiaobo Lake (36°42′ N, 100°47′ E) east of Qinghai Lake, which is an alpine marshy wetland left by the displacement of Qinghai Lake. The main plant taxa are Kobresia humilis, Blysmus sinocompressus, Kobresia graminifolia, Kobresia tibetica, and Carexspp [28].

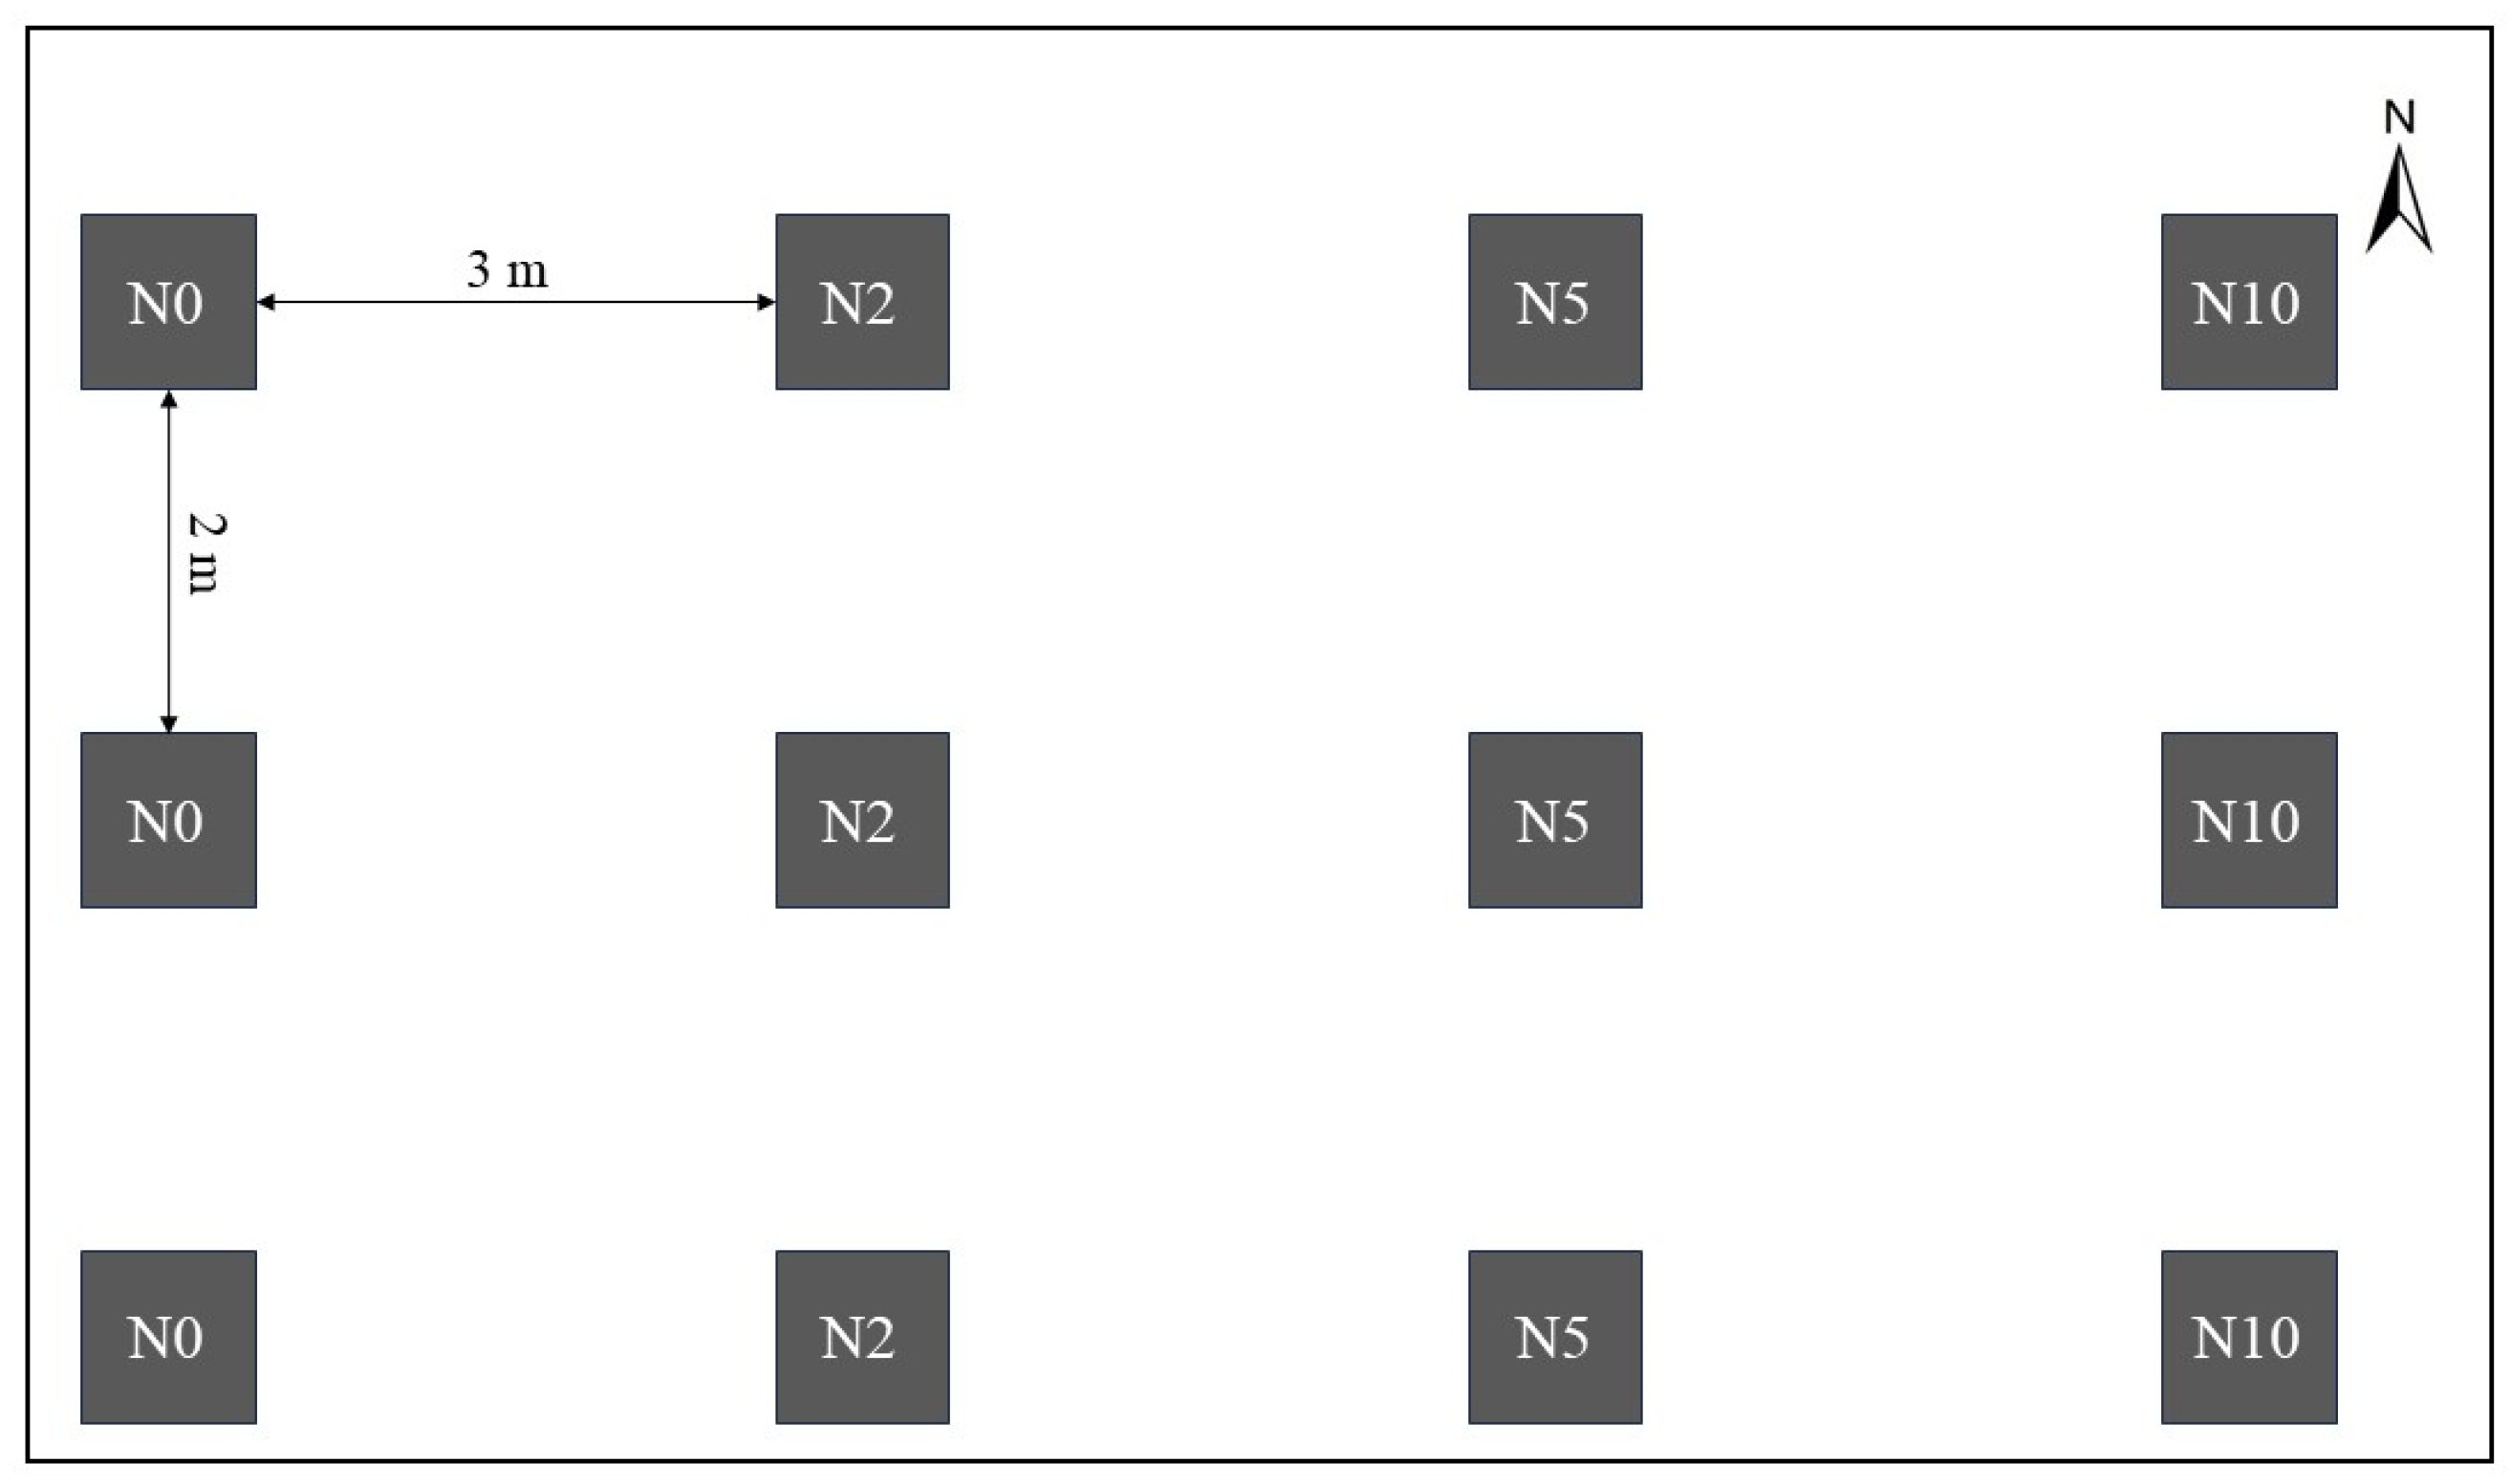
2.2. Experimental Design

In this study, 12 experimental samples were set up, in which there were four groups of experimental treatments, N0 (0 g/m2), N2 (2 g/m2), N5 (5 g/m2), and N10 (10 g/m2), and three replicates were set up for each treatment. Each sample plot was 1 m × 1 m in size, with 2 m as a buffer strip between samples of the same concentration treatment and 3 m as a buffer strip between different nitrogen concentrations (Figure 2). The nitrogen source added in this study was NH4NO3, and the corresponding NH4NO3 was weighed and dissolved in 1000 mL of water according to different nitrogen application gradients. The drug was sprayed evenly in the sample cubes, and 1000 mL of water was sprayed evenly in the blank control treatment sample cubes. Nitrogen addition treatments were applied from May to mid-September each year from 2019 to 2020, and monthly samples were taken before application. We sampled in 2019 and 2020 in October. Sampling was carried out in two soil layers: 0–15 cm for topsoil and 15–30 cm for deep soil.

2.3. Sample Processing and Determination

2.3.1. Determination of Physical and Chemical Properties of Soils

The experiments for the determination of the physical and chemical properties of the soil were carried out in the Key Laboratory of Qinghai Normal University.
Soil organic carbon (SOC): the SOC content was determined using a total organic carbon analyzer (Elementa, Germany).
Soil total carbon (TC) and total nitrogen (TN): these were measured using Costech ESC 4024 elemental analyzers from NC Technologies, Italy.
SOC, TC, and TN were determined using a dynamic combustion method. The soil samples for the determination were naturally dried and ground into powder form. The specific steps were as follows:
(1) The obtained soil samples were dried naturally in the laboratory, and then, passed through a 100 mesh sieve;
(2) A 20 mg standard sample was weighed on tinfoil and put into the instrument for standard curve rate determination;
(3) We weighed 20 mg of each soil sample and wrapped the sample with tinfoil, and repeated this 3 times;
(4) We put the weighed soil samples into the instrument for determination.
Soil ammoniacal nitrogen (NH4+-N) and nitrate nitrogen (NO3-N) were measured using a fully automatic interrupted chemical analyzer (CleverChem).
Soil water content (SWC) was determined via oven drying. About 10 g of fresh soil sample was weighed into an aluminum box (M) and the box weight and wet soil were recorded as M1. Each soil sample was weighed three times; then, the soil sample and the aluminum box were placed together in an oven set at 105° for 24 h. When finished, the dry soil and the weight of the aluminum box were weighed and recorded as M2 to calculate the SWC. The formula is as follows:
S W C % = M 1 M 2 M 2 M × 100 %
pH: 10 g of the powdered soil samples, which were naturally dried and sieved, were accurately weighed into a beaker with a one-percent balance; then, 25 mL of deionized water was added, stirred well, and left to stand for about 30 min. The pH value of the soil suspension was measured using a pH meter (Mettler Toledo; Greifensee, Switzerland).

2.3.2. Soil Microbiology Determination

The extraction, amplification, and high-throughput sequencing of the sample DNA were performed by Beijing Bemac Biotechnology Co., Ltd., Beijing, China (https://international.biocloud.net/zh/dashboard) (accessed on 1 March 2022). The DNA extraction kit was an MN NucleoSpin 96 Soil kit, and the bacterial 16s RNA was extracted according to the instructions with primer sequences 5′- ACTCCTACGGGAGGCAGCA-3′ and 5′- GGACTACHVGGGTWTCTAAT-3′. The extracted RNAs were amplified, underwent electrophoresis and purification, and finally, the purified samples were sequenced and analyzed using the Illumina HiSeq sequencing platform.

2.3.3. Climate Data

The climate data used in this study include precipitation, air temperature, and soil temperature, and the data from Haiyan National Meteorological Station, which is close to the Xiaobo Lake area, were selected for calculation. These include the station’s longitude, latitude, altitude, and soil temperature at 0 cm, 5 cm, 10 cm, 15 cm, 20 cm, and 40 cm as well as daily data on air temperature and precipitation. Since the soil is divided into 0–15 cm and 15–30 cm in this study, we take the average value of 0 cm, 5 cm, 10 cm, and 15 cm as the temperature of the first layer of soil, and the average value of 15 cm, 20 cm, and 40 cm as the temperature of the second layer of soil temperature. We selected the data of October 2019 and 2020 for calculation.

3. Results

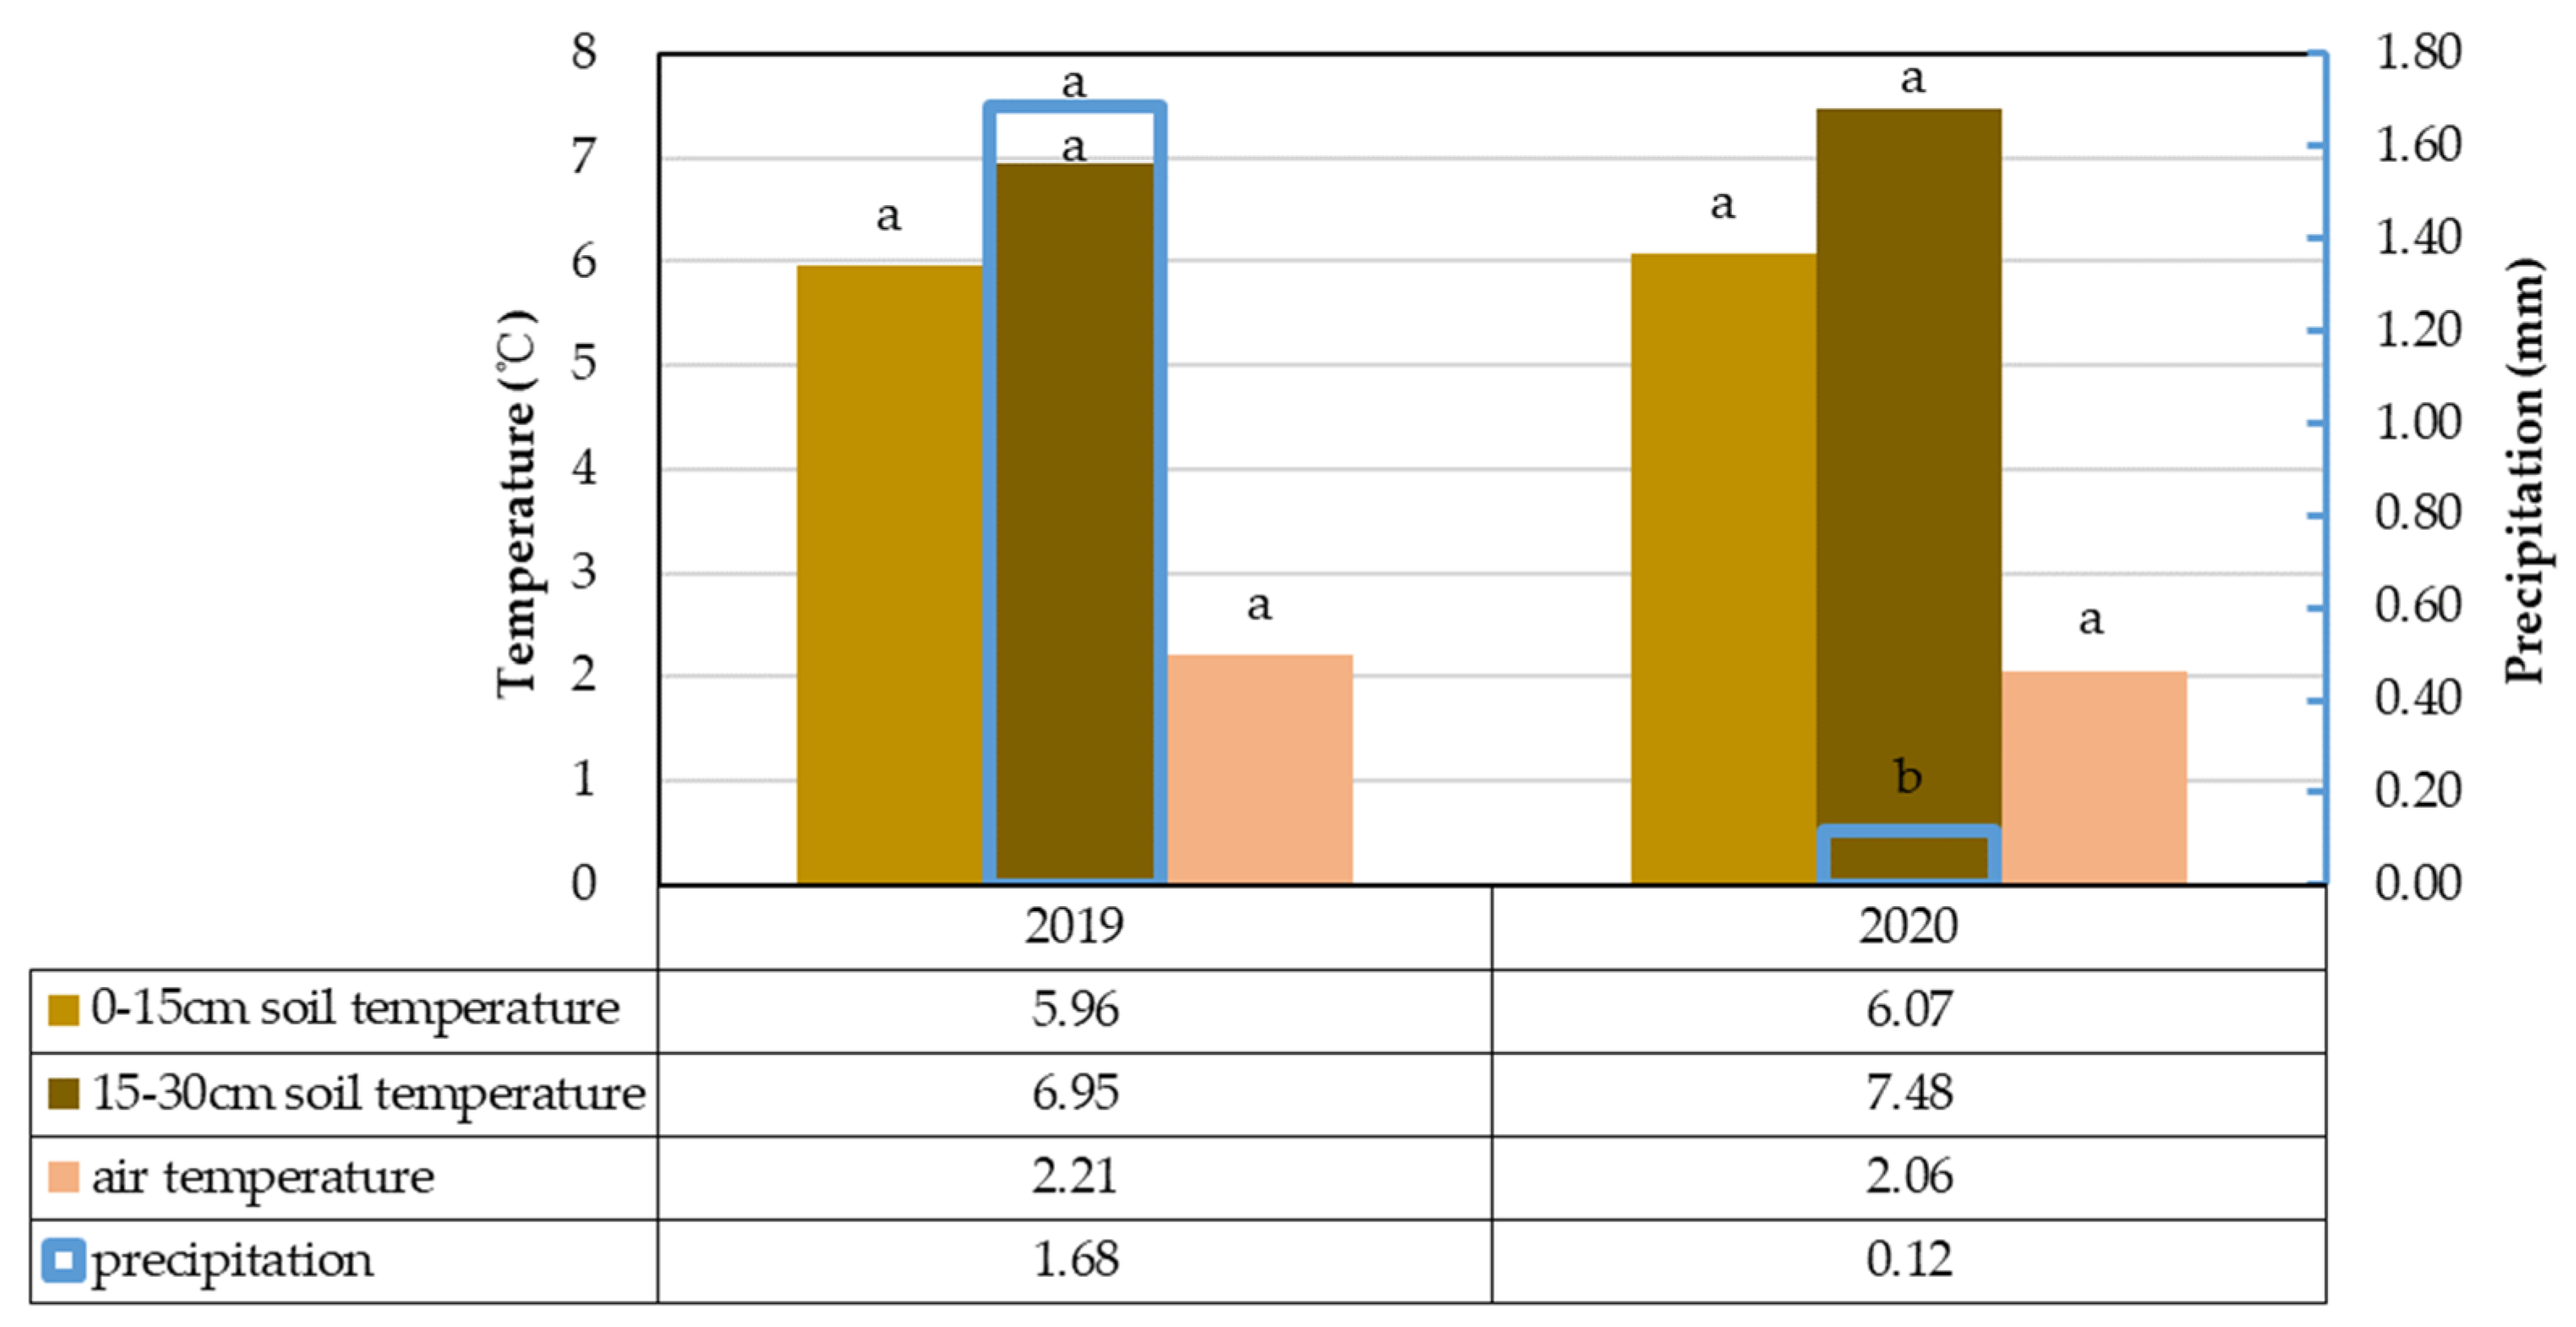
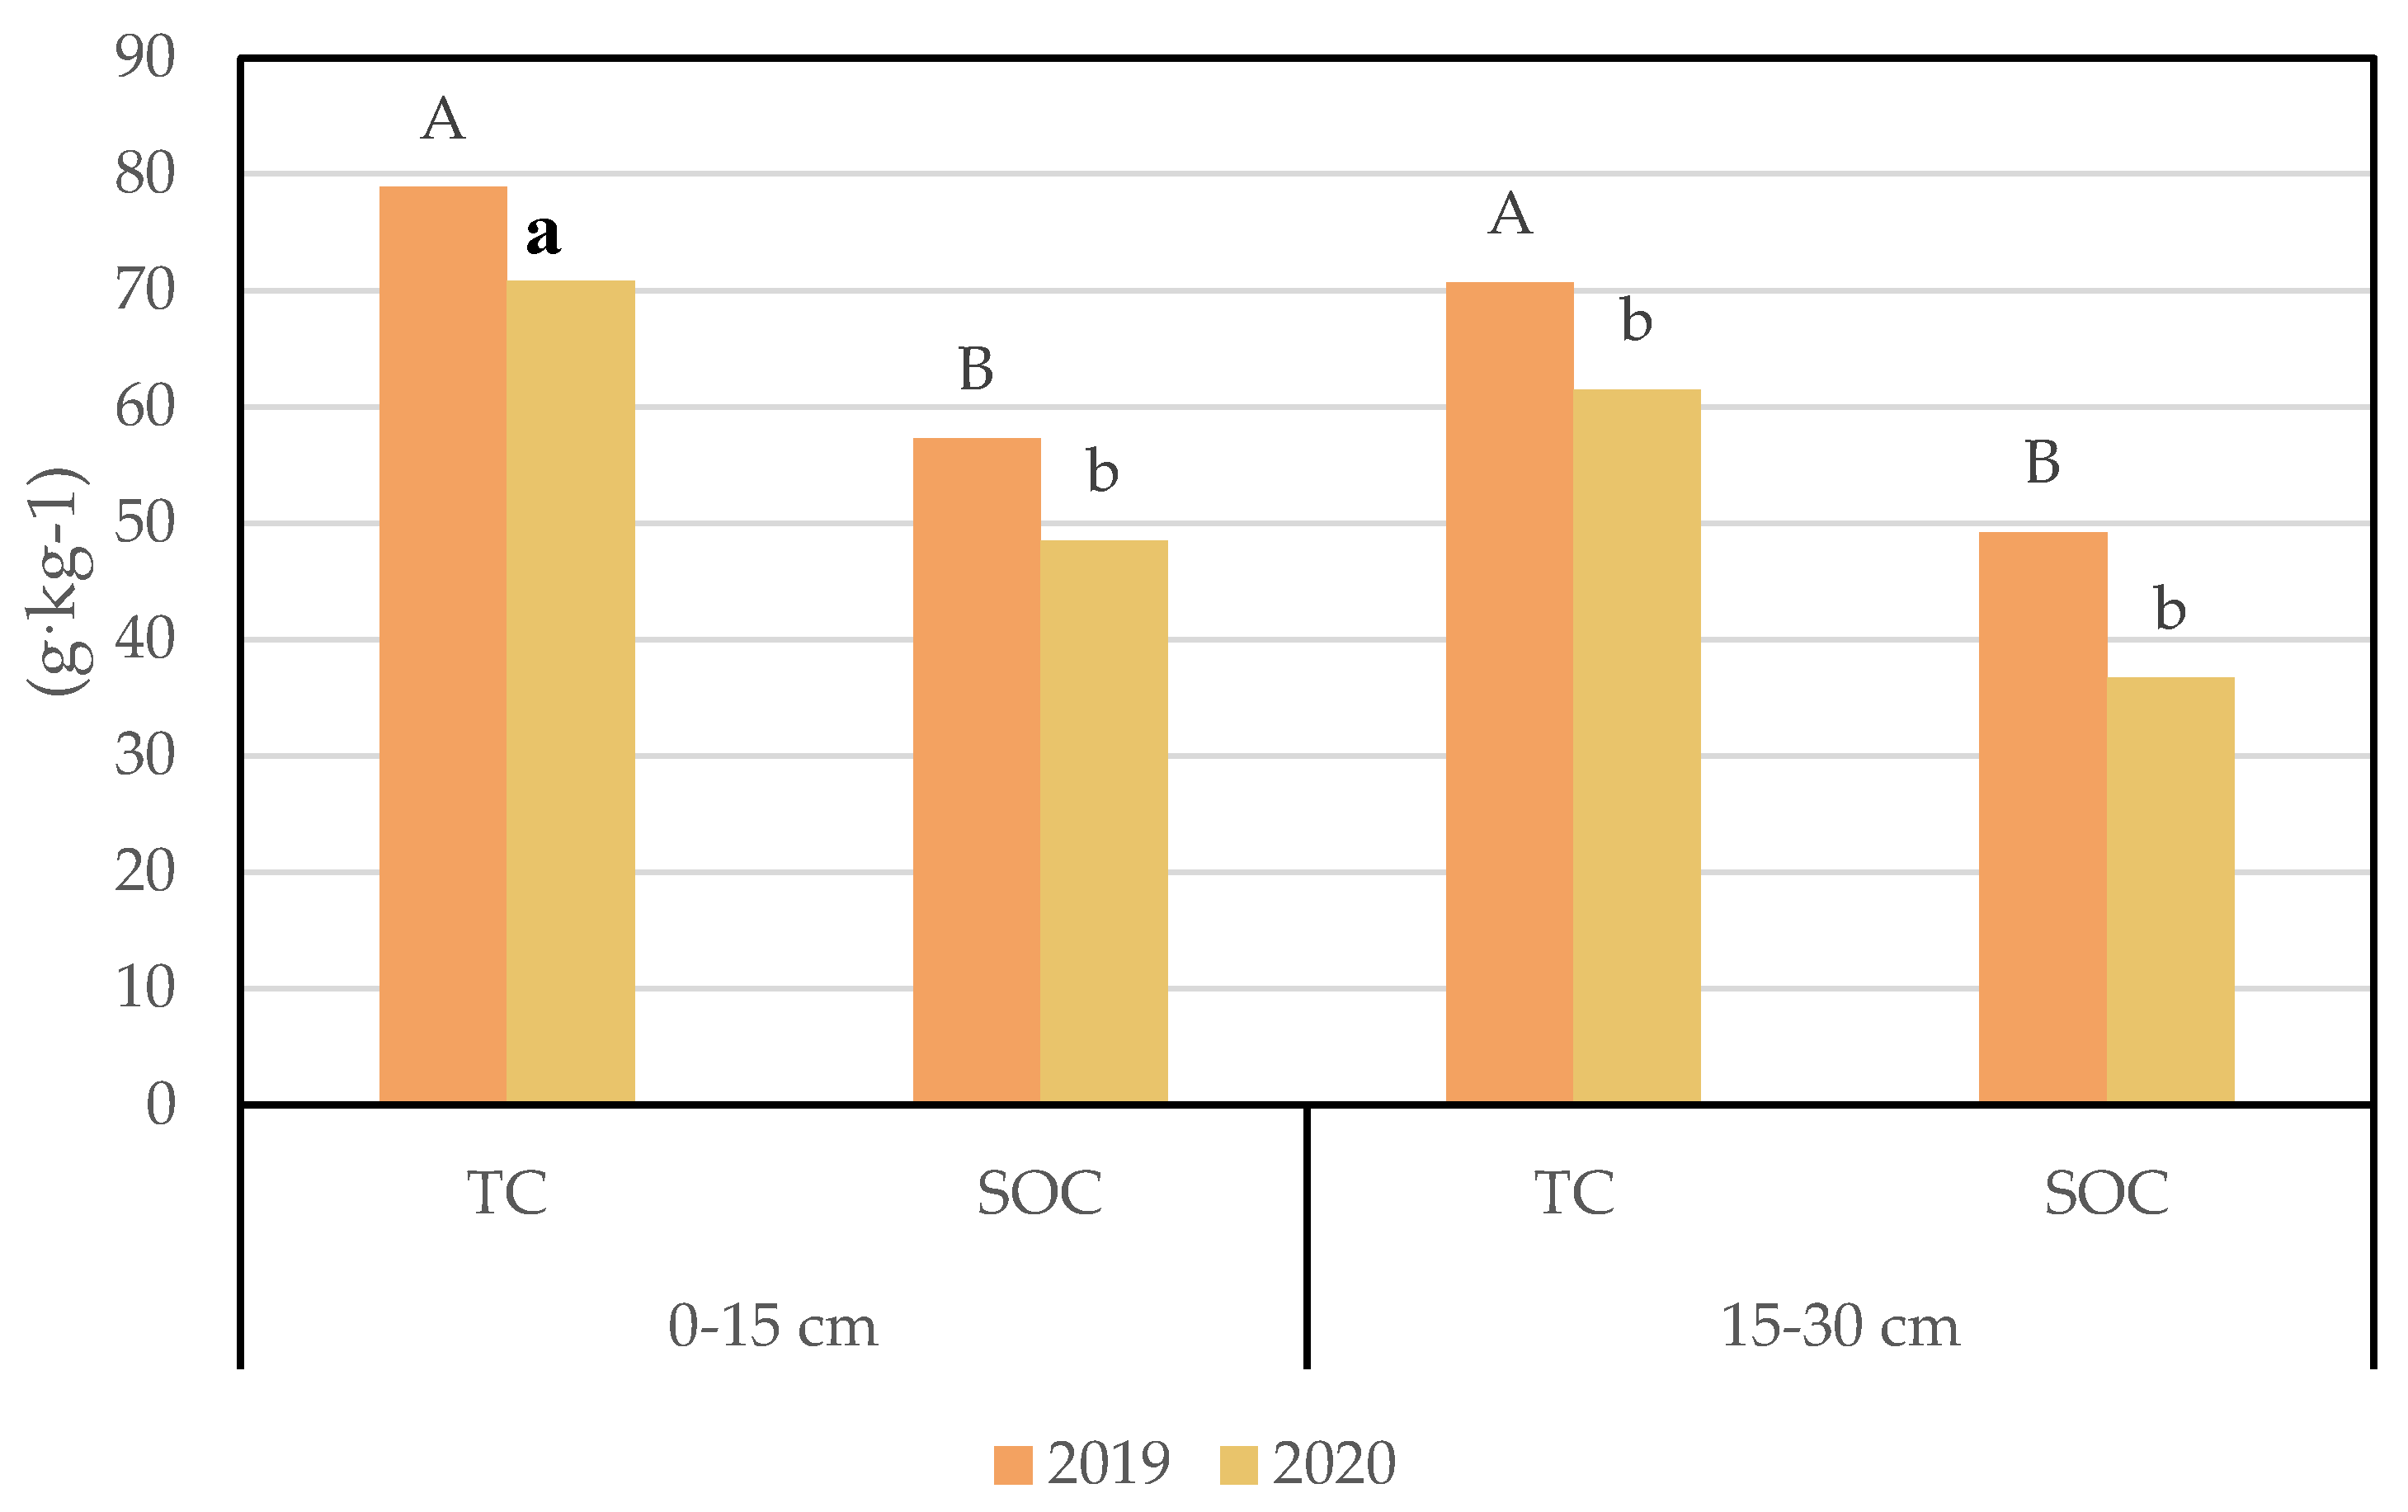
3.1. Climate Change Analysis and Its Impact on Soil Carbon

In order to comprehensively analyze the factors of organic carbon change, we analyzed the climatic elements during the experimental period. First, the soil temperature was higher than the air temperature during the experiment period. In 2019, the soil temperature at the 0–15 cm depth in Xiaobo Lake was about 5.96 °C, and the soil temperature at 15–30 cm was about 6.95 °C; the temperature in the same period was about 2.21 °C (Figure 3). The precipitation in the Xiaobo Lake area was relatively low, at about 1.68 mm in October 2019. The soil temperature increased after nitrogen fertilization. In 2020, the soil temperature at 0–15 cm was about 6.07 °C, and that at 15–30 cm was about 7.48 °C; the air temperature and precipitation were about 2.06 °C and 0.12 mm, respectively (Figure 3). At the same time, we also compared the soil carbon content before (2019) and after (2020) nitrogen application in the Little Porcupine Lake area. It was found that the content of soil TC and SOC showed a decreasing trend in both 0–15 cm and 15–30 cm soils (Figure 4). N addition reduced the SOC content.
These results show that climate change is closely related with SOC and profoundly influences SOC changes. Reductions in SOC are strongly associated with higher soil temperatures and lower precipitation, and changes in SOC feed back into the climate.

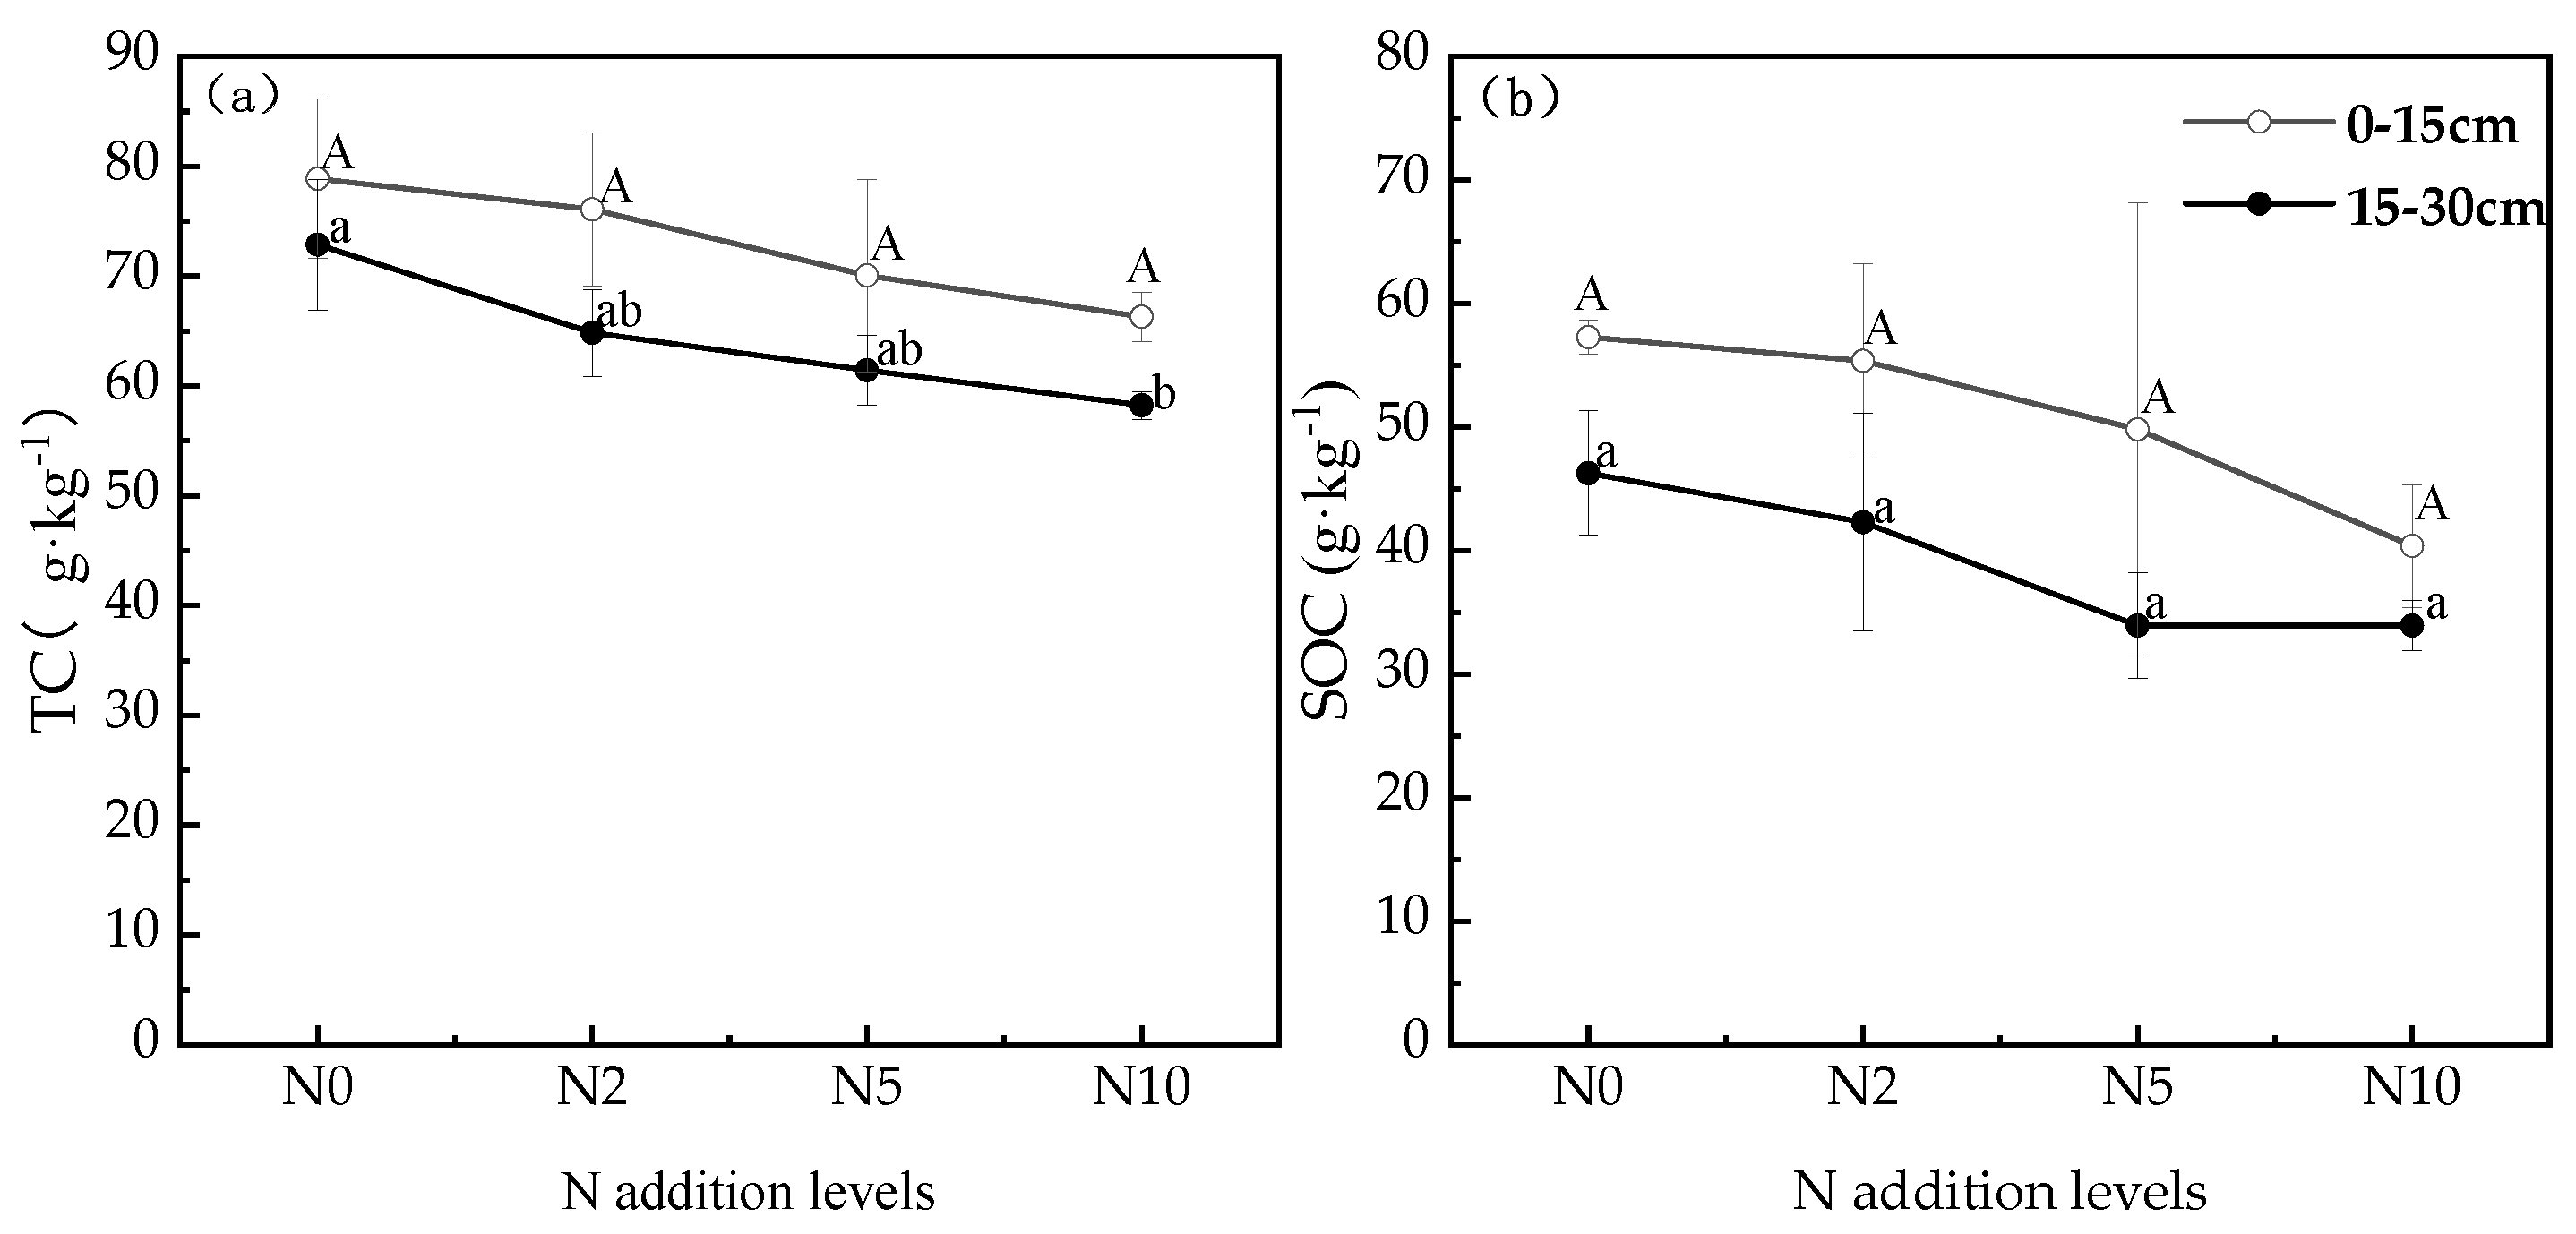
3.2. Soil Carbon Changes under Different Nitrogen Addition Conditions

The contents of TC (a) and SOC (b) are shown in Figure 3. In the 0–15 cm soil layer, the TC content was 66.30–78.87 g·kg−1 and the content gradually decreased with the increase in the N addition gradient, but the effect was not significant (p > 0.05); in the 15–30 cm soil layer, the TC content was 58.23–72.87 g·kg−1, and the TC content decreased gradually with the increase in the N addition gradient and reached a significant level (p < 0.05) under N10 treatment (Figure 5a). SOC content at 0–15 cm ranged from 40.37 to 57.29 g·kg−1, with a gradual decrease in SOC content with an increasing N addition gradient, but the effect was not significant (p > 0.05). In the 15–30 cm soil layer, SOC content ranged from 33.93 to 46.27 g·kg−1, which was consistent with the changes in the 0–15 cm soil layer, and none of the effects were significant (p > 0.05) (Figure 5b). N addition reduced soil carbon pools and the effect was more pronounced with increasing N concentration. Among them, N addition reduced SOC by 3.36–29.54% and 8.57–26.66% in the top soil and deep soil, respectively.

3.3. Changes in Soil Physicochemical Properties and Their Effects on Soil Carbon under Nitrogen Addition Conditions

In order to comprehensively analyze the influencing factors of the soil carbon pool, this paper also analyzed other physicochemical indexes such as the soil nitrogen pool, water content, and pH. TN content in the 0–15 cm soil layer ranged from 4.00 to 5.10 g·kg−1, increasing and then, decreasing with an increasing N addition gradient, and reached the highest value under N2 treatment, but the effect was not significant (p > 0.05). In the 15–30 cm soil layer, TN content ranged from 3.40 to 4.10 g·kg−1, decreasing with an increasing N addition gradient, but the effect was not significant (p > 0.05) (Table 1). NH4+-N content in the 0–15 cm soil layer ranged from 8.67 to 10.39 mg·kg−1, decreasing with an increasing N addition gradient, with no significant effect (p > 0.05); in the 15–30 cm soil layer, NH4+-N ranged from 8.95 to 10.42 mg·kg−1, decreasing, and then, increasing with an increasing N addition gradient, and reached the maximum value under N10 treatment, but with no significant effect (p > 0.05) (Table 1). NO3-N content in the 0–15 cm soil layer ranged from 6.27to 13.40 mg·kg−1, gradually increased with the increase in the N addition gradient, and reached a significant level under N10 treatment (p < 0.05). In the 15–30 cm soil layer, NO3-N content ranged from 5.60 to 7.43 mg·kg−1, first decreasing, and then, increasing with the increase in the N addition gradient, but the effect was not significant (p > 0.05) (Table 1). SWC ranged from 55.46% to 77.03% in the 0–15 cm soil layer and reached its maximum under the N2 treatment, and then, gradually decreased and reached a significant level under the N5 and N10 treatments (p < 0.05); additionally, it ranged from 51.15 to 76.74% in the 15–30 cm soil layer, which was consistent with the changes in the 0–15 cm soil layer, and increased under the N2 treatment; then, it decreased and reached a significant level under the N10 treatment (p < 0.05). Soil pH ranged from 8.17 to 9.13 in the 0–15 cm soil layer, and the pH gradually increased with increasing N application concentration and reached a significant level (p < 0.05) at higher N treatments; the pH ranged from 8.3 to 9.0 in the 15–30 cm soil layer, and the pH gradually increased with an increasing N addition gradient, again reaching a significant level (p < 0.05) under the N5 and N10 treatments (Table 1). The physicochemical properties of the upper soil layers were more susceptible to N addition.
The correlations used in this study are all Pearson correlations. Soil pH was significantly negatively correlated (p < 0.05) with total carbon, SOC, and water content. TC showed a highly significant positive correlation (p < 0.01) with SOC and TN, and a significant positive correlation (p < 0.05) with water content. SOC was highly significantly positively correlated with TN and water content (p < 0.01). TN was highly significantly positively correlated with water content (p < 0.01). There was no significant correlation between NH4+-N, NH3-N, and the other physicochemical properties of soil (p > 0.05) (Table 2).

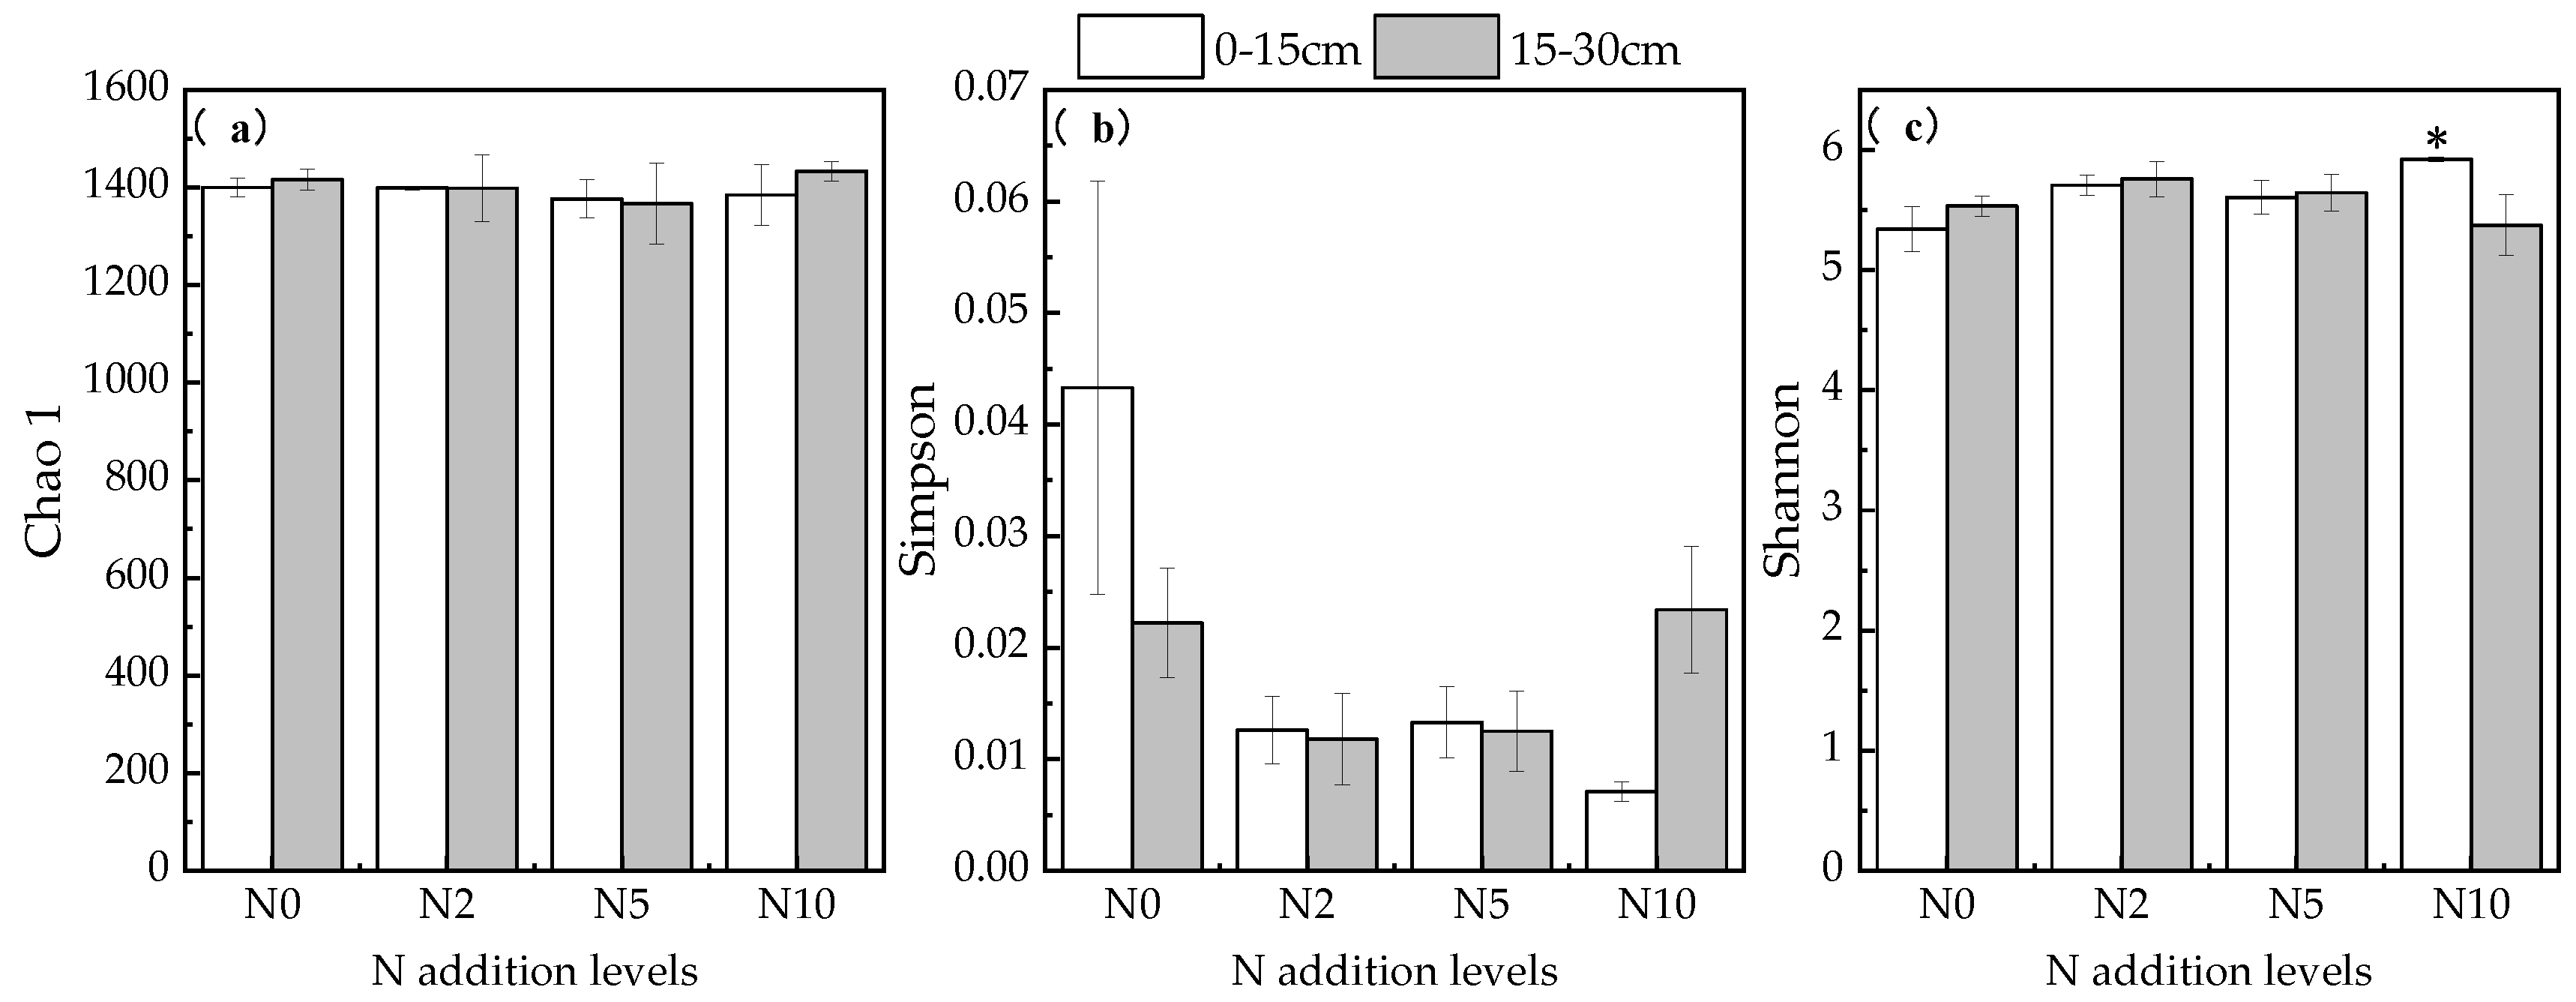
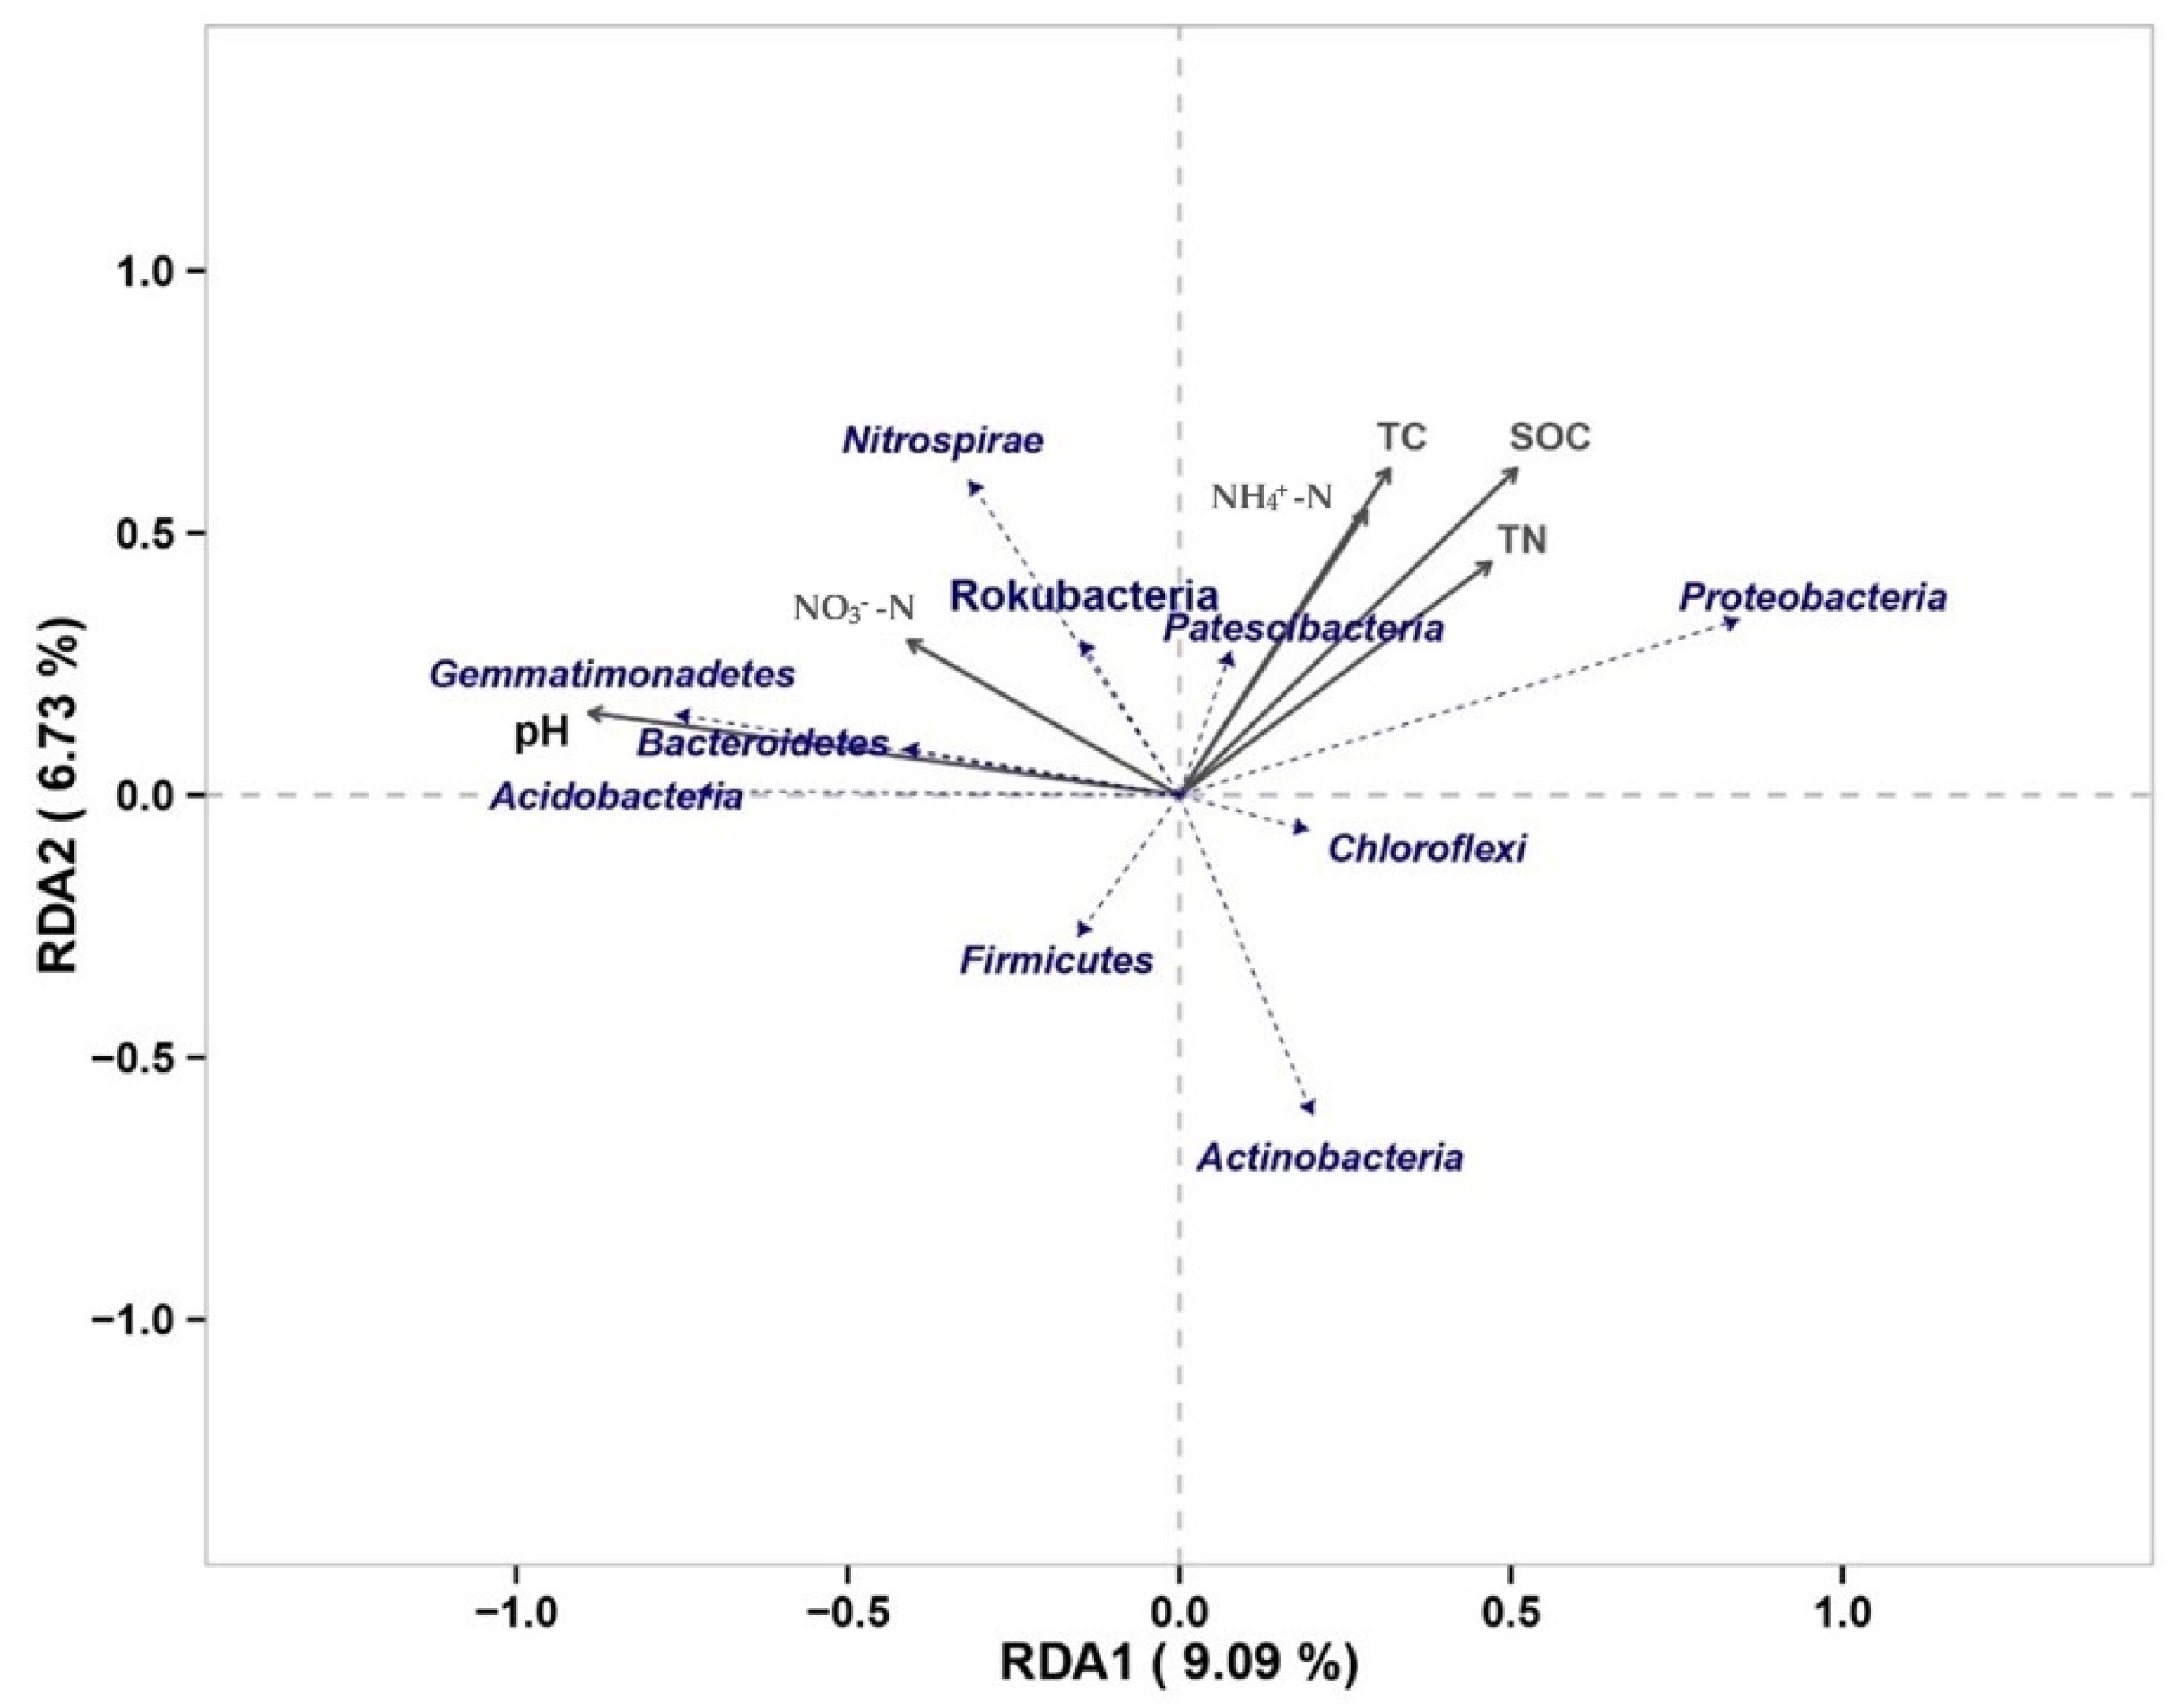
3.4. Soil Microbial Changes and Their Effect on Soil Carbon under Nitrogen Addition Conditions

Microbial diversity was measured using a high-throughput sequencing platform, with OTU clustering followed by an analysis of species abundance and diversity to explore the differences in samples between treatments.
Firstly, an OTU dilution curve was established to check whether the sequencing volume could adequately reflect the species diversity in the samples. The OTU dilution curves of soil bacteria are shown in Figure 3. After the sample volume increased to a certain amount, the curves gradually leveled off, indicating that the current sequencing sample volume is sufficient, and the sequencing results are reasonable (Figure 6).
In the species abundance analysis, microbial taxa with a relative abundance ≥1% at the bacterial phylum level were selected, and then, the other microbial taxa were combined into Others, with Unclassified representing species that did not receive taxonomic annotation. The changes in the content of microbial taxa with a 1% relative abundance of bacteria at different gradients of nitrogen addition are shown in Table 3. The total number of taxa shown is 11, and they include Proteobacteria (31.82–43.50%), Chloroflexi (14.46–17.36%), Acidobacteria (10.65–18.87%), Actinobacteria (9.90–13.10%), Gemmatimonadetes (3.09–6.39%), Bacteroidetes (2.77–4.63%), Rokubacteria (2.50–3.59%), Patescibacteria (2.24–2.77%), Nitrospirae (1.54–2.41%), Firmicutes (0.81–3.78%), and Verrucomicrobia (0.95–2.04%). The relative abundances of Proteobacteria, Chloroflexi, Acidobacteria, and Actinobacteria were all above 10%, and in total, occupied more than 75% of the whole bacterial community, being the main dominant species (Table 3).
The relative abundance of Proteobacteria decreased and was significantly lower in the N2 treatment than in the blank control treatment (p < 0.05), and reached a highly significant level in the N5 and N10 treatments (p < 0.01) (Figure 7). The relative abundance of Chloroflexi increased, and then, decreased, reaching its lowest value under N5 treatment and its highest value under N10 treatment, but the changes were not significant (p > 0.05). The relative abundance of Acidobacteria increased gradually with the gradient of N addition, with a significant level of change (p < 0.05), and reached a highly significant level (p < 0.01) under the N5 and N10 treatments. The relative abundance of Actinobacteria was lower under the N treatment than the blank control treatment, and reached its lowest value under the N5 treatment, which was significantly lower than the blank control treatment (p < 0.05) (Figure 7).
Alpha diversity is used to indicate species diversity, and three of these indices were selected for this study: The Chao1 index indicated species richness, the Shannon index indicates species diversity, and the Simpson index indicates species dominance. The higher the species diversity of the sample, the greater the value of the Shannon index and the smaller the value of the Simpson index [33].
The Chao 1 and Simpson indices of bacteria in the 0–15 cm soil layer showed a decrease with no significant difference (p > 0.05) (Figure 8); the Shannon index gradually increased with the increase in the applied N concentration, and was significantly higher for the N10 treatment than for the blank control treatment (p < 0.05) (Figure 8b). The Chao 1 index and Simpson index of bacteria in the 15–30 cm soil layer showed a decreasing trend with an increasing N addition gradient, while the Shannon index showed the opposite trend, with no significant difference (p > 0.05) (Figure 8).
According to the results of the correlation analysis, SOC content was most closely related to soil bacteria. From the first ranking axis (RDA1), from right to left, the relative abundance of Proteobacteria and Chloroflexi increased with the increase in SOC, total carbon, TN, and NH4+-N, but the relative abundance of soil pH and NO3--N content, as well as Acidobacteria and Actinobacteria, decreased (Figure 8). SOC, total carbon, TN, and ammonium nitrogen were positively correlated with Proteobacteria and Chloroflexi, and negatively with Acidobacteria and Actinobacteria (Figure 9). Proteobacteria, the dominant phylum with the highest relative abundance in the bacterial community, showed a significant positive correlation with SOC. As the relative abundance of Proteobacteria decreased significantly (Figure 7), SOC showed a corresponding change (Figure 5).

4. Discussion

4.1. Effects of Climate Change and N Addition on SOC

Soil is the largest carbon pool in terrestrial ecosystems and is an important factor in the carbon and nitrogen cycle of terrestrial ecosystems. The health of the soil affects plant growth, and the content of carbon, nitrogen, organic matter, and other nutrients in the soil determines plant growth and development processes and is important for the ecosystem [34].
Climatic elements are key factors influencing soil SOC, which increases with precipitation and decreases with temperature. There is a clear interdependence between SOC and climate [8]. Climate change in the experimental area was also analyzed in this study. It was found that after N addition, soil temperature increased significantly and precipitation and air temperature decreased, but air temperature decreased insignificantly. At the same time, the content of both soil TC and SOC decreased, which is consistent with the results of previous studies [8]. Soil temperature and precipitation may be key factors influencing SOC.
In this experiment, the carbon and nitrogen content of the lower soil was lower than that of the upper soil, probably because nitrogen was added and aggregated in the surface layer, which promoted microbial metabolic activities, and the microbial activity of the lower soil was lower, so the carbon and nitrogen content of the upper soil was higher than that of the lower soil. This study showed that there was a good correlation between water content and SOC, TC, and TN, and between SOC, TC, and TN. Wetland soils have high SWC, and the large accumulation of soil organic matter follows. Soil carbon and nitrogen content decreases with SWC [35]. Soil nitrogen mainly exists in the SOC pool, with SOC occurring through the mineralization of microorganisms to release mineral nitrogen for plants to use, and SOC represents an important source of soil nitrogen [36]. Therefore, TN tends to be closely related to SOC, which varies similarly to TC.
In previous studies, most concluded that N addition increased the SOC content [16,17,18,19], but our study found that SOC decreased. Combined with the study of soil microorganisms, it was found that N addition increased microbial diversity, which enhanced the decomposition and soil respiration of soil microorganisms, and the consumed organic carbon might have offset the increased amount of SOC through N addition. Similar conclusions were also reached by Mack et al. [21] and Cleveland et al. [22]. However, the process of soil carbon and nitrogen cycling is very complex, and further research may be required to determine it in the future.

4.2. Influence of Soil Physicochemical Properties on SOC

Changes in SWC have a significant effect on the structural composition of soil nutrients, while under alpine conditions, changes in SWC have a more sensitive effect on the configuration of soil components [37]. It was found that SWC tended to decrease under nitrogen addition and was generally higher in the upper soil than in the lower soil. This is due to the increase in plant biomass as a result of N addition [38], which leads to higher photosynthetic rates and increased water use by the plant root system. During the sampling work in the test plots, we also found that the soil was sandy 30 cm below the surface, which could also be one of the reasons for this result. Soil pH responds to the nature of the soil, and it has been shown that N addition decreases soil pH significantly [39], whereas the results of this study found that N addition increased soil pH. As the Xiaopohu wetland is a lakeshore wetland formed by the declining water level of Qinghai Lake, the soil itself is high in salinity [40], and it was also found in the initial soil physicochemical property investigation that the soil itself was alkaline, and the nitrogen additions alkalized the soil even further. Soil nutrient limitation in alpine wetlands is alleviated to some extent by N addition, which promotes nutrient utilization by plants, resulting in the uptake of large amounts of inorganic N, and consequently, an increase in soil pH, and a certain amount of resistance and buffering of the soil to keep it stable [41]. It has been shown that high-nitrogen treatments increase the amount of NH4+-N in the soil and enhance microbial nitrification [42]. In this experiment, the effect of N addition on NH4+-N was not significant and was lower than the control except under the N10 treatment in the 15–30 cm soil layer, which was higher than the blank control treatment. The ammonification of microorganisms is the main source of NH4+-N in soil, and NO3-N is produced mainly through uptake and utilization by plants and microorganisms [43]. In this experiment, NO3-N content increased and varied significantly at 0–15 cm, which may be due to the large amount of exogenous nitrogen input into the soil, which produces a large amount of NO3-N under the nitrification of microorganisms, thus increasing the NO3-N content. Soil nitrogen is mainly stored in the SOC pool [44], and N addition can change the transformation process of soil nitrogen, and thus, affect the content of SOC [36], so TN has an extremely close correlation with SOC. There are also many studies showing that SOC is not easily decomposed [45] and does not change significantly under nitrogen application. In this study, it was found that TN and SOC content decreased after N addition, but the results did not reach a significant level, which is basically consistent with the results of the previous study [36].

4.3. Influence of Soil Microorganisms on SOC

N addition induces changes in soil microbial community structure and diversity [46,47]. In this study, we explored the community structure and diversity characteristics of soil bacteria via high-throughput sequencing. Ascomycetes, Green Benders, Acidobacteria, and Actinobacteria were found to be the major dominant phyla of soil bacteria. The relative abundance of the dominant phylum of soil microorganisms changed with the addition of nitrogen, with nitrogen significantly decreasing the relative abundance of Ascomycetes, whereas Fierer et al. concluded that the abundance of Ascomycetes increased when nitrogen was increased in the soil [48]. TN content also showed a decreasing trend, and the relative abundance of the Aspergillus phylum decreased accordingly. It has been found that an increase in the relative abundance of the Acidobacteria phylum tends to correlate with an increase in soil nitrogen content [49], but the relative abundance of the Acidobacteria phylum showed an increasing trend in the present study, contrary to previous studies, which may be related to its microbial adaptation to the environment. Although most studies claim that Acidobacteria are negatively correlated with soil pH [50,51], some studies also show that Acidobacteria are not significantly correlated with soil pH [52]. In a previous study, 10 subgroups of Acidobacteria were found to have a positive relationship with pH, and all these subgroups were hardier [53]. Our study area is located in an alpine region with a complex topographic and climatic environment, and the variation of Acidobacteria may be related to the differences in the concentrations of different subpopulations. In the study of soil microbial diversity, it was found that the diversity index of soil bacteria increased, but only when N10 treatment reached a significant level (p < 0.05) and the index of dominance decreased. Nitrogen addition inhibited microbial activity and reduced the number of dominant species, which, in turn, reduced competition and increased bacterial diversity [54]. Rising soil microbial abundance enhances the decomposition of SOC, which, in turn, reduces SOC [19,20].

4.4. Research Shortcomings and Prospects

In this study, a two-year nitrogen addition experiment was conducted in a typical watershed on the Qinghai–Tibetan Plateau to analyze the effects of nitrogen addition and climate change on SOC and soil microorganisms, and to provide a reference for the scientific management, development, and utilization of Qinghai Lake wetlands. Although the study has made some progress, there are still some shortcomings. Firstly, due to time constraints, we only conducted two years of nitrogen addition experiments. Nitrogen deposition is a long and slow process, and longer-term experiments may yield more valuable results. Secondly, regarding the setting of the gradient of nitrogen addition, more groups could be set up to make the experiment more accurate. Thirdly, the soil material cycling process is very complex; soil microorganisms are related to a variety of environmental factors as well as biological factors, and at the same time, there is a lack of research on functional gene microorganisms, and the understanding of the interactions among them is not yet perfect and needs to be further explored. Fourthly, soil enzymes are also key factors affecting soil material cycling, and the mechanism and action mechanism of nitrogen addition to a soil environment can be elaborated in more detail by incorporating the study of related enzyme activities.

5. Conclusions

This study was conducted in the alpine wetland of Qinghai Lake, and different concentrations of nitrogen addition treatments were used to analyze the response of soil organic carbon (SOC) and soil microorganisms to nitrogen addition, and to explore the relationship between SOC and microorganisms, and the following conclusions were drawn.
(1) N addition altered the soil physicochemical properties where SOC was reduced by 3.36–29.54% and 8.57–26.66% in the 0–15 cm and 15–30 cm soil layers, respectively. Increased soil temperatures and decreased precipitation combined to reduce SOC content.
(2) As a result of changes in the soil physicochemical properties, the soil microbial community also changed. Proteobacteria, Chloroflexi, Acidobacteria, and Actinobacteria are the main dominant phyla of bacteria. After nitrogen addition, the abundance of Proteobacteria and Actinobacteria decreased, while that of Acidobacteria increased. The abundance of Chloroflexi did not change significantly. Overall, the abundance and diversity of soil bacteria tended to increase under N addition. Further analysis revealed that the relationship between soil bacteria and organic carbon was strong and more pronounced in the upper soils.
(3) The results of the climatic elements show that increased soil temperatures and lower air temperatures and precipitation in Xiao Bo Lake have resulted in a decrease in SOC. Microbial decomposition and climatic elements are key factors influencing SOC content.

Author Contributions

All of the authors have contributed to the manuscript. R.X., Z.W., and J.Z. led the write-up of the manuscript and provided significant contributions. All authors have read and agreed to the published version of the manuscript.

Funding

This research was financially supported by the Natural Science Foundation of Qinghai Province, China (2019-ZJ-7608).

Institutional Review Board Statement

Not applicable.

Informed Consent Statement

Not applicable.

Data Availability Statement

Not applicable.

Conflicts of Interest

The authors declare no conflict of interest.

References

  1. Shao, P.; Zeng, Z.; Moore, D.J.P.; Zeng, X. Soil microbial respiration from observations and earth system models. Environ. Res. Lett. 2013, 8, 034034. [Google Scholar] [CrossRef]
  2. Carvalhais, N.; Forkel, M.; Khomik, M.; Bellarby, J.; Jung, M.; Migliavacca, M.; Mu, M.; Saatchi, S.; Santoro, M.; Thurner, M.; et al. Global covariation of carbon turnover times with climate in terrestrial ecosystems. Nature 2014, 514, 213–217. [Google Scholar] [CrossRef] [PubMed]
  3. Lal, R. Soil carbon sequestration impacts on global climate change and food security. Science 2004, 304, 1623–1627. [Google Scholar] [CrossRef] [PubMed]
  4. Lajtha, K.; Bowden, R.D.; Crow, S.; Fekete, I.; Kotroczó, Z.; Plante, A.; Simpson, M.J.; Nadelhoffer, K.J. The detrital input and removal treatment (DIRT) network: Insights into soil carbon stabilization. Sci. Total Environ. 2018, 640–641, 1112–1120. [Google Scholar] [CrossRef] [PubMed]
  5. Lu, X.; Hou, E.; Guo, J.; Gilliam, F.S.; Li, J.; Tang, S.; Kuang, Y. Nitrogen addition stimulates soil aggregation and enhances carbon storage in terrestrial ecosystems of China: A meta-analysis. Glob. Chang. Biol. 2021, 27, 2780–2792. [Google Scholar] [CrossRef] [PubMed]
  6. Luo, P.P.; Kang, S.X.; Apip; Zhou, M.M.; Lyu, J.Q.; Aisyah, S.; Binaya, M.; Regmi, R.K.; Nover, D. Water quality trend assessment in Jakarta: A rapidly growing Asian megacity. PLoS ONE 2019, 14, e0219009. [Google Scholar] [CrossRef] [PubMed]
  7. Ramesh, T.; Bolan, N.S.; Kirkham, M.B.; Wijesekara, H.; Kanchikerimath, M.; Rao, C.S.; Sandeep, S.; Rinklebe, J.; Ok, Y.S.; Choudhury, B.U.; et al. Soil organic carbon dynamics: Impact of land use changes and management practices: A review. Adv. Agron. 2019, 156, 1–107. [Google Scholar]
  8. Fantappiè, M.; L’Abate, G.; Costantini, E. The influence of climate change on the soil organic carbon content in Italy from 1961 to 2008. Geomorphology 2011, 135, 343–352. [Google Scholar] [CrossRef]
  9. Bradford, M.A.; Wieder, W.R.; Bonan, G.B.; Fierer, N.; Raymond, P.A.; Crowther, T.W. Managing uncertainty in soil carbon feedbacks to climate change. Nat. Clim. Chang. 2016, 6, 751–758. [Google Scholar] [CrossRef]
  10. Vitousek, P.M.; Porder, S.; Houlton, B.Z.; Chadwick, O.A. Terrestrial phosphorus limitation: Mechanisms, implications, and nitrogen-phosphorus interactions. Ecol. Appl. 2010, 20, 5–15. [Google Scholar] [CrossRef]
  11. Peñuelas, J.; Sardans, J.; Rivas-Ubach, A.; Janssens, I.A. The human-induced imbalance between C, N and P in earth’s life system. Glob. Chang. Biol. 2012, 18, 3–6. [Google Scholar] [CrossRef]
  12. Fowler, D.; Coyle, M.; Skiba, U.; Sutton, M.A.; Cape, J.N.; Reis, S.; Sheppard, L.J.; Jenkins, A.; Grizzetti, B.; Galloway, J.N.; et al. The global nitrogen cycle in the twenty-first century. Philos. Trans. R. Soc. B Biol. Sci. 2013, 368, 20130164. [Google Scholar] [CrossRef] [PubMed]
  13. Bala, G.; Devaraju, N.; Chaturvedi, R.; Caldeira, K.; Nemani, R. Nitrogen deposition: How important is it for global terrestrial carbon uptake? Biogeosciences 2013, 10, 7147–7160. [Google Scholar] [CrossRef]
  14. Feng, J.; Zhu, B. A global meta-analysis of soil respiration and its components in response to phosphorus addition. Soil Biol. Biochem. 2019, 135, 38–47. [Google Scholar] [CrossRef]
  15. Xu, C.; Xu, X.; Ju, C.; Chen, H.; Wilsey, B.; Luo, Y.; Fan, W. Long-term, amplified responses of soil organic carbon to nitrogen addition worldwide. Glob. Chang. Biol. 2021, 27, 1170–1180. [Google Scholar] [CrossRef]
  16. Yue, K.; Fornara, D.A.; Yang, W.; Peng, Y.; Peng, C.; Liu, Z.; Wu, F. Influence of multiple global change drivers on terrestrial carbon storage: Additive effects are common. Ecol. Lett. 2017, 20, 663–672. [Google Scholar] [CrossRef]
  17. Chen, J.; Luo, Y.Q.; Groenigen, K.J.; Hungate, B.A.; Cao, J.J.; Zhou, X.H.; Wang, R.W. A keystone microbial enzyme for nitrogen control of soil carbon storage. Sci. Adv. 2018, 4, eaaq1689. [Google Scholar] [CrossRef]
  18. Zak, D.R.; Holmes, W.E.; Burton, A.J.; Talhelm, P.A.F. Simulated atmospheric no3- deposition increases soil organic matter by slowing decomposition. Ecol. Appl. 2008, 18, 2016–2027. [Google Scholar] [CrossRef]
  19. Crowther, T.W.; Riggs, C.; Lind, E.; Borer, E.T.; Seabloom, E.W.; Hobbie, S.E.; Wubs, J.; Adler, P.B.; Firn, J.; Gherardi, L.; et al. Sensitivity of global soil carbon stocks to combined nutrient enrichment. Ecol. Lett. 2019, 22, 936–945. [Google Scholar] [CrossRef]
  20. Lu, X.; Gilliam, F.S.; Guo, J.; Hou, E.; Kuang, Y. Decrease in soil pH has greater effects than increase in above-ground carbon inputs on soil organic carbon in terrestrial ecosystems of China under nitrogen enrichment. J. Appl. Ecol. 2022, 59, 768–778. [Google Scholar] [CrossRef]
  21. Mack, M.C.; Schuur, E.A.G.; Bret-Harte, M.S.; Shaver, G.R.; Chapin, F.S. Ecosystem carbon storage in arctic tundra reduced by long-term nutrient fertilization. Nature 2004, 431, 440–443. [Google Scholar] [CrossRef]
  22. Cleveland, C.C.; Townsend, A.R. Nutrient additions to a tropical rain forest drive substantial soil carbon dioxide losses to the atmosphere. Proc. Natl. Acad. Sci. USA 2006, 103, 10316–10321. [Google Scholar] [CrossRef] [PubMed]
  23. Fang, H.J.; Cheng, S.L.; Yu, G.R.; Yang, X.M.; Xu, M.J.; Wang, Y.S.; Li, L.S.; Dang, X.S.; Wang, L.; Li, Y.N. Nitrogen deposition impacts on the amount and stability of soil organic matter in an alpine meadow ecosystem depend on the form and rate of applied nitrogen. Eur. J. Soil Sci. 2014, 65, 510–519. [Google Scholar] [CrossRef]
  24. Camenzind, T.; Hättenschwiler, S.; Treseder, K.K.; Lehmann, A.; Rillig, M.C. Nutrient limitation of soil microbial processes in tropical forests. Ecol. Monogr. 2018, 88, 4–21. [Google Scholar] [CrossRef]
  25. Mori, T.; Lu, X.K.; Aoyagi, R.; Mo, J. Reconsidering the phosphorus limitation of soil microbial activity in tropical forests. Func. Ecol. 2018, 32, 1145–1154. [Google Scholar] [CrossRef]
  26. Riggs, C.E.; Hobbie, S.E. Mechanisms driving the soil organic matter decomposition response to nitrogen enrichment in grassland soils. Soil Biol. Biochem. 2016, 99, 54–65. [Google Scholar] [CrossRef]
  27. Xin, H. A green fervor sweeps the Qinghai-Tibetan Plateau. Science 2008, 321, 633–635. [Google Scholar] [CrossRef]
  28. Ma, Y.J.; Li, X.Y.; Liu, L.; Huang, Y.M.; Li, Z.; Hu, X.; Wu, X.C.; Yang, X.F.; Wang, P.; Zhao, S.J.; et al. Measurements and modeling of the water budget in semiarid high-altitude Qinghai Lake Basin, Northeast Qinghai-Tibet Plateau. J. Geophys. Res. Atmos. 2018, 123, 10857–10871. [Google Scholar] [CrossRef]
  29. Li, J.; Gong, J.; Guldmann, J.M.; Li, S.; Zhu, J. Carbon dynamics in the northeastern qinghai–tibetan plateau from 1990 to 2030 using landsat land use/cover change data. Remote Sens. 2020, 12, 528. [Google Scholar] [CrossRef]
  30. Ma, Y.J.; Xie, T.; Li, X.Y. Spatial variation of soil organic carbon in the Qinghai Lake watershed, northeast Qinghai-Tibet Plateau. Catena 2022, 213, 106187. [Google Scholar] [CrossRef]
  31. Wang, Z.; Cao, S.; Cao, G.; Lan, Y. Effects of vegetation phenology on vegetation productivity in the Qinghai Lake Basin of the Northeastern Qinghai–Tibet Plateau. Arab. J. Geosci. 2021, 14, 1030. [Google Scholar] [CrossRef]
  32. Wang, Z.; Cao, S.; Cao, G.; Hou, Y.; Wang, Y.; Kang, L. The Partitioning of Catchment Evapotranspiration Fluxes as Revealed by Stable Isotope Signals in the Alpine Inland River Basin. Water 2022, 14, 790. [Google Scholar] [CrossRef]
  33. Grice, E.A.; Kong, H.H.; Conlan, S.; Deming, C.B.; Davis, J.; Young, A.C.; NISC Comparative Sequencing Program; Bouffard, G.G.; Blakesley, R.W.; Murray, P.R.; et al. Topographical and Temporal Diversity of the Human Skin Microbiome. Science 2009, 324, 1190–1192. [Google Scholar] [CrossRef] [PubMed]
  34. Lu, M.; Zhou, X.; Luo, Y.; Yang, Y.; Fang, C.; Chen, J.; Li, B. Minor stimulation of soil carbon storage by nitrogen addition: A meta-analysis. Agric. Ecosyst. Environ. 2011, 140, 234–244. [Google Scholar] [CrossRef]
  35. Amador, J.A.; Görres, J.H.; Savin, M.C. Role of soil water content in the carbon and nitrogen dynamics of Lumbricus terrestris L. burrow soil. Appl. Soil Ecol. 2005, 28, 15–22. [Google Scholar] [CrossRef]
  36. Zhong, X.L.; Li, J.T.; Li, X.J.; Ye, Y.C.; Liu, S.S.; Hallett, P.D.; Ogden, M.R.; Naveed, M. Physical protection by soil aggregates stabilizes soil organic carbon under simulated N deposition in a subtropical forest of China. Geoderma 2017, 285, 323–332. [Google Scholar] [CrossRef]
  37. Zhou, L.; Zhou, X.; Zhang, B.; Lu, M.; Luo, Y.; Liu, L.; Li, B. Different responses of soil respiration and its components to nitrogen addition among biomes: A meta-analysis. Glob. Chang. Biol. 2014, 20, 2332–2343. [Google Scholar] [CrossRef] [PubMed]
  38. Harpole, W.S.; Potts, D.L.; Suding, K.N. Ecosystem responses to water and nitrogen amendment in a California grassland. Glob. Chang. Biol. 2007, 13, 2341–2348. [Google Scholar] [CrossRef]
  39. Liu, K.; Fang, Y.; Yu, F.; Liu, Q.; Li, F.; Peng, S. Soil acidification in response to acid deposition in three subtropical forests of subtropical China. Pedosphere 2010, 20, 399–408. [Google Scholar] [CrossRef]
  40. Li, C.; Li, Q.; Zhao, L.; Ge, S.; Chen, D.; Dong, Q.; Zhao, X. Land-use effects on organic and inorganic carbon patterns in the topsoil around Qinghai Lake basin, Qinghai-Tibetan Plateau. Catena 2016, 147, 345–355. [Google Scholar] [CrossRef]
  41. Matson, P.; Lohse, K.A.; Hall, S.J. The globalization of nitrogen deposition: Consequences for terrestrial ecosystems. Ambio 2002, 113–119. [Google Scholar] [CrossRef]
  42. Kaye, J.; Barrett, J.; Burke, I. Stable nitrogen and carbon pools in grassland soils of variable texture and carbon content. Ecosystems 2002, 5, 461–471. [Google Scholar] [CrossRef]
  43. Gao, W.; Cheng, S.; Fang, H.; Chen, Y.; Yu, G.; Zhou, M.; Zhang, P.; Xu, M. Effects of simulated atmospheric nitrogen deposition on inorganic nitrogen content and acidification in a cold-temperate coniferous forest soil. Acta Ecol. Sin. 2013, 33, 114–121. [Google Scholar] [CrossRef]
  44. Kooijman, A.; Morriën, E.; Jagers op Akkerhuis, G.; Missong, A.; Bol, R.; Klumpp, E.; Hall, R.; Til, M.; Kalbitz, K.; Bloem, J. Resilience in coastal dune grasslands: pH and soil organic matter effects on P nutrition, plant strategies, and soil communities. Ecosphere 2020, 11, e03112. [Google Scholar] [CrossRef]
  45. Wamelink, G.W.W.; Van Dobben, H.F.; Berendse, F. Vegetation succession as affected by decreasing nitrogen deposition, soil characteristics and site management: A modelling approach. For. Ecol. Manag. 2009, 258, 1762–1773. [Google Scholar] [CrossRef]
  46. Zhou, J.; Guan, D.; Zhou, B.; Zhao, B.; Ma, M.; Qin, J.; Jiang, X.; Chen, S.; Cao, F.; Shen, D.; et al. Influence of 34-years of fertilization on bacterial communities in an intensively cultivated black soil in northeast China. Soil Biol. Biochem. 2015, 90, 42–51. [Google Scholar] [CrossRef]
  47. Schuster, M.J.; Smith, N.G.; Dukes, J.S. Responses of aboveground C and N pools to rainfall variability and nitrogen deposition are mediated by seasonal precipitation and plant community dynamics. Biogeochemistry 2016, 129, 389–400. [Google Scholar] [CrossRef]
  48. Fierer, N.; Bradford, M.A.; Jackson, R.B. Toward an ecological classification of soil bacteria. Ecology 2007, 88, 1354–1364. [Google Scholar] [CrossRef]
  49. Xia, Z.; Yang, J.; Sang, C.; Wang, X.; Sun, L.; Jiang, P.; Wang, C.; Bai, E. Phosphorus reduces negative effects of nitrogen addition on soil microbial communities and functions. Microorganisms 2020, 8, 1828. [Google Scholar] [CrossRef]
  50. Chu, H.Y.; Fierer, N.; Lauber, C.L.; Caporaso, J.G.; Knight, R.; Grogan, P. Soil bacterial diversity in the Arctic is not fundamentally different from that found in other biomes. Environ. Microbiol. 2010, 12, 2998–3006. [Google Scholar] [CrossRef] [PubMed]
  51. Griffiths, R.I.; Thomson, B.C.; James, P.; Bell, T.; Whiteley, A.S. The bacterial biogeography of british soils rid d-5237-2011 rid a-3395-2012. Environ. Microbiol. 2011, 13, 1642–1654. [Google Scholar] [CrossRef] [PubMed]
  52. Liu, J.; Sui, Y.; Yu, Z.; Shi, Y.; Chu, H.; Jin, J.; Liu, X.; Wang, G. Soil carbon content drives the biogeographical distribution of fungal communities in the black soil zone of northeast China. Soil Biol. Biochem. 2015, 83, 29–39. [Google Scholar] [CrossRef]
  53. Jones, R.T.; Robeson, M.S.; Lauber, C.L.; Hamady, M.; Knight, R.; Fierer, N. A comprehensive survey of soil acidobacterial diversity using pyrosequencing and clone library analyses. ISME J. 2009, 3, 442–453. [Google Scholar] [CrossRef] [PubMed]
  54. Wang, C.; Liu, D.; Bai, E. Decreasing soil microbial diversity is associated with decreasing microbial biomass under nitrogen addition. Soil Biol Biochem. 2018, 120, 126–133. [Google Scholar] [CrossRef]
Figure 1. Location diagram of the study area.
Atmosphere 14 01342 g001
Figure 2. Schematic diagram of the test plot setup.
Atmosphere 14 01342 g002
Figure 3. Analysis of climatic elements (soil temperature, air temperature, and precipitation) in the Xiaobo Lake area. Note: Different letters in the figure represent significant differences (p < 0.05), and letters in different colors represent corresponding elements.
Atmosphere 14 01342 g003
Figure 4. Soil total and organic carbon changes. Note: Different letters in the figure represent significant differences (p < 0.05).
Atmosphere 14 01342 g004
Figure 5. Changes in TC (a) and SOC (b) under different nitrogen supplemental levels. Note: Capital letters represent significance in the 0–15 cm soil layer and lowercase letters represent significance in the 15–30 cm soil layer (p < 0.05).
Atmosphere 14 01342 g005
Figure 6. OTU dilution curves for bacteria.
Atmosphere 14 01342 g006
Figure 7. Changes in the main dominant phyla of bacteria. Note: * p < 0.05, ** p < 0.01. (a) represents the relative abundance of Proteobacteria; (b) represents the relative abundance of Chloroflexi; (c) represents the relative abundance of Acidobacteria; (d) represents the relative abundance of Actinobacteria.
Atmosphere 14 01342 g007
Figure 8. α diversity of bacteria treated with different nitrogen levels. Note: * p < 0.05. (a) represents the Chao 1 indix of bacteria; (b) represents the Simpson indix of bacteria; (c) represents the Shannon indix of bacteria.
Atmosphere 14 01342 g008
Figure 9. RDA of soil physicochemical properties and bacterial community structure. Note: Species are shown in blue and physicochemical properties are shown in black.
Atmosphere 14 01342 g009
Table 1. Changes in other soil physicochemical properties at different levels of N addition.
Physical and Chemical PropertiesSoil Depth (cm)N0N2N5N10
TN (g·kg−1)0–154.97 ± 0.31 a5.10 ± 0.82 a4.60 ± 1.14 a4.00 ± 0.37 a
15–304.10 ± 0.45 a4.00 ± 0.62 a3.40 ± 0.31 a3.40 ± 0.09 a
NH4+-N (mg·kg−1)0–1510.39 ± 0.61 a10.25 ± 1.91 a9.92 ± 1.80 a8.67 ± 0.32 a
15–3010.21 ± 2.00 a9.61 ± 1.21 a8.95 ± 0.48 a10.42 ± 1.64 a
NO3-N (mg·kg−1)0–156.27 ± 0.88 b6.87 ± 1.09 b8.97 ± 3.24 ab13.40 ± 3.02 a
15–307.43 ± 2.56 a7.07 ± 1.80 a5.60 ± 0.41 a7.43 ± 2.19 a
SWC (%)0–1575.03 ± 0.03 a79.50 ± 0.08 a59.63 ± 0.02 b55.46 ± 0.05 b
15–3071.64 ± 0.01 a76.74 ± 0.16 a56.86 ± 0.11 ab51.15 ± 0.02 b
pH0–158.17 ± 0.48 b8.67 ± 0.09 ab8.77 ± 0.19 a9.13 ± 009 a
15–308.3 ± 0.22 c8.57 ± 0.19 bc8.87 ± 0.24 ab9.00 ± 0.00 a
Note: The values are in the form of mean ± standard deviation, with significant correlations (p < 0.05) between different letters.
Table 2. Correlation analysis between soil physical and chemical properties.
Physical and Chemical PropertiespHTCSOCTNNO3-NNH4+-N
TC−0.409 *
SOC−0.454 *0.865 **
TN−0.3240.919 **0.953 **
NO3-N0.3450.0450.0090.143
NH4+-N−0.203−0.0170.0690.0030.018
SWC−0.443 *0.668 *0.660 **0.654 **−0.1110.236
Note: * p < 0.05, ** p < 0.01.
Table 3. Relative abundance of soil bacterial community at different nitrogen addition gradients.
PhylumN0N2N5N10
Proteobacteria43.50%35.16%31.82%32.32%
Chloroflexi16.76%16.51%14.46%17.36%
Acidobacteria10.65%15.59%18.87%15.55%
Actinobacteria13.10%12.29%9.90%12.27%
Gemmatimonadetes3.09%4.97%5.76%6.39%
Bacteroidetes2.77%3.60%4.63%3.40%
Rokubacteria2.50%3.57%2.64%3.59%
Patescibacteria2.24%2.77%2.41%2.33%
Nitrospirae1.54%1.81%2.41%1.76%
Firmicutes1.44%0.81%3.78%1.09%
Verrucomicrobia0.95%1.12%1.43%2.04%
Others1.44%1.77%1.85%1.89%
Unknown0.02%0.03%0.06%0.04%
Disclaimer/Publisher’s Note: The statements, opinions and data contained in all publications are solely those of the individual author(s) and contributor(s) and not of MDPI and/or the editor(s). MDPI and/or the editor(s) disclaim responsibility for any injury to people or property resulting from any ideas, methods, instructions or products referred to in the content.

