Abstract
Outdoor public spaces that provide a comfortable microclimate significantly contribute to urban livability. However, more elaborate investigations are needed to enhance the research-based design of landscape spatial form for optimal thermal comfort performance. This study aimed to optimize the morphological design of urban squares considering summer and winter microclimates by integrating multiple landscape elements of vegetation, waterbodies, buildings, and ground. The built environment microclimate simulation and validation of multi-physics coupling were conducted for thermal comfort, planar heterogeneity diagramming, and spatial typology identification. Further, research through design (RtD) was applied to reconstruct various spatial configurations and orientation forms to compare the relative thermal comfort areas of these geometrical prototypes in the target time period and square core zone. Among the landscape types, two identified spatial types for achieving better thermal comfort are the opening of a windward enclosure structure (ECS) that draws wind into the square in summer and an ECS without a windward opening that creates a more extended wind protection area in winter. Moreover, results of RtD show that the prototype with the smallest orientation angle to the prevailing wind direction has the most optimized thermal comfort during summer, while the form with a smaller angle to the prevailing wind direction is more favorable in winter. These findings provide methodological guidance for climate-adapted landscape square form optimization.
1. Introduction
With the significant increase in the number of thermally uncomfortable days and the urgent need to improve the quality of urban public spaces in China [1], outdoor thermal comfort design is an effective measure to improve the situation. Municipal squares are the result of the spatial production of urban power in China and are nodes of socio-spatial organization, accommodating large-scale assemblages of political and domestic activities [2,3]. Therefore, they are generally characterized by hardened paving and huge, unshaded areas. There is still a lack of practical schematic guidelines for open squares [4], and methodological research for the design of microclimate-adaptive squares is necessary. This study is based on a ternary framework [5,6] to investigate the design optimization of the spatial configuration and form of Century Square in Shanghai (Figure 1).
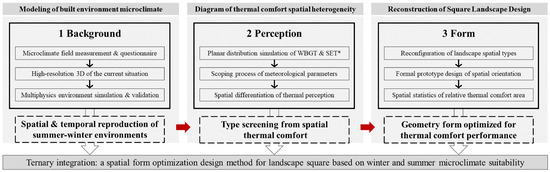
Figure 1.
Ternary framework of the research.
High-resolution modeling of the current built environment and simulation of the microclimate’s spatial performance by multiple landscape design elements such as vegetation, water bodies, and buildings are essential. Most architecture and urban design studies ignore the integral role of vegetation and water bodies [4,7,8,9,10]. Landscape researchers are insensitive to modeling spatial details at small scales [11], such as microtopography and structures, and tend to omit the influence of the surrounding complex urban environment [12].
Landscape studies that verify validity through field investigations are hypothetical prerequisites. Most of the microclimate simulation studies conducted by landscape architects use ENVI-met, which lacks grid sensitivity verification and temporal wind correction [13,14,15,16]. The case studies and spatial program analyses were not sufficient to clearly define the design target zones and time periods; the ones for 12:00 or 14:00 obviously did not directly satisfy the demand for thermal comfort in winter and summer [7,17,18,19,20].
Thermal comfort mapping of coupled multi-physics and spatial differentiation of microclimate perception are the mediators for research interventions in the landscape design process. Outdoor thermal comfort is revealed to be the most important factor affecting the use and activities of public spaces. Human perception of microclimate used as a design purpose and clue is influenced by a combination of meteorological parameters such as air velocity, temperature, humidity, radiation, etc., rather than a single one [21,22,23]. Optimized design enables comprehensive environmental regulation [24] and provides more attractive places. Furthermore, in the engineering tradition of landscape architecture, both design and construction work with “diagrams” [25,26,27]. Corbusier said that “the plane is the generator” [28], and Stan Allen argued that interdisciplinary knowledge must be transformed into graphics if it is to intervene in design [29].
Design is fundamentally about visible operations of form, not just pattern types for narration. Most typology-based studies propose only vague strategic texts of better spatial types [30,31,32], lacking material form [33,34,35]. However, research in landscape rarely produces geometric knowledge that is directly applied by designers [36,37]. In contrast, there has been much research through design (RtD) in architecture and industrial design for performance-based form generation, optimization, and morphogenesis [22,27,38,39,40,41].
This study reorganizes the square configuration after screening the better spatial types of the current built environment, explores a geometric optimization method under the constraints of one type, and generates a square form by the comparative test of different spatial orientation prototypes [42,43,44,45] that promotes thermal comfort for the target time period and the core zone (Figure 1).
2. Materials and Methods
2.1. Case Study Area and Formal Analysis
Shanghai, the largest city in China and a Global City of Excellence, belongs to the hot–humid summer and cold winter climate zone [46], with prevailing Southeast (SE) winds in summer and Northwest (NW) winds in winter [47]. Century Square (121°5′ E, 31°2′ N), located in the municipal district of Pudong, Shanghai, was constructed in 1996 and is the starting point of the famous Lujiazui Urban Axis (Figure 2). Reasons as a case study:
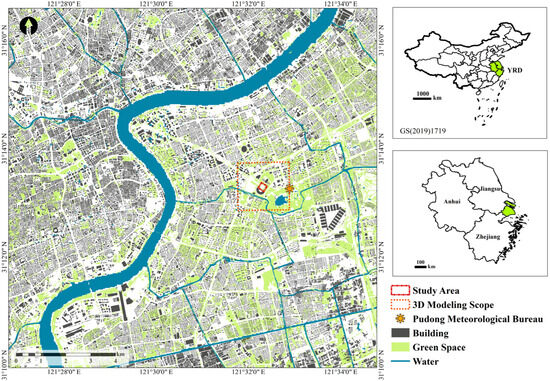
Figure 2.
Location of the study area.
- It is a typical urban square in a new low-density and high-FAR city, complete with a large central ground, and new city construction is emulated throughout China;
- Unlike Tiananmen Square (44 hm2) in Beijing, People’s Square (14 hm2) in Shanghai, and Quancheng Square (17 hm2) in Jinan, which have extremely high-level political functions, it is universal and classic as a local municipal square;
- A total of 800 m to the east of it is the national basic station of the Pudong Meteorological Bureau, and the synchronized observation data are suitable as the boundary condition for simulation [48];
- Its built environment is dominated by landscape design elements.
Pudong Century Square was constructed to serve as a central place to set off the spatial power and order of the surrounding government and public buildings. Furthermore, unlike traditional large Chinese municipal squares that sit entirely in the north–south direction [49], its spatial orientation (123.3° from the N-direction) is close to parallel to the direction of the prevailing winds (SE, 135°) [47], which will be tested in this study to see if this is the geometrical form that is optimized for thermal comfort [50,51].
The area of Century Square is 3.6 hm2, with a side length of 180 m × 200 m (Figure 3). The 180 m × 180 m topographical building (5 m height, with a green slope as the outer façade) and the forest belt (9 m height of Camphora officinarum and 6 m height of Osmanthus fragrans) together form a square enclosure structure (with an opening [52] in the midpoint of each side) that defines the inner visual space of the square (Figure 4) [50]. The space is on a medium sense-of-place scale. The center of the square is a 60 m diameter circular granite ground surrounded by a sunken water surface (water depth 10 cm).
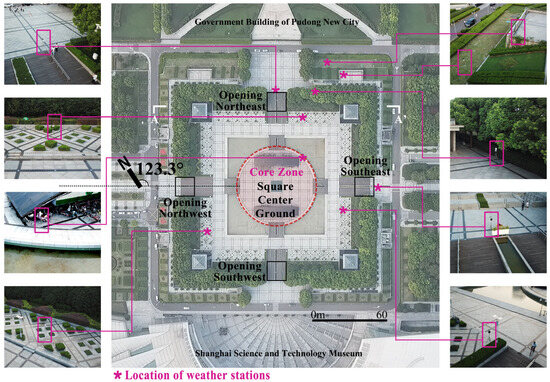
Figure 3.
Aerial plan view captured by an unmanned aerial vehicle and the location of weather stations measured on site.
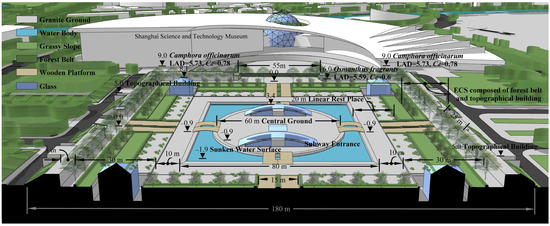
Figure 4.
Formal analysis and A–A’ section of Century Square.
The circular ground is the core program of Century Square, a container and node for collective public activities [40,53], the so-called “urban meeting room”. The enclosure structure (ECS), composed of a forest belt and topographical buildings, is the main design element that vertically forms the square space and intervenes in the microclimatic environment.
2.2. Current Built Environment Simulation
2.2.1. Microclimate Measurement and Questionnaire
Nine watchdog 2000 weather stations (Table S1) [54,55], shown in Figure 3, were placed to record microclimate parameters, including relative humidity (RH, %), solar radiation (SR, W/m2), air temperature (Ta, °C), and air velocity (Va, m/s), at 1.5 m height above the ground with a 1 min data log interval from 8:30 to 17:30. And the criteria for their location were based on different microclimatic types (opening of enclosed structures, edge of the waterbody, hard ground surface of the unshaded square, shaded area under canopy, roof, and bottom of the topographic building). Measurements were taken on March 10 (winter) and August 6 (summer), both of which were sunny and less cloudy. The measured data were used to calibrate the validity and reliability of the simulation.
The questionnaires in Century Square lasted from 8:30 to 17:30 on March 10 in the winter and July 27 and August 6 in the summer. The cumulative total of participants was 41, with 28 females and 13 males, mainly normal college students with an average height of 167 cm, a weight of 55 kg, and an age of 21.5 years. Participants spent 5 min at hourly intervals to freely find a location in the square, then remained standing at ease (1.2 Met, metabolic equivalent), followed by 5 min to complete the questionnaire (Table S2).
The questionnaire asked a participant to vote subjectively on the wind sensation (WSV), humidity sensation (HSV), air temperature sensation (ASV), solar sensation (RSV), thermal comfort (TCV), and thermal sensation (TSV) using ASHRAE (American Society of Heating, Refrigerating, and Air-Conditioning Engineers) survey questions ranging from five to seven point scales [56]. A total of 364 valid questionnaires were received. To avoid outdoor heat acclimatization [57], participants were arranged back into the air-conditioned room during each questionnaire interval and were asked to find a different location every hour.
This experiment was approved by the university’s ethics committee and conformed to the guidelines contained within the Declaration of Helsinki.
2.2.2. Numerical Simulation of Multi-Physics
In the local climate, the CFD (Computational Fluid Dynamics) solver scStream V14 (Software Cradle Co., Ltd., Osaka, Japan) based on the finite volume method and structured grid meshing was used. We employed it to simulate the microclimate of wind, temperature, humidity, and radiation field in the square composed of the underlayment, water body, and greenery, as well as in the surrounding urban environment.
- Governing equations and turbulence model
We conducted an unsteady-state Reynolds-averaged Navier–Stokes (URANS) simulation to obtain the multi-physics fields [7]. The resolution includes mass continuum, momentum, energy conservation, standard k-ε, and diffusion equations as follows [58]:
where xi is the coordinates (m), ui is the air velocity of flow in the i-direction (m/s), ρ is the density (kg/m3), and t is time (s). p is the pressure of a fluid (N/m2), gi is the gravity (m/s2), β is the thermal expansion coefficient (1/K), T is the temperature (K), and Cp is the specific heat at constant pressure (J kg−1K−1). K is the thermal conductivity (J m−1s−1K−1), h is the heat source (J m−3s−1), and k is the kinetic energy (m2/s2). ε is the dissipation rate (m2/s3), σ is the stress tensor (kg m−1s−1), μ is the viscosity (kg m−1s−1), and R is the gas constant (J kg−1K−1). Dm is the diffusion coefficient (m2/s), s is the source term of diffusive species (1/s), and turbulence model empirical constant coefficients (Cμ = 0.09, C1 = 1.44, C2 = 1.92, σk = 1, σε = 1.3, σt = 0.9) [12]. The drag effect of tree leaves was calculated from the LAD [59,60,61]:
where Fi, Fk, and Fε are the source or sink terms that express the effects of the tree [62]. Fi is the additional term in an equation of flow in the i-direction, Fk is the source term in the k equation, and Fε is the source term in the ε equation. Cd is the coefficient of friction, a non-dimensional parameter to indicate the pressure loss in the flow over the tree establishment. LAD is the area density of the leaf, the total area of the leaves in the unit volume (m2/m3), η is the ratio of open green space coverage, a non-dimensional parameter to indicate the ratio of plant coverage on the ground.
- 2.
- Transfer of heat and moisture
Water bodies and vegetation are the major sources of heat and moisture transfer in the built environment. Plants as a porous medium for convective heat transfer and transpiration [63] and water as a static interface for convective heat transfer and evaporation [64] have radiative absorption, transmission, and reflection effects. The heat balance equation is as follows [65]:
where Rn is the absorbed radiant energy (W/m2), Hc is the sensible heat flux (W/m2), and He is the latent heat flux (W/m2). Rd is the surface long wave radiation (W/m2), Hg is the heat storage (W/m2), and Ts is the surface temperature (°C). Ta is the air temperature (°C), and L is the latent heat of evaporation (2500 kJ/kg).
Convection transfers part of the heat to the air as sensible heat, and evapotranspiration exchanges the other part of the heat for latent heat. The sensible heat flux is related to the temperature difference and Va. The latent heat flux is related to the water vapor partial pressure difference and Va, which are modeled in this study as a function of the convective heat transfer coefficient, CHTC (W m−2K−1) [66], and the evapotranspiration moisture flux rate, E (kg m−2s−1) [67], respectively, with the mean values from the related studies [8,61,68,69,70,71,72]. Surface temperatures were not measured by the equipment but by observing the near-surface air temperature as the initial surface temperature. These enable the simulation of heat and moisture transfer from the water body and vegetation canopy to the air.
- 3.
- High-resolution 3D model of the site and multi-nested computational domain
Through surveying and mapping, the case study area was modeled in three dimensions at a wall scale of 0.3 m resolution (Figure 4), with detailed references to reality in terms of the scale and materiality of landscape elements. The prerequisite for microclimate simulation is a detailed 3D model of the current built environment. In order to retain the effect of the surrounding city in the simulation, the Century Square of the research object is taken as the shape center. The surrounding 2.25 km2 range is taken as the modeling scope, and the east is to the Pudong Meteorological Bureau (Figure 5).
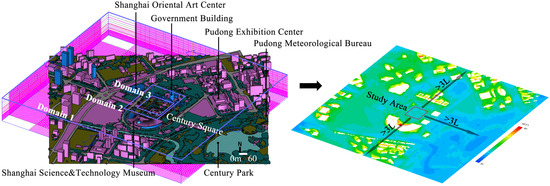
Figure 5.
Computational domains are imported for the 3D model file.
Since the outermost boundary of the computational domain of CFD adopts the wall function method, the distance from the study area to the wall boundary should be more than five heights or three lengths of the study object [73,74]. Based on the size of the computational domain and Century Square, a three-layer multi-block is used for grid delineation (Figure 5):
- The outermost domain 1 is 1650 m (x) × 1500 m (y) × 200 m (z), the standard length of the grid is 20 m, and the threshold length is 5 m;
- The middle domain 2 is 300 m (x) × 400 m (y) × 100 m (z), the standard length of the grid is 5 m, and the threshold length is 1 m;
- The innermost domain 3 is 200 m (x) × 200 m (y) × 60 m (z), the standard length of the grid is 3 m, and the threshold length is 0.3 m.
The mesh is generated by representative local encryption with a geometric transition ratio of 1 to 1.2 and a total grid count of 11,793,413.
- 4.
- Boundary condition and solver setting
The top and side thermal boundaries are solar radiation boundaries. The intensity of solar radiation and the solar direction are specified by the observational data library in the ASHRAE handbook (2013). This is determined by the geographic location of Century Square and the simulation time period, modified with measured data. Set the emissivity, absorption, reflectivity, and transmittance of buildings, ground, water, and vegetation to calculate the radiation configuration factor (View Factor) of blowing particles as radiation energy [75].
The flow boundary and initial condition are driven by the reference height wind velocity and direction, air temperature, ground surface temperature, relative humidity, and cloudiness coefficient data synchronized with the Pudong National Meteorological Basic Station. Century Square is within the logarithmic development area and the urban boundary layer, so the air temperature and humidity of inflow are set to the same value at height. The velocity is from the power-law boundary. The lateral wall boundaries of the domain were no-slip conditions; the top wall boundary is free-slip, whereas the power-law velocity was applied to the ground and building surfaces:
where Z0 is the ground elevation (m), ZB is the reference height (m), VB is the air velocity of flow at the reference height (m/s), V is the air velocity of flow at the Z-height (m/s), and the surface roughness parameter (n = 3.7).
In the multi-physics simulation of the diurnal microclimate on March 10 in winter and August 6 in summer 2018, the pressure–velocity coupling was implicitly solved using the SIMPLE (Semi-Implicit-Method for Pressure-Linked Equations) scheme [76]. The advection terms were discretized using quadratic upwind interpolation of the convective kinematics in a staggered grid system [77]. The convergence criteria of the inner iterations were the stabilized residual curve and the scaled residual values of 10−6 for k and ε and 10−4 for T [73], employed with a courant number of 0.9 and automatic calculation of the variable time step.
2.3. Spatial Differentiation of Thermal Comfort
Based on the microclimate simulation, we generated planar diagrams of the thermal comfort indices, specifically the wet-bulb globe temperature (WBGT) and new standard effective temperature (SET*). These diagrams of microclimate perception illustrate how different landscape types impact the spatial distribution of thermal comfort within the square from the standpoint of thermal comfort zone collection.
2.3.1. Thermal Comfort Index
WBGT is an important implication for human health [78], an empirical index selected by ACGIH (American Conference of Governmental Industrial Hygienists) for assessing thermal stress, and has been certified by the ISO 7243 standard system [79,80,81,82]. This is widely used in the estimation of thermal environments for outdoor physical activities. WBGT is calculated by the four environmental elements [80,83]: Va, RH, Ta, and SR. Evaluation of outdoor thermal perception by WBGT and SET* was found to be appropriate [84].
SET* is a thermal comfort index enrolled in the ASHRAE standard [56,85], which is widely used for the metabolic level of human activity around 1 Met [19,86]. SET* is calculated from the previously simulated Va, RH, Ta, and sMRT (spatial Mean Radiation Temperature. In addition, it requires the atmospheric pressure measured at the meteorological station and the human status data (clothing thermal resistance of 0.5 clo in summer and 1.0 clo in winter, metabolic rate of 1.2 Met, height of 167 cm, and weight of 55 kg) [87].
2.3.2. Planar Diagram
Knowledge of thermal comfort needs to be spatialized, discretized, and geometrized if it is to truly intervene as a driver for material design, form optimization, and morphogenesis [4]. For instance, subjective and cognitive maps intervene in thermal perception to create planar patterns [88]. Networked, densely arranged weather stations provide Kriging-interpolated point data. However, the arithmetic capacity of thermal comfort simulation exceeds the number of realistic measurement points, allowing for a diagrammatic interpretation of the data. Some studies have visualized the collection of fields that reach the wind comfort range as the “wind comfort area” by simulation [10,45].
This study utilizes the geometric scale of the relative comfort area as the thermal perception assessment criteria to identify the better spatial type in the current design of Century Square [86].
2.4. Reconstruction of Square Landscape Spatial Design
2.4.1. Abstraction of Configuration Type and Geometry of Orientation Form
Based on the abstraction of the identified Century Square spatial types, prototypes are designed through the paradigm of RtD. Geometric variables are controlled for quantitative comparison of the thermal comfort of different forms.
The idealized present design is used as a base for element simplification and reconfiguration of landscape spatial types, leading to five types of square modes: (1) OP4, the existing Century Square design, with four openings in the enclosure structure (ECS), one at the midpoint of each side. (2) OP3, an ECS with three openings, eliminates the opening in the direction of the prevailing winter wind. (3) OP1, with one opening in the ECS, retaining only the opening facing the windward direction of the dominant summer wind. (4) HEC, a semi-enclosure structure facing the winter and summer wind directions. (5) HEP, retaining only the plantation oriented to the prevailing winter and summer wind.
For each type of spatial configuration, it is emphasized to establish three boundary inflow wind directions (SE/SSE/S in summer and NW/NNW/N in winter) to generate different geometry angles between spatial orientation and wind direction (11.7°, 34.2°, and 56.7°). This means that it corresponds to a univariate simplified performance test of three urban square design prototypes with different forms in summer (S1/S2/S3) and winter (W1/W2/W3) (Figure 6).
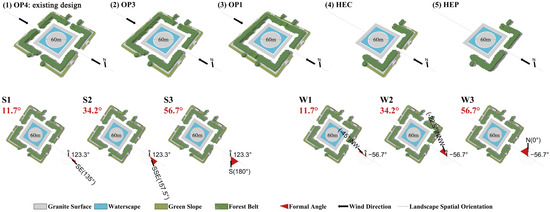
Figure 6.
Five configuration types and three orientations form prototypes.
The computational domain of the simulation for the abstracted reconstruction is 3400 m (x) × 2200 m (y) × 200 m (z). The boundary conditions and other microclimate settings are the same as those in the previous simulation of the built environment simulation, except that the target time period is fixed at 16:30.
2.4.2. Grid-Independence Verification
CFD numerical simulations suffer from mesh discretization errors that characterize the error between the converged solution of the adopted grid scheme and the precise solution of the equations. The grid convergence verification is undertaken with the scenarios of progressive grid encryption. The schematic settings of the verification cases, including the total number of computational meshes and the threshold grid size, are given in Table 1.

Table 1.
Case scenarios for grid sensitivity verification.
Figure 7 shows that the air velocity error area of each scenario, particularly in the case of the extremely dense grids denoted as W1−0.3, decreases from 6.544% and 5.248% to 1.231% with the increase in the grid number. This trend indicates that the effect of continuing to encrypt the grid on the error has entered the stabilization interval of the convergence curve. Therefore, the mesh scheme W1 belongs to the convergence-independent solution, which can take into account both computational economy and grid discretization error control.
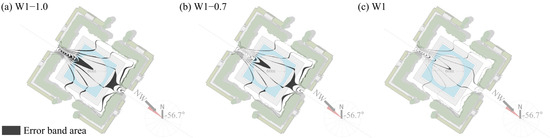
Figure 7.
W1−1.0, W1−7.0, W1, respectively, and W1−0.3 in the area of wind velocity error differences.
3. Results
This section may be divided by subheadings. It should provide a concise and precise description of the experimental results, their interpretation, and the experimental conclusions that can be drawn.
3.1. Spatial and Temporal Validation of an Environmental Model
The error analysis between the measured and simulated data of Va, RH, and Ta at the nine observation points showed an overall mean absolute percentage error (MAPE) of 3.9%, a correlation coefficient of 0.89, and a determination coefficient (R2) of 0.79 (Figure 8). The root-mean-squared error (RMSE) for Va was 0.25 m/s. For RH, it was 2.6%, and for Ta, it was 0.65 °C. The errors were within a normal range, validating the effectiveness of the microclimate environmental simulation.
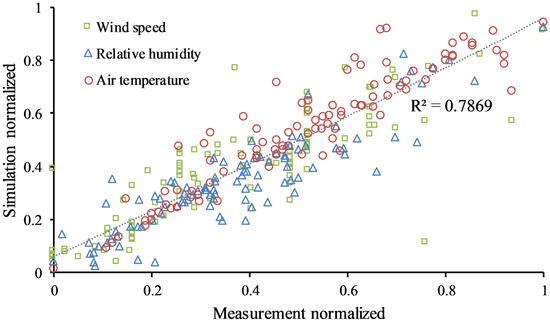
Figure 8.
Comparison between normalized measurement and simulation.
Table 2 verifies that, in Shanghai, microclimate perception is affected by a combination of several meteorological parameters and cannot be studied for a single parameter. Moreover, the demand for outdoor thermal comfort and meteorological parameters in summer is opposite to that in winter [20]. In summer, Ta and SR need to be lowered and Va raised, while Ta and SR need to be raised and Va lowered in winter.
Table 2.
Correlation analysis for thermal response votes.
Averaged TCV (Figure 9) reveals that the diurnal variation in winter is a convex curve, with people preferring the sunny, warmer midday hours. In contrast, in summer, it is the opposite concave curve, with people feeling more comfortable with lower morning and evening temperatures and solar radiation. Notably, the most comfortable hours of the winter are the least comfortable in the summer. However, 16:30 in both winter and summer is the time of the thermal comfort transition. In winter, 17:30 is the worst time for daytime microclimate, and 16:30 is the deterioration phase. In summer, 17:30 is the best time for daytime thermal comfort, and 16:30 is the improvement phase.
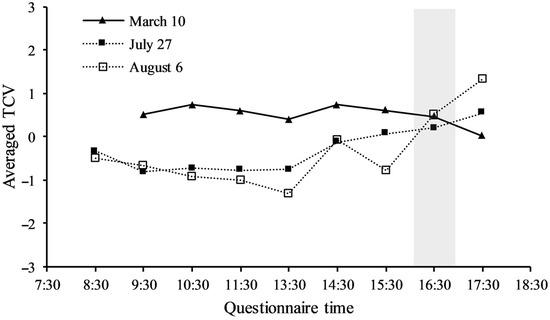
Figure 9.
Trends in diurnal averaged TCV over time.
Optimization of thermal comfort in the 16:30 h elongates the outdoor thermal comfort time in both winter and summer. Considering the time when people are out and about, the landscape design should prioritize 16:30 as the target time to improve the thermal comfort of the site. This program aims to efficiently achieve a faster improvement of the microclimate perception in summer and a slower deterioration in winter.
The simulation plots for 1.5 m pedestrian height reproduce the regular trend of Ta, SR, and RH over time (Figure 10 and Figure 11). In contrast, the wind direction varies between E and SE on the experimental day in summer, and Va is influenced by the local area and does not correlate with the time. The temporal aspect of the thermal comfort simulation is consistent with the trend of the TCV.
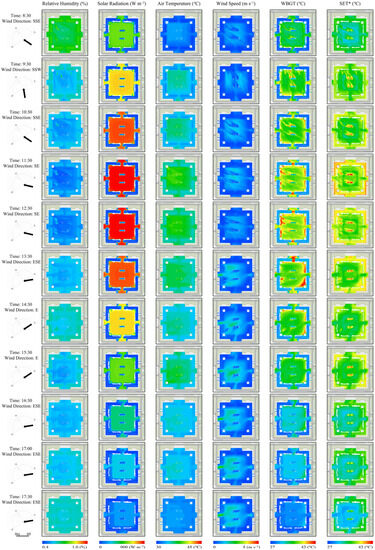
Figure 10.
Diagram of summer daytime microclimate physical environment and thermal comfort simulation.
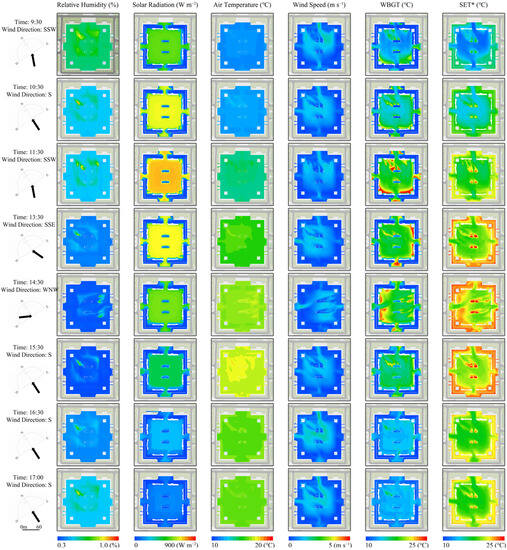
Figure 11.
Diagram of winter daytime microclimate physical environment and thermal comfort simulation.
3.2. Identification of Spatial Types That Improve Thermal Comfort
3.2.1. Summer
In summer, the opening of enclosure structure (ECS) is the type identified, better superior to the windward area of ECS than the leeward area. Thermal comfort is better when the opening of the ECS is oriented at an angle that coincides with the direction of the wind. It is very important to divert the wind into the square. The water landscape has a significant effect on the improvement of thermal comfort in the surrounding space, especially downwind. However, a constant increase in relative humidity may also have a negative effect. The space under the trees inside the enclosure improves the microclimate by substantially reducing solar radiation. Still, it does not affect at all the core area of the square’s central ground.
Specifically indicated by the qualitative interpretation of Figure 10:
- The wind direction is SSE at 8:30, but it is a quiet wind environment. The square is comfortable in the morning, with better thermal comfort in the space around the water body;
- At 9:30, the wind direction is SSW; better thermal comfort for SW–NE openings than NW–SE openings; poorer thermal comfort for the zone at the southwest edge of the square as a leeward area of the enclosing structure;
- The wind direction at 10:30 is SSE, the NW–SE openings are better than the SW–NE openings, and the spatial thermal comfort on the north side of the square is better than that on the SE side;
- At 11:30 and 12:30, the wind direction is SE; the overall microclimate reaches the extreme daytime heat state, in which the thermal comfort of the southeast opening is relatively better, the southeast side and northwest side of the plaza are both worse, and the northwest side is high in humidity due to the moisture accumulation, although it serves as the windward area;
- At 13:30, the wind direction is ESE, the thermal comfort of the space on the northwest side as the windward area is better than that on the southeast side, the NW–SE openings are oriented at an angle more parallel to the wind direction, which is the better spatial type, while the NE opening is the very uncomfortable type, and the overall thermal comfort of the square starts to improve;
- The wind direction is E at 14:30 and 15:30; the west side space has better thermal comfort than the east side, which is the leeward area; and the four sides of the openings are oriented at a similar angle to the wind direction and produce similar thermal comfort;
- At 16:30 and 17:00, the wind direction is ESE, and the thermal comfort of the square on the northwest side is better than the space on the southeast side as a leeward area, and the NE–SE opening is the best type now;
- With wind direction ESE at 17:30, the square as a whole has reached the most comfortable state during the summer daytime, and the northwest opening and the space northwest of the water body are the best types.
In summer, the opening of ECS is the type identified, better superior to the windward area of ECS than the leeward area. Thermal comfort is better when the opening of the ECS is oriented at an angle that coincides with the direction of the wind. It is also very important to divert wind into the square. The water landscape has a significant effect on the improvement of thermal comfort in the surrounding space, especially downwind, but a constant increase in relative humidity may also have a negative effect. The space under the trees inside the enclosure improves the microclimate by substantially reducing solar radiation. Still, it does not affect at all the core area of the square’s central ground.
3.2.2. Winter
In winter, the shaded space with evergreen trees is the least comfortable type, and the effect of water bodies on thermal comfort is not significant. Enclosure structure (ECS) acts as protection as a vertically confining element, and their leeward area is identified as relatively optimized, with better thermal comfort than windward areas and openings. The ECS provides better thermal comfort when oriented in the same direction as the wind. The Century Square design avoids shading of SR on the center ground, but wind-oriented openings in the enclosure should also be eliminated to provide better wind protection.
It can be identified from Figure 11:
- At 9:30, the wind direction is SSW, the thermal comfort is better in the leeward area of the ECS and the subway entrance building in the center, and the SW–NE openings are the worst;
- At 10:30, the wind direction is S. The south side of the square has better thermal comfort as the leeward area of the ECS, and the northeast opening is the least comfortable space, followed by the northwest and southwest openings;
- At 11:30, the wind direction is SSW, the relative thermal comfort area is also distributed in the leeward zone on the southwest side of the square, and the SW–NE openings are the worse spatial types for thermal comfort;
- The wind direction at 13:30 is SSE, the southeast side serves as the leeward area of the ECS, the thermal comfort is high in the southeast space and low in the northwest, and the northwest opening is the worst type;
- At 14:30, the wind direction is WNW, the NW–SE openings are the worst, and the overall thermal comfort of the square is high in the northwest and low in the southeast. The space on the northeast side of the square serves as a leeward area for ECS, which enhances thermal comfort;
- At 15:30, the wind direction is S. Thermal comfort is high in the south and low in the north. All four openings are worse, especially the northeast opening;
- Wind direction is S at 16:30; the space on the south side of the square towards nightfall becomes a leeward protection zone and is a relatively better type; thermal comfort is higher in the south and lower in the north but has become worse overall, with SW–NE openings and NW opening being worse;
- At 17:00, the wind direction is S. The square as a whole reaches the most uncomfortable state of the winter daytime, and the day ends. With the SSE/S wind direction, the square is affected by the huge shape of the Shanghai Science and Technology Museum, and the thermal comfort reduction effect of the SE opening is blurred.
However, influenced by the local complexity of the built environment in the reproducibility simulation, the different angles between the spatial orientation form and the wind direction have not been clearly quantified and compared with respect to the thermal comfort performance of the square, especially in the core zone (the circular ground in the center), in winter and summer.
3.3. Optimization of Geometric Forms for Thermal Comfort Performance
As mentioned earlier, the circular ground in the center is the core program of Century Square, which is the target zone for thermal comfort optimization in this study. Numerical simulations of the form prototypes with different orientations at the target time period of 16:30 in summer (S1—11.7°, S2—34.2°, S3—56.7°) and winter (W1—11.7°, W2—34.2°, W3—56.7°) were converted to WBGT and SET* plane distributions at 1.5 m pedestrian height. The relative thermal comfort area (RTCA) within the target zone was used as a performance criterion.
3.3.1. Summer
In summer, the cooler regions below 31 °C for WBGT and SET* were counted as relative thermal comfort areas [79,86,87,89]. For all five configuration types, it was the S1 prototype with the smallest angle between form orientation and wind direction that had the largest RTCA and the best thermal comfort in the target zone (Figure 12 and Figure 13).
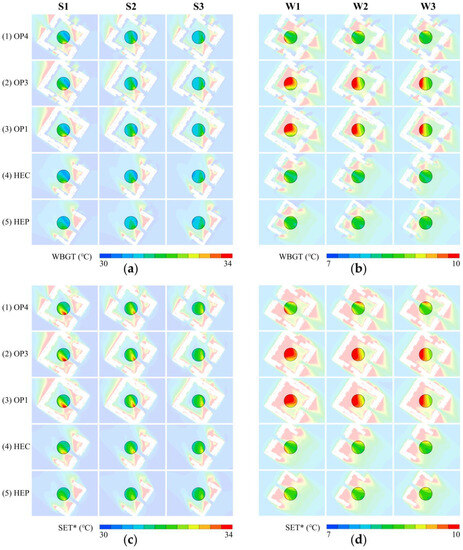
Figure 12.
Diagram distribution of 1.5 m thermal comfort index for various landscape configuration types and orientation forms emphasizing the target zone: (a) WBGT in summer; (b) WBGT in winter; (c) SET* in summer; and (d) SET* in winter.
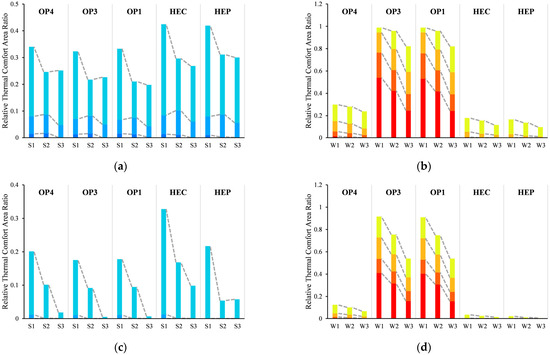
Figure 13.
Ratio of relative thermal comfort area for the center ground of the form prototypes with varying geometric angles to the wind direction: (a) WBGT in summer; (b) WBGT in winter; (c) SET* in summer; and (d) SET* in winter.
The spatial configuration type of HEC, with the best thermal comfort in summer, was superior to OP4, OP3, and OP1. However, the differences between OP4, OP3, and OP1 were not considerable, suggesting that the landscape form should be designed with more permeable verticals in the windward direction in summer. The comparison between HEC and HEP suggests that the more compact ECS with forest belt and topographic building together produces better thermal comfort improvement from its opening compared to vegetation alone.
3.3.2. Winter
In winter, the warmer regions above 9 °C in WBGT and SET* were regarded as the relative thermal comfort area. With five spatial configuration types, the RTCA of the center ground decreases gradually as the angle between the form orientation and the wind direction changes from minor to major. The prototype with the smallest angle, W1, has the best thermal comfort (Figure 12 and Figure 13).
OP4 performs better than HEC and HEP, demonstrating that more spatial enclosure of the target zone in directions except the windward direction enhances thermal comfort in winter. OP3 and OP1 have the best thermal comfort in the winter, and the difference between them is quite slight. Both of them are much better than OP4, which verifies that in winter, the vertical ECS of the landscape should not be designed with an opening in the windward direction in order to facilitate the ECS and give the target zone a protection enhancement.
Meanwhile, OP3–S1W1 is a more appropriate design prototype for Century Plaza optimization if the thermal comfort improvement in both winter and summer is taken into account.
4. Discussion
Current research on urban squares has demonstrated that landscape design and construction are essential measures for achieving a comfortable and healthy outdoor microclimate and has concluded that patterns of certain configuration types or choices of particular materials are preferable strategies [27,32,33,90]. However, there is a lack of design guidelines for the operation of geometry [20,88].
4.1. Screening Types from Spatial Heterogeneity
In this study, a verified high-resolution simulation of the current built environment was conducted to reproduce the microclimate spatial efficiency of multiple landscape design elements such as plant canopy, water body, and building in winter and summer. Additionally, the spatial type was identified based on daytime multi-physics fields and thermal comfort planar diagrams:
Century Square is composed of a variety of spatial types, of which the opening of the square ECS is the recommended type in summer. The ECS serves as the vertical definition of the square space, and its windward opening produces an accelerating effect that draws wind into the square [48,91]. On the other hand, in winter, the square ECS acts as a vertical enclosure for wind protection, and its leeward area is the proposed spatial type and should adhere to an ECS with no openings on the windward face [34].
Consistent with related studies, waterscapes have an improving effect on downwind thermal comfort in summer, but increasing humidity can also lead to a negative effect [9]. In winter, its effect on thermal comfort is not apparent.
Shaded space inside the ECS in summer is indeed the best type of thermal comfort [17,30]. However, it is completely unable to affect the core and target zones of the square (the center ground). Space under evergreen trees in winter, on the other hand, is less thermally comfortable due to the absence of solar radiation [55].
4.2. Design Matters: Geometric Form Operation beyond Categorical Typology
Identifying the screened space types, five configurations of enclosure structures (ECS) and three prototypes of forms with different orientation angles were reconfigured, with 16:30 as the target time period. The test revealed that:
In summer, for any of the types, it is the form with the smallest angle between the spatial orientation and the prevailing wind direction that has the largest RTCA of the target zone, which is in agreement with the studies related to the design of building façade opening [22,23,76]. In winter, it is also the form that the smaller the prevailing wind direction, the larger the RTCA of the target zone [91] and the better the thermal comfort. In addition, it is suggested that the ECS on the northwest side of the square, which is facing the NW of the winter prevailing winds, eliminate the opening as an optimized design [34].
The current spatial orientation of Century Square is designed in a form that is almost parallel to the prevailing wind direction (SE), which improves thermal comfort compared to traditional south–north-oriented urban squares [11]. This provides an alternative explanation for Century Square and Century Avenue in Pudong, an extremely important urban axis in China.
4.3. Limitations of the Present Study
Microclimate CFD simulation is not a completely black-box automated process, which requires the assimilation of many environmentally measured indicators in addition to boundary conditions. The Cd, CHTC, and evapotranspiration rate E of water and vegetation are variables influenced by Ta, Rh, SR, Va, and material properties [63,92], which are separate basic science topics. In this study, only a diurnal mean value could be taken based on related studies [93,94]. The study area subsurface was a totally hard material and did not address moisture and heat features of the lawn; the canopy 3D modeling used cylinders that could be modified for finer detail in association with LiDAR [62,69,95]. These will be further investigated in the future.
RtD is a suitable paradigm for practical disciplines [37,40]. Thermal comfort and multi-physics microclimate simulations and diagrams as design tools still need to be explained and refined. This includes elaborating on the spatial function of diagrams from the perspective of design disciplines, adding dimensions and parameters to form design, and reshaping the workflow of planners and designers. However, this study designed a handful of varying orientation angles for testing. It provides an optimization approach for climate-sensitive squares beyond shading [17,30]. This will be used for much more morphogenesis and the form optimization of geometry prototypes with more morphological parameters, such as heights, radians, and distances.
5. Conclusions
The multi-physics microclimate simulation of multiple landscape design elements in winter and summer is utilized for the thermal comfort performance of different configuration types and form designs. The main conclusions are emphasized as follows:
(1) The field investigation of Century Square verified the validity of the numerical simulations. The thermal comfort index simulation is compatible with the trend of the on-site questionnaire. The most comfortable time period in winter is opposite that in summer, but 16:30 in both winter and summer is the time of daytime thermal comfort transition. Landscape design should prioritize 16:30 as the target time period.
(2) In the summer, it was identified that the opening space of the enclosure structure (ECS) has better thermal comfort and is the type screened for Century Square, which makes inducing wind entry effective. Additionally, it was revealed that the shadow inside the ECS can significantly improve the microclimate of the space under trees but that it does not work at all in the center ground, which is the target area of the square. In winter, the leeward area of square ECS is the better type, and windward openings should be eliminated.
(3) A comparison of the relative thermal comfort area within the target zone confirms that the form with the smallest angle between the spatial orientation and the prevailing wind direction is the most thermally comfortable in the summer in any landscape configuration. The geometry with the smaller angle is also better in the winter. That is, the spatial form should be designed to be more parallel to the prevailing wind direction. Ultimately, an optimized Century Square prototype is proposed, taking into account both winter and summer thermal comfort.
Supplementary Materials
The following supporting information can be downloaded at https://www.mdpi.com/article/10.3390/atmos14091357/s1, Table S1: Parameter Information of the Watchdog 2000 Portable Weather Station; Table S2: Thermal comfort questionnaire; Table S3: Nomenclature of abbreviations.
Author Contributions
Conceptualization, C.M. and B.L.; methodology, C.M.; software, C.M. and Y.C.; validation, C.M. and Y.C.; formal analysis, B.L.; investigation, C.M.; resources, B.L.; data curation, C.M., Y.C. and W.G.; writing—original draft preparation, C.M.; writing—review and editing, C.M., Y.C. and W.G.; visualization, C.M. and Y.C.; supervision, B.L.; project administration, B.L.; funding acquisition, B.L. All authors have read and agreed to the published version of the manuscript.
Funding
This research was funded by the Shanghai Landscaping and City Appearance Administrative Bureau (Grant No. G239912). This research was also funded by the National Natural Science Foundation of China (Grant No. 51338007 and Grant No. 52130804).
Institutional Review Board Statement
This study was conducted in accordance with the Declaration of Helsinki and approved by the Ethics Committee of Tongji University (protocol code 2019tjdx283).
Informed Consent Statement
Informed consent was obtained from all subjects involved in this study.
Data Availability Statement
Not applicable.
Acknowledgments
The authors would like to acknowledge the administrative support of the Pudong Meteorological Bureau. The authors would also like to thank Mohammed Elsadek and Zefeng Lian for their kind help during the experiment.
Conflicts of Interest
The authors declare no conflict of interest.
References
- Zhang, J.; Ren, G.; You, Q. Detection and projection of climatic comfort changes in China’s mainland in a warming world. Adv. Clim. Chang. Res. 2022, 13, 507–516. [Google Scholar]
- Gaubatz, P. New china square: Chinese public space in developmental, environmental and social contexts. J. Urban Aff. 2021, 43, 1235–1262. [Google Scholar] [CrossRef]
- Cai, Y.J. Sociology connotation of traditional european urban square: Two different spatial forms. Time + Achitecture 2002, 4, 38–41. (In Chinese) [Google Scholar]
- Toparlar, Y.; Blocken, B.; Maiheu, B.; van Heijst, G.J.F. A review on the CFD analysis of urban microclimate. Renew. Sustain. Energy Rev. 2017, 80, 1613–1640. [Google Scholar]
- Liu, B.; Alayi·abuduaili; Xing, K.; Zhang, L. On the theory and method of the optimization of human settlement features in china’s territorial space. Chin. Landsc. Archit. 2022, 38, 6–14. [Google Scholar]
- Yu, T.; Leng, H.; Yuan, Q. Planning responses of urban-rural green space system for public health risks. Chin. Landsc. Archit. 2021, 37, 59–64. [Google Scholar] [CrossRef]
- Toparlar, Y.; Blocken, B.; Vos, P.; van Heijst, G.J.F.; Janssen, W.D.; van Hooff, T.; Montazeri, H.; Timmermans, H.J.P. CFD simulation and validation of urban microclimate: A case study for bergpolder zuid, rotterdam. Build. Environ. 2015, 83, 79–90. [Google Scholar]
- Yang, L.; Liu, X.; Qian, F. Research on water thermal effect on surrounding environment in summer. Energy Build. 2020, 207, 109613. [Google Scholar] [CrossRef]
- Ampatzidis, P.; Kershaw, T. A review of the impact of blue space on the urban microclimate. Sci. Total Environ. 2020, 730, 139068. [Google Scholar]
- Tsichritzis, L.; Nikolopoulou, M. The effect of building height and façade area ratio on pedestrian wind comfort of London. J. Wind Eng. Ind. Aerod. 2019, 191, 63–75. [Google Scholar]
- Tan, Z.; Lau, K.K.; Ng, E. Urban tree design approaches for mitigating daytime urban heat island effects in a high-density urban environment. Energy Build. 2016, 114, 265–274. [Google Scholar] [CrossRef]
- Zhong, J.; Liu, J.; Xu, Y.; Liang, G. Pedestrian-level gust wind flow and comfort around a building array—influencing assessment on the pocket park. Sustain. Cities Soc. 2022, 83, 103953. [Google Scholar] [CrossRef]
- Liu, Z.; Zheng, S.; Zhao, L. Evaluation of the envi-met vegetation model of four common tree species in a subtropical hot-humid area. Atmosphere 2018, 9, 198. [Google Scholar] [CrossRef]
- Blocken, B. Computational fluid dynamics for urban physics: Importance, scales, possibilities, limitations and ten tips and tricks towards accurate and reliable simulations. Build. Environ. 2015, 91, 219–245. [Google Scholar] [CrossRef]
- Zhang, J.; Zhao, L.H.; Lu, X.H. Measurement and Simulation of Thermal Environment of Commercial Pedestrian Street in Hot and Humid Areas. J. Build. Energy Effic. 2020, 48, 101–106. (In Chinese) [Google Scholar]
- Liu, Z.; Zheng, S.; Fang, X.; Lu, X.; Zhao, L. Simulating validation of ENVI-met vegetation model to Ficus microcarpa in hot-humid region of subtropical zone. J. Beijing For. Univ. 2018, 40, 1–12. [Google Scholar]
- Sanusi, R.; Johnstone, D.; May, P.; Livesley, S.J. Street orientation and side of the street greatly influence the microclimatic benefits street trees can provide in summer. J. Environ. Qual. 2016, 45, 167–174. [Google Scholar] [CrossRef]
- Li, J.; Liu, J.; Srebric, J.; Hu, Y.; Liu, M.; Su, L.; Wang, S. The effect of tree-planting patterns on the microclimate within a courtyard. Sustainability 2019, 11, 1665. [Google Scholar] [CrossRef]
- Xiong, Y.; Zhang, J.; Xu, X.; Yan, Y.; Sun, S.; Liu, S. Strategies for improving the microclimate and thermal comfort of a classical chinese garden in the hot-summer and cold-winter zone. Energy Build. 2020, 215, 109914. [Google Scholar] [CrossRef]
- Jamei, E.; Rajagopalan, P.; Seyedmahmoudian, M.; Jamei, Y. Review on the impact of urban geometry and pedestrian level greening on outdoor thermal comfort. Renew. Sustain. Energy Rev. 2016, 54, 1002–1017. [Google Scholar] [CrossRef]
- Makvandi, M.; Li, W.; Ou, X.; Chai, H.; Khodabakhshi, Z.; Fu, J.; Yuan, P.F.; Horimbere, E.D.L.J. Urban heat mitigation towards climate change adaptation: An eco-sustainable design strategy to improve environmental performance under rapid urbanization. Atmosphere 2023, 14, 638. [Google Scholar] [CrossRef]
- Han, Q.; Nan, X.; Wang, H.; Hu, Y.; Bao, Z.; Yan, H. Optimizing the surrounding building configuration to improve the cooling ability of urban parks on surrounding neighborhoods. Atmosphere 2023, 14, 914. [Google Scholar] [CrossRef]
- Yan, B.; Wei, M.; Yan, Q.; Cheng, Y.; Shu, Z.; Li, Q.; Zhou, X. Study on effects of tall building shape and layout on pedestrian-level wind environment in the urban area. J. Hunan Univ. Nat. Sci. 2021, 48, 61–71. [Google Scholar]
- He, M.; Li, L. Form follows environmental energy: Ecological heat in contemporary vernacular architecture. E3S Web Conf. 2019, 101, 2003. [Google Scholar] [CrossRef]
- Yuan, F.; Yan, C. The “new materialism” yingzao from diagrammatic thinking to digital fabrication. Time + Achitecture 2016, 5, 6–13. (In Chinese) [Google Scholar]
- Antoine, P.; Zhou, M. Architectural diagramming, from abstraction to materiality. Time + Achitecture 2016, 5, 14–21. (In Chinese) [Google Scholar]
- Linxue, L.I.; Simin, T. Towards thermodynamic architecture: Research on systems-based design oriented by renewable energy. IOP Conf. Ser. Earth Environ. Sci. 2018, 146, 12060. [Google Scholar] [CrossRef]
- Eisenman, P. Diagram: An Original Scene of Writing; Garcia, M., Ed.; Wiley: London, UK, 2010; p. 28. [Google Scholar]
- Stan, A. Diagram Matters; ANY—Architecture New York: New York, NY, USA, 1998; pp. 16–19. [Google Scholar]
- Liu, B.; Lian, Z.; Brown, R.D. Effect of landscape microclimates on thermal comfort and physiological wellbeing. Sustainability 2019, 11, 5387. [Google Scholar] [CrossRef]
- Liu, S.; Zhao, J.; Xu, M.; Ahmadian, E. Effects of landscape patterns on the summer microclimate and human comfort in urban squares in China. Sustain. Cities Soc. 2021, 73, 103099. [Google Scholar] [CrossRef]
- Lai, Y.; Ning, Q.; Ge, X.; Fan, S. Thermal regulation of coastal urban forest based on ENVI-met model—A case study in Qinhuangdao, China. Sustainability 2022, 14, 7337. [Google Scholar] [CrossRef]
- He, J.; Hoyano, A. Measurement and evaluation of the summer microclimate in the semi-enclosed space under a membrane structure. Build. Environ. 2010, 45, 230–242. [Google Scholar] [CrossRef]
- Wang, Q.; Li, M.; Li, X. Research on landscape design of fitness facilities in community park based on human comfort in microclimate. Chin. Landsc. Archit. 2021, 37, 68–73. [Google Scholar]
- You, W.; Qin, M.; Ding, W. Integrated simulation technology for energy-efficient building’s facade opening design. J. Southeast Univ. Nat. Sci. Ed. 2015, 45, 196–202. [Google Scholar]
- Diz-Mellado, E.; Nikolopoulou, M.; López-Cabeza, V.P.; Rivera-Gómez, C.; Galán-Marín, C. Cross-evaluation of thermal comfort in semi-outdoor spaces according to geometry in southern Spain. Urban Clim. 2023, 49, 101491. [Google Scholar] [CrossRef]
- Sanda, L.; Robert, D.B. Post-positivist microclimatic urban design research: A review. Landsc. Urban Plan. 2016, 153, 111–121. [Google Scholar]
- Xu, X.; Wu, Y.; Wang, W.; Hong, T.; Xu, N. Performance-driven optimization of urban open space configuration in the cold-winter and hot-summer region of China. Build. Simul. China 2019, 12, 411–424. [Google Scholar] [CrossRef]
- Calcerano, F.; Martinelli, L. Numerical optimisation through dynamic simulation of the position of trees around a stand-alone building to reduce cooling energy consumption. Energy Build. 2016, 112, 234–243. [Google Scholar] [CrossRef]
- Lenzholzer, S. Research and design for thermal comfort in Dutch urban squares. Resour. Conserv. Recycl. 2012, 64, 39–48. [Google Scholar] [CrossRef]
- Lin, J.; Chuah, Y.K. A study on the potential of natural ventilation and cooling for large spaces in subtropical climatic regions. Build. Environ. 2011, 46, 89–97. [Google Scholar] [CrossRef]
- Mohammadi, M.; Tien, P.W.; Calautit, J.K. Numerical evaluation of the use of vegetation as a shelterbelt for enhancing the wind and thermal comfort in peripheral and lateral-type skygardens in highrise buildings. Build. Simul. China 2023, 16, 243–261. [Google Scholar] [CrossRef]
- Brandão De Vasconcelos, A.; Cabaço, A.; Pinheiro, M.D.; Manso, A. The impact of building orientation and discount rates on a Portuguese reference building refurbishment decision. Energy Policy 2016, 91, 329–340. [Google Scholar] [CrossRef]
- Ma, Y.; Deng, W.; Xie, J.; Heath, T.; Xiang, Y.; Hong, Y. Generating prototypical residential building geometry models using a new hybrid approach. Build. Simul. China 2022, 15, 17–28. [Google Scholar] [CrossRef]
- Zhang, X.; Weerasuriya, A.U.; Zhang, X.; Tse, K.T.; Lu, B.; Li, C.Y.; Liu, C. Pedestrian wind comfort near a super-tall building with various configurations in an urban-like setting. Build. Simul. China 2020, 13, 1385–1408. [Google Scholar] [CrossRef] [PubMed]
- CHN GB50176-2016; Code for Thermal Design of Civil Building. China Planning Press: Beijing, China, 2016.
- JGJ/T 449-2018; Standard for Green Performance Calculation of Civil Buildings. China Architecture & Building Press: Beijing, China, 2018.
- Stocco, S.; Cantón, M.A.; Correa, E. Evaluation of design schemes for urban squares in arid climate cities, Mendoza, Argentina. Build. Simul. China 2021, 14, 763–777. [Google Scholar] [CrossRef]
- Cai, Y.J.; Jiang, J.Y. Hidden figure: Jiugong pattern in Chinese contemporary urban square. Urban Des. 2017, 4, 54–61. (In Chinese) [Google Scholar]
- Norell, D. Geometries with agency: Mathematics of form revisited. Archit. Res. Q. 2021, 25, 255–265. [Google Scholar] [CrossRef]
- Hildner, J.R. Remembering the mathematics of the ideal villa. J. Archit. Educ. 1999, 52, 143–162. [Google Scholar] [CrossRef]
- Favarolo, P.A.; Manz, H. Temperature-driven single-sided ventilation through a large rectangular opening. Build. Environ. 2005, 40, 689–699. [Google Scholar] [CrossRef]
- Paul, Z. Town and Square: From the Agora to the Village Green. Art J. 1960, 2, 118. [Google Scholar]
- Lian, Z.; Liu, B.; Brown, R.D. Exploring the suitable assessment method and best performance of human energy budget models for outdoor thermal comfort in hot and humid climate area. Sustain. Cities Soc. 2020, 63, 102423. [Google Scholar] [CrossRef]
- Wei, D.; Lian, Z.; Liu, B. A field study of outdoor human thermal perception in three seasons in shanghai, China. Buildings 2022, 12, 1453. [Google Scholar] [CrossRef]
- American Society of Heating, Refrigerating and Air-Conditioning Engineers, Inc. Thermal Environmental Conditions for Human Occupancy (ASHRAE Standard 55); Ashrae: Atlanta, GA, USA, 2010. [Google Scholar]
- Miao, M.; Lu, H.; Cheng, M. Body surface temperature change and subjective thermal sensation assessment before and after exercise. J. Text. Res. 2018, 39, 116–122. [Google Scholar]
- Yamada, T. A numerical model study of turbulent airflow in and above a forest canopy. J. Meteorol. Soc. Jpn. 1982, 60, 439–454. [Google Scholar] [CrossRef]
- Kamiyama, K.; Ohashi, M.; Narita, K. Wind tunnel experiments on drag coefficient of trees with the leaf area density as a reference area. J. Environ. Eng. 2004, 69, 71–77. [Google Scholar] [CrossRef]
- Mochida, A.; Tabata, Y.; Iwata, T.; Yoshino, H. Examining tree canopy models for CFD prediction of wind environment at pedestrian level. J. Wind Eng. Ind. Aerod. 2008, 96, 1667–1677. [Google Scholar] [CrossRef]
- Yin, Y.; Chen, Q.; Zhao, R.; Sun, M.; Chen, L.; Li, F.; Yu, X. Transpiration characteristics and temperature&humidity benefits of common greening tree species in Beijing. J. Northwest For. Univ. 2021, 36, 31–36, 76. [Google Scholar]
- Liang, L.; Xiaofeng, L.; Borong, L.; Yingxin, Z. Improved k-ε two-equation turbulence model for canopy flow. Atmos. Environ. 2006, 40, 762–770. [Google Scholar] [CrossRef]
- Asawa, T.; Fujiwara, K. Estimation of sensible and latent heat fluxes of an isolated tree in Japanese summer. Bound. Lay. Meteorol. 2020, 175, 417–440. [Google Scholar] [CrossRef]
- Song, X.; Liu, J.; Zhao, Y. Influence of district morphology on the thermal environment in waterfront areas in the north. Build. Sci. 2019, 35, 191–198. [Google Scholar]
- Lin, B.; Li, X.; Zhu, Y.; Qin, Y. Numerical simulation studies of the different vegetation patterns’ effects on outdoor pedestrian thermal comfort. J. Wind Eng. Ind. Aerod. 2008, 96, 1707–1718. [Google Scholar] [CrossRef]
- Asawa, T.; Fujiwara, K.; Hoyano, A.; Shimizu, K. Convective heat transfer coefficient of crown of zelkova serrata. J. Environ. Eng. 2016, 81, 235–245. [Google Scholar] [CrossRef]
- Morille, B.; Migeon, C.; Bournet, P.E. Is the penman—Monteith model adapted to predict crop transpiration under greenhouse conditions? Application to a new guinea impatiens crop. Sci. Hortic. Amst. 2013, 152, 80–91. [Google Scholar] [CrossRef]
- Dimoudi, A.; Marialena, N. Vegetation in the urban environment: Microclimatic analysis and benefits. Energy Build. 2003, 35, 69–76. [Google Scholar] [CrossRef]
- Qin, B.; Xu, X.; Asawa, T.; Zhang, L. Experimental and numerical analysis on effect of passive cooling methods on an indoor thermal environment having floor-level windows. Sustainability 2022, 14, 7880. [Google Scholar] [CrossRef]
- Yan, J.; Zhang, S.; Zhang, J.; Zhang, S.; Zhang, C.; Yang, H.; Wang, R.; Wei, L. Stormwater retention performance of green roofs with various configurations in different climatic zones. J. Environ. Manag. 2022, 319, 115447. [Google Scholar] [CrossRef]
- Shao, Y.; Zhang, J.; Sun, Y.; Li, J.; Zhuang, J.; Li, E.; Xue, X. Comparison of transpiration characteristics and cooling and humidifying functions of the main greening tree species in summer in Shanghai. Sci. Soil. Water Conserv. 2015, 13, 83–90. [Google Scholar]
- Xue, H.; Tang, H.; Li, Y.; Li, X.; Guo, J.; Ma, J. Regulation service of main greening tree species in Beijing. J. Beijing Norm. Univ. Nat. Sci. 2018, 54, 517–524. [Google Scholar]
- Tominaga, Y.; Mochida, A.; Yoshie, R.; Kataoka, H.; Nozu, T.; Yoshikawa, M.; Shirasawa, T. Aij guidelines for practical applications of cfd to pedestrian wind environment around buildings. J. Wind Eng. Ind. Aerod. 2008, 96, 1749–1761. [Google Scholar] [CrossRef]
- Guo, P.; Yi, M.; Lyu, T.; Wang, Y.; Liu, T. Study on the optimization strategy of opening mode on natural ventilation of residence using CFD simulation. Build. Sci. 2021, 37, 120–125. [Google Scholar]
- de Abreu-Harbich, L.V.; Labaki, L.C.; Matzarakis, A. Effect of tree planting design and tree species on human thermal comfort in the tropics. Landsc. Urban Plan. 2015, 138, 99–109. [Google Scholar] [CrossRef]
- Ding, C.; Lam, K.P.; Wong, N.H. Coupled natural ventilation modeling for contextual parametric design decision support. Procedia Eng. 2016, 169, 264–271. [Google Scholar] [CrossRef]
- Del Rio, M.A.; Asawa, T.; Hirayama, Y. Modeling and validation of the cool summer microclimate formed by passive cooling elements in a semi-outdoor building space. Sustainability 2020, 12, 5360. [Google Scholar] [CrossRef]
- Wang, D.; Sun, Y. Long-term changes in summer extreme wet bulb globe temperature over China. J. Meteorol. Res. 2021, 35, 975–986. [Google Scholar] [CrossRef]
- Yeung, P.S.; Fung, J.C.; Ren, C.; Xu, Y.; Huang, K.; Leng, J.; Wong, M.M. Investigating future urbanization’s impact on local climate under different climate change scenarios in mega-urban regions: A case study of the pearl river Delta, China. Atmosphere 2020, 11, 771. [Google Scholar] [CrossRef]
- Budd, G.M. Wet-bulb globe temperature (WBGT)—Its history and its limitations. J. Sci. Med. Sport 2008, 11, 20–32. [Google Scholar] [CrossRef]
- Parsons, K. Heat stress standard iso 7243 and its global application. Ind. Health 2006, 44, 368–379. [Google Scholar] [CrossRef] [PubMed]
- Astolfi, M.L.; Vitali, M.; Marconi, E.; Martellucci, S.; Mattei, V.; Canepari, S.; Protano, C. Urinary mercury levels and predictors of exposure among a group of Italian children. Int. J. Environ. Res. Pub. Health 2020, 17, 9225. [Google Scholar] [CrossRef]
- Yan, Y.; Xu, Y.; Yue, S. A high-spatial-resolution dataset of human thermal stress indices over south and east Asia. Sci. Data 2021, 8, 229. [Google Scholar] [CrossRef]
- Zhao, J.Y.; Liu, J.P. Numerical simulation of thermal environment in urban street valleys and countermeasures for planning and design. Archit. J. 2007, 3, 37–39. (In Chinese) [Google Scholar]
- Gonzalez, R.R.; Nishi, Y.; Gagge, A.P. Experimental evaluation of standard effective temperature: A new biometeorological index of man’s thermal discomfort. Int. J. Biometeorol. 1974, 18, 1–15. [Google Scholar] [CrossRef]
- Xi, T.; Ding, J.; Jin, H.; Mochida, A. Study on the influence of piloti ratio on thermal comfort of residential blocks by local thermal comfort adaptation survey and CFD simulations. Energy Procedia 2017, 134, 712–722. [Google Scholar] [CrossRef]
- Nazarian, N.; Fan, J.; Sin, T.; Norford, L.; Kleissl, J. Predicting outdoor thermal comfort in urban environments: A 3d numerical model for standard effective temperature. Urban Clim. 2017, 20, 251–267. [Google Scholar] [CrossRef]
- Lenzholzer, S.; Koh, J. Immersed in microclimatic space: Microclimate experience and perception of spatial configurations in Dutch squares. Landsc. Urban Plan. 2010, 95, 1–15. [Google Scholar] [CrossRef]
- Buzan, J.R.; Oleson, K.; Huber, M. Implementation and comparison of a suite of heat stress metrics within the community land model version 4.5. Geosci. Model Dev. 2015, 8, 151–170. [Google Scholar] [CrossRef]
- Hamdani, M.; Bekkouche, S.M.A.; Benouaz, T.; Cherier, M.K. Study and effect of orientation two room of buildings located in Ghardaia, Algeria. Energy Procedia 2012, 18, 632–639. [Google Scholar] [CrossRef][Green Version]
- Niu, S.; Liu, X.; Wang, A.; Chen, L.; Zhou, X.; Shi, X.; Yang, L.; Jin, X. Research on the influence of outdoor trees on natural ventilation performance of an academic building. Build. Simul. China 2023, 16, 927–946. [Google Scholar] [CrossRef]
- Kitagawa, K.; Iwama, S.; Fukui, S.; Sunaoka, Y.; Yazawa, H.; Usami, A.; Naramoto, M.; Uchida, T.; Saito, S.; Mizunaga, H. Effects of components of the leaf area distribution on drag relations for Cryptomeria japonica and Chamaecyparis obtusa. Eur. J. For. Res. 2015, 134, 403–414. [Google Scholar] [CrossRef]
- Yamazaki, T.; Kondo, J.; Watanabe, T.; Sato, T. A heat-balance model with a canopy of one or 2 layers and its application to field experiments. J. Appl. Meterol. 1992, 31, 86–103. [Google Scholar] [CrossRef]
- Choudhury, B.J.; Monteith, J.L. A four-layer model for the heat budget of homogeneous land surfaces. Q. J. Roy. Meteor. Soc. 1988, 114, 373–398. [Google Scholar] [CrossRef]
- Oshio, H.; Kiyono, T.; Asawa, T. Numerical simulation of the nocturnal cooling effect of urban trees considering the leaf area density distribution. Urban For. Urban Green. 2021, 66, 127391. [Google Scholar] [CrossRef]
Disclaimer/Publisher’s Note: The statements, opinions and data contained in all publications are solely those of the individual author(s) and contributor(s) and not of MDPI and/or the editor(s). MDPI and/or the editor(s) disclaim responsibility for any injury to people or property resulting from any ideas, methods, instructions or products referred to in the content. |
© 2023 by the authors. Licensee MDPI, Basel, Switzerland. This article is an open access article distributed under the terms and conditions of the Creative Commons Attribution (CC BY) license (https://creativecommons.org/licenses/by/4.0/).