Article

Spatiotemporal Characteristics of Tropical Cyclone Precipitation in Guangdong Province, China, from 1961 to 2020

1
Guangdong Climate Center, Guangzhou 501641, China
2
Guangdong Provincial Key Laboratory of Urbanization and Geo-Simulation, School of Geography and Planning, Sun Yat-sen University, Guangzhou 510006, China
3
Guangdong Provincial Engineering Research Center for Public Security and Disaster, School of Geography and Planning, Sun Yat-sen University, Guangzhou 510006, China
4
Southern Marine Science and Engineering Guangdong Laboratory (Zhuhai), Zhuhai 519000, China
*
Author to whom correspondence should be addressed.
Atmosphere 2023, 14(9), 1367; https://doi.org/10.3390/atmos14091367
Submission received: 19 July 2023 / Revised: 25 August 2023 / Accepted: 28 August 2023 / Published: 30 August 2023
(This article belongs to the Special Issue Monsoon and Typhoon Precipitation in Asia: Observation and Prediction)

Abstract

:
Tropical cyclones (TCs) are often accompanied by heavy precipitation, which may lead to natural disasters and a serious threat to life and property. However, they also provide indispensable water resources. Studying the temporal and spatial characteristics of TC precipitation is of great importance for TC precipitation forecasting, TC disaster mitigation, and water resource utilization. Guangdong is one of the most frequently and severely TC-affected provinces in China. Due to the different methods used to identify TC precipitation, the conclusions offered by the existing studies are often inconsistent. Moreover, their analyses of the spatiotemporal characteristics of TC precipitation in Guangdong are not sufficiently thorough. In this study, we first selected the historical TCs that affected Guangdong from 1961 to 2020, using an objective separation method for TC wind and rain, based on the observation data from 86 national meteorological stations in Guangdong Province. From these observations covering the past 60 years, the temporal and spatial variations in TC precipitation in Guangdong for four different periods, namely the first rainy season (FRS), the second rainy season (SRS), the non-rainy season (NRS), and over the whole year (WY), were then explored using statistical analysis and multiple cluster methods. The results show that TC frequencies in the four periods all showed a decreasing trend. TC precipitation also showed a decreasing trend in the SRS and NRS, as well as for the WY, but showed a slightly increasing trend in the FRS. Both TC frequency and TC precipitation showed an apparent inter-annual fluctuation and a quasi-periodic pattern. The spatial distribution of TC precipitation in the four periods all showed a decreasing trend from the coastal to the inland stations, but the western coastal areas had higher TC precipitation values than the eastern coastal areas for the SRS, NRS, and WY periods. The spatial variations of TC precipitation in Guangdong in the four periods of the last six decades were quite similar, exhibiting three primary spatial modes and six patterns. Among them, the spatial distribution of TC precipitation being less than normal across the whole province is the most common pattern. The 86 stations can be classified into six groups when using the spatial clustering method and into four groups when using the time-series clustering method. Stations with higher TC precipitation and large inter-annual fluctuations are often distributed in the coastal areas, while stations with less precipitation and small inter-annual fluctuations are distributed in inland areas. However, the primary areas that are affected by TCs may vary in the different periods.

1. Introduction

Tropical cyclones (TCs) are large-scale weather events with organized storm activity that form over warm tropical or subtropical water; they are often accompanied by strong winds, heavy rains, and storm surges. The extremely heavy rainfalls brought about by TCs often cause destructive and life-threatening disasters, such as floods, landslides, and mudslides. Studies have found that TC disasters in China are mainly associated with torrential rainfall [1,2,3,4,5]. Conversely, moderate TC precipitation plays an important role in regional water resource supply. Therefore, it is of great importance to improve our understanding of TC precipitation.
The identification and determination of TC precipitation forms the basis of the analysis of TC precipitation characteristics. However, since TCs often interact with other weather systems, separating the various forms of precipitation caused by different weather systems is extremely complicated [6]. In the early days of meteorological analysis, the identification of TC precipitation mainly adopted the method of artificial synoptic map analysis [7], which is both labor-intensive and time-consuming. Some scholars have used fixed circles with different radii covering such distances as 500 km or 800 km to define TC precipitation [8,9,10,11]. Other studies have defined TC precipitation as the precipitation generated by TCs over a fixed area (such as a TC impact zone) [12]. These methods are questionable because the sizes of TCs and the areas that they affect may vary greatly. Based on analyses of the structure of the TC precipitation field, Ren et al. proposed a numerical method to identify TC precipitation in 2001 [13]. The method was further improved by Ren et al. in 2007, who then named it the objective synoptic analysis technique (OSAT) [14]. The OSAT method imitates the process of weather forecasters’ analyses of a synoptic map, which involves two steps: separating independent rainbands from the precipitation field and associating certain rainbands with a given TC based on the forecasters’ experience. Many scholars have applied this method to study the characteristics of TC precipitation in different regions, such as East China, South China, and the coastal provinces and found that the variation trends of TC precipitation are quite diverse in the different regions. Ying et al. found that the precipitation recorded per TC and the maximum 1 h precipitation recorded in the southern region of the Yangtze River showed an increasing trend [15]. Zhang et al. found that the average precipitation from TCs in southeast China showed a significant increasing trend from 1965 to 2009 [16]. Other scholars have found that the long-term trend of TC precipitation in China from July to September is increasing in East China and southeast China while decreasing in South China and southwest China [17,18]. The studies by Wu et al. and Jiang et al. revealed that the TC precipitation and extreme TC precipitation in Hainan showed a downward trend [12,19]. Li et al. found that the frequency and intensity of TC precipitation in Hong Kong have decreased in recent decades [20]. Although the OSAT works perfectly well in most cases, it may fail to accurately identify TC precipitation values in certain situations, for example, when there is a complex interaction between the TCs and other weather systems [13,15], or when there is still strong precipitation after the TC has dissipated. For this reason, some studies still adopt the subjective approach [15,21].
After completing the identification step, most studies have adopted trend analysis methods to examine the trend of TC precipitation according to time series, with linear regression being the most commonly used technique. Ying et al. adopted the quantile regression to assess the trends in TC-induced wind and precipitation over mainland China and employed a bootstrap method to determine the significance levels of these trends [15]. Elsewhere, Zhang et al. used the Mann-Kendall test to examine the changes in TC precipitation in China [16]. Studies evaluating the spatial patterns of TC precipitation have used different spatial interpolation methods, such as inverse-distance interpolation and Kriging interpolation, to obtain spatial distribution information regarding TC precipitation [22,23,24,25]. A few of these studies have adopted the empirical orthogonal function (EOF) to explore the spatiotemporal characteristics of TC precipitation. For example, Luo et al. found that the first three eigenvectors of the EOF modes could explain 70.6% of the anomalies in the TC precipitation anomaly in South China from 1960 to 2016 [22]. Compared to the above statistical methods, cluster analysis, which is a machine learning method, can be used for mining the details of data information during the classification process [26]. However, few studies have applied these clustering methods to TC precipitation.
Guangdong Province is located in the southern area of China and is adjacent to the South China Sea (SCS) and the western North Pacific, a region with a high incidence of TCs that accounts for more than 36% of the total number of TCs worldwide. Its unique geographical location makes Guangdong one of the provinces most profoundly affected by TCs in China. However, few studies have focused specifically on analyzing the impact of TC precipitation in Guangdong. Although Li et al. used trend analysis and spatial interpolation methods to explore the spatiotemporal characteristics of TC precipitation in Guangdong [23], the research period used in their study was from 1951 to 2012, which cannot be used to reflect the characteristics shown in recent years. Even though some studies have covered Guangdong, their findings are inconsistent. This is because of the different definitions and separation methods regarding TC precipitation, the different scopes of research (whether tropical depressions and/or un-landed TCs have been included), the different study periods, and the different meteorological stations that were used to gather data. Moreover, few studies have provided detailed and in-depth analyses of different time periods and the different regions of Guangdong.
To fill in the above research gaps, this study aims to identify TC precipitation that is more in line with the actual weather recorded in Guangdong, based on more complete meteorological observation data from a specific time series (1961–2020). This study then uses trend analysis and a variety of clustering methods to analyze the spatiotemporal characteristics of TC precipitation recorded during different periods in Guangdong Province. Specifically, the following research questions are addressed: (1) What are the trends of TC frequency and TC precipitation affecting Guangdong in the past 60 years? (2) What are the differences in TC precipitation between different periods? (3) What are the patterns of TC precipitation for the different stations? The rest of this paper is organized as follows: Section 2 introduces the data analyzed in the study, along with the analytical methods that are employed. The temporal and spatial characteristics of TC precipitation in different periods are presented in Section 3. A discussion of our findings is presented in Section 4, and the conclusions drawn from these findings are summarized in Section 5.

2. Materials and Methods

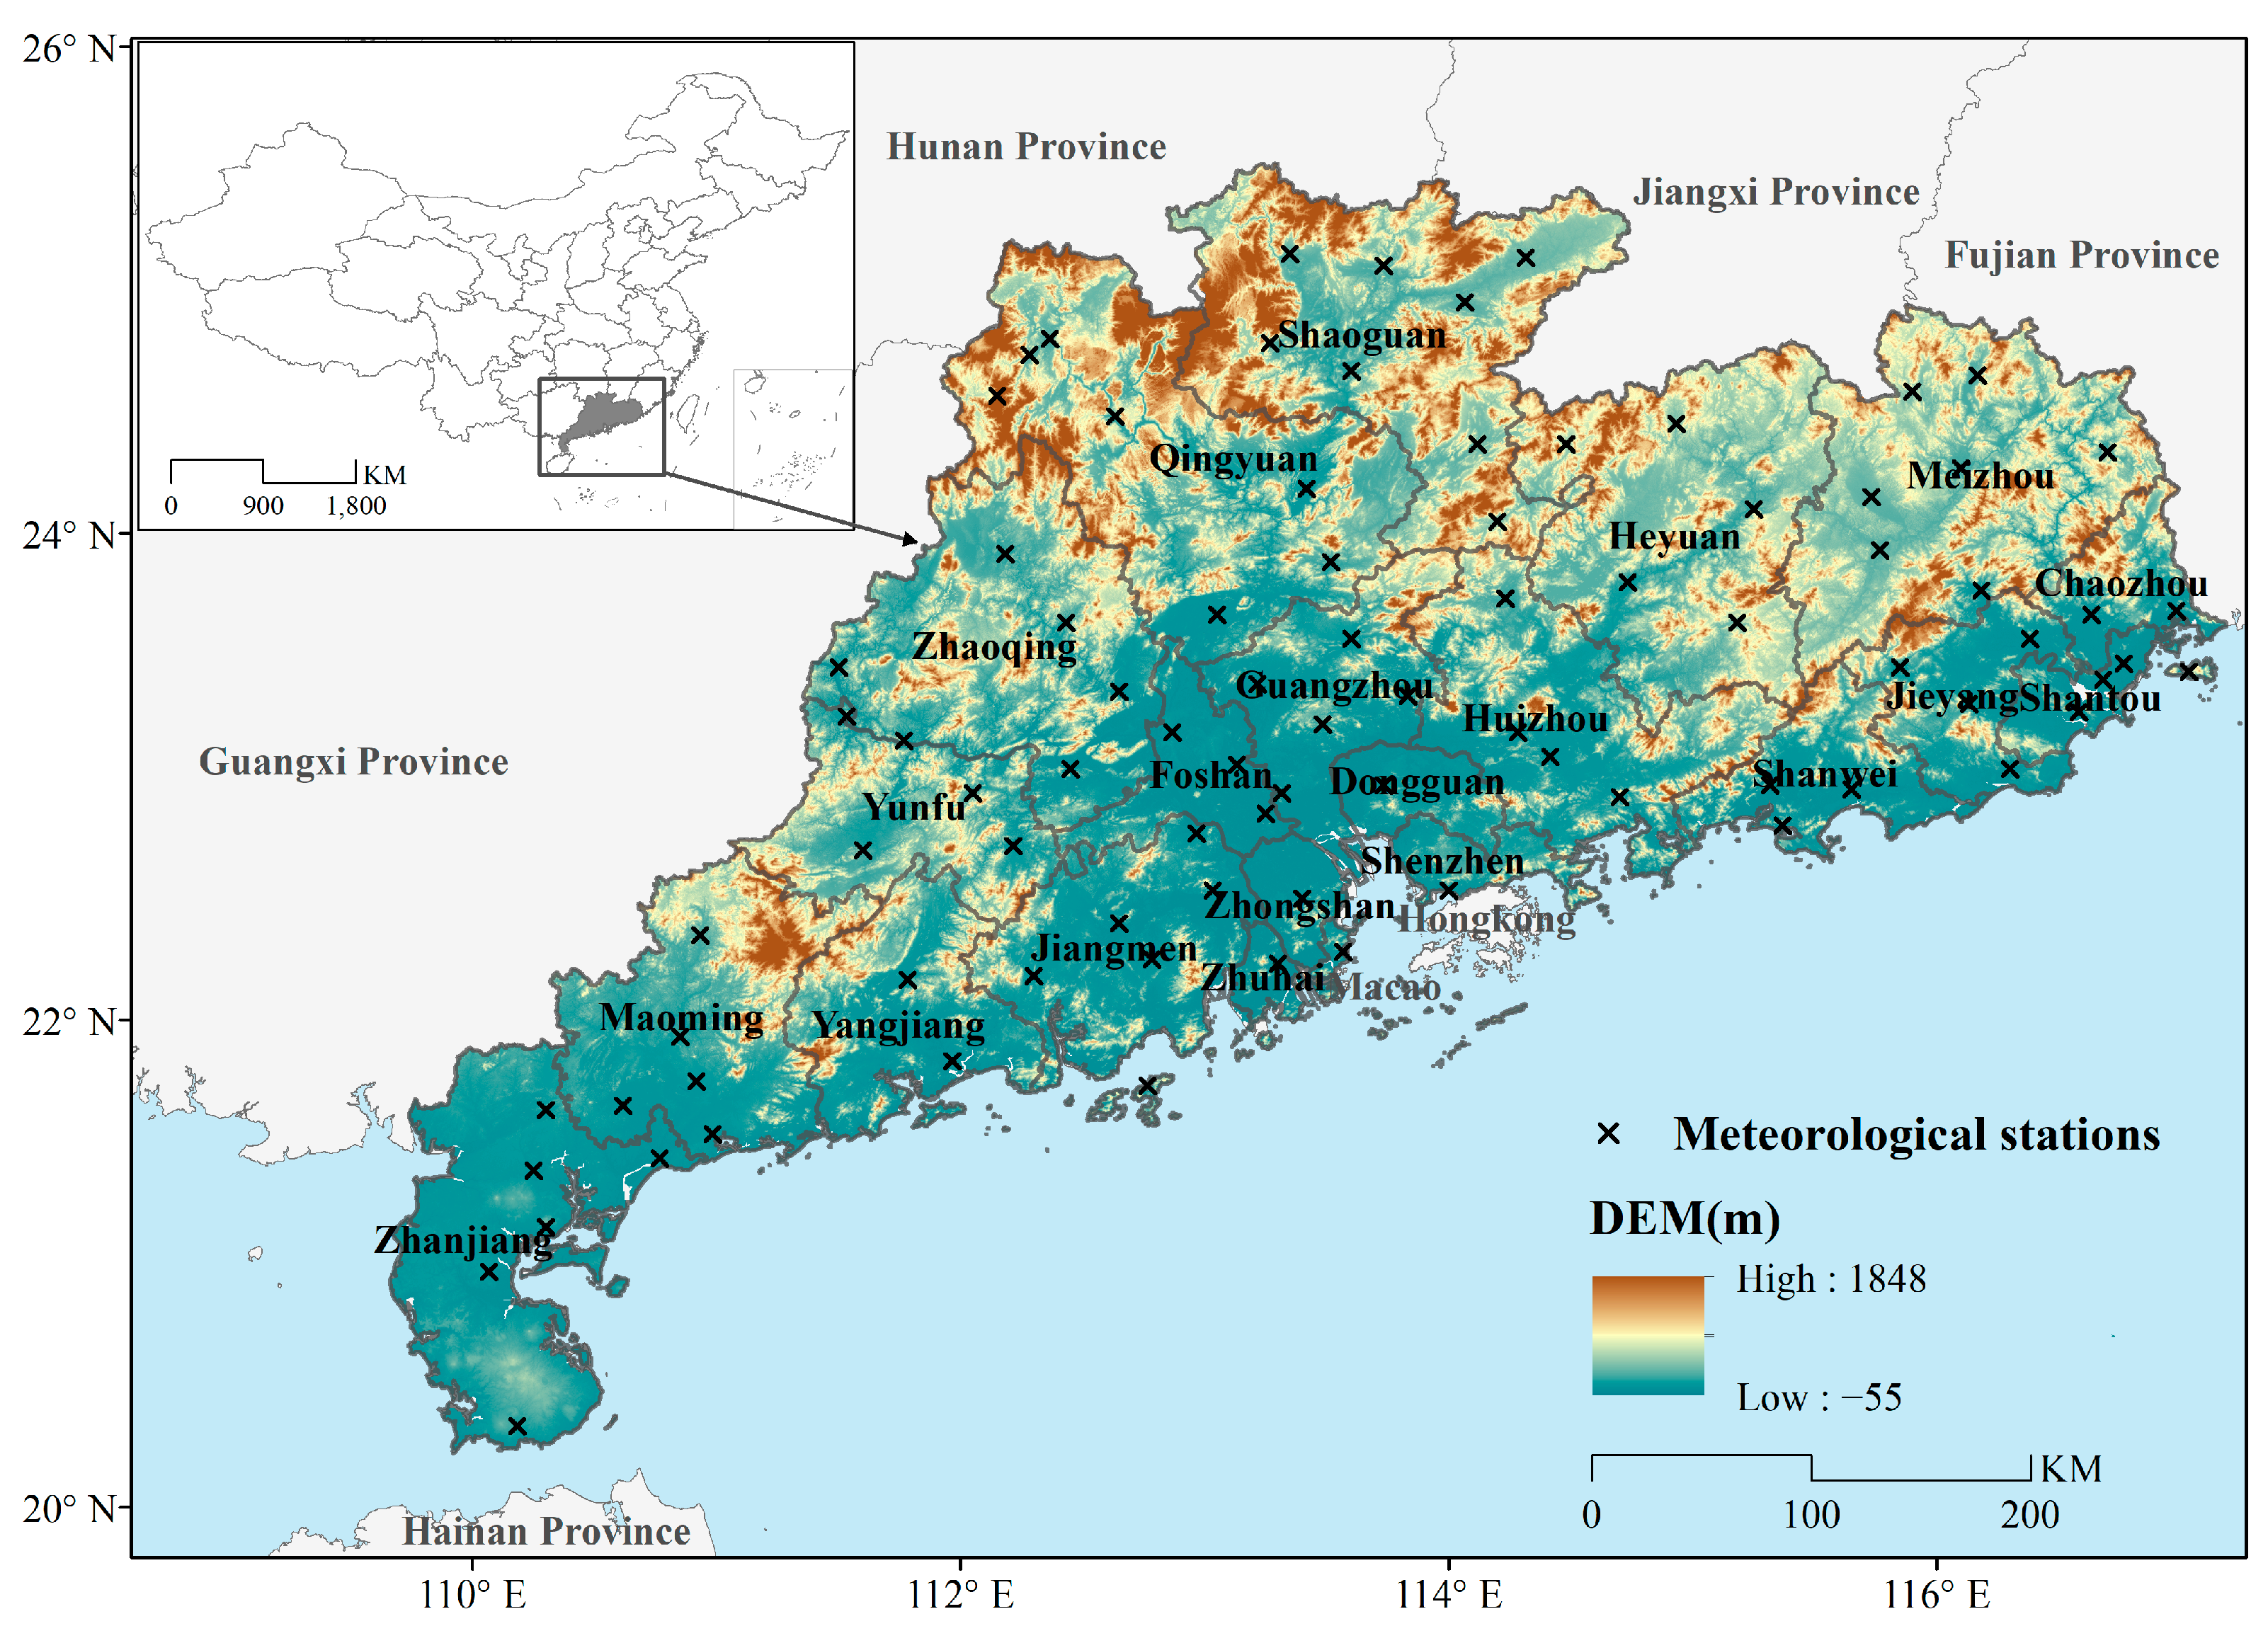
2.1. Study Area and Data

Our study area, Guangdong Province, comprises a land territory of 179,800 km2 with a coastline of 4114 km that is oriented from east to west (Figure 1). The province is geographically separated from the north of China by the Southern Mountain Range. The topography of Guangdong is high in the north and low in the south, with mountains taking up 33.7% of the total area; the remaining landscape is composed of hilly areas (24.9%), terraced land (14.2%), and plains (21.7%). From north to south, Guangdong features a mid-subtropical climate, a south subtropical climate, and a tropical climate. The annual average temperature in Guangdong is between 19 and 24 degrees Celsius, while the annual rainfall ranges from 1400 to 2000 mm. Almost 80% of the annual rainfall occurs in the rainy season from April to September, which can be divided into two periods of precipitation. The first rainy season (FRS) is from April to June, during which the precipitation mostly comprises frontal precipitation. The second rainy season (SRS) is from July to September, during which time the precipitation is mostly caused by TCs. The non-rainy season (NRS) runs from January to March and from October to December.
There was a total of 258 TCs that made landfall in Guangdong from 1951 to 2020, accounting for 41.5% of the total number of TCs reported in China. In the past 10 years, the average annual economic loss as a result of TCs in Guangdong Province was more than CNY 15 billion, accounting for about 64% of the province’s meteorological disaster losses. The average annual death toll is approximately 31 people, accounting for 40% of the province’s recorded deaths due to meteorological disasters, ranking in first place according to the number of deaths caused by all the various kinds of natural disasters [22,23,27,28].
The daily precipitation and maximum wind speed data from 86 meteorological stations in Guangdong Province, as recorded from 1961 to 2020, were used in this study. Although some of these stations were already in operation in the 1950s, they were relatively few and their spatial distribution was sparse, which may affect the accuracy of calculations regarding the objective separation of TC precipitation and wind to a certain extent. Therefore, our study selected the years from 1961 to 2020 as the research period.
The best-track data for TCs from 1961 to 2020 over the western North Pacific and the South China Sea were collected from the Shanghai Typhoon Institute of China’s Meteorological Administration (https://tcdata.typhoon.org.cn/, accessed on 1 April 2023.). These data include the latitude and longitude of the TC center, along with TC intensity in terms of the minimum sea level pressure and the maximum sustained 10-m wind speed, recorded at 6 h intervals [29,30,31].

2.2. Methods

Figure 2 shows the flowchart for the analysis employed in this study. First, the objective separation method for assessing TC wind and rain was employed to select those TCs that affected Guangdong during the period from 1961 to 2020, based on the daily precipitation and daily maximum wind speed data from 86 national surface meteorological stations in Guangdong Province, along with the latitudes and longitudes of the meteorological stations and the TC best-track data. Second, the TC precipitation of each station in four different periods, namely FRS, SRS, NRS, and the whole year (WY), was calculated. Third, the trend analysis method, empirical orthogonal function (EOF) analysis, and multiple cluster methods were adopted to investigate the various spatiotemporal characteristics of TC precipitation in Guangdong, which include the temporal variation trend, inter-decadal variation characteristics, spatial distribution, the anomaly field spatial oscillation pattern of TC precipitation, spatial clustering characteristics, and the time-series clustering characteristics of TC precipitation.

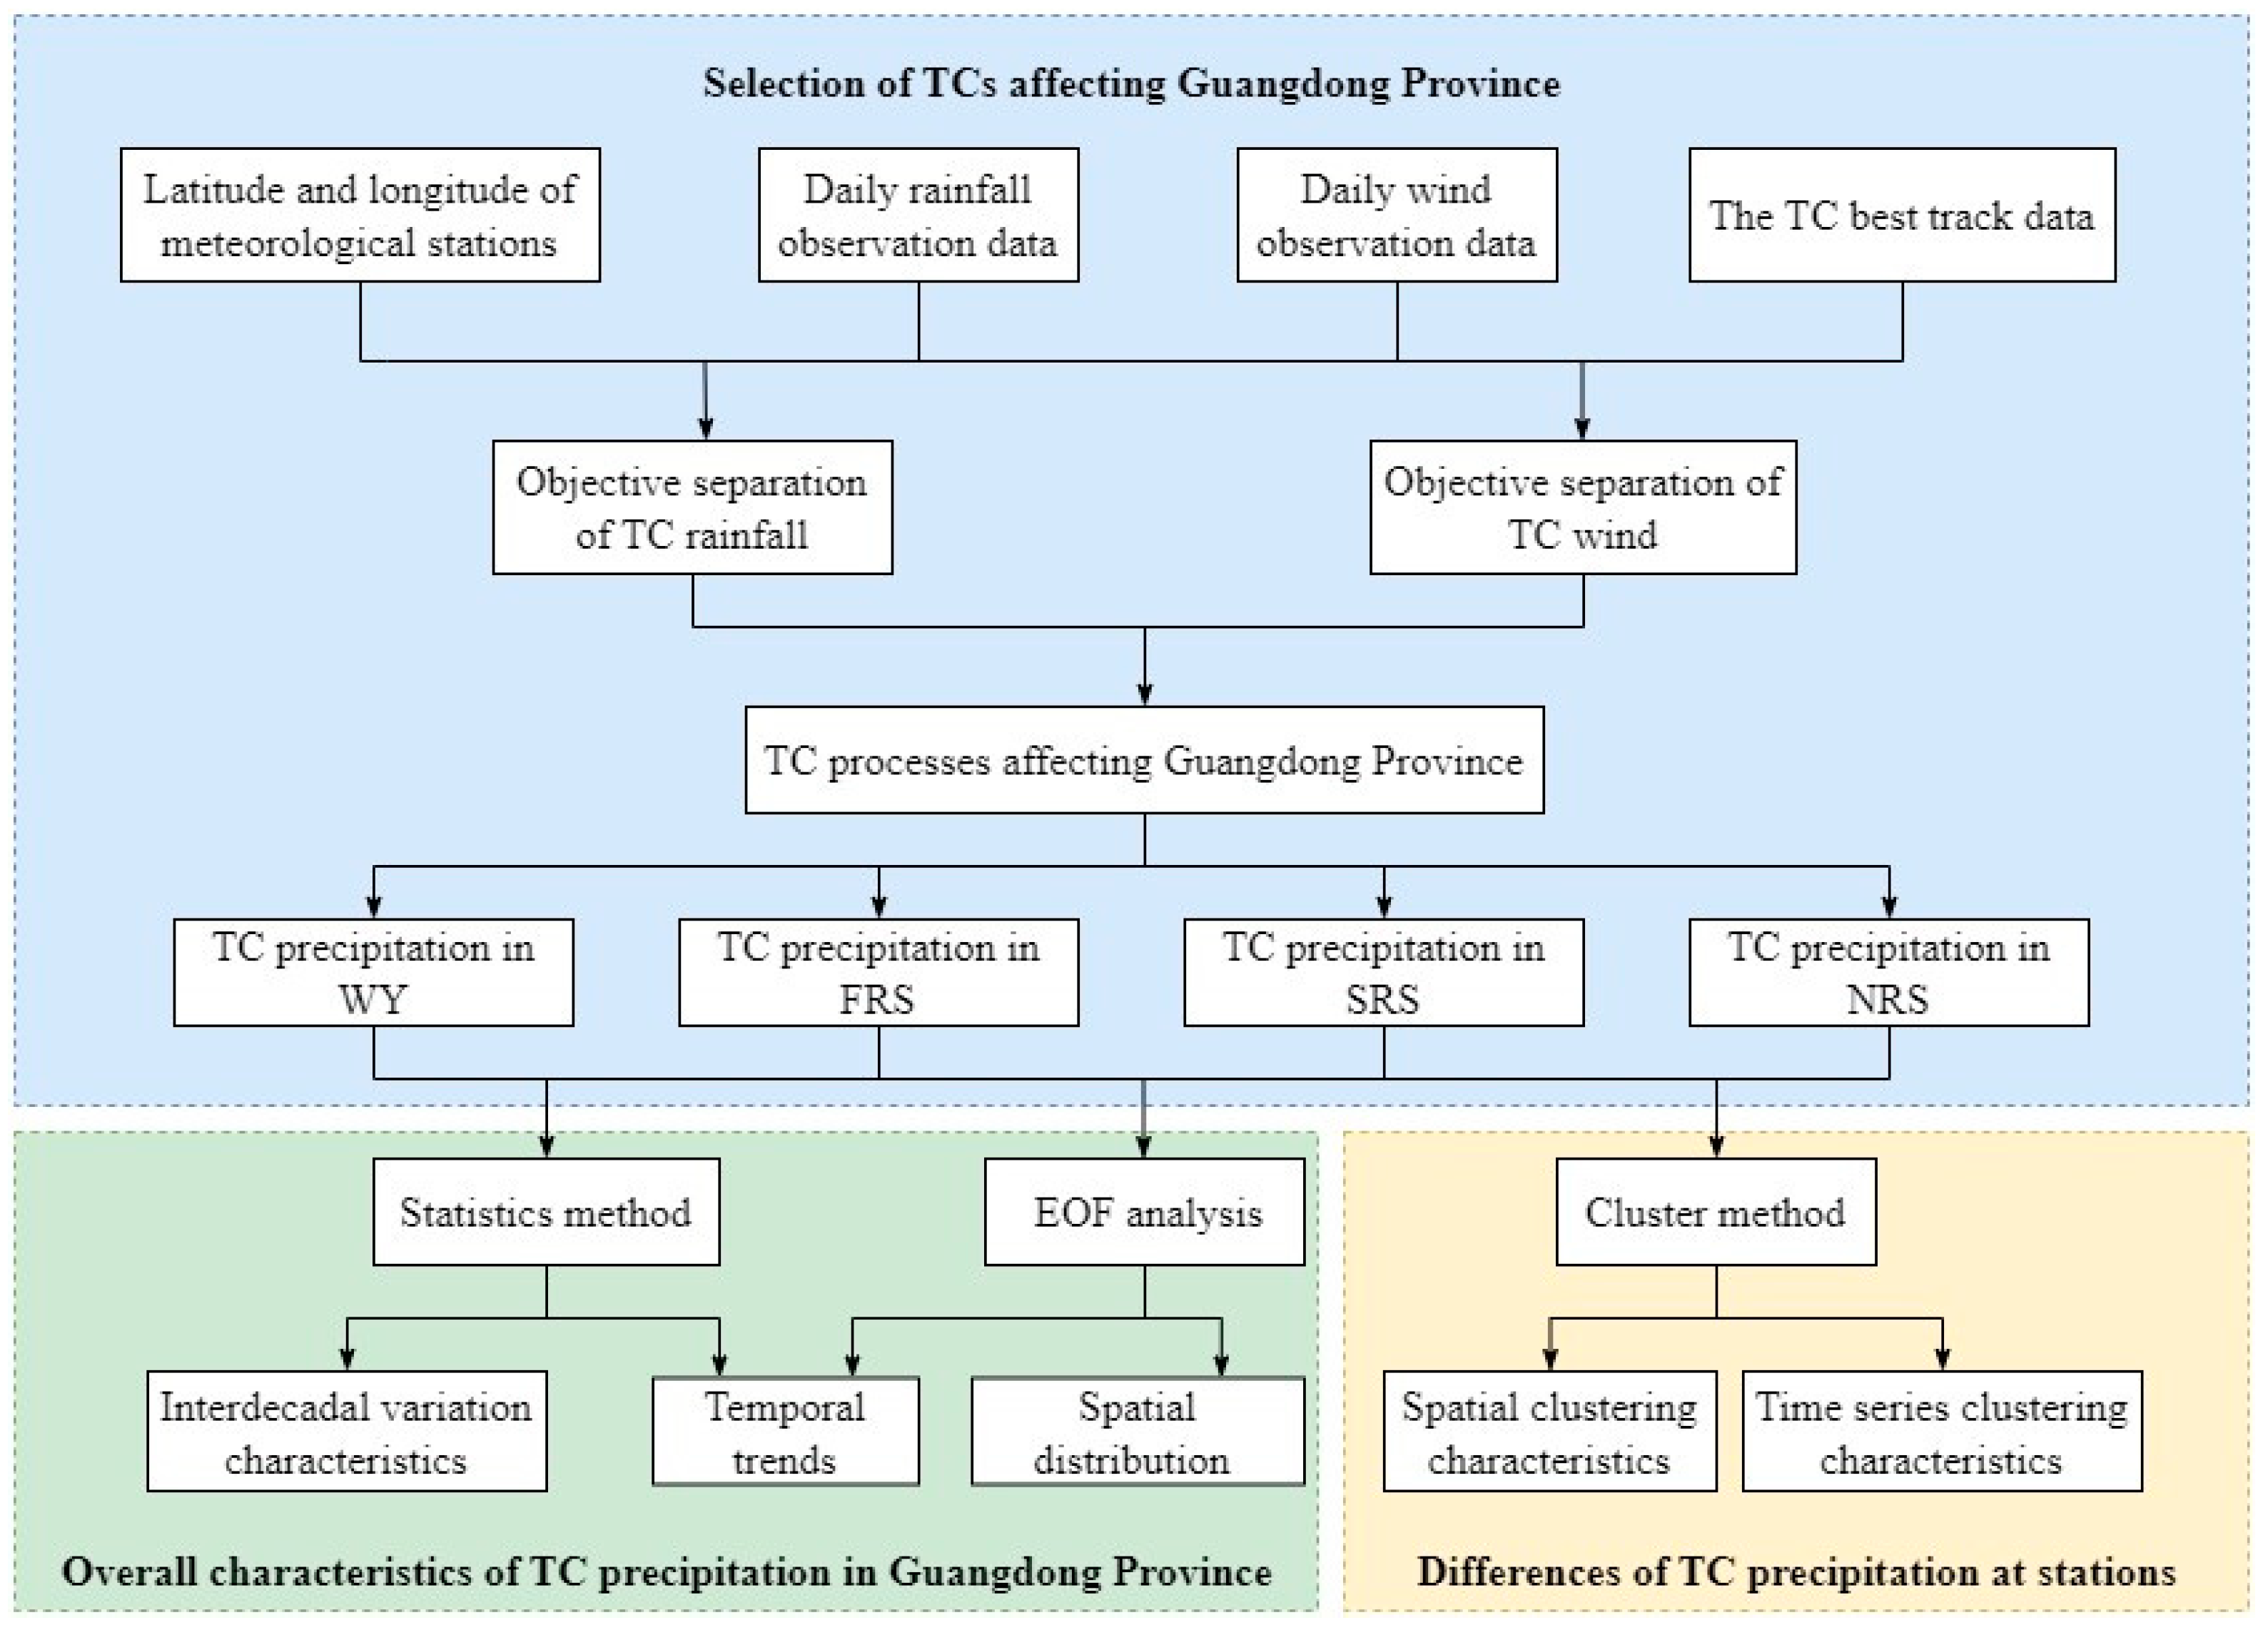
2.2.1. Selection of TCs Affecting Guangdong

In this paper, the objective separation method for assessing TC wind and rain was used to select those TCs that have affected Guangdong over time. The method for the objective separation of TC precipitation is based on the OSAT developed by Ren et al. [13,14], comprising 2 major steps: the separation of independent rainbands and the identification of the TC’s rainbands. A detailed description of these steps is given below.
(1)
Separation of independent rainbands
The first step is to separate the daily precipitation field into different rainbands based on an analysis of its structure. To establish the precipitation observed at the n surface meteorological stations on a certain day, the raining rate at the neighboring stations of around each station was first calculated. For a given station j   ( j = 1 ,   2   n ) , the raining rate of its neighborhood stations r(j) is defined as:
r j = m / M ,   p ( j ) > 0   0 ,   p ( j ) = 0  
where M is the total number of neighboring stations for station j, and m is the number of neighboring stations with precipitation. If station j records zero precipitation, then r ( j ) is set to 0. Station j belongs to a certain rainband if r ( j ) is greater than a certain value of R 0 , which is set to 0.5 as suggested by Ren et al. in their study [14].
The n stations were sorted in descending order according to their values of r ( j ) , with the topmost station being selected as the very first potential rainband center. After that, the other n -1 stations were examined in turn. If any of these stations met the following requirements, that station was selected as a new potential rainband center.
p j > 0 ,   r j > R 0 ,   and   d d c
where d is the minimum distance between station j and any other rainband center that has already been defined, and dc is set at a constant, predefined distance (such as 300 km).
Assuming that there are K stations being defined as potential rainband centers in the previous step, the following procedure was carried out to separate the   L (where L is less than or equal to K ) value of independent rainbands from the rain field.
Step 1: If a station does not belong to any particular rainband, then it is deemed to belong to a new rainband, l .
Step 2: If station j belongs to rainband l and either of condition (3) or condition (4) can be met, then any one of the neighboring stations of station j can be added as a new member of rainband l , as long as this station has not been assigned to any other rainband.
p j P 0 ,   a n d   r ( j ) R 0
p ( j ) > 0 ,   a n d   r ( j ) 0.5
Here, P 0 is a threshold value (empirically defined as 5 mm) that is used to separate large and small precipitation values.
Step 3: For any station that has been selected as a new member of rainband l , step 2 is repeated until there are no neighboring stations that match these requirements.
Afterward, the above 3 steps are carried out for the next potential rainband center to continue the search for a new rainband.
Some scattered raining stations ( p ( j ) > 0), especially the ones located at the edges of the rainbands, may still exist after the L rainbands have been separated. For each of these stations, the numbers of its neighboring stations that belong to each of the L independent rainbands are counted first. The station is then assigned to the rainband that has the greatest number of neighboring stations, as long as the number of neighboring stations is greater than 0; otherwise, it is regarded as a scattered raining station. To define the edges of the   L rainbands more accurately, this procedure may be repeated one or more times.
(2)
Identification of the TC’s rainbands.
A potential TC rainband may be defined when either of condition (5) or condition (6) is met:
D t b < D 0 + D m i n
v k 8.0 ,   k = 1 , , M l
where D t b is the distance between the TC center and the rainband-weighted-precipitation center and D 0 is the distance threshold of definite TC precipitation, while D m i n refers to the minimum distance between the TC center and any of the n stations. M l is the number of stations in rainband l , and v k is a function of the distance d ( k ) between the TC center and station k in rainband l .
v k = 4.0 ,   if   d k 300 + D m i n   2.0 ,   if   300 + D m i n < d k   400 + D m i n 1.0 ,   if   400 + D m i n < d k   500 + D m i n 0.5 ,   if   500 + D m i n < d k   600 + D m i n 0.0 ,   else .
A complete TC rainband should contain at least three raining stations. Raining station j belongs to a TC rainband if its distance to the TC center, D t s , is less than D 0 , or if D t s is less than D1 and it belongs to a potential TC rainband. The original TC range control threshold of D1 is quite large, with its maximum value being 1100 km. As a result, many TCs that are located far away from Guangdong Province can also be identified as TCs that affected Guangdong, which is inconsistent with the actual situation and against common sense. In this study, the TC range control thresholds of D1 were modified based on repeated experiments and comparisons performed during the identification of TC rainbands (Table 1); this means that the separation results for TC precipitation are more consistent with the actual situation in Guangdong. Since the original TC range control threshold has been greatly reduced, the TC precipitation data obtained in this study should be interpreted as precipitation that was directly caused by the TC system, whereas precipitation caused by remote TCs or the remnants of TCs was not included in our calculations.
TCs do not always bring significant precipitation with them. Some TCs may only cause strong winds, with little precipitation. These TCs are often omitted with the OSAT method. In this study, strong winds caused by TCs were also separated using an objective method. This method assumes that a TC may only result in strong winds within a certain radius, which is proportional to its intensity (Table 2). For a meteorological station located within the TC’s radius, the strong wind observed by this station can be attributed to the TC. In addition, if the precipitation of a station was identified as the result of TC impact, then the wind speed recorded by the station was automatically attributed to the same TC.
Based on the objective separation results for TC wind and rain from TCs, the beginning and ending dates of a particular TC’s impact on each station in the study area were judged according to the daily maximum wind speed and daily rainfall. Afterward, the total rainfall amount and the maximum daily rainfall of each station that was caused by TCs were calculated.

2.2.2. Spatiotemporal Analysis to Explore the Overall Characteristics of TC Precipitation

(1)
Trend analysis
In this paper, we performed linear regression between TC frequency and time series, as well as TC precipitation and time series in different periods, to identify the trend of TC frequency and TC precipitation over time. To explore whether the trend in TC frequency or in TC precipitation is significant, we performed a significance test for the results of the linear trend estimation. If the p-value was less than 0.05, then the upward or downward trend was considered to be significant.
To explore the characteristics of inter-decadal change, we used a multi-year moving average and the Butterworth low-pass filtering method to process the data [9,32,33].
(2)
EOF analysis
In climate studies, EOF analysis is often used to study the possible spatial modes of variability and how they change over time. EOF analysis simplifies the spatiotemporal data set by transforming it into the spatial mode of the physical quantity and the projection on the time with which it is associated [34,35,36]. The spatial mode obtained by decomposition can be regarded as the basis function corresponding to the variance, while the relevant time projection is the principal component (PC), the time coefficient. The formulas are as follows:
C m × m = 1 n X × X T
C m × m × V m × m = V m × m × E m × m
E m × m = λ 1 0 0 0 λ 2 0 0 0 0 0 λ n
where X is the data matrix to be analyzed, which is usually processed in the form of an anomaly. C is the covariance matrix. λ 1 , λ 2 λ n are the eigenvalues of the matrix C . The larger the eigenvalue is, the more important the corresponding mode is. V is the corresponding feature vector. The eigenvalue λ is usually sorted in order from large to small, where λ 1 >   λ 2 > > λ n , while the eigenvector value corresponding to each non-zero eigenvalue is the EOF value.
P C m × n = V m × m T × X m × n
Each row of the PC matrix P C m × n corresponds to the time coefficient of each feature vector. The time coefficient represents the time variation characteristics of the spatial distribution mode of the corresponding feature vector. The sign of the coefficient determines the direction of the mode. A positive sign indicates that it is in the opposite direction to the mode. The larger the absolute value of the coefficient is, the more typical the mode at that particular moment in time.
In this study, the EOF analysis was used to separate the temporal and spatial variations of the TC precipitation anomaly field in Guangdong Province for certain periods of the FRS, SRS, NRS, and also for the WY; the North test [37] was used to select the significant mode by which to describe the temporal and spatial variation characteristics of TC precipitation.

2.2.3. Cluster Methods for Exploring the Differences in TC Precipitation at the Different Stations

Clustering analysis is a popular statistical data analysis and machine learning approach that separates unlabeled data points into clusters based on their similarity to one another, which can discover the structure and other information contained in the data itself without needing a priori knowledge [38,39,40]. According to the characteristics of the different forms of data, we used two different cluster methods. The first one was the spatial clustering method considering attributes, which was used to cluster the 86 meteorological stations based on the 60-year average for TC precipitation recorded in the FRS, SRS, and NRS, and for the WY, respectively. The second one was the time-series clustering method, which was used to cluster the 86 meteorological stations based on their TC precipitation time series in the FRS, SRS, and NRS, and for the WY, respectively.
(1)
Spatial clustering considering attributes
There is often a positive spatial correlation among the TC precipitation values of neighboring stations. Therefore, the spatial relationships among the stations should also be considered when grouping the stations according to their levels of TC precipitation. In this paper, a k-means clustering algorithm that was based on the spatial adjacency relationship was adopted to cluster the 86 meteorological stations, wherein the weighted spatial distance was used [41,42].
d i j ( w ) = w x y 2 ( x i x j ) 2 + ( y i y j ) 2 + w A 2 ( a i a j ) 2 1 / 2
In the above equation, d i j ( w ) is the weighted spatial distance between stations   s i and s j . ( x i , y i ) and ( x j , y j ) are the coordinates of these two stations. a i and a j represent the attribute vectors, which are drawn from the 60-year average TC precipitation values of the two stations. The non-negative weights of w x y and w A reflect the importance of spatial location distance and attribute distance when calculating the weighted spatial distance.
(2)
Time-series clustering
In this study, the k-medoids clustering algorithm was used to cluster the 60-year TC precipitation time series of the 86 meteorological stations. Each station was categorized into different clusters according to its specific characteristic of change. The basic principle of the k-medoids algorithm is similar to that of the k-means algorithm. According to the distance from each observation point to the cluster center, all observation points are divided into categories according to the minimum distance. However, compared with the k-means algorithm, the k-medoids algorithm does not use the average value, but instead adopts the most central object in the cluster as the reference point. Therefore, the k-medoids algorithm has a better processing effect on noise points and isolated points [43,44]. The time series similarity is measured by the differentiable DTW form, soft-DTW, in the clustering process [45].

3. Results

3.1. Spatiotemporal Characteristics of TC Precipitation in Guangdong Province

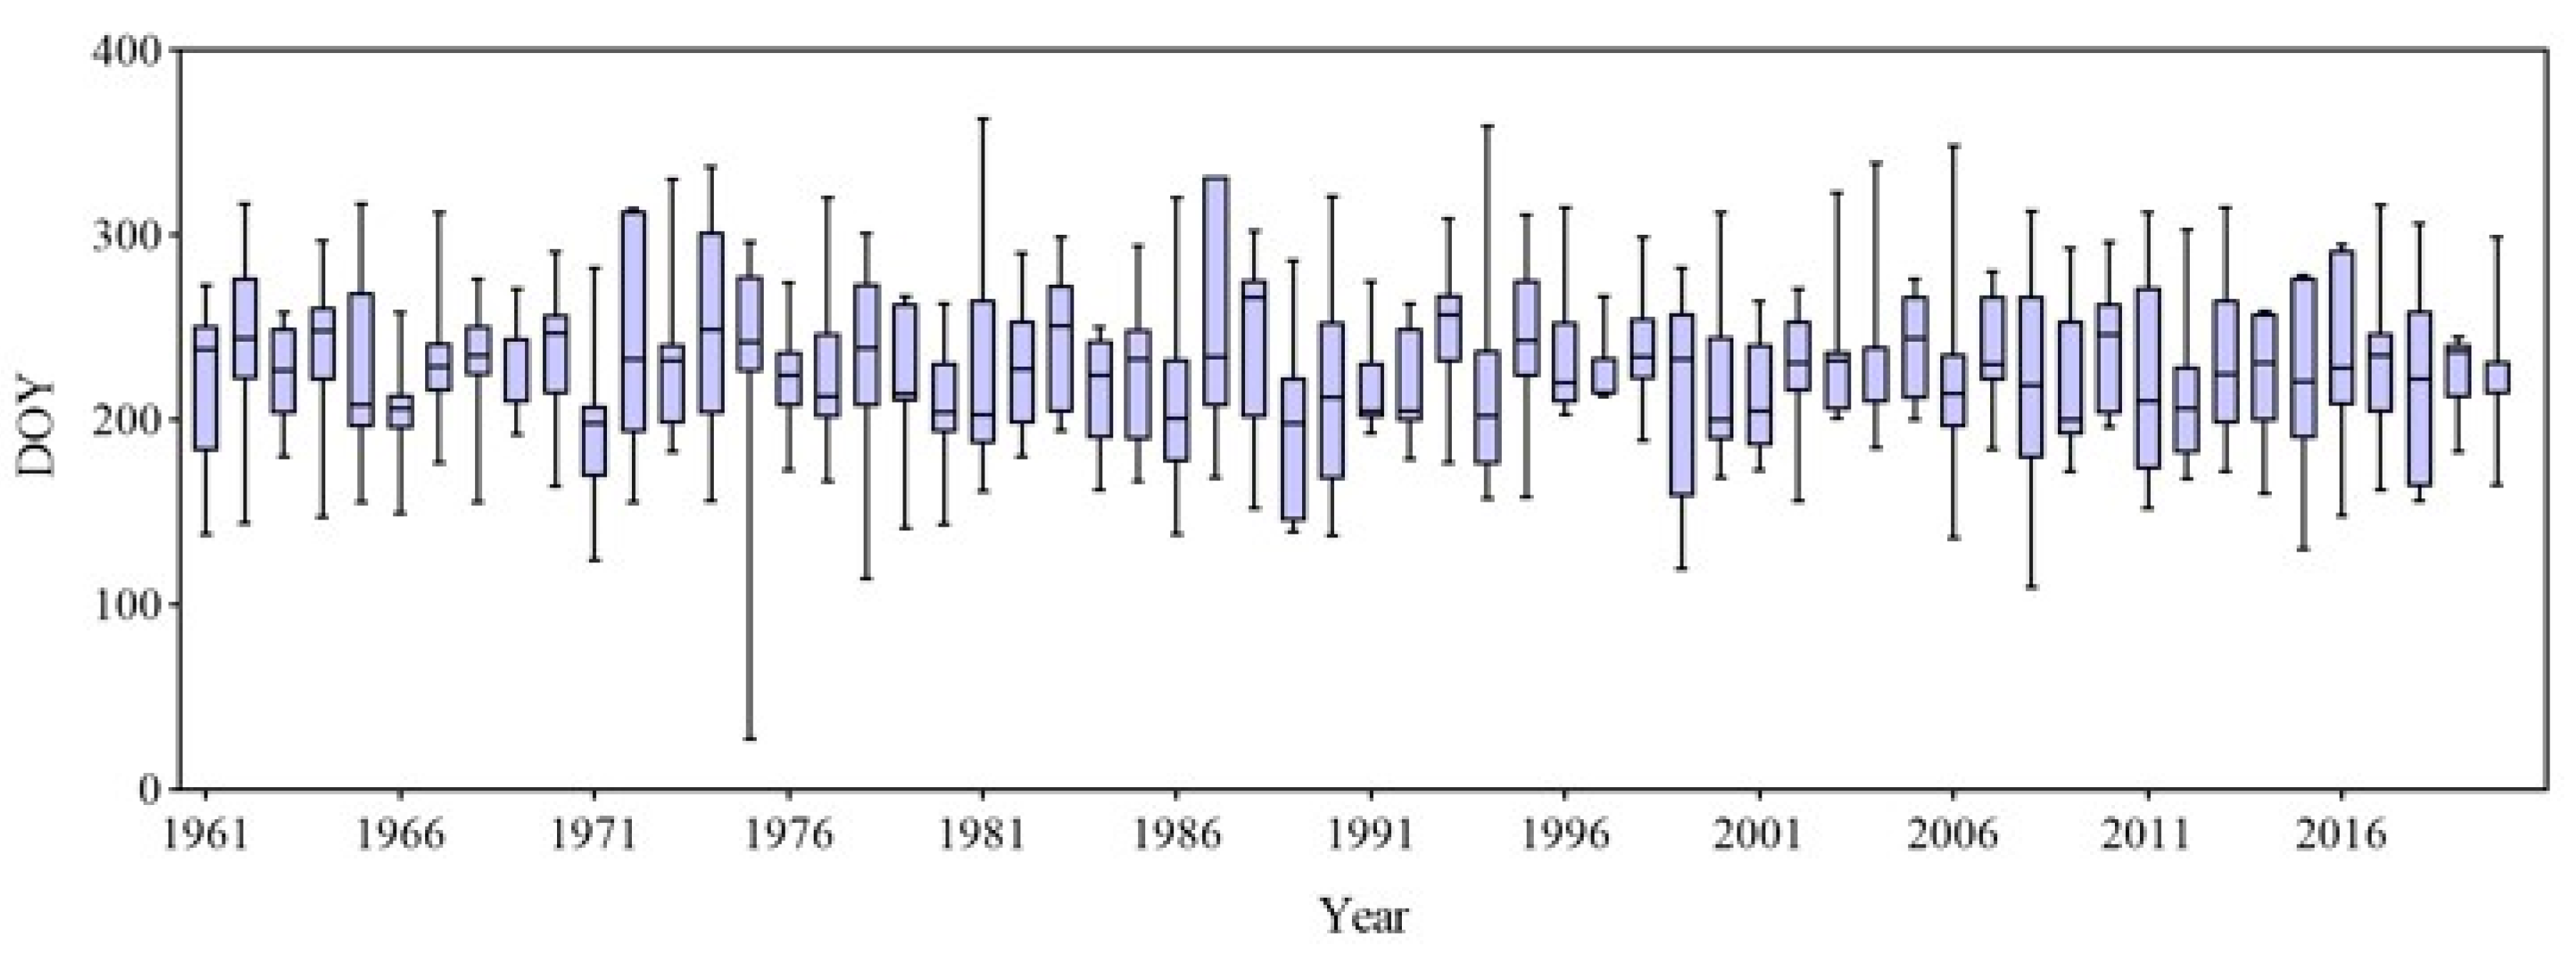
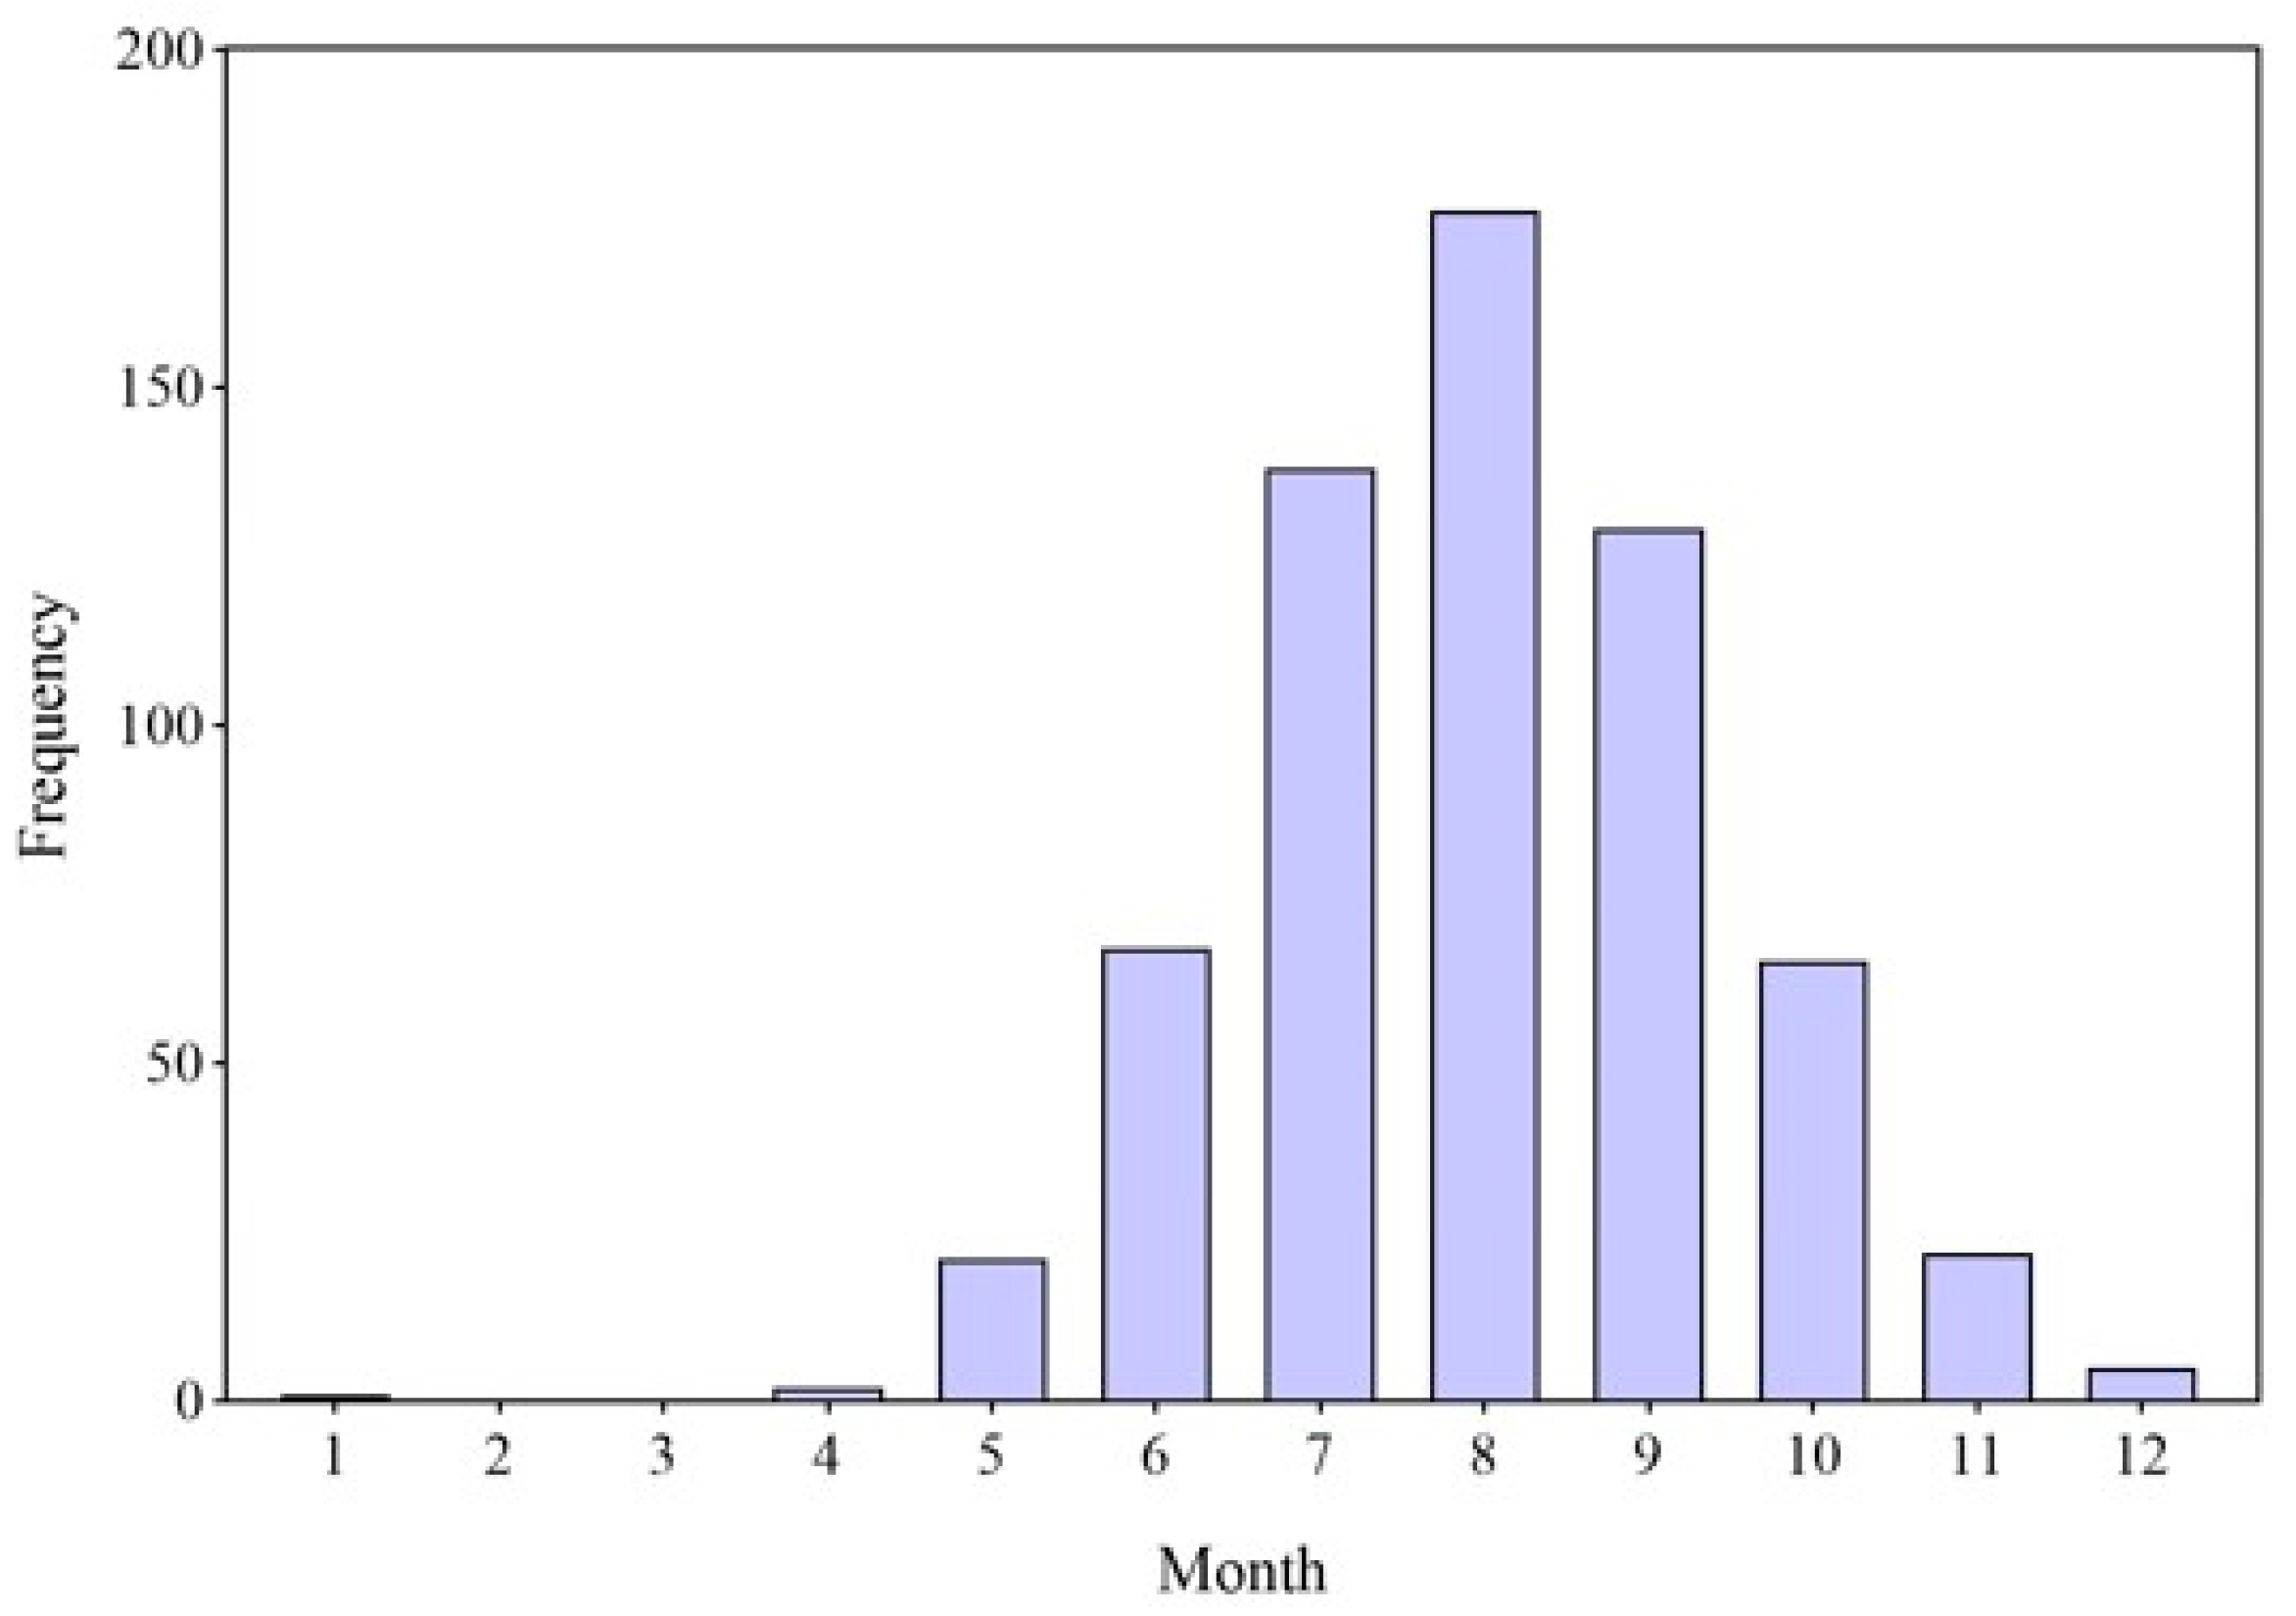
3.1.1. Temporal Change Characteristics

Using the method discussed in Section 2.2.1, we selected a total of 626 historical TCs that caused precipitation and strong winds in the vicinity of various Guangdong national meteorological stations during the period from 1961 to 2020. Half of these TCs had caused precipitation at less than 35% of the stations, while 143 of the other half of the TCs had a precipitation impact that was recorded by more than 70% of the stations. Additionally, only 220 of the 626 TCs that were recorded had landed in Guangdong (including Hong Kong and Macao); the remaining 406 TCs either made landfall in other provinces or dissipated out at sea.
Figure 3 shows the distribution of the occurrence time of TC precipitation in Guangdong Province from 1961 to 2020. It can be seen that TC precipitation in Guangdong covered a large time span and mainly occurred in the period from May to November on the days of the year (DOY) in the period from day 120 to day 330, with slight fluctuations from year to year. The earliest recorded DOY with TC precipitation occurred on 27 January 1975, while the latest recorded DOY with TC precipitation occurred on 29 December 1981.
As shown in Figure 4, 90 of the 626 identified TCs occurred in the FRS, accounting for 14.4% of the total; 443 TCs occurred in the SRS, accounting for 70.8% of the total; and 93 TCs occurred in the NRS, accounting for 14.9% of the total. The seasonal variations in the TCs affecting Guangdong are closely related to the genesis of TCs in the WNP and SCS. From January to April, most TC genesis occur south of latitude 15° N; from May to August, the region of TC genesis gradually extends northward. Meanwhile, the deep-layer-mean steering flow also tends to steer the TCs further northward. As a result, TC activity drifts slowly northward during May and June to make landfall in South China. By July and August, the TC landfall activity increases and shifts further north. Finally, in September, the landfall activity reverses and moves back toward the south [46].
Based on this pattern of movement, our study analyzed the spatial and temporal characteristics of TC precipitation according to four periods, namely the FRS, SRS, NRS, and WY.
Figure 5 shows the number of TCs and the annual precipitation brought by TCs that affected Guangdong Province in different years. It is evident that the inter-annual fluctuations of TC frequency and precipitation were very large for all four periods. In terms of frequency, the average number of TCs affecting Guangdong each year was 10.6 from 1961 to 2020, with the maximum number of TCs reaching 17 and the minimum number being only 5. In terms of precipitation, the average annual precipitation caused by TCs in Guangdong from 1961 to 2020 was 277.6 mm, with a maximum value of 536.2 mm in 1986 and a minimum of 51.1mm in 2004. The majority of the TC precipitation from TCs occurred in the SRS. The average precipitation in the SRS was 210.3 mm, although it was only 36.4 mm and 30.9 mm, respectively, for the FRS and NRS.
In terms of the trends in the variations, the regression coefficients of the number of TCs in the FRS, SRS, and NRS, and for the WY, along with TC precipitation in the SRS, the NRS, and for the WY were all negative, showing a decreasing trend, and the number of TCs in FRS, SRS, and WY decreased significantly. Whereas the regression coefficient of TC precipitation in the FRS was positive, showing an increasing trend. The findings of the nine-year sliding average and the results of Butterworth’s low-pass filtering show the presence of a quasi-periodic pattern in the changes in TC frequency and TC precipitation. Among them, the filtered curve corresponding to the number of TCs in the FRS had an obvious change point around the year 1990. The average number of TCs in the FRS from 1961 to 1990 was 1.9, while the average number of TCs in the FRS from 1991 to 2020 dropped to 1.1, showing a difference of 0.8. This may be due to the fact that, from the perspective of thermal conditions, the average sea surface temperature (SST) in the region of Niño 3.4 (5° N–5° S, 120°–170° W) has generally been high in recent years. From the point of view of dynamic conditions, the intertropical convergence zones found at different heights have moved westward to varying degrees since 1990, whereas the easterly convergence flow south of the subtropical high has shifted eastward, while the relative vorticity in the main area where the frequency of TC has decreased in China (5–12.5° N, 137.5°–155° E) has been reduced, causing unfavorable conditions for the generation of TCs. In terms of changes to the paths followed by TCs, their movements are mainly manipulated by large-scale circulation-guided currents. After 1995, a northerly wind anomaly in opposition to the southwesterly winds of the mean flow field was observed in South China, which led to an overall decrease in the frequency of TC activities and TC precipitation affecting Guangdong Province [22,47].
Furthermore, there was a northerly wind anomaly in the East China Sea, moving in the same direction as the mean flow field, and an easterly wind anomaly in the middle and lower reaches of the Yangtze River, moving in the opposite direction of the mean flow field. This causes an increasing number of recurving TCs that usually make landfall in East China and cause precipitation in Guangdong Province, resulting in a rise in TC precipitation during FRS [47,48,49].

3.1.2. Spatial Distribution Characteristics

Figure 6 presents the spatial distribution of TC precipitation in different periods. It is evident that the annual average TC precipitation in the FRS, SRS, and NRS, and for the WY all showed a decreasing trend from the coast to the inland. Meanwhile, the TC precipitation in the SRS and NRS, as well as for the WY, were all greater in the western coastal areas compared to the eastern coastal areas.
Specifically, the SRS contributed most of the TC precipitation over the WY. In the FRS and NRS, the TC precipitation in most regions was less than 50 mm. Annual TC precipitation in the coastal areas was generally greater than 300 mm, which gradually decreased to less than 150 mm in the northern regions, including most of the Shaoguan City, the northern part of the Qingyuan City, and the northwestern part of the Zhaoqing City.
Differences in the spatial distribution of TC precipitation in Guangdong are primarily caused by the apparent differences in TC activities. According to a study by Zhang et al., from 1951 to 2020, there were 112, 71, and 51 TCs making landfall in western Guangdong, central Guangdong, and eastern Guangdong, respectively [27]. Yan et al. found that in the case of TCs that landed in the Pearl River Delta (PRD) region, the highest values of precipitation appeared in the coastal areas of the PRD and the western regions of Guangdong; for TCs that landed in eastern Guangdong, the highest values of precipitation appeared in the PRD and eastern Guangdong. In the case of TCs that landed in western Guangdong, high values of precipitation also appeared in western Guangdong [50]. Since around 48% of the TCs that affect Guangdong Province each year make landfall in the western part of the province, this explains why there is greater TC precipitation in the western coastal areas.
The topography also plays an important role in the movement of TCs. The lifting effect of coastal topography and the windward slopes of mountain ranges strengthen the upward movement of warm and humid air while blocking and slowing the progress of TCs, resulting in torrential rainfall in the coastal areas.

3.1.3. EOF Analysis of TC Precipitation

To explore the spatial variations in TC precipitation in Guangdong Province from 1961 to 2020, we carried out an EOF analysis to elucidate the TC precipitation anomaly fields of 86 stations in the FRS, SRS, and NRS, and for the WY, respectively. The North test results show that the first three modes of TC precipitation in the FRS, SRS, and NRS, and for the WY were statistically significant, with the cumulative variance contribution of the eigenvector being 79.6%, 76.9%, 82.8%, and 74.5%, respectively. The variance contribution rate of the first-mode feature vector was 54.3%, 51.1%, 57.3%, and 53.5%, respectively, which was much higher than the contribution rates of other modes. Therefore, the first mode is the most important spatial distribution mode of the TC precipitation field in Guangdong Province.
Figure 7 shows the spatial distribution of the eigenvectors of the first three modes identified in the EOF analysis of the TC precipitation anomaly field in the FRS, SRS, and NRS, and for the WY. The eigenvector values corresponding to the first mode in the four periods are all positive, indicating that the trend of precipitation in the province during these periods is highly consistent, which means that TC precipitation in the whole province is either consistently more than normal or consistently less than normal. However, spatial distributions of the eigenvectors in different periods are different. Regarding the FRS, the high-value center was mainly located in the Pearl River Delta and decreased outward. Regarding the SRS and the WY, the high-value centers were mainly located in the western coastal cities, such as Zhanjiang, Maoming, Yangjiang, Jiangmen, Zhuhai, and Zhongshan, and decreased from southwest to northeast. Regarding the NRS, the high-value centers were mainly concentrated in the central and eastern coastal cities, such as Zhuhai, Zhongshan, Shenzhen, Huizhou, Shanwei, and Jieyang, and decreased from the coast to the inland stations.
The spatial distribution of the eigenvectors corresponding to the second mode in the four periods is generally similar, bounded by a central axis that passes through the Pearl River estuary, showing an east-west reverse distribution pattern. This means that there is either more TC precipitation in eastern Guangdong and less TC precipitation in western Guangdong, or less TC precipitation in eastern Guangdong and more TC precipitation in western Guangdong. Regarding the FRS, the SRS, and the WY, the area east of the central axis is positive and that to the west is negative, while the distribution in the NRS is exactly the opposite.
The spatial distributions of the eigenvectors corresponding to the third mode in the four periods are roughly the same, with the higher values or lower values centered on the Pearl River estuary and a reverse distribution around the center. In this mode, the TC precipitation was either more than normal in the central region of Guangdong but less in the eastern and western regions, or it was less in the central region of Guangdong but more in the eastern and western regions.
The first mode showed the highest frequency of occurrence in the past 60 years. The change amount of TC precipitation compared with normal in Guangdong in a specific year usually depends on the status of the warm water in the equatorial east-central Pacific Ocean, the strength of the subtropical high in the western Pacific Ocean, and the water vapor content over the Guangdong area in that year. If the subtropical high pressure is strong, extensive in area, and with a southward ridge line and a westward-extended ridge point, the TC precipitation in Guangdong tends to be low, and vice versa. For the second and third modes, the spatial differences in TC precipitation variability in a specific year are more likely to be due to the TC landfall location and intensity in that year [51].
In accordance with the three modes, there are six primary spatial distribution patterns for TC precipitation in Guangdong. In pattern 1, the whole province experiences more TC precipitation than normal, while pattern 2 represents the opposite (i.e., the whole province has less TC precipitation than normal). Pattern 3 represents those cases when there are higher than normal TC precipitation levels in eastern Guangdong and lower than normal levels in western Guangdong, while pattern 4 represents the opposite of pattern 3 (i.e., higher than normal TC precipitation levels in western Guangdong and lower than normal levels in eastern Guangdong). Pattern 5 represents cases when the central part of Guangdong has higher than normal TC precipitation levels and the peripheral areas have lower than normal levels, while pattern 6 represents the opposite. Figure 8 shows the spatial distribution patterns of TC precipitation in the FRS, SRS, and NRS, and for the WY from 1961 to 2020.
In the past 60 years, it can be seen that pattern 2 occurred most frequently for all four periods (FRS, SRS, NRS, and the WY), and there was an increasing trend in recent years. Regarding the FRS, pattern 2 appeared 27 times over 60 years, accounting for nearly 50%, while other pattern’ appearances were all less than 10 years. Regarding the SRS, pattern 1 and pattern 2 appeared 15 times and 26 times, accounting for 25% and 43%, respectively. Regarding the NRS, pattern 1 and pattern 2 appeared 11 times and 36 times, accounting for 18% and 60%, respectively. Regarding the WY, pattern 1 and pattern 2 appeared 21 times and 26 times, accounting for 35% and 43%, respectively.

3.2. Comparison of TC Precipitation at Different Stations

3.2.1. Spatial Clustering of TC Precipitation at Different Stations

In order to explore the differences in TC precipitation among the various stations in the FRS, SRS, and NRS, and for the WY, we used the k-means clustering algorithm, based on the spatial adjacency relationship, to cluster the 86 meteorological stations. The optimal number of clusters was set at six, according to the elbow method and the silhouette coefficient. The left column in Figure 9 shows the spatial distribution of the six types of stations in the different periods, while the right column presents violin plots depicting TC precipitation at the six types of stations. The spatial distributions of the clustered stations in the different periods are generally consistent, but there are also some differences. The clustering results of the SRS and those for the WY are similar. Stations forming Cluster 5, Cluster 6, and Cluster 2 have higher TC precipitation levels and are evenly distributed in the coastal area. Among them, Jiangmen, Zhuhai, Zhongshan, and Shenzhen in the middle of the coastal zone have the highest TC precipitation; followed by Zhanjiang and Maoming in the west of the coastal zone; while Huizhou, Shanwei, Jieyang, and Shantou in the east of the coastal zone have relatively lower TC precipitation. Stations in the other three clusters have less TC precipitation and are all distributed in the inland areas. Among them, the stations of Cluster 4, which are located in Shaoguan, Qingyuan, and the north of Heyuan, have the least TC precipitation, comprising less than 150 mm in the SRS and less than 200 mm in the WY. Those stations located in the central and western regions of Guangdong Province have more TC precipitation than those in the central and eastern regions.
The clustering results regarding TC precipitation in the FRS and NRS are quite different from those of the SRS and for the WY. Regarding the FRS, stations in Cluster 5 and Cluster 6 have more TC precipitation and are located in the middle of the coastal zone (Jiangmen, Zhongshan, Zhuhai, and Shenzhen) and in the eastern coastal zone (Shanwei, Jieyang, Shantou, and Chaozhou). The TC precipitation recorded by these stations exceeds 40 mm, whereas stations in the western coastal zone have relatively less TC precipitation. Regarding the NRS, the stations of Cluster 5, Cluster 6, and Cluster 2, which have more TC precipitation, are also distributed in the coastal area, but the amount of TC precipitation decreases from west to east along the coastal zone. Stations located on the Leizhou Peninsula have relatively greater TC precipitation in the NRS, with some stations recording TC precipitation that exceeds 70 mm. These findings are consistent with the results reported in the previous sections.

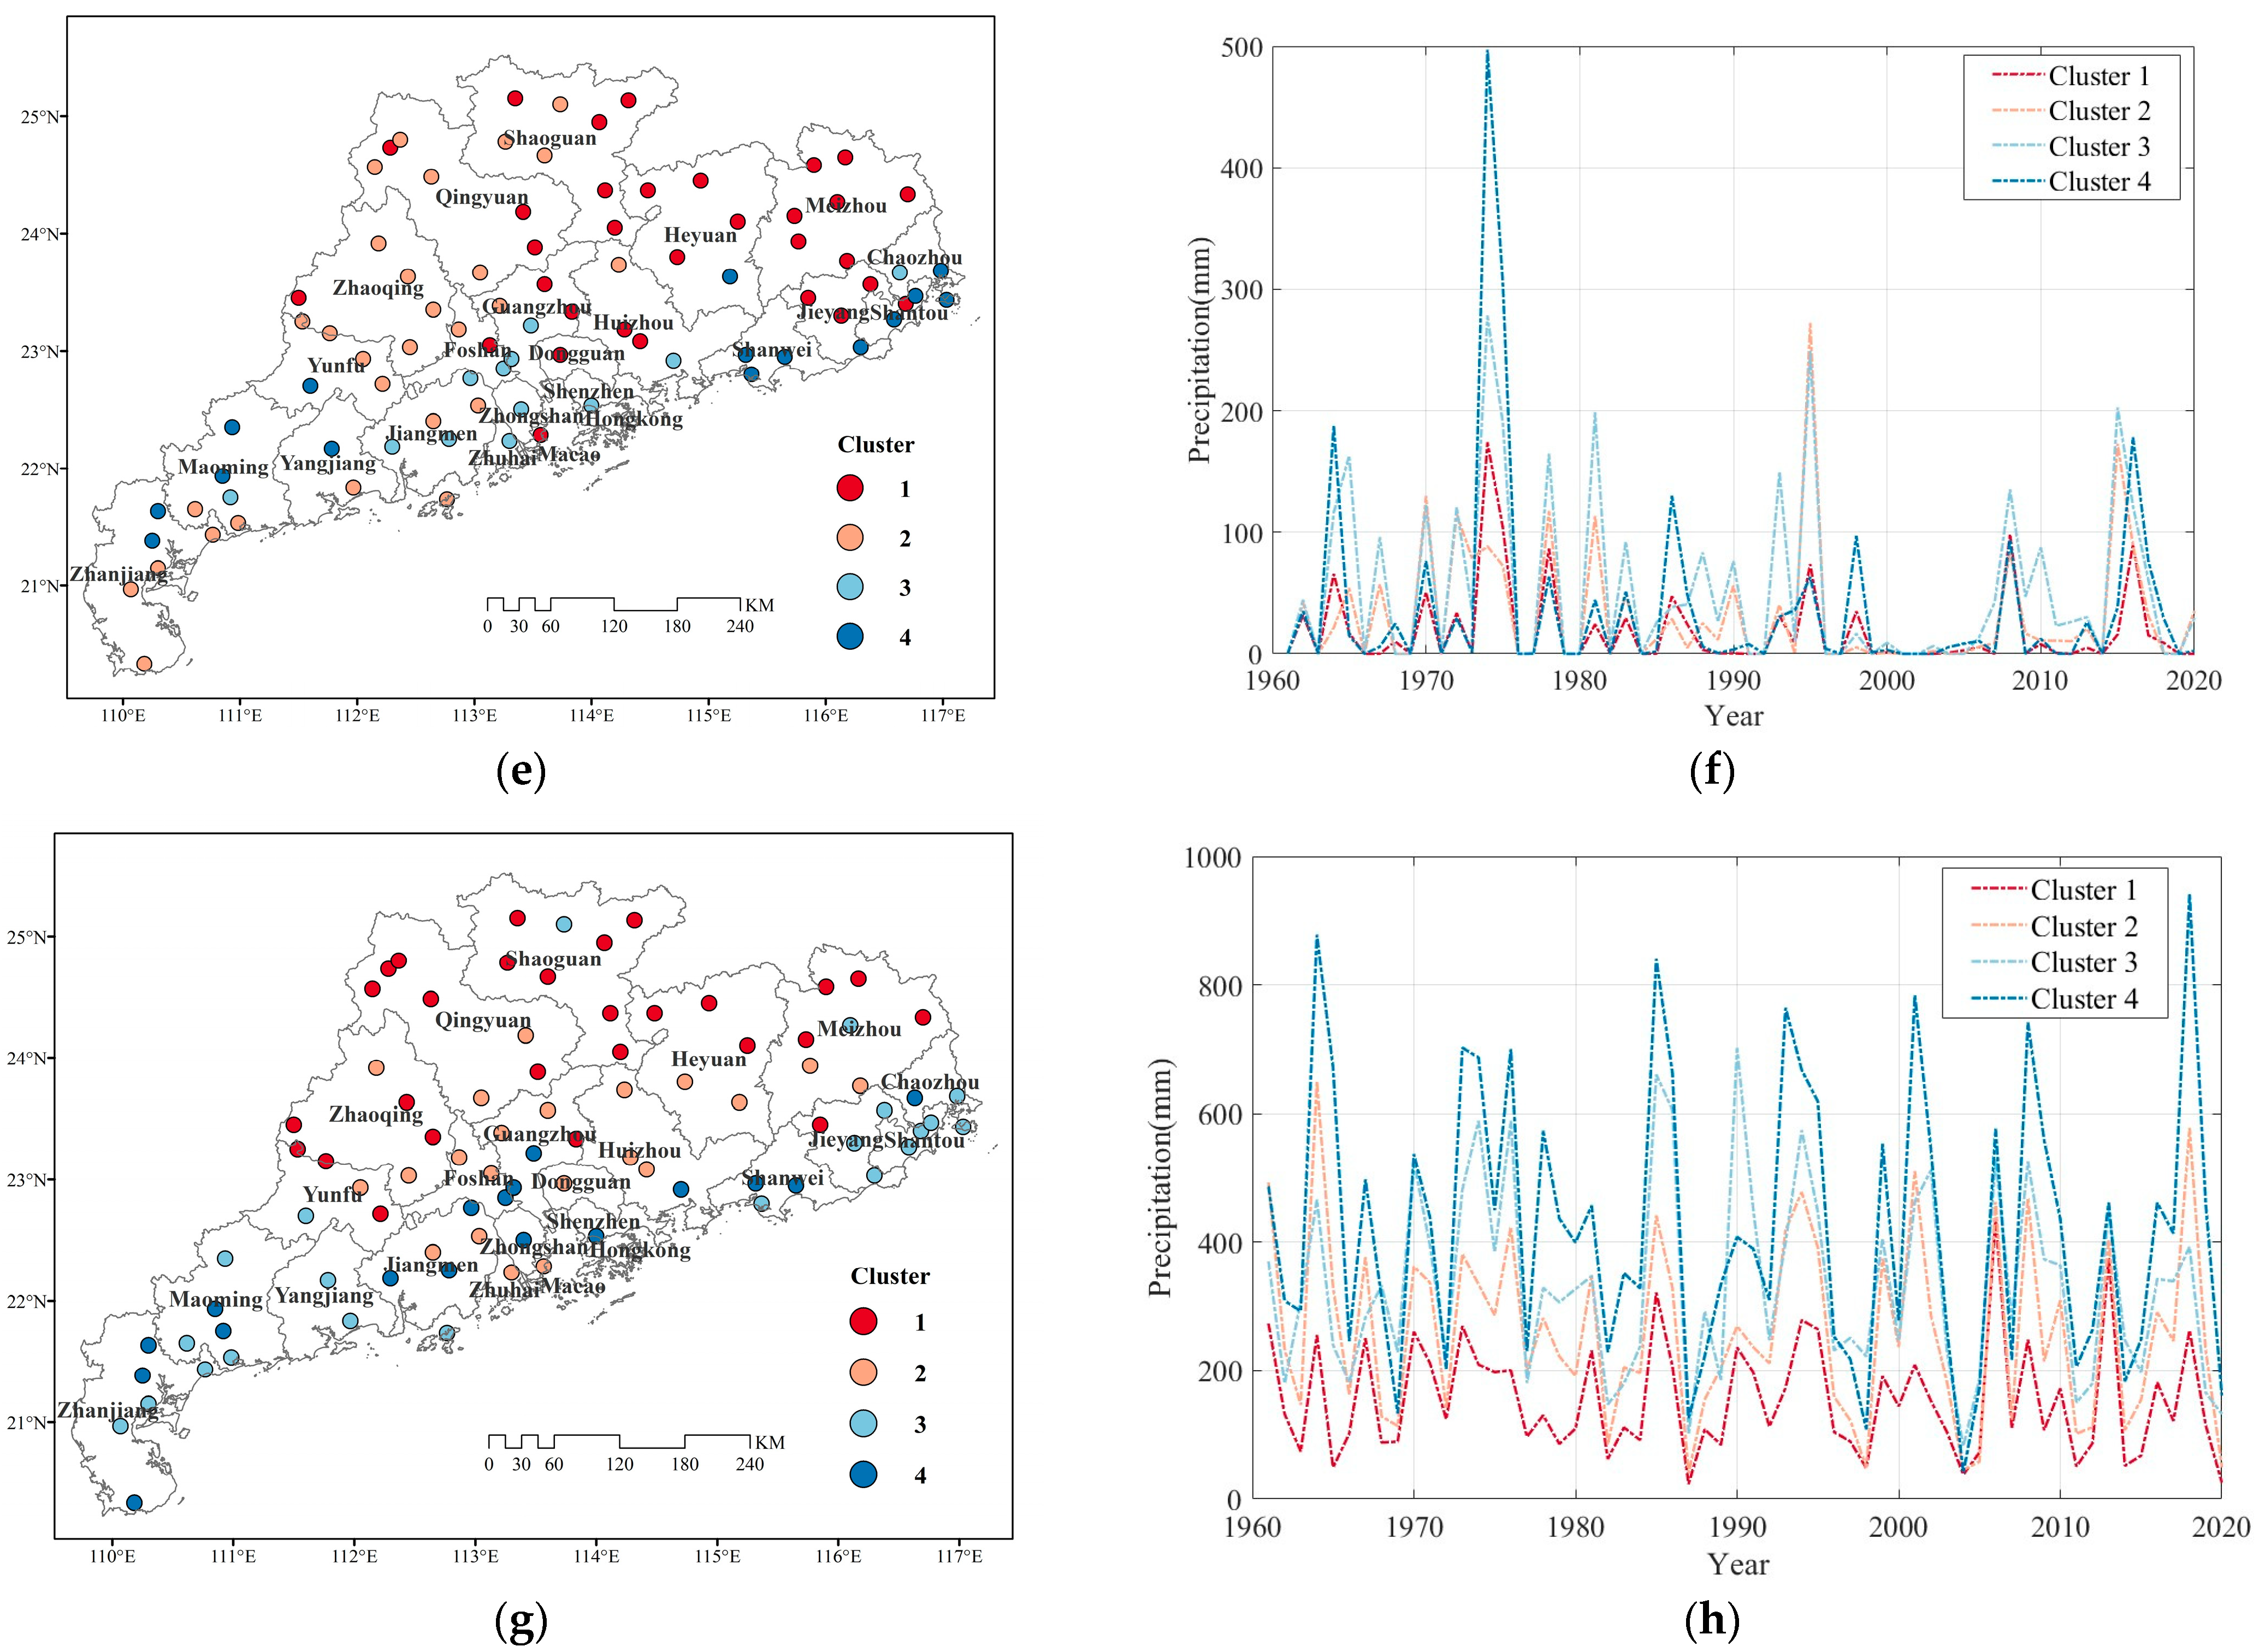
3.2.2. Time-Series Clustering of TC Precipitation at the Various Stations

To explore the differences in TC precipitation time series among stations for the FRS, SRS, and NRS and for the WY, we used the k-medoids clustering algorithm to cluster the 86 meteorological stations. According to the elbow method and the silhouette coefficient, the optimal clustering number was determined to be four. The following table shows the basic characteristics (the maximum value, minimum value, mean value, range, standard deviation σ , slope k, and the significance test p value) of the average time-series curve corresponding to the four clusters of stations for the FRS, SRS, and NRS, and for the WY Table 3. Concerning the four different periods, the TC precipitation values all increase from Cluster 1 to Cluster 4; meanwhile, the standard deviation, which indicates the inter-annual variations in TC precipitation, also increase. The TC precipitation of four clusters in the FRS all show an increasing trend with time (with a slope k greater than 0), while the TC precipitation of the four clusters in the SRS and NRS and for the WY all show a decreasing trend over time (with a slope k of less than 0), but none of them are statistically significant.
Figure 10 shows the spatial distribution of the four clusters of stations in the FRS, SRS, and NRS, and for the WY, respectively, as well as the corresponding curves of the averaged TC precipitation time series. It is evident that the spatial distribution continuity of the different clusters is not strong for all four periods, but the overall distribution pattern is similar. Stations with more TC precipitation and large inter-annual fluctuations are often distributed in coastal areas, while stations with less TC precipitation and small inter-annual fluctuations are distributed in inland areas. There are also some differences between the four periods. Regarding the FRS, Cluster 4, with the largest fluctuations, is mainly concentrated in Guangzhou, Zhuhai, Shenzhen, Dongguan, and Zhongshan near the Pearl River estuary. Regarding the NRS, Cluster 4, with the largest fluctuations, mainly appears in Maoming and Zhanjiang in western Guangdong, and in Shanwei, Jieyang, Shantou, and Chaozhou in eastern Guangdong, while for the SRS and the WY, Cluster 4, with the largest fluctuations, is distributed throughout the coastal zone of Guangdong. The stations in Cluster 4 often experienced abundant TC precipitation, but the inter-annual variation was also quite apparent, which indicates strong uncertainty. Therefore, more attention should be paid to these stations in terms of the practices regarding flood disaster prevention and mitigation. However, the focus areas should be adjusted for different periods of the year according to the results of the clustering analysis.
In addition, the specific trend of the time series of different stations may also be different, even when they are part of the same cluster. For example, in the case of Cluster 3 in the WY, the TC precipitation values at Huilai Station in Jieyang show a downward trend over the past 60 years, while the precipitation values at Leizhou Station in Zhanjiang show an upward trend. Regarding the Cluster 4 values for the WY, the TC precipitation at Shenzhen station shows an overall upward trend over the past 60 years, while the TC precipitation values at Lufeng station in Shanwei show a downward trend. For most of the stations in Guangdong Province, the changes in their TC precipitation in the past 60 years mainly comprised inter-annual fluctuations, but there was no significant increasing or decreasing trend.

4. Discussion

In this study, we found that both the TC frequency and the TC precipitation in Guangdong Province showed a decreasing trend over the past 60 years. This finding is consistent with those reported by most of the existing studies [15,22,23,47]. Moreover, some studies have found that the annual TC precipitation decreased notably over southern China, including Hainan Island, but increased significantly over southeastern and eastern China [9,47,52,53,54,55]. This difference may be attributed to the anomalous warming of global sea surface temperatures (SSTs) after 1995, which led to a decreased relative vorticity and an increased vertical wind shear. These atmospheric factors resulted in the strong westerly subtropical high pressure in the western Pacific Ocean, the weakening of the easterly flow in the northern part of the South China Sea, and, at the same time, a significant reduction in the water vapor intermixing along the South China region, which is unfavorable for the movement of TCs toward the South China region [22,47,56]. Additionally, the abrupt decrease in the annual number of TC landfalls in southern China is also related to the abrupt decrease of TC events with westward track during the post-peak season (from October to December), while the abrupt increase in southeastern China is related to the abrupt increase of TC events with northwestward track during the peak season (from July to September) [56].
Some recent studies have argued that the trend in TC precipitation in some areas could be related to a reduction in the translation speed of TCs [55]. In this study, we calculated the translation speed and the power dissipation index (PDI) [57] of the TCs affecting Guangdong. The results show that there was an insignificant decreasing trend for both these variables, but neither of them showed a correlation with the TC frequency or with TC precipitation.
The EOF analysis suggests that there are three primary spatial distribution modes related to the TC precipitation in Guangdong. This finding is also consistent with the study by Luo et al., which focused on the climatic characteristics of precipitation that were associated with the TC that landed in South China from 1960 to 2016 [22].
The use of different datasets may lead to uncertainty in the results. In this study, the EOF analysis, spatial clustering, and time-series clustering were based on the average values for TC precipitation over a 60-year period and the inter-annual variations in TC precipitation. The results are therefore relatively stable. Conversely, the traditional trend analysis may be impacted by the length of the time series. To test the validity of the study’s conclusions, we examined the trends in TC frequency and TC precipitation when different durations of time-series data were used. By dividing the period from 1961 to 2020 into a 10-year basis, a total of 20 time intervals can be selected, with the shortest being 10 years and the longest being 60 years. Although most of the time intervals showed the same decreasing trend in TC frequency and TC precipitation, only three of them, namely the periods from 1961 to 2010, from 1971 to 2010, and from 1971 to 2020, were significant. This indicates that the selection of a particular study period does have an impact on the trend analysis results.
Differences in clustering methods may also have an impact on the results. A comparison of the attribute-based spatial clustering method used in this study with a non-attribute-based spatial clustering method shows that the method used in this study produces smaller variations in precipitation at similar stations and larger variations in precipitation between the different categories of stations. We also compared the k-medoids method used in this paper with another temporal clustering algorithm, k-shape. We found that although the clustering results obtained using the k-shape algorithm have better spatial continuity, the differentiation and interpretation of the mean curves of the different categories are worse. These comparison results prove that the clustering methods used in this study are reasonable.

5. Conclusions

In this study, we adopted both statistical methods and cluster methods to explore the spatiotemporal characteristics of TC precipitation in Guangdong Province from 1961 to 2020. The main conclusions are as follows:
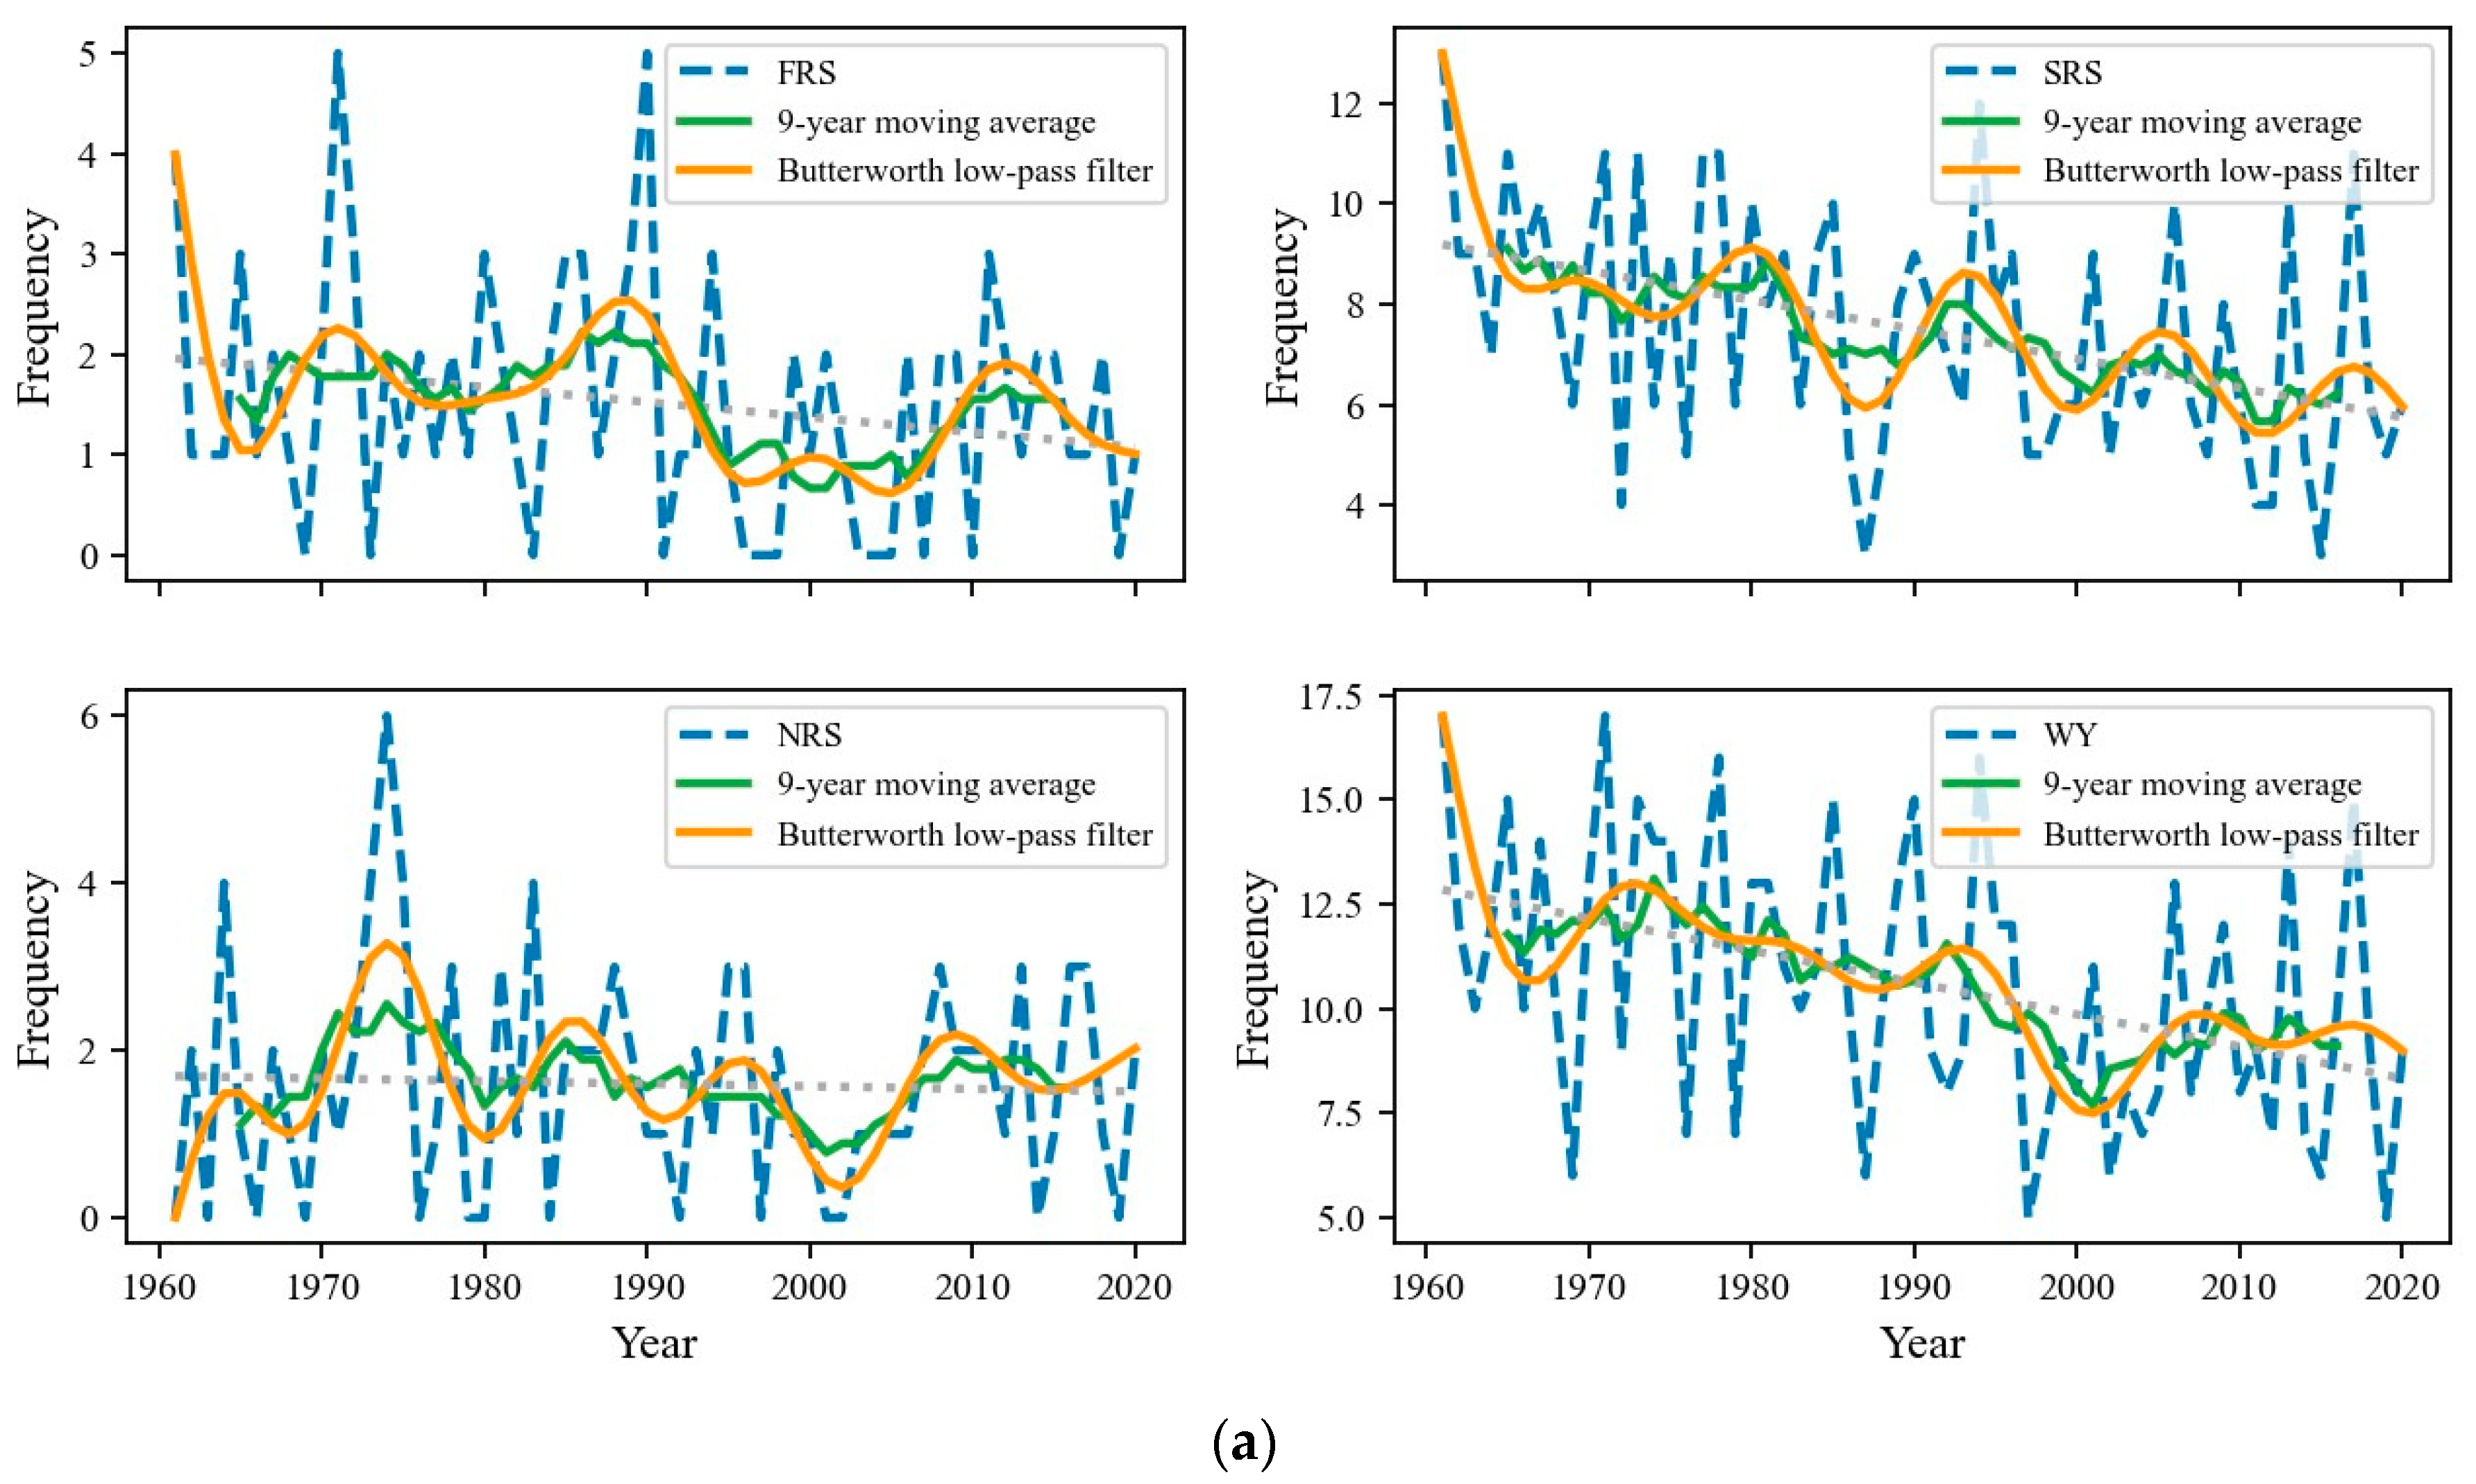
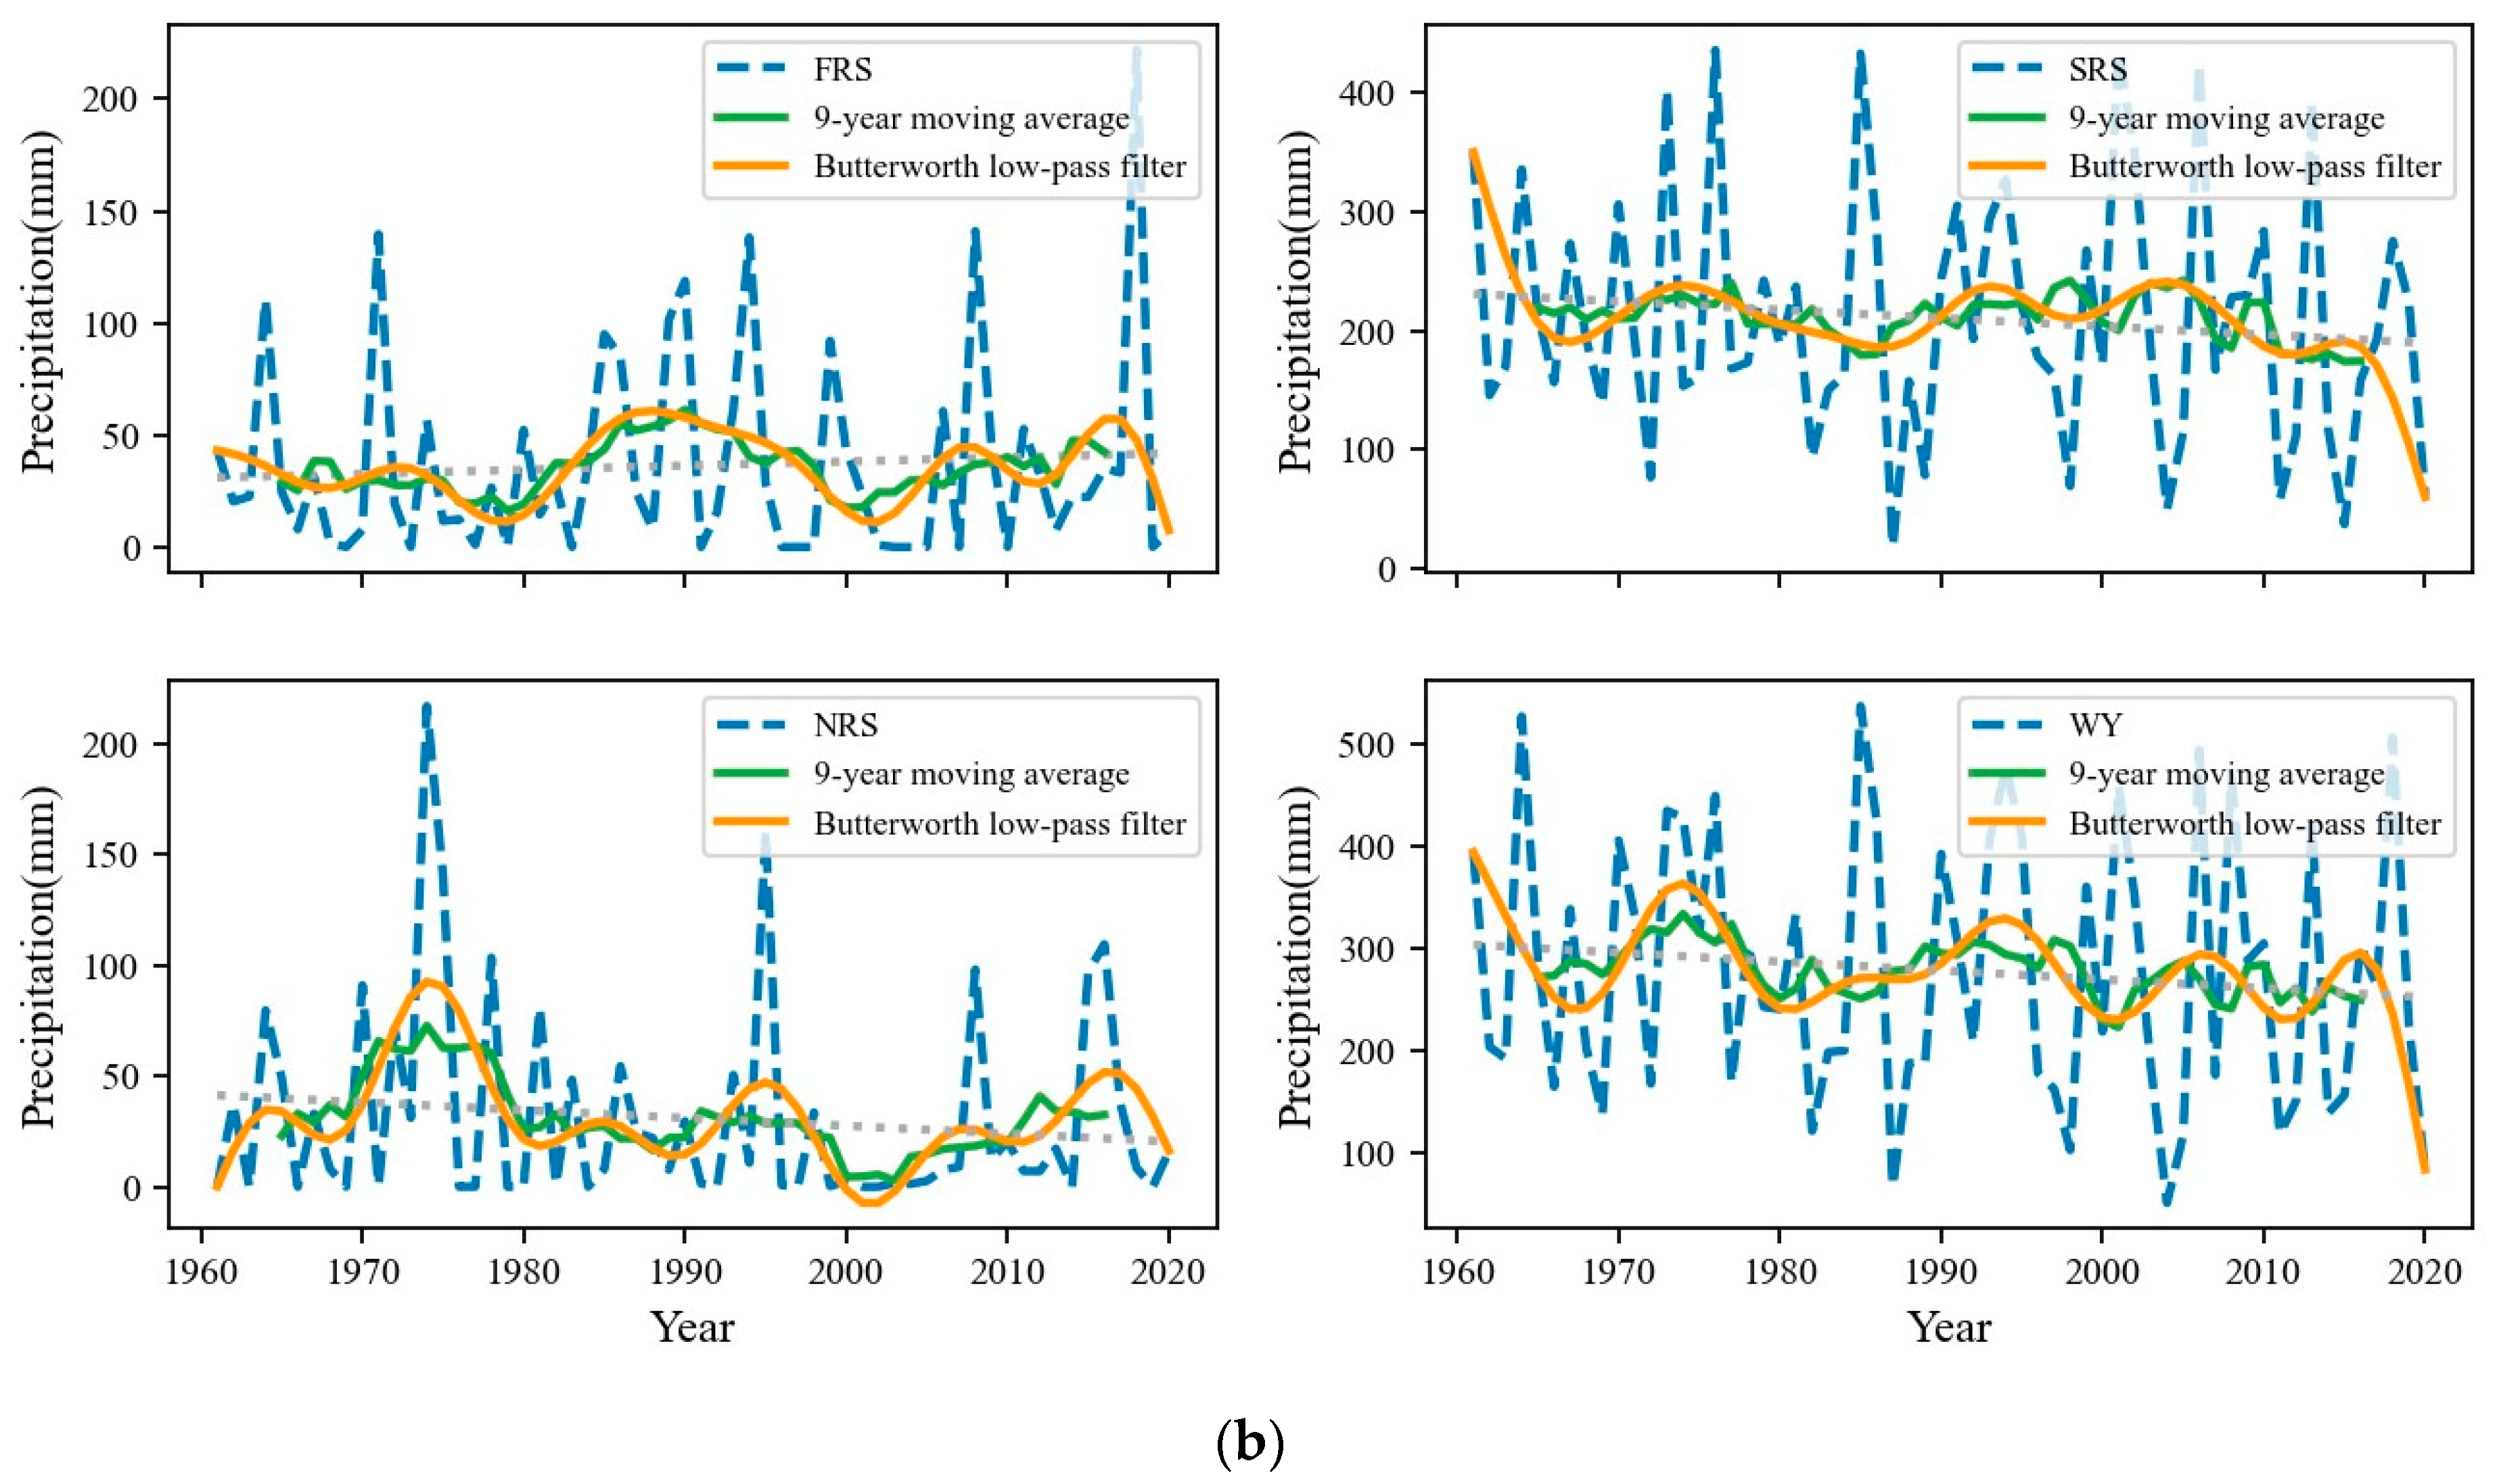
  • In the past 60 years, the TC and TC precipitation affecting Guangdong Province mainly occurred in the SRS. The number of TCs in the FRS, SRS, and NRS, and for the WY, along with the TC precipitation for the SRS and NRS and for the WY, all showed a decreasing trend. Conversely, the levels of TC precipitation in the FRS showed an increasing trend. The inter-annual fluctuations of TC frequency and TC precipitation were apparent, exhibiting a quasi-periodic variation.
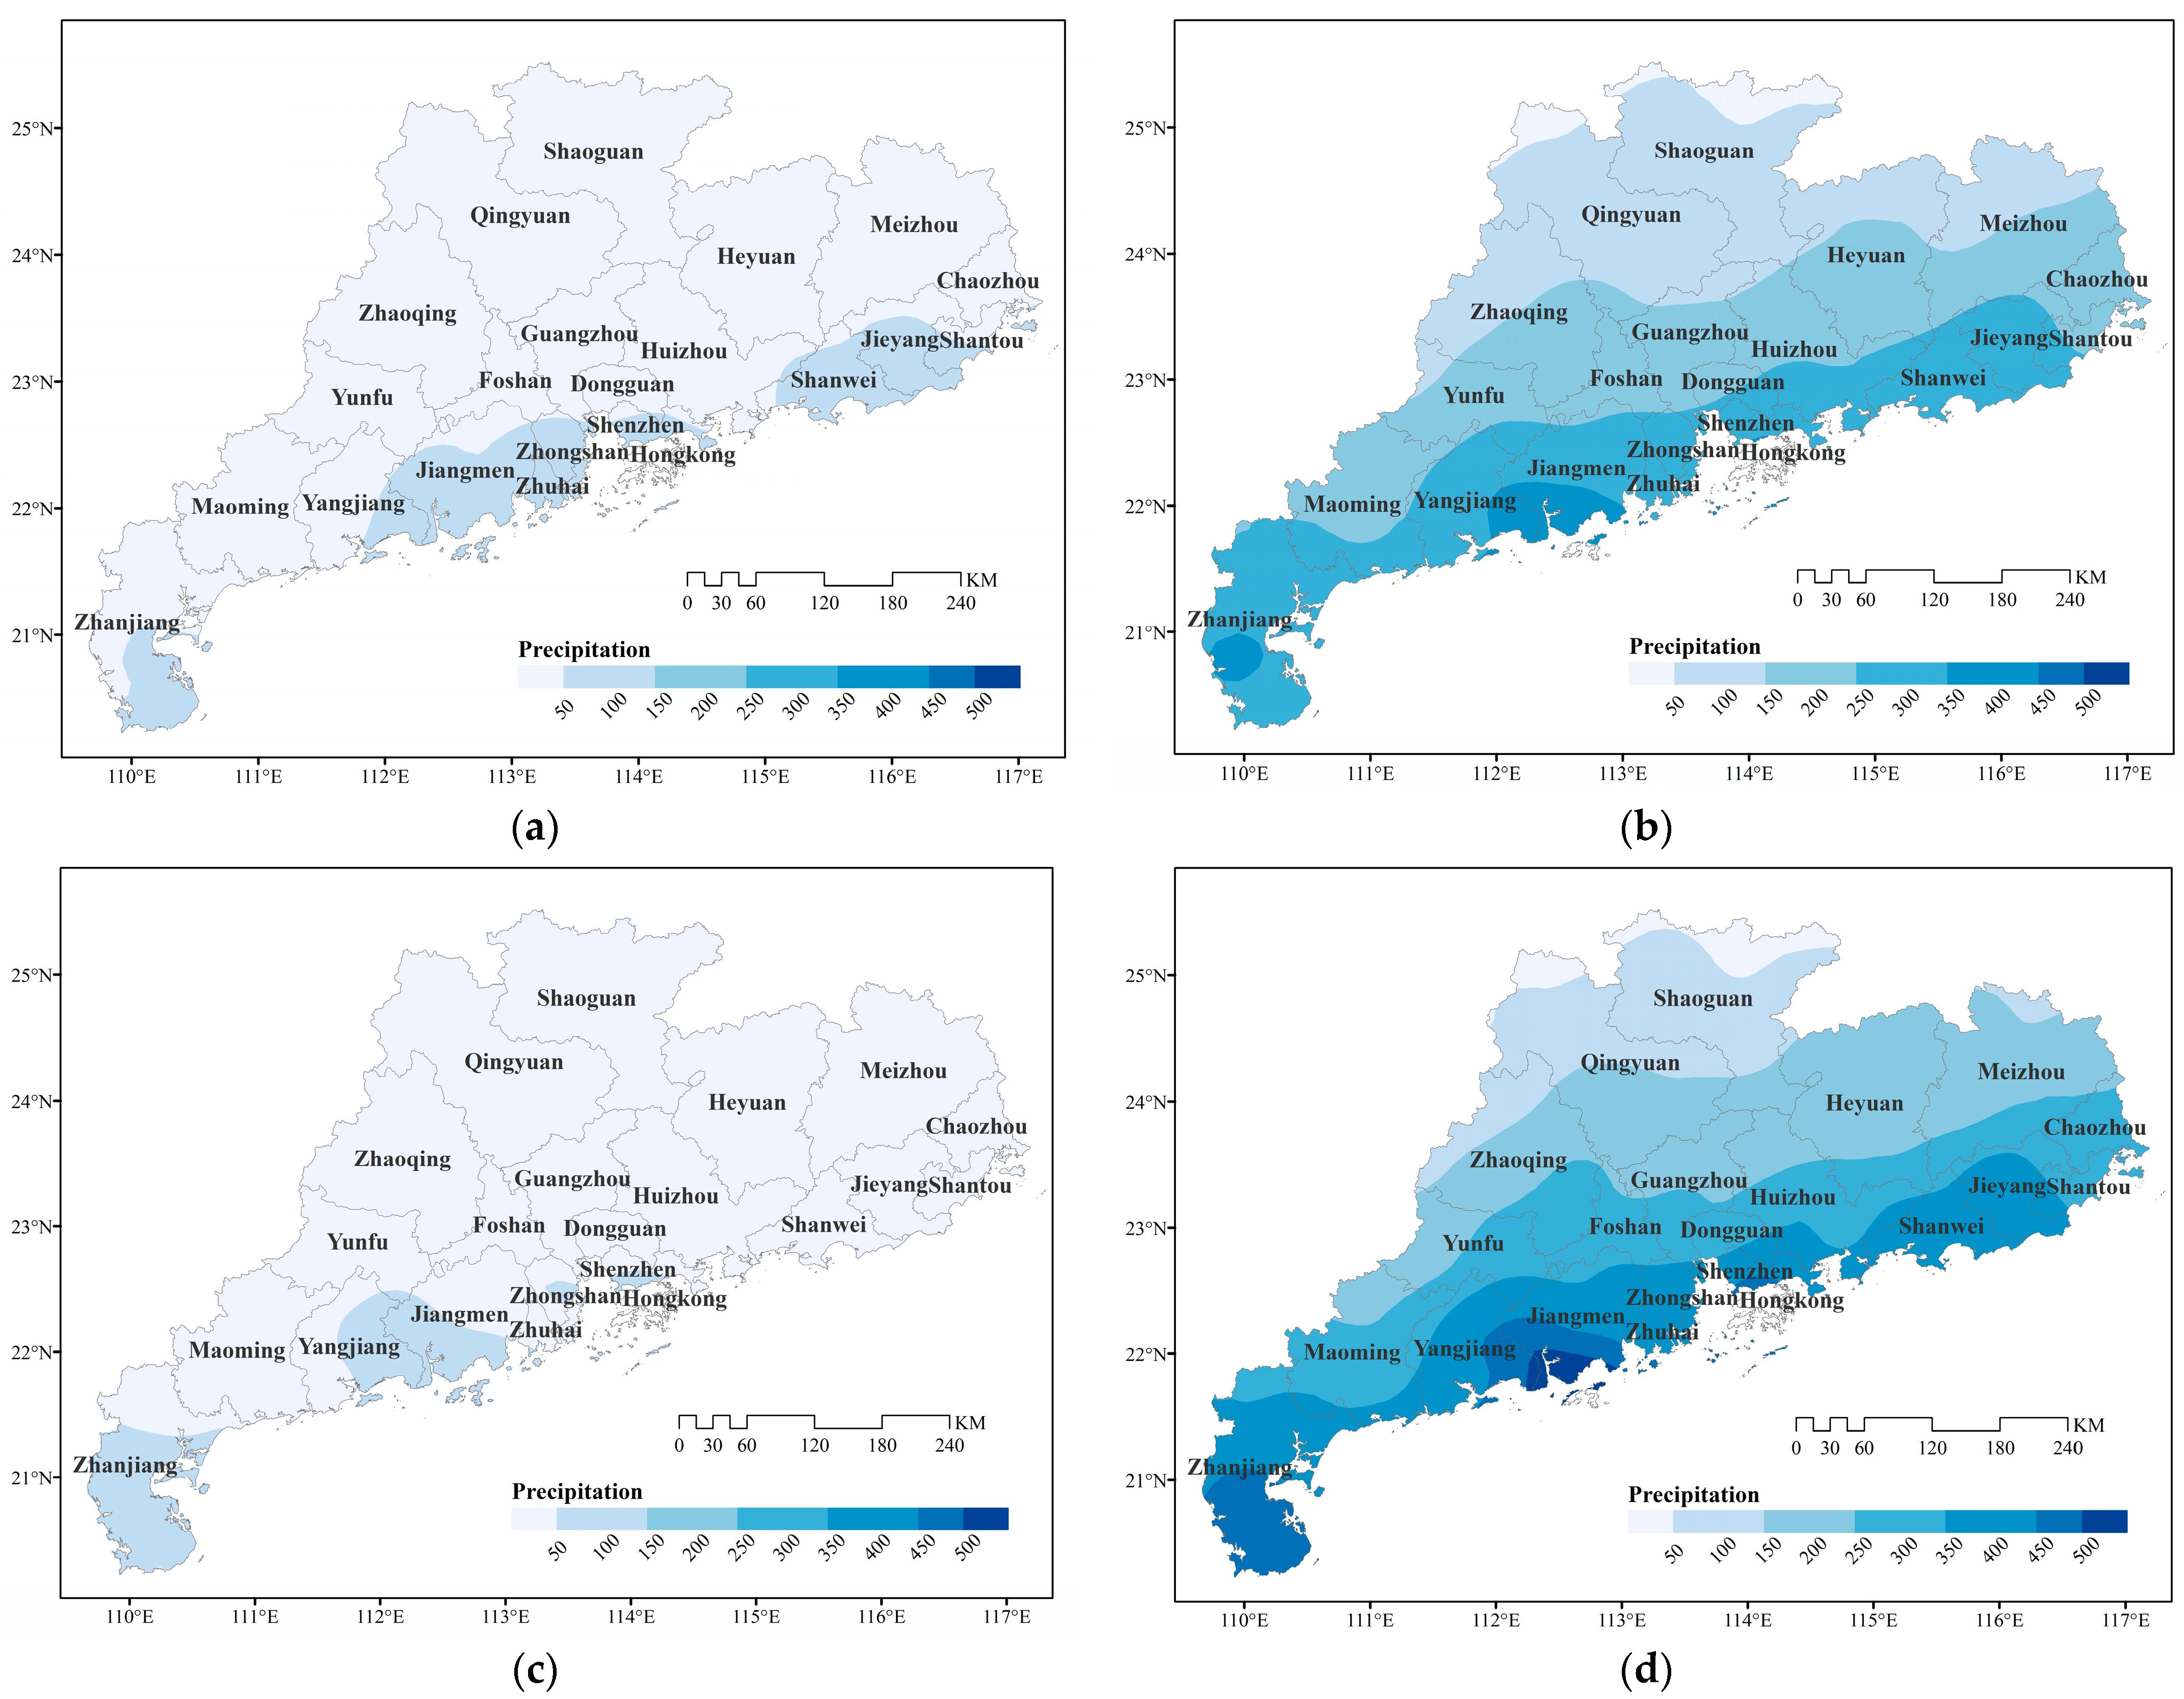
  • The TC precipitation values in the FRS, SRS, and NRS and those for the WY all showed a gradual decreasing trend from the coastal to the inland areas. Meanwhile, the western coastal areas received more TC precipitation than the eastern coastal areas in certain periods of the SRS and NRS and for the WY.
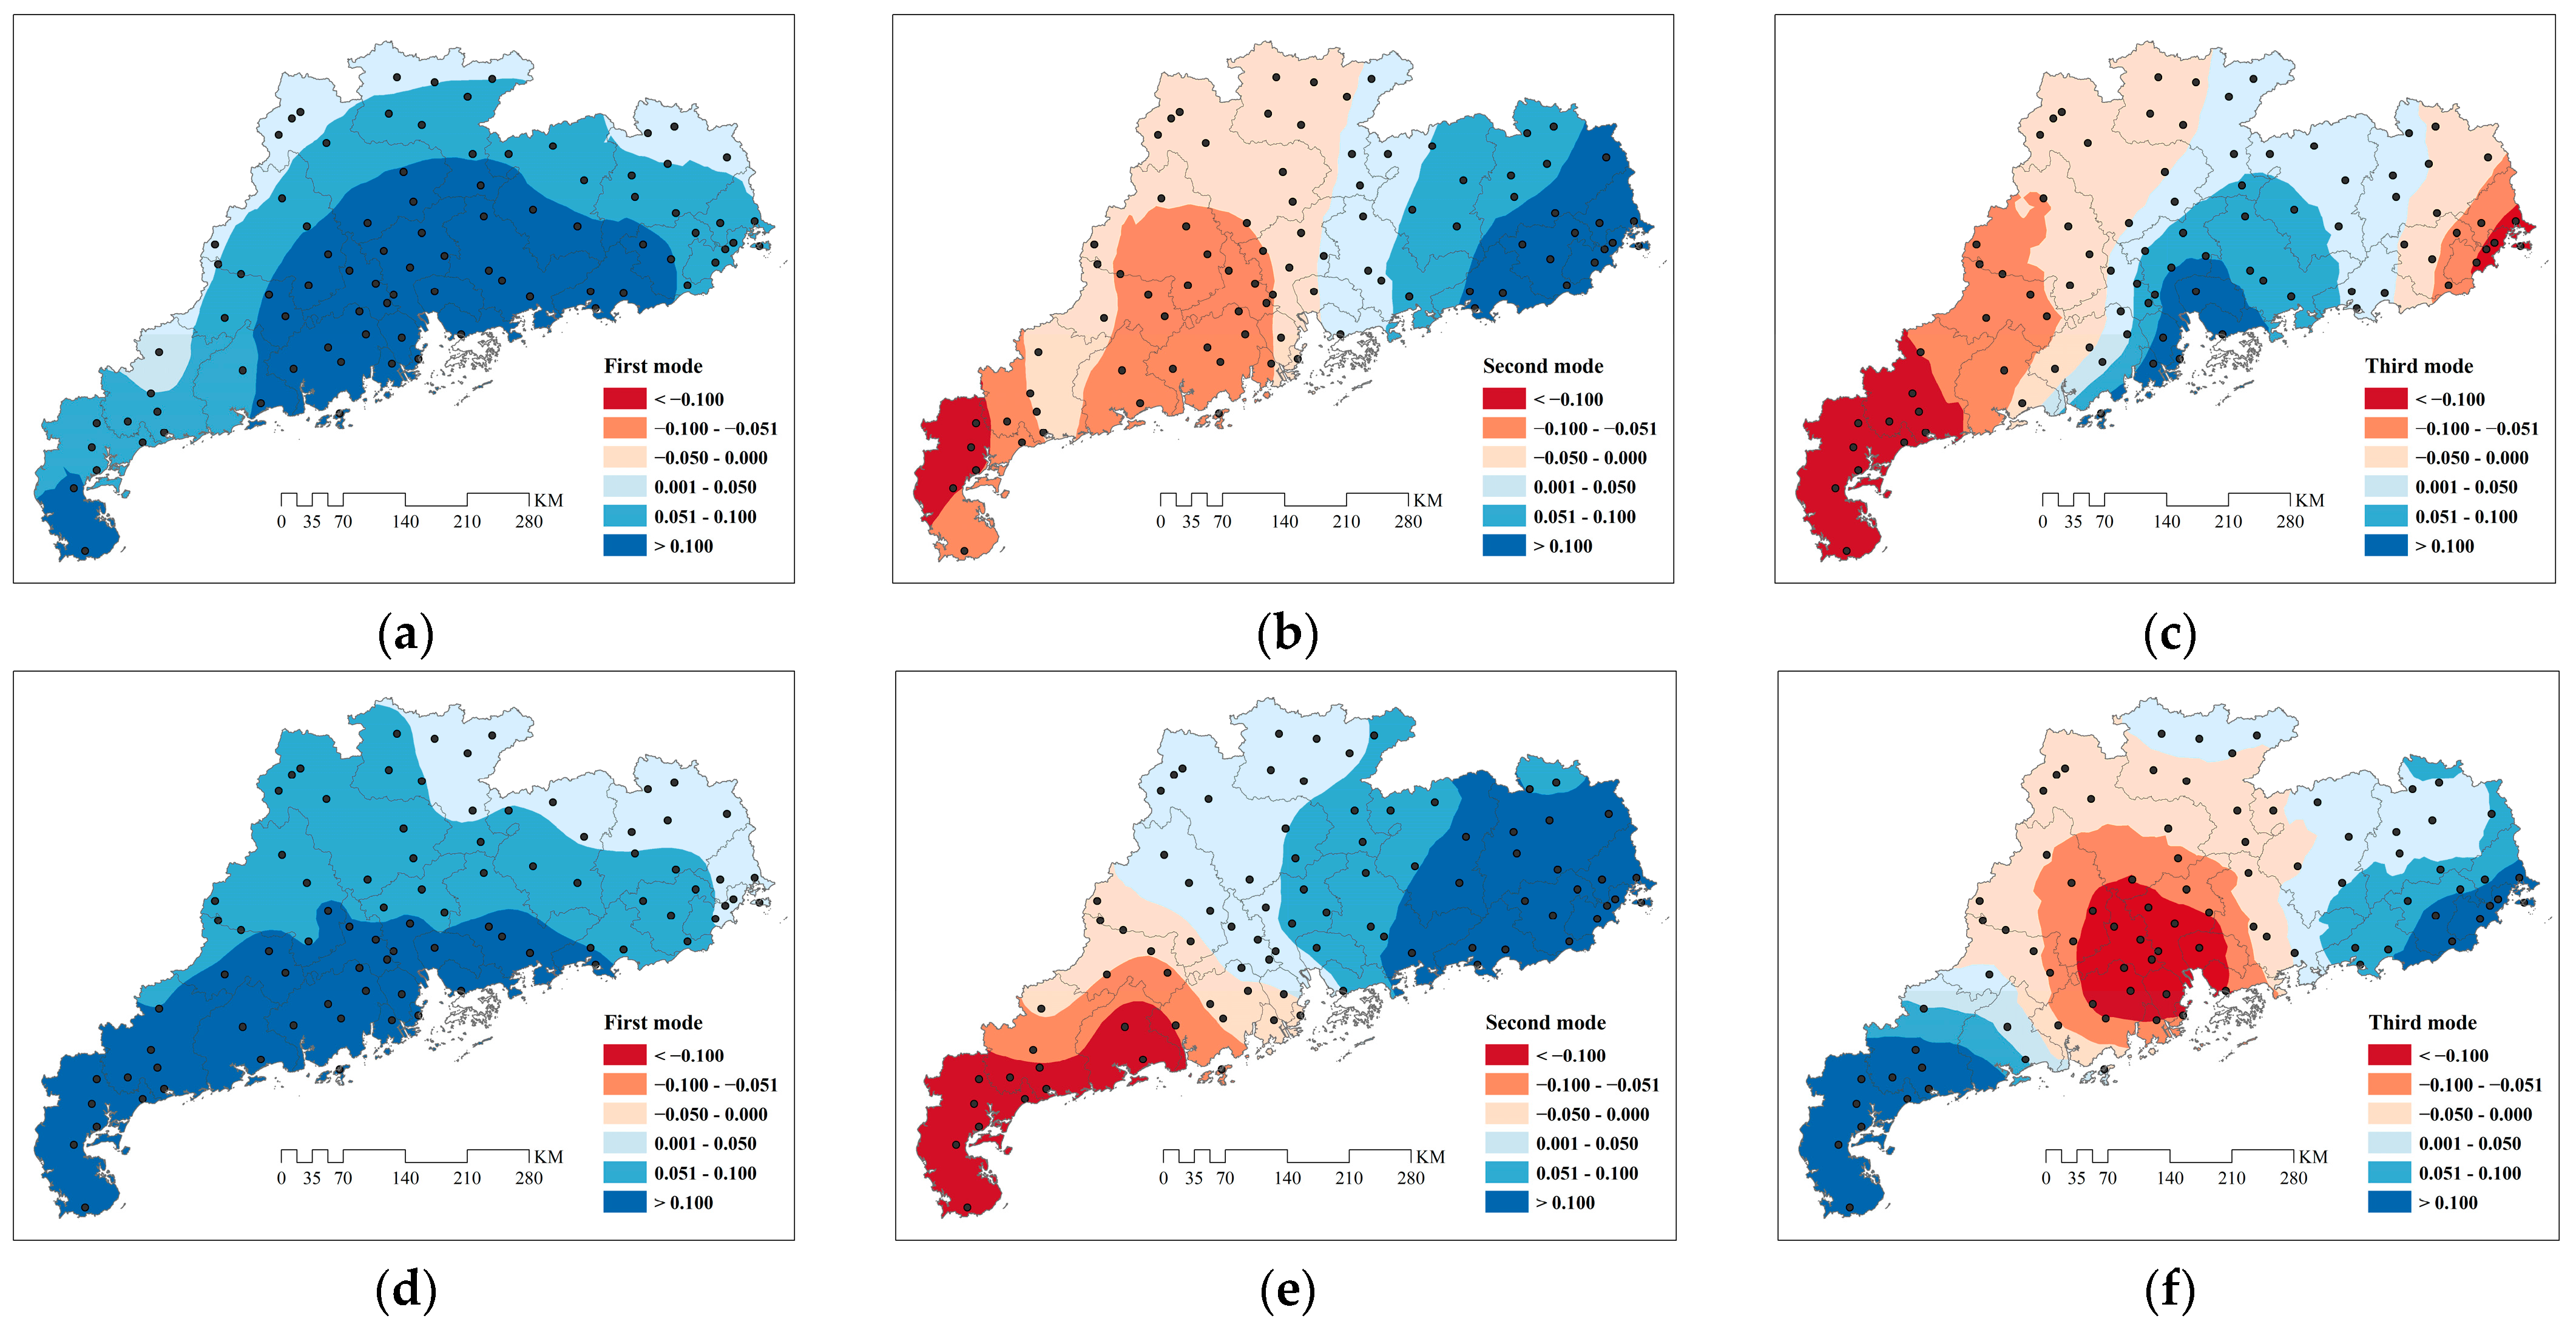
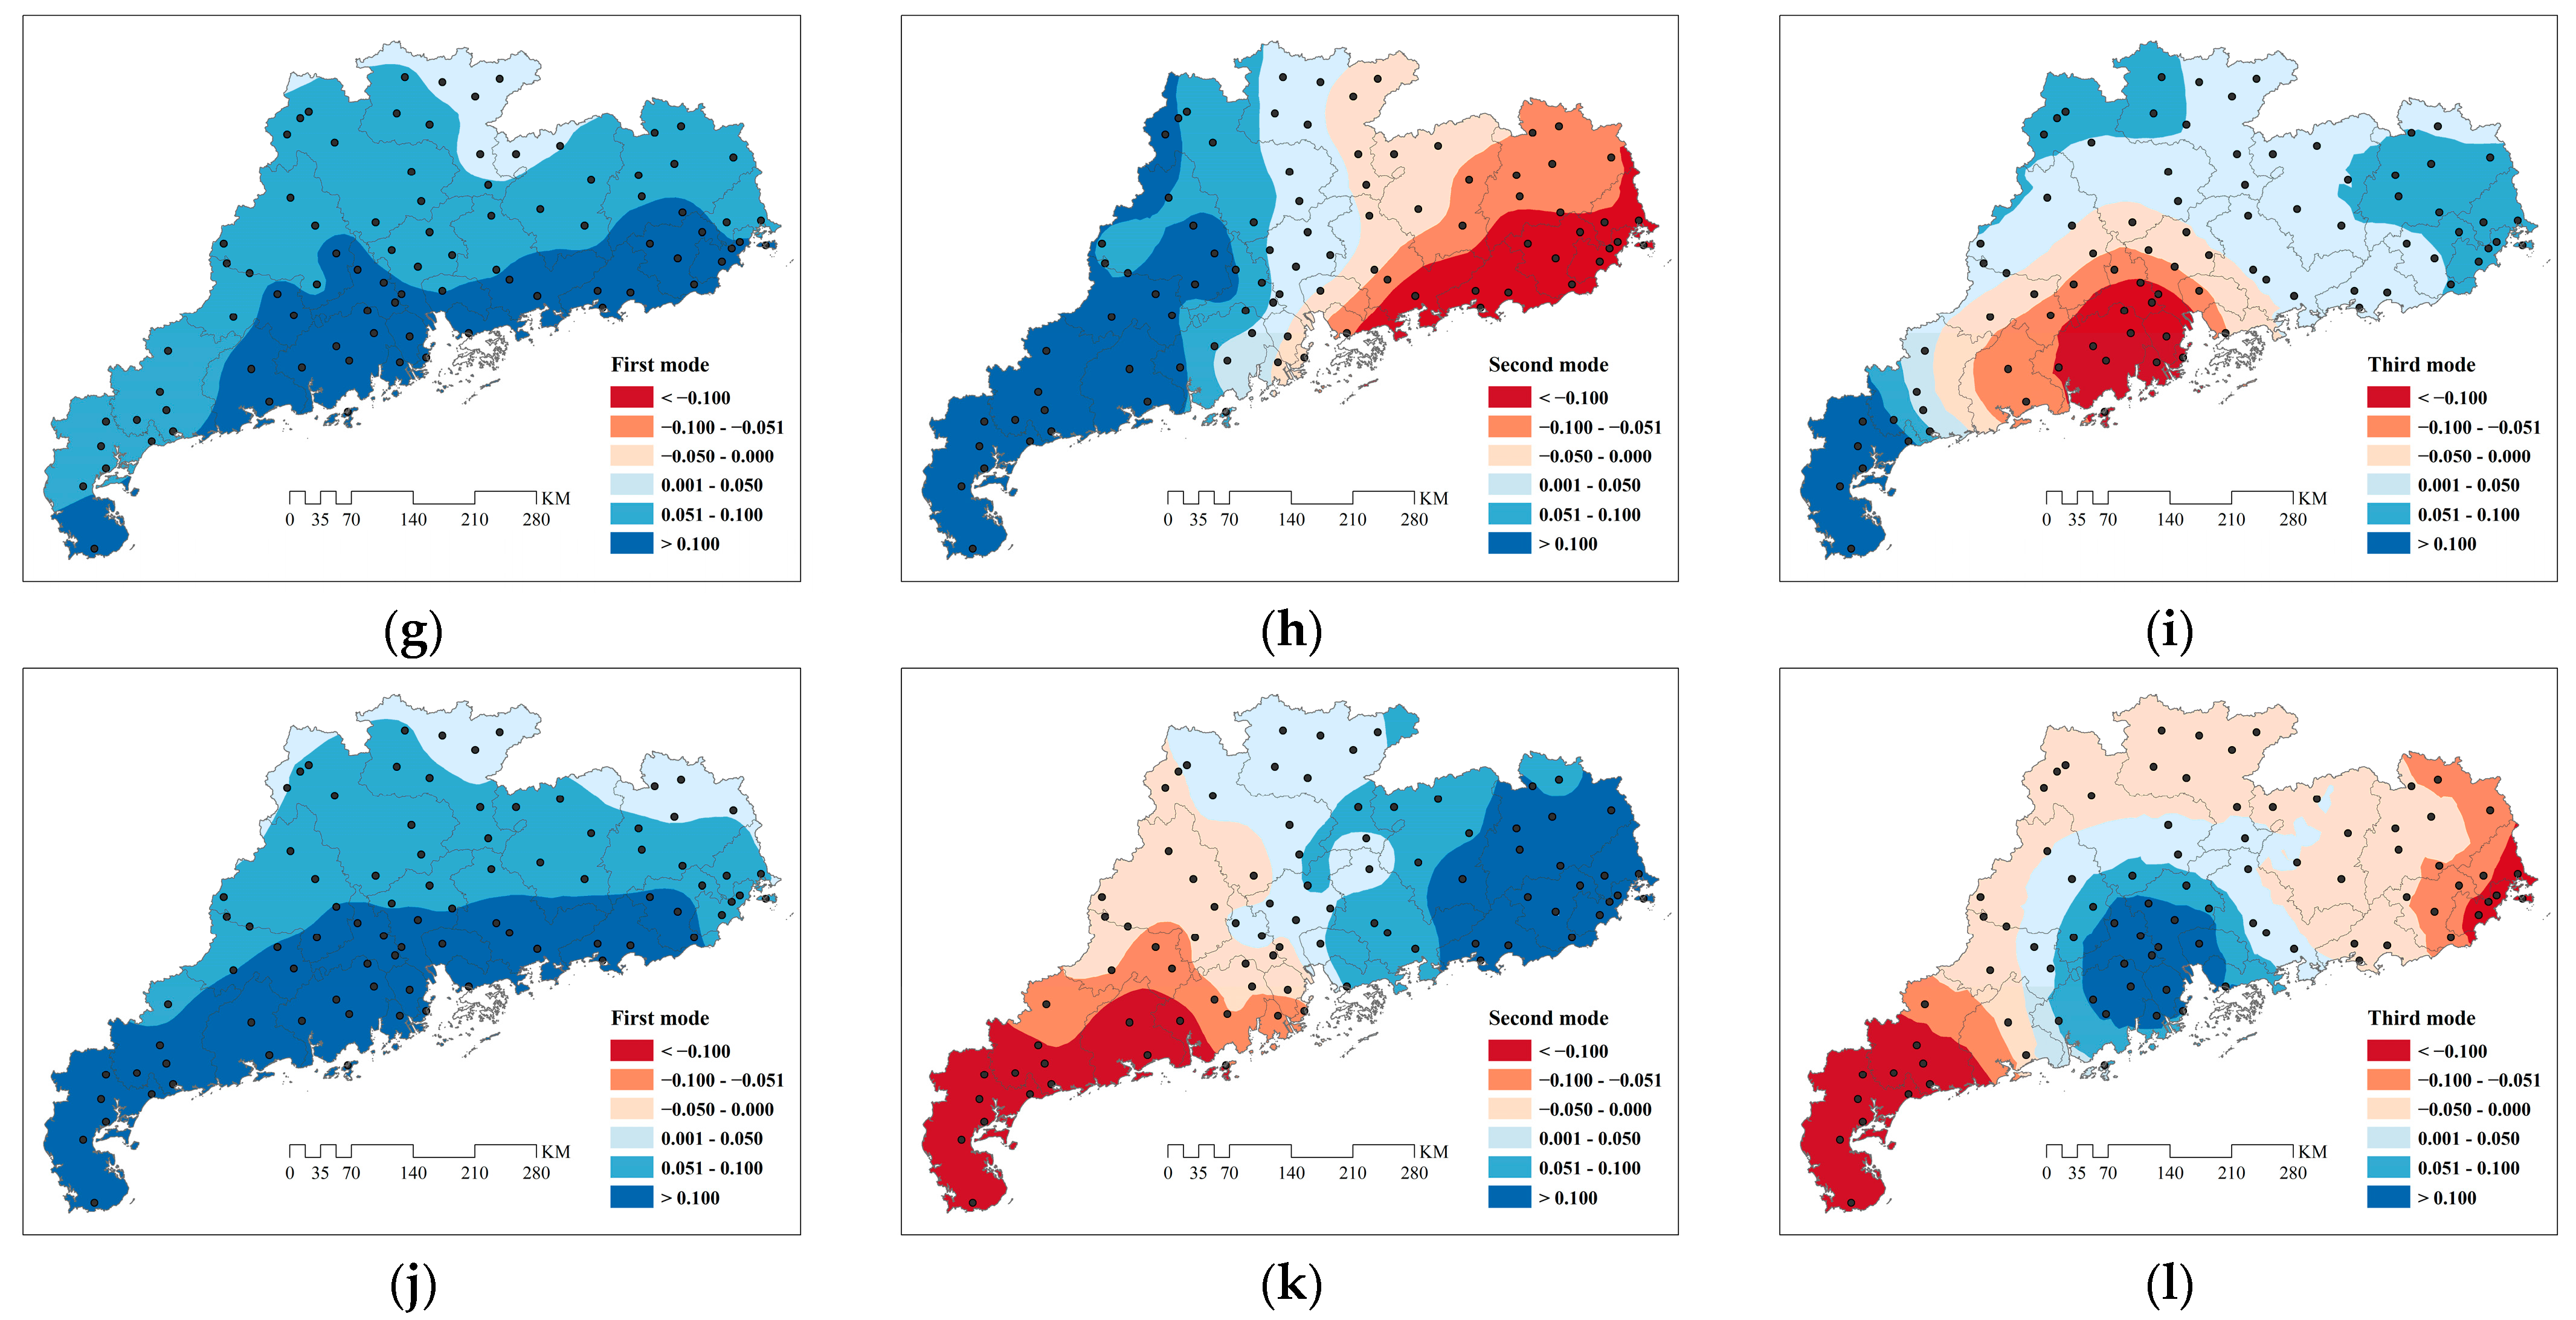
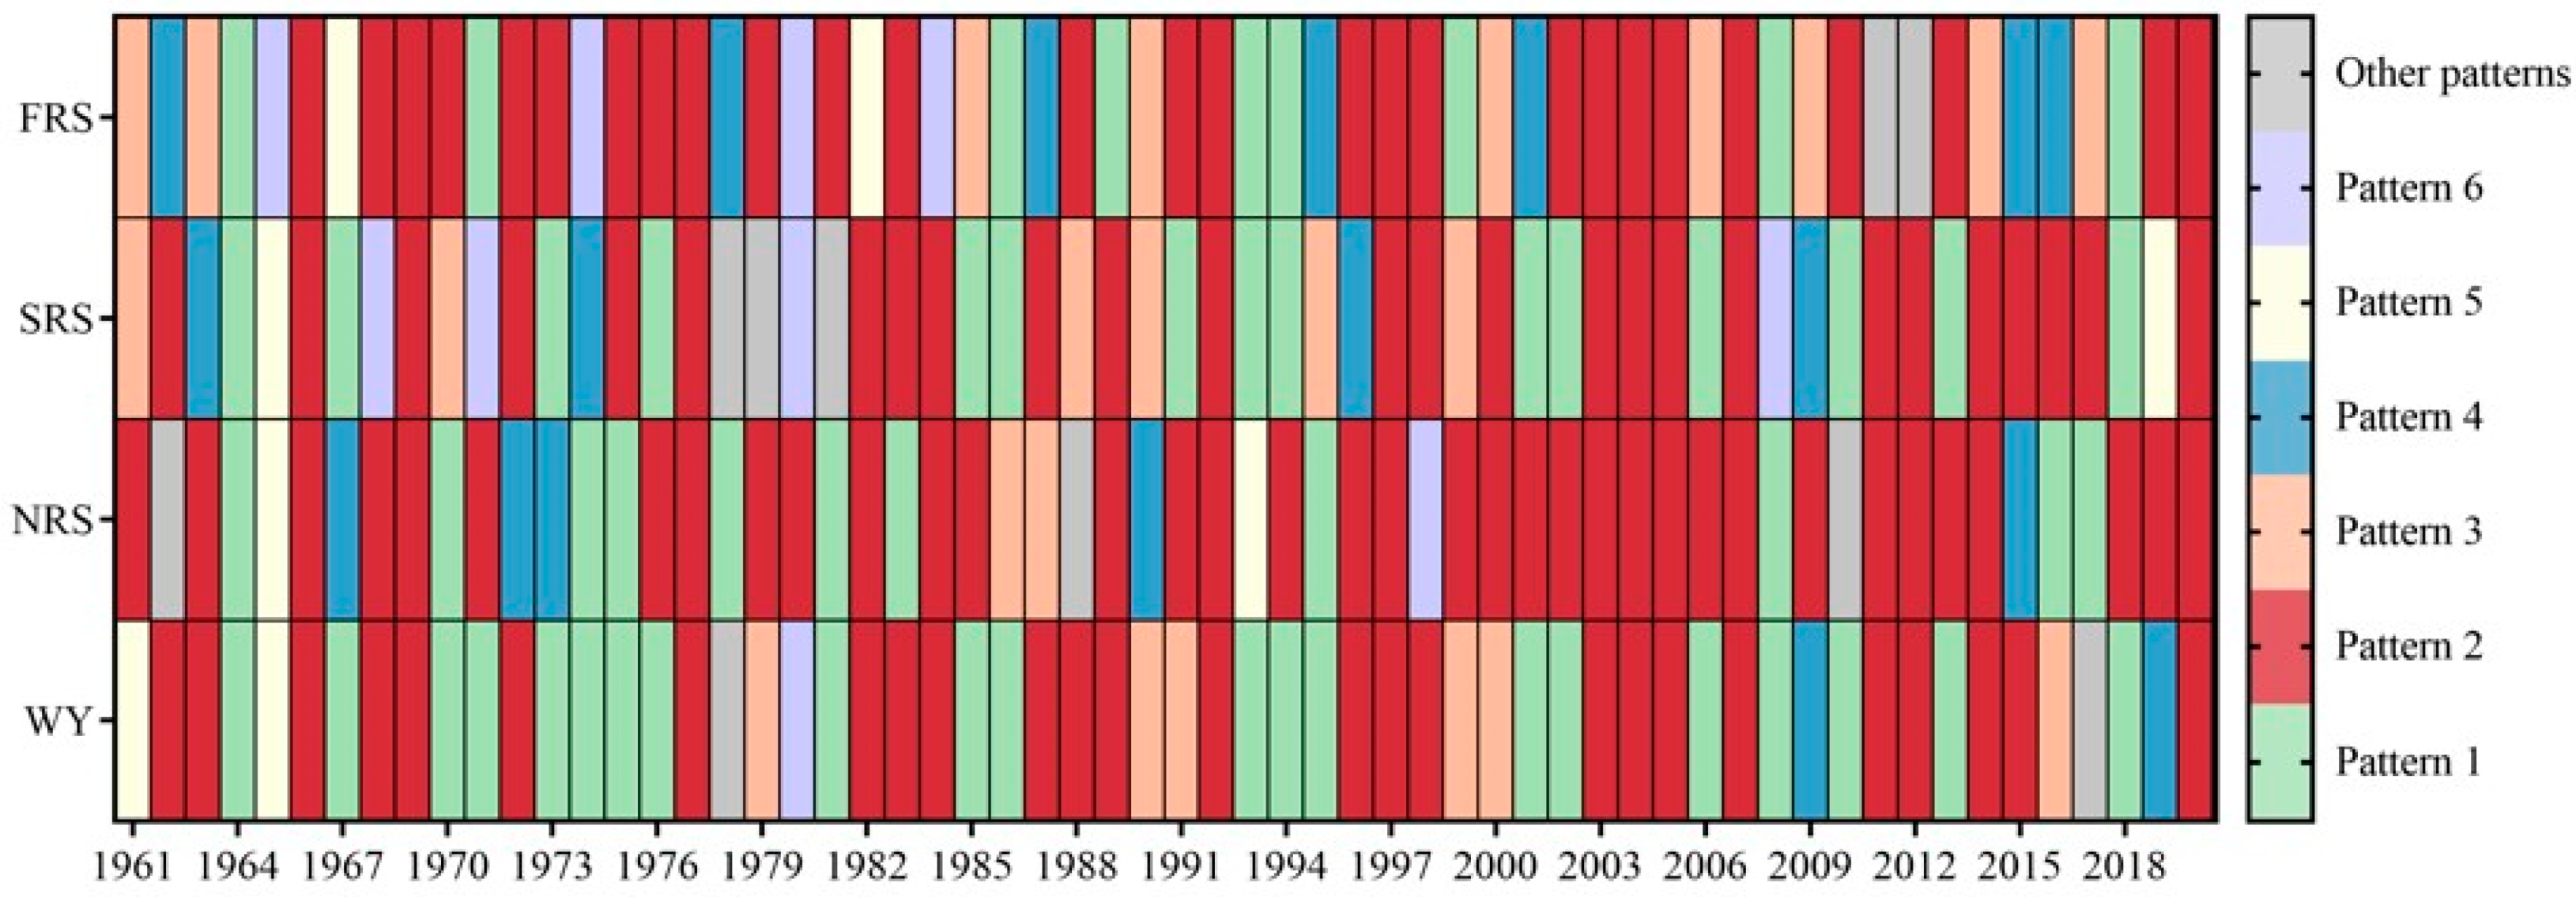
  • The spatial variations in TC precipitation in Guangdong in the four periods over the last six decades were quite similar, with three primary spatial modes and six patterns. In the case of the first mode, TC precipitation in the whole province was either consistently more than normal or consistently less than normal; in the second mode, there was either more TC precipitation in eastern Guangdong and less in western Guangdong, or less TC precipitation in eastern Guangdong and more in western Guangdong; in the third mode, the TC precipitation was either more than normal in the central region of Guangdong and there was less precipitation in the eastern and western regions of Guangdong, or there was less precipitation in the central region of Guangdong and more precipitation in the eastern and western regions. Among these patterns, the spatial distribution pattern of TC precipitation being less than normal over the whole province is the most common.
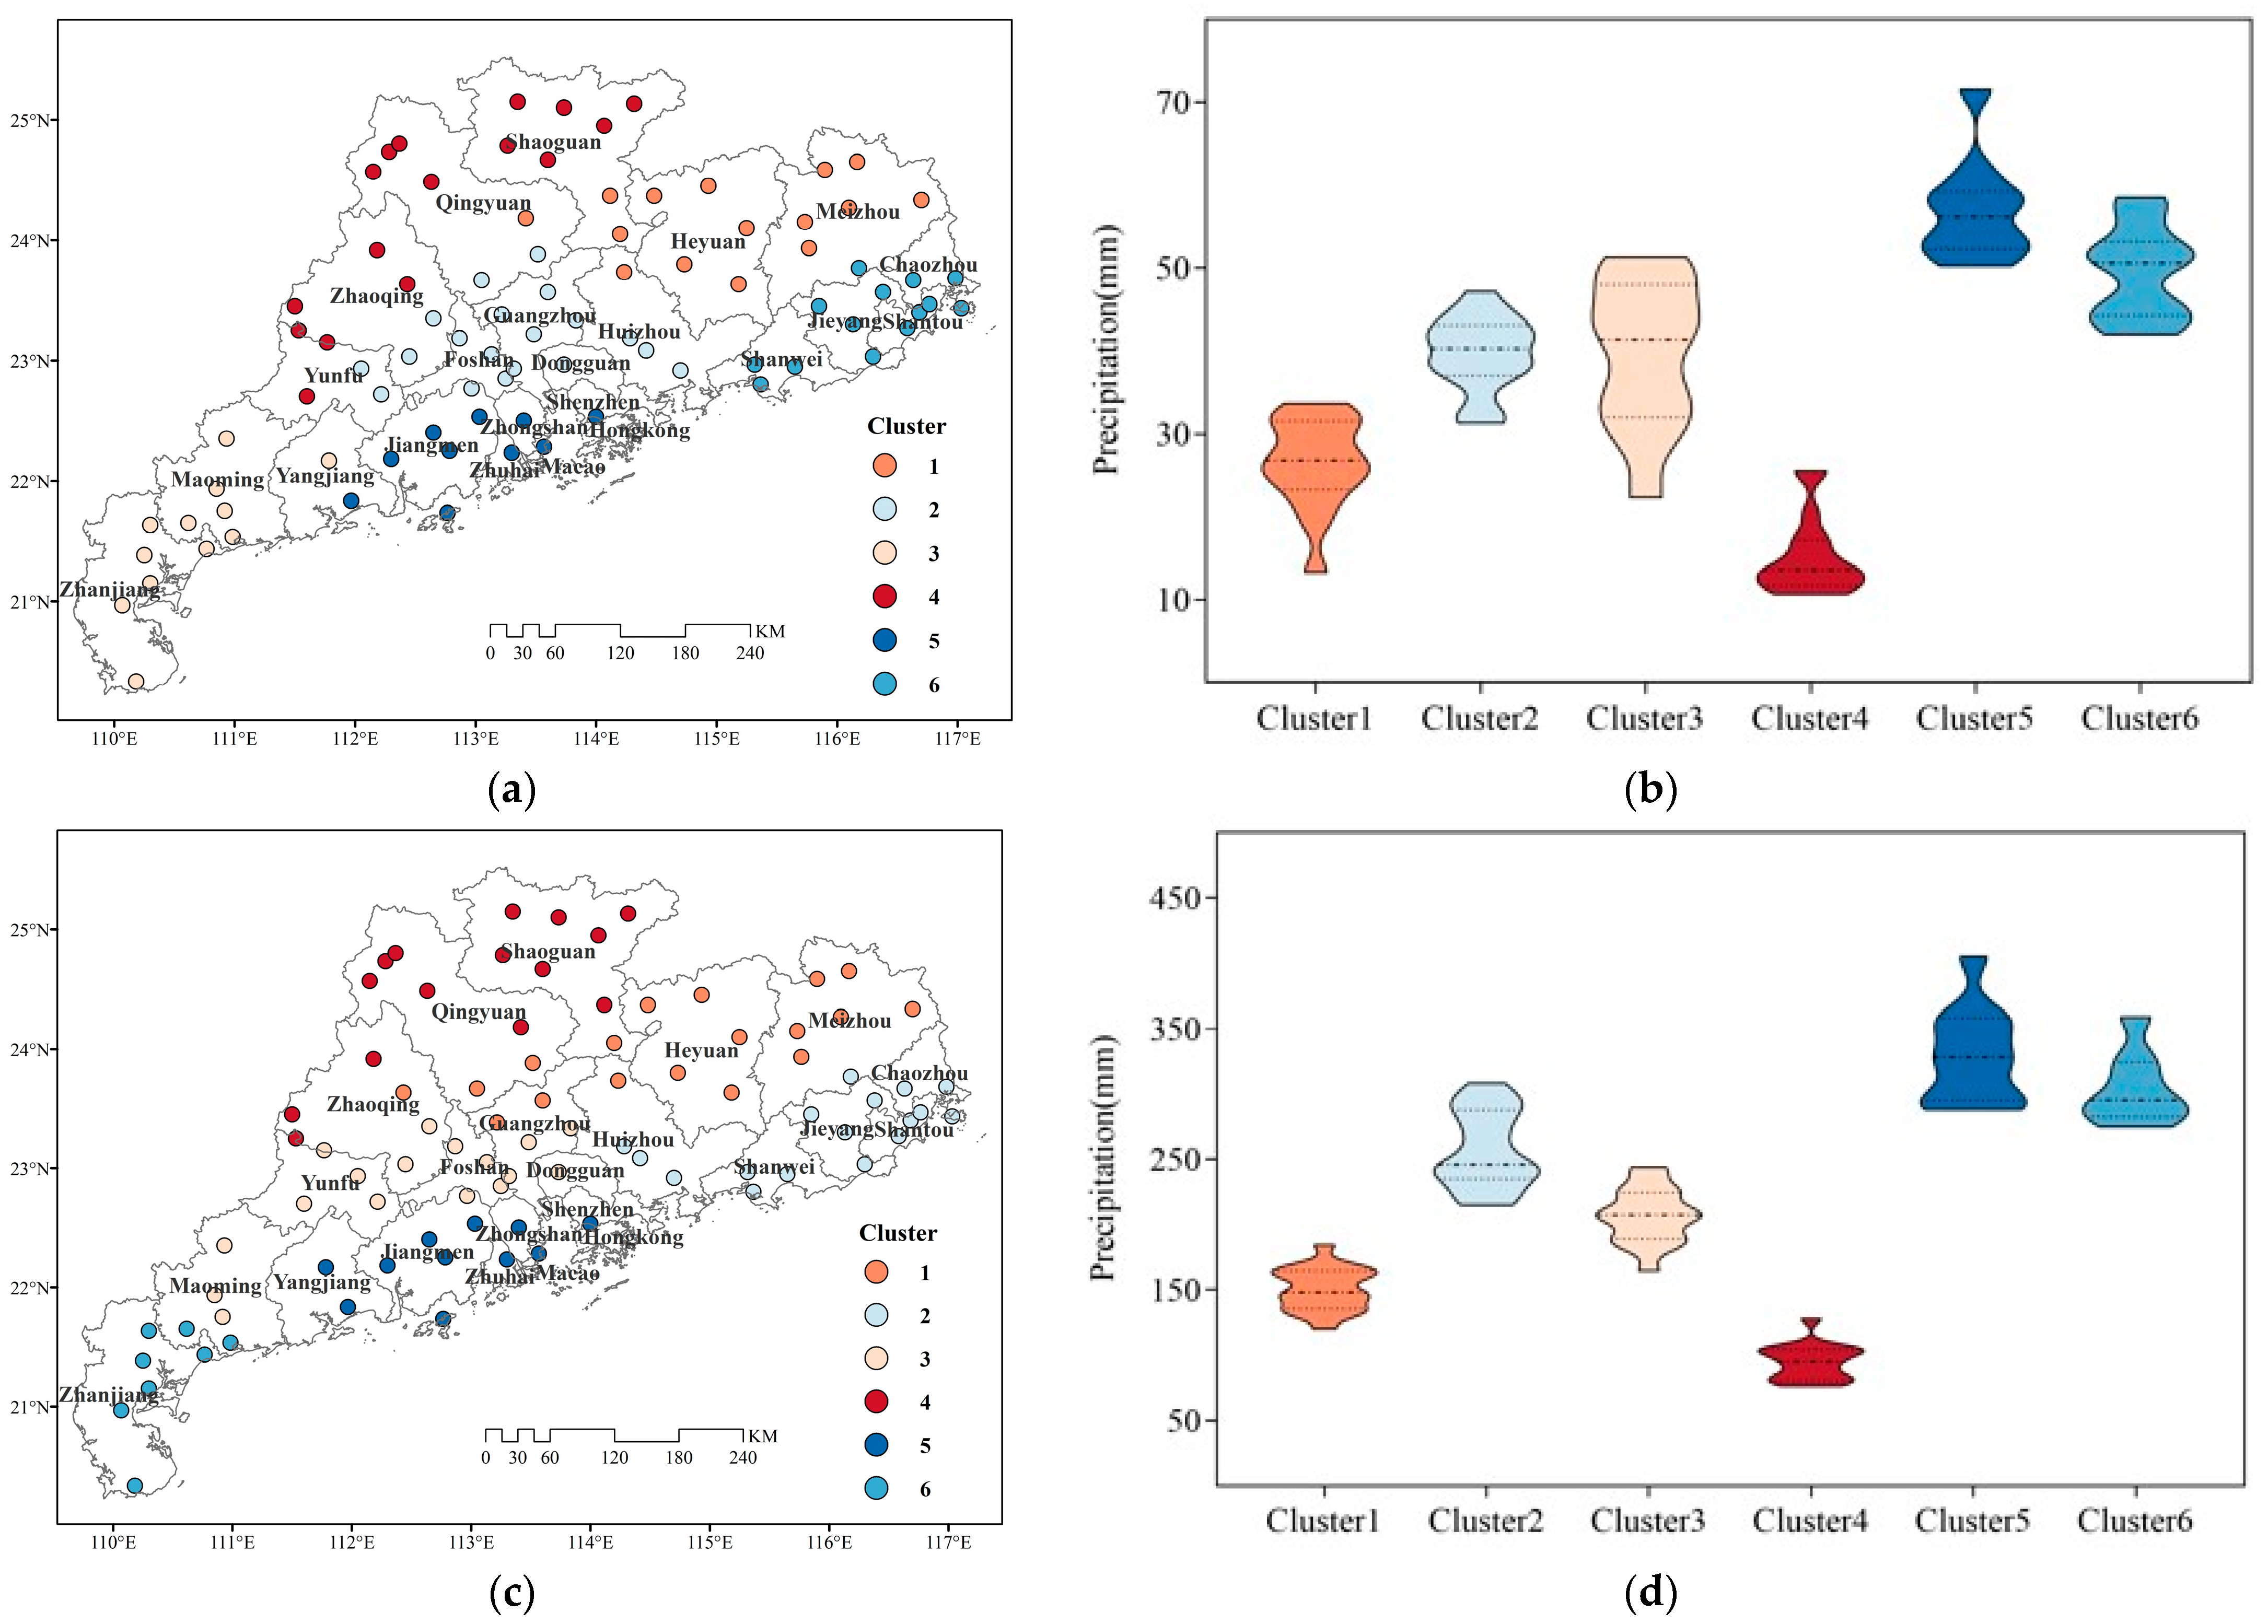
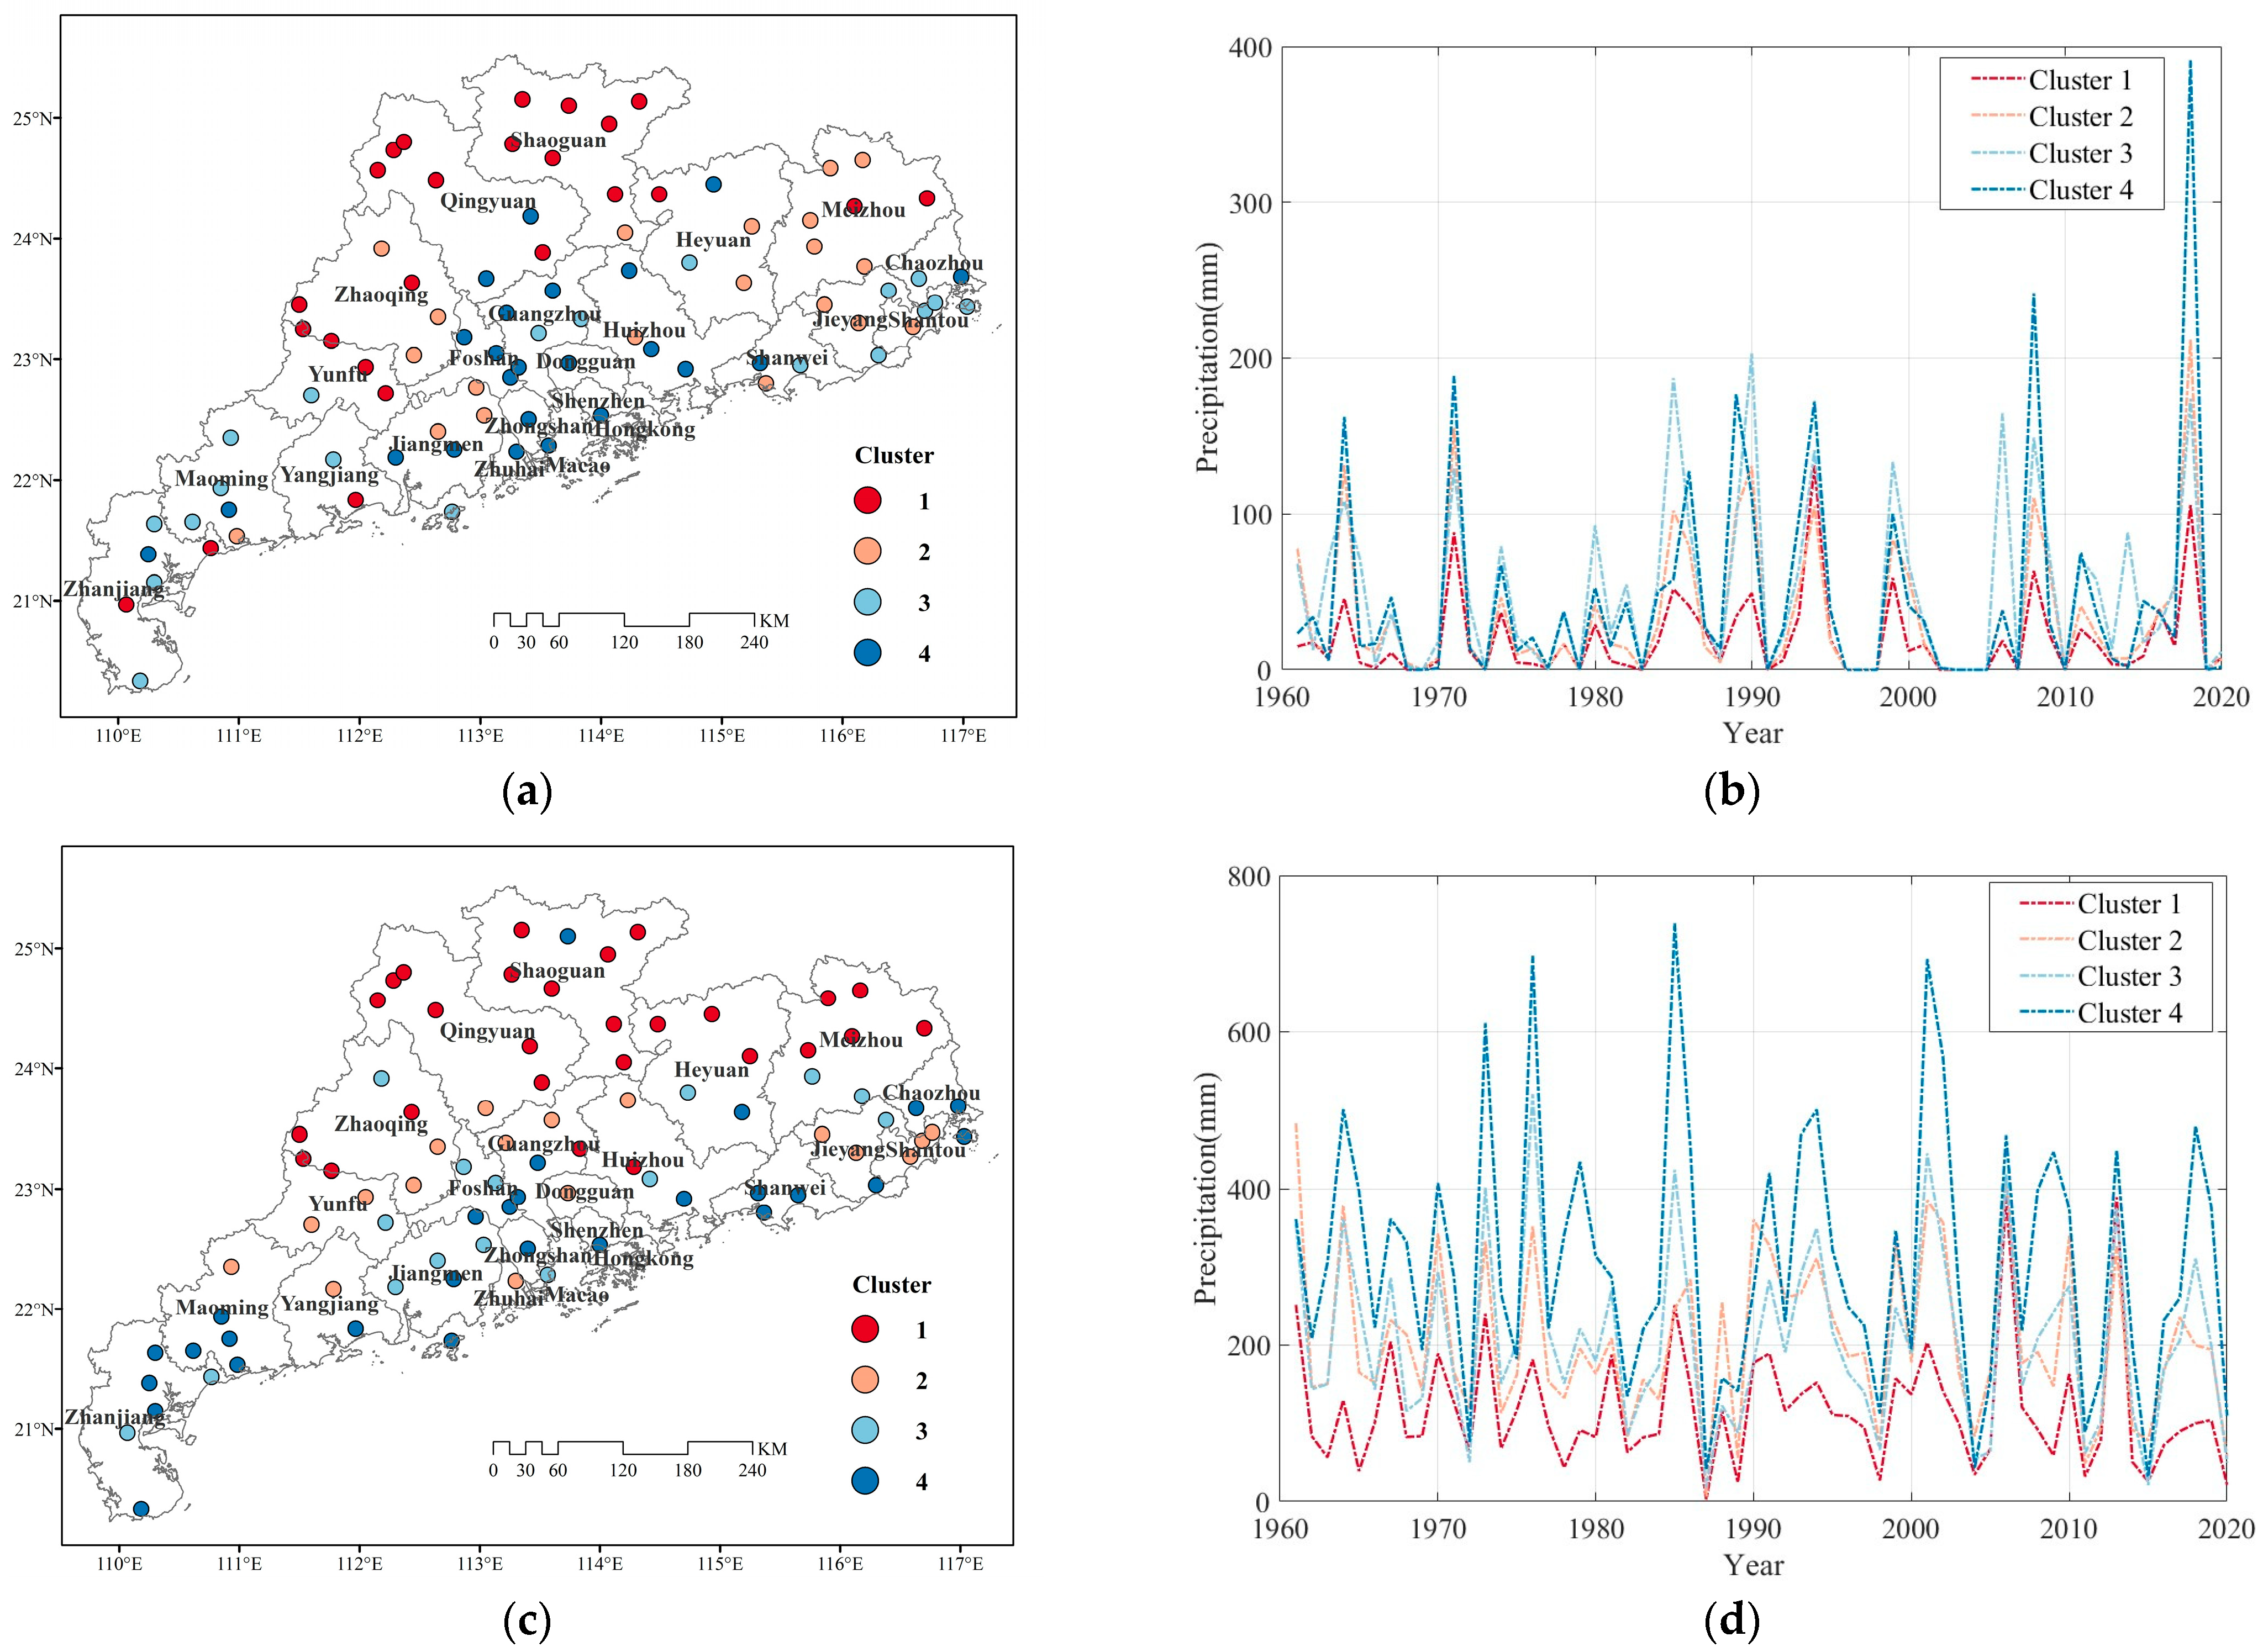
  • The clustering analysis results show that stations recording more precipitation and large inter-annual fluctuations are often distributed in coastal areas, while stations recording less precipitation and small inter-annual fluctuations are distributed in inland areas. However, the primary areas influenced by TCs are not the same in the different periods. In the case of the FRS, TC precipitation was relatively higher in the southern coastal areas of the Pearl River Delta. In the case of the NRS, the western and eastern coastal areas of Guangdong had more TC precipitation. As for the SRS and the WY, there was little difference in TC precipitation in the coastal areas.
This paper provides some preliminary interpretations as to the reasons underlying the observed spatiotemporal variability of TC precipitation. However, these are far from enough because the physical mechanisms of TC precipitation are extremely complex. In-depth analyses of the TC precipitation processes are still needed in future studies. Moreover, the OSAT method cannot identify precipitation that is caused by the remnants of TCs because the analytical step of rainband identification is based on the distances between the meteorological stations and the TC center, as well as on the distances between the rainbands and the TC, data on which are not available after the TC’s dissipation. There are also great challenges in identifying remote rainfall events caused by TCs, which could produce significant rainfall amounts under certain conditions. Solutions to these problems also need to be further explored in the future.

Author Contributions

Conceptualization, J.Z. and L.Z.; methodology, J.Z. and S.G.; software, J.Z. and S.G.; formal analysis, J.Z. and S.G.; data curation, J.Z. and S.G.; writing—original draft preparation, J.Z. and S.G.; writing—review and editing, J.Z., S.G., L.Z. and H.W.; visualization, S.G.; supervision, L.Z.; funding acquisition, J.Z. and L.Z. All authors have read and agreed to the published version of the manuscript.

Funding

This work was supported by the National Natural Science Foundation of China (No. U2142205), the Guangdong Basic and Applied Basic Research Foundation (No. 2022B1515130001), the Innovation Group Project of Southern Marine Science and Engineering Guangdong Laboratory (Zhuhai) (No. 311021004), and the Open Grants of the Joint Open Lab on Meteorological Risk and Insurance (No. 2023F005).

Institutional Review Board Statement

Not applicable.

Informed Consent Statement

Not applicable.

Data Availability Statement

The TC best track data used in this study are openly available at http://tcdata.typhoon.org.cn.

Conflicts of Interest

The authors declare no conflict of interest.

References

  1. Wang, D.; Dong, Z.; Ling, Z.; Jiang, F.; Zhu, S.; Chen, J. Spatiotemporal variability of extreme precipitation at different time scales and quantitative analysis of associated driving teleconnection factors: Insights from Taihu Basin, China. Ecol. Indic 2022, 142, 109287. [Google Scholar] [CrossRef]
  2. Zhao, D.; Xu, H.; Yu, Y.; Chen, L. Identification of synoptic patterns for extreme rainfall events associated with landfalling typhoons in China during 1960–2020. Adv. Clim. Chang. Res. 2022, 13, 651–665. [Google Scholar] [CrossRef]
  3. Cheng, Z.; Chen, L.; Liu, Y.; Peng, T. The temporal and spatial distribution characteristics of tropical cyclone precipitation in China from 1960 to 2003. J. Appl. Meteorol. 2007, 4, 427–434. [Google Scholar]
  4. Chen, L.; Meng, Z.; Cong, C. Review of research on typhoon rainstorm falling area. J. Mar. Meteorol. 2017, 37, 1–7. [Google Scholar]
  5. Qi, Q.; Jiang, B.; Ma, W.; Marley, G. Trend Analysis and Spatial Distribution of Meteorological Disaster Losses in China. Atmosphere 2022, 13, 208. [Google Scholar] [CrossRef]
  6. Ying, M.; Yang, Y.; Chen, B.; Zhang, W. Climate change characteristics of tropical cyclones affecting China in recent 50 years. Geoscience 2011, 41, 1352–1364. [Google Scholar]
  7. Cheng, Z.; Chen, L.; Xu, X.; Peng, T. Typhoon rainstorm in China in recent 10 years. Weather 2005, 12, 3–9. [Google Scholar]
  8. Chalise, D.R.; Aiyyer, A.; Sankarasubramanian, A. Tropical Cyclones’ Contribution to Seasonal Precipitation and Streamflow over the Southeastern and Southcentral United States. Geophys. Res. Lett. 2021, 4, e2021GL094738. [Google Scholar] [CrossRef]
  9. Zhu, Q.H. Statistical Research on Characteristics of Tropical Cyclone Precipitation in Southeast China. Master’s Thesis, Nanjing University of Information Science & Technology, Nanjing, China, May 2022. [Google Scholar]
  10. Chang, G.; Hasegawa, A. Tropical Cyclone and Heavy Precipitation over the Western North Pacific in Present and Doubled CO2 Climates Simulated by the CCSR/NIES/FRCGC T106 AGCM. Environ. Sci. 2005, 1, 145–148. [Google Scholar]
  11. Englehart, P.; Douglas, A. The role of Eastern North Pacific tropical storms in the rainfall climatology of Western Mexico. Int. J. Climatol. 2001, 21, 1357–1370. [Google Scholar] [CrossRef]
  12. Wu, S.; Guo, D.; Yang, J. Climatic Characteristics of Tropical Cyclone Precipitation in Hainan. Acta Meteorol. Sin. 2007, 3, 307–311. [Google Scholar]
  13. Ren, F.; Gleason, B.; Easterling, D. A numerical method for identifying tropical cyclone precipitation. J. Trop. Meteorol. 2001, 3, 308–313. [Google Scholar]
  14. Ren, F.; Wang, Y.; Wang, X.; Li, W. Estimating tropical cyclone precipitation from station observations. Adv. Atmos. Sci. 2007, 24, 700–711. [Google Scholar] [CrossRef]
  15. Ying, M.; Chen, B.; Wu, G. Climate trends in tropical cyclone-induced wind and precipitation over mainland China. Geophys. Res. Lett. 2011, 38. [Google Scholar] [CrossRef]
  16. Zhang, J.; Wu, L.; Ren, F.; Cui, X. Changes in Tropical Cyclone Rainfall in China. J. Meteorol. Soc. Jpn. Ser. II 2013, 91, 585–595. [Google Scholar] [CrossRef]
  17. Liu, T.; Wu, L.; Zhang, J.; Ren, F. Trend analysis of tropical cyclone precipitation affecting China from July to September during 1965–2010. Acta Meteorol. Sin. 2013, 71, 63–75. [Google Scholar]
  18. Li, R.C.Y.; Zhou, W. Interdecadal Changes in Summertime Tropical Cyclone Precipitation over Southeast China during 1960–2009. J. Clim. 2015, 28, 1494–1509. [Google Scholar] [CrossRef]
  19. Jiang, X.; Ren, F.; Li, Y.; Qiu, W.; Ma, Z.; Cai, Q. Characteristics and Preliminary Causes of Tropical Cyclone Extreme Rainfall Events over Hainan Island. Adv. Atmos. Sci. 2018, 35, 580–591. [Google Scholar] [CrossRef]
  20. Li, R.C.Y.; Zhou, W.; Lee, T.C. Climatological Characteristics and Observed Trends of Tropical Cyclone–Induced Rainfall and Their Influences on Long-Term Rainfall Variations in Hong Kong. Mon. Weather Rev. 2015, 143, 2192–2206. [Google Scholar] [CrossRef]
  21. Bai, L.; Wan, R.; Guo, R.; Ying, M.; Jin, R. Climate trends in tropical cyclone-induced precipitation and wind over Shanghai. Trop. Cyclone Res. Rev. 2022, 11, 219–224. [Google Scholar] [CrossRef]
  22. Luo, X.; Yao, C.; Xiao, Z.; Zhang, K. Climatic change characteristics and causes of tropical cyclone precipitation over South China in the past 60 years. Ocean Forecast 2020, 37, 76–85. [Google Scholar]
  23. Li, S.; Cheng, Z.; Gong, Y. Spatio-temporal distribution characteristics and return period estimation of tropical cyclone precipitation in Guangdong Province. Guangdong Meteorol. 2020, 42, 1–5. [Google Scholar]
  24. Wang, J.; Jiang, Y.; Cui, X.; Shen, X.; Ren, F. Statistical analysis of refined observations of precipitation from landfalling tropical cyclones in Zhejiang and Fujian, 1956–2012. Atmos. Sci. 2018, 42, 16–32. [Google Scholar]
  25. Zheng, L.; Shen, Y.; Feng, T.; Yao, M. Characteristics of precipitation distribution of landfalling typhoons in East China. Drought Meteorol. 2022, 40, 424–435. [Google Scholar]
  26. Jain, A.K.; Murty, M.N.; Flynn, P.J. Data clustering: A review. Acm. Comput. Surv. 1999, 31, 264–323. [Google Scholar] [CrossRef]
  27. Zhang, S.; Zheng, Y.; Liu, C.; Huang, Z.; Weng, H.; Xu, J.; Tu, S. Climatology of Different Classifications of Tropical Cyclones Landfalling in Guangdong Province of China during 1951–2020. Atmosphere 2022, 13, 1306. [Google Scholar] [CrossRef]
  28. Xiao, Z.; Yao, C. Thermal and Dynamical Characteristics of Landfalling Severe Typhoons in South China against Different Monsoon Backgrounds. Atmosphere 2023, 14, 338. [Google Scholar] [CrossRef]
  29. Ying, M.; Zhang, W.; Yu, H.; Lu, X.; Feng, J.; Fan, Y.; Zhu, Y.; Chen, D. An Overview of the China Meteorological Administration Tropical Cyclone Database. J. Atmos. Ocean. Tech. 2014, 31, 287–301. [Google Scholar] [CrossRef]
  30. Liu, S.; Cui, X. Diagnostic Analysis of Rate and Efficiency of Torrential Rainfall Associated with Bilis (2006). Chin. J. Atmos. Sci. 2018, 42, 192. [Google Scholar]
  31. Lu, X.; Yu, H.; Ying, M.; Zhao, B.; Zhang, S.; Lin, L.; Bai, L.; Wan, R. Western North Pacific Tropical Cyclone Database Created by the China Meteorological Administration. Adv. Atmos. Sci. 2021, 38, 690–699. [Google Scholar] [CrossRef]
  32. Pei, Q.; Zhang, D.D.; Lee, H.F.; Li, G. Climate Change and Macro-Economic Cycles in Pre-Industrial Europe. PLoS ONE 2014, 9, e88155. [Google Scholar] [CrossRef] [PubMed]
  33. Wang, X.; Wahiduzzaman, M.; Yeasmin, A. A Kernel Density Estimation Approach and Statistical Generalized Additive Model of Western North Pacific Typhoon Activities. Atmosphere 2022, 13, 1128. [Google Scholar] [CrossRef]
  34. Zhang, Y.; Li, Y.; Li, D.; Shang, K.; Zheng, F. Spatial distribution characteristics and circulation patterns of summer extreme high temperature in eastern China. Plateau Meteorol. 2016, 35, 469–483. [Google Scholar]
  35. Yang, W.; Xu, M.; Zhou, S.; Luo, L. Temporal and spatial variation of extreme heavy rainfall events and circulation anomaly in June-July in the Yangtze-Huaihe River Basin. Plateau Meteorol. 2017, 36, 718–735. [Google Scholar]
  36. Shen, H.; Chen, L.; Hu, B.; Qiao, S.; Zhang, T. The main spatial pattern and circulation characteristics of summer precipitation in central Northwest China. Plateau Meteorol. 2017, 36, 455–467. [Google Scholar]
  37. North, G.R.; Bell, T.L.; Cahalan, R.F.; Moeng, F.J. Sampling Errors in the Estimation of Empirical Orthogonal Functions. Mon. Weather Rev. 1982, 110, 699–706. [Google Scholar] [CrossRef]
  38. Zhou, Y.; Wu, T. Composite analysis of precipitation intensity and distribution characteristics of western track landfall typhoons over China under strong and weak monsoon conditions. Atmos. Res. 2019, 225, 131–143. [Google Scholar] [CrossRef]
  39. Amin, R.W.; Kocak, S.; Sevil, H.E.; Peterson, G.P.; Hamilton, J.T.; Rivera, B.; Barraco, T. A spatio-temporal cluster analysis of structurally deficient bridges in the contiguous USA. Dev. Built Environ. 2020, 4, 100034. [Google Scholar] [CrossRef]
  40. Kar, A.K.; Lohani, A.K.; Goel, N.K.; Roy, G.P. Rain gauge network design for flood forecasting using multi-criteria decision analysis and clustering techniques in lower Mahanadi river basin, India. J. Hydrol. Reg. Stud. 2015, 4, 313–332. [Google Scholar] [CrossRef]
  41. Wang, H.; Wang, J. An improved k-means clustering algorithm based on spatial adjacency relation. Comput. Eng. 2006, 21, 50–51. [Google Scholar]
  42. Wang, H.; Zhang, T.; Peng, J.; Dong, Q. Fuzzy C-means clustering method and application analysis of GIS data based on spatial weighted distance. J. Earth Inf. Sci. 2013, 15, 854–861. [Google Scholar]
  43. Saxena, A.; Prasad, M.; Gupta, A.; Bharill, N.; Patel, O.P.; Tiwari, A.; Er, M.J.; Ding, W.; Lin, C. A review of clustering techniques and developments. Neurocomputing 2017, 267, 664–681. [Google Scholar] [CrossRef]
  44. Xin, Q.; Hong, P.; Jing, S. k-Medoids Substitution Clustering Method and a New Clustering Validity Index Method. In Proceedings of the 2006 6th World Congress on Intelligent Control and Automation, Dalian, China, 21–23 June 2006; pp. 5896–5900. [Google Scholar]
  45. Cuturi, M.; Blondel, M. Soft-DTW: A differentiable loss function for time-series. In Proceedings of the 34th International Conference on Machine Learning, Sydney, Australia, 6–11 August 2017; pp. 894–903. [Google Scholar]
  46. Tran, T.; Ritchie, L.; Perkins Kirkpatrick, S. A 50-Year Tropical Cyclone Exposure Climatology in Southeast Asia. J. Geophys. Res. Atmos. 2022, 127, e2021JD036301. [Google Scholar] [CrossRef]
  47. Yang, H. Research on the Climate Characteristics of Tropical Cyclone Precipitation in China from 1960 to 2017. Master’s Thesis, China Academy of Meteorological Sciences, Beijing, China, April 2019. [Google Scholar]
  48. Luo, X.; Wu, L.; Xu, J.; Li, K. Characteristics of precipitation during the first flood season in South China and its relationship with atmospheric heat sources. Mid-Low Latit. Mt. Meteorol. 2021, 45, 19–27. [Google Scholar]
  49. Li, L.; Zhou, L.; Yu, Z. The interdecadal anomalous characteristics of precipitation during South China's first flood season and its causes. J. Atmos. Sci. 2018, 41, 186–197. [Google Scholar]
  50. Yan, Y.; Wang, G.; Wu, H.; Gu, G.; Nanding, N. Characteristics of Precipitation and Floods during Typhoons in Guangdong Province. Remote Sens. 2022, 14, 1945. [Google Scholar] [CrossRef]
  51. Hao, Q.; Hu, Y.; Luo, X. Climatic characteristics and causes of precipitation anomalies during the flood season in Guangdong Province in 2014. Clim. Res. Appl. 2015, 36, 40–42. [Google Scholar]
  52. Liu, L.; Wang, Y. Trends in Landfalling Tropical Cyclone–Induced Precipitation over China. J. Clim. 2020, 33, 2223–2235. [Google Scholar] [CrossRef]
  53. Qiu, W.; Ren, F.; Wu, L.; Chen, L.; Ding, C. Characteristics of tropical cyclone extreme precipitation and its preliminary causes in Southeast China. Meteorol. Atmos. Phys. 2019, 131, 613–626. [Google Scholar] [CrossRef]
  54. Huang, W. Characterisation of changes in precipitation intensity of tropical cyclones affecting the southeast coast of China in the past 30 years. Clim. Environ. Res. 2013, 18, 507–516. [Google Scholar]
  55. Chu, P.; Chen, D.; Lin, P. Trends in precipitation extremes during the typhoon season in Taiwan over the last 60 years. Atmos. Sci. Lett. 2014, 15, 37–43. [Google Scholar] [CrossRef]
  56. Shan, K.; Yu, X. Variability of Tropical Cyclone Landfalls in China. J. Clim. 2021, 34, 9235–9247. [Google Scholar] [CrossRef]
  57. Emanuel, K. Increasing destructiveness of tropical cyclones over the past 30 years. Nature 2005, 436, 686–688. [Google Scholar] [CrossRef] [PubMed]
Figure 1. Location of Guangdong and the distribution of meteorological stations.
Atmosphere 14 01367 g001
Figure 2. Flowchart of the analysis of spatiotemporal characteristics of TC precipitation in Guangdong Province.
Atmosphere 14 01367 g002
Figure 3. The occurrence time of TC precipitation in the years from 1961 to 2020.
Atmosphere 14 01367 g003
Figure 4. Monthly distribution of the TCs affecting Guangdong from 1961 to 2020.
Atmosphere 14 01367 g004
Figure 5. (a) Variations in the frequency of TCs affecting Guangdong from 1961 to 2020; (b) the changes in TC precipitation in Guangdong from 1961 to 2020.
Atmosphere 14 01367 g005aAtmosphere 14 01367 g005b
Figure 6. Spatial distribution of multi-year average TC precipitation in Guangdong Province: (a) FRS; (b) SRS; (c) NRS; (d) WY.
Atmosphere 14 01367 g006
Figure 7. The spatial distribution of the first three modal eigenvectors of the TC precipitation anomaly field: (ac) FRS; (df) SRS; (gi) NRS; (jl) WY.
Atmosphere 14 01367 g007aAtmosphere 14 01367 g007b
Figure 8. The spatial distribution patterns of TC precipitation in different periods of each year.
Atmosphere 14 01367 g008
Figure 9. Spatial distribution and violin plots of TC precipitation recorded by the 6 types of stations: (a,b) FRS; (c,d) SRS; (e,f) NRS; (g,h) WY. The dashed lines in the violin plots represent the upper, median, and lower quartiles from top to bottom, while the top and bottom solid lines represent the maximum and minimum values, respectively, and the outer shape represents the probability density corresponding to these values.
Atmosphere 14 01367 g009aAtmosphere 14 01367 g009b
Figure 10. Spatial distribution of the four types of stations and the temporal variations in TC precipitation: (a,b) FRS; (c,d) SRS; (e,f) NRS; (g,h) WY.
Atmosphere 14 01367 g010aAtmosphere 14 01367 g010b
Table 1. Parameter settings of the precipitation separation method employed for TCs.
Maximum Sustained TC Wind Speed (m/s)Absolute TC Precipitation Distance Control Threshold D0 (km)Original TC Range Control Threshold D1 (km)Revised TC Range Control Threshold D1 (km)
TCs far away from GD<17.2 (tropical depression)200600400
17.2 to 24.4 (tropical storm)300800500
24.5 to 32.6 (strong tropical storm)4001000600
≥32.7 (typhoon and above)5001100700
TCs close to GD<17.2 (tropical depression)300800500
≥17.2 (tropical storm and above)5001100700
Table 2. Scanning radius to separate those winds caused by TCs.
Maximum Sustained TC Wind Speed (m/s)Scanning Radius (km)
V < 17.2100
V ≥ 17.2 and V < 24.5150
V ≥ 24.5 and V < 32.7200
V ≥ 32.7 and V < 41.5250
V ≥ 41.5 and V < 51.0300
V ≥ 51.0350
Table 3. Basic characteristics of the time-series mean curve of the different clusters of stations.
ClusterMaxMinMeanRange σ kp
FRS1131.03019.00131.0326.480.120.57
2211.96034.38211.9645.290.060.69
3202.93049.16202.9353.950.140.68
4391.21045.83371.2170.310.400.50
SRS1390.392.64117.25387.7476.93−0.230.99
2483.246.29206.07476.95103.67−0.740.69
3520.2417.29205.75502.95112.37−0.790.51
4738.7031.52308.48707.19162.39−1.080.41
NRS1174.05018.43174.0533.69−0.280.21
2272.21031.61272.2150.96−0.200.51
3278.43053.02278.4370.40−0.510.25
4497.00037.55497.0080.93−0.670.23
WY1437.9223.31154.74414.6189.07−0.380.99
2649.5440.40261.42609.13142.29−1.170.70
3701.7181.94333.24619.77148.13−0.910.51
4942.1440.86423.98901.27212.44−1.230.41
Disclaimer/Publisher’s Note: The statements, opinions and data contained in all publications are solely those of the individual author(s) and contributor(s) and not of MDPI and/or the editor(s). MDPI and/or the editor(s) disclaim responsibility for any injury to people or property resulting from any ideas, methods, instructions or products referred to in the content.

