Article

Assessments for the Effect of Mineral Dust on the Spring Heat Waves in the Sahel

1
UMI 209 UMMISCO-IRD, Sorbonne Université, 93140 Bondy, France
2
Laboratoire de Physique de l’Atmosphère et de l’Océan—Siméon Fongang, École Supérieure Polytechnique de Dakar, Dakar 10700, Senegal
3
Centre de Recherche de Climatologie, UMR 6282 Biogéosciences, Université de Bourgogne, 21000 Dijon, France
4
IRD, Sorbonne Université LOCEAN/IPSL, 75006 Paris, France
*
Author to whom correspondence should be addressed.
Atmosphere 2023, 14(9), 1373; https://doi.org/10.3390/atmos14091373
Submission received: 31 July 2023 / Revised: 21 August 2023 / Accepted: 22 August 2023 / Published: 31 August 2023
(This article belongs to the Section Biometeorology)

Abstract

:
The physical mechanisms associated with heat waves (HWs) are well known in the midlatitudes but still under-documented in the Sahel. Specifically, the role of anthropogenic and natural changes in tropospheric aerosols regarding HWs remains an issue to address. Our study focuses on the characterisation of the dusty HWs in the Sahel, which generally occur from March to June. The goal is to reinforce or invalidate the assumption proposed in previous studies recently carried out in southern Europe and according to which mineral dust may locally change irradiance at the surface, thus atmospheric temperatures at 2 m, intensifying the HW. The work is carried out in three steps: (i) detect and describe the HW over the 2003–2014 period based on maximum daily 2-m temperatures (T m a x ) from ERA-Interim reanalyses; (ii) characterise the dust optical properties during the HW using the Deep Blue aerosols products from MODIS (Moderate Resolution Imaging Spectroradiometre): the Aerosol Optical Depth at 550 nm (AOD 550 ), the Angstrom Exponent (AE 440 870 ) and the Single Scattering Albedo at 412 nm (SSA 412 ) as a proxy of quantity over atmospheric column, size and absorption of aerosols, respectively; (iii) relate HW intensity to the aerosol conditions during the HW. Over the 12-year study period, 14 HWs are detected when T m a x exceeds the 90th percentile (P90). The HWs are dusty with AOD 550 ranging between 0.46 and 1.17 and all the dust types are absorbent with a SSA 412 value of 0.93 (round to hundredths). The HW classification according to aerosol conditions gave three HWs: Type 1 corresponds to Pure Dust Situation (PDS with AE 440 870 = 0.1), Type 2 and Type 3 are associated with Mixed Situation (MS) with dominance of Coarse Particles (CP with AE 440 870 = 0.35) and Fine Particles (FP with AE 440 870 = 0.65), respectively. The main result obtained is that the intensity of the dusty HW, computed as the difference between daily T m a x and its P90 (T m a x −P90)), is higher for Type 1 HW (+1.1 °C) in the case of the most absorbent aerosol situation (SSA 412 = 0.931). A non-significant difference between Type 2 and Type 3 especially for temperature (+0.5 °C and +0.4 °C, respectively) and SSA (0.938 and 0.935, respectively) is observed and, during these mixing situations, the HWs are less intense than those during the PDS. Finally, the analysis of two huge Type 1 HWs in 2007 and 2010 shows that dust mass concentrations at the surface were particularly high, up to 214 μg/m3 on average. These findings enable us to assess that highly absorbent and concentrated pure dust situations observed in spring in the Sahel may have a potential warming effect at the surface.

1. Introduction

Heat waves (HWs) have attracted the interest of the scientific community after the event of 2003 in Western Europe [1] and 2010 in Russia [2]. Interest in HWs in developing countries, especially in West Africa, is more recent, whereas the mean climate is warmer and the health risk is relatively high [3]. The time evolution of T m a x (maximum daily 2 m atmospheric temperature) and T m i n (minimum daily 2 m atmospheric temperature) from 1961 to 2014 in West Africa show positive trends, +0.021 °C/year and +0.028 °C/year, respectively [4,5,6]. A better knowledge of the HW phenomena in West Africa could improve the management of the associated effects. However, if the physical mechanisms associated with HWs are well known in the midlatitudes, the processes controlling warm temperature anomalies in the Sahel are still under-documented [5]. First, the spring HWs in West Africa seem to be associated with the Rossby wave, which causes midtropospheric subsidence and anticyclonic rotation over the continent [4]. Second, if the low-frequency variations of warm extremes in West Africa can be attributed to global warming, their high-frequency variations tend to follow warm ENSO (El Nino-Southern Oscillation) events [6]. The underlying trend in temperature anomalies (which are not explained by these factors) could be related to anthropogenic and natural changes in atmospheric greenhouse gas (GHG) concentrations among which is water vapour [4,5,6].
Aerosols may also locally change irradiance at the surface. Sousa et al. [7] remarked that the HWs in Spain in 2018 and 2019 were the result of warm air mass intrusion with above-normal Saharan dust mass concentrations, suggesting that this could have effects on the temperature elevation at the surface. The same observation was carried out during the 2011 (from 4 to 7 April 2011) extreme mineral dust episode over Portugal [8]. These results need comprehensive analysis as they are not intuitive. Indeed, the tropospheric aerosols are well known to impact radiative transfer processes in the atmosphere by reflecting and absorbing solar (0.1–3 μm, Short Wave, SW) and telluric (3–100 μm, Long Wave, LW) radiation in highly variable proportions [9]. This implies either a negative (cooling) or a positive (warming) radiative forcing depending on the size, composition, shape and quantity of the aerosols in the atmosphere [10]. For mineral dust, the radiative efficiency at the surface, defined as the instantaneous change in radiative flux due to the presence of dust compared to a free-dust atmosphere, is always negative in the SW and, to a certain extent, positive in the LW [11]. Thus, the scientific community admitted that the global dust radiative forcing is positive in the atmosphere and negative at the surface. Even so, estimating the radiative forcing due to dust is still challenging [12], notably because there are few measurements, particularly in the LW, simultaneously with SW measurements, and during dust events in the Sahel. The simulation of radiative efficiency in the LW is not easy either—it can vary by a factor of 2 to 3—as it depends on the dust optical properties, notably absorption, which are poorly documented in the infrared [13], the underlying surface albedo, the presence of clouds and the vertical profile of aerosols [14]. The balance between the different parts of the spectrum can also vary over the day and radiative efficiency in plumes of dust can be considerably larger than that measured by other longer temporal timescales [11].
The purpose of this study is to enlarge our knowledge of the HW in the Sahel from reanalysis by identifying to what extent the warm days are associated with mineral dust. Further, we investigate the aerosol type and estimate their quantity from remote sensing during the HW in order to reinforce or invalidate the assumption according to which above normal Saharan dust amount could impact the atmospheric temperature elevation at the surface [7] in West Africa. This paper is structured as follows. Section 2 presents the datasets used in this study. Section 3.1 presents the study area and its mean characteristics in terms of temperatures and aerosols. Section 3.2 describes the method used to define and characterise the HW over the 2003–2014 period. Section 4.1 focuses on the analysis of the aerosol conditions during each HW detected. Section 5 is a discussion that deals with the altitude of the dust aerosols (Section 5.1) and illustrates the specific case of the huge and historic 2010 HW in the Sahel (Section 5.2). Section 6 is the conclusion/perspectives that ends the study.

2. Presentation of the Datasets

2.1. Atmospheric Temperature Dataset from Reanalysis

We use T m a x from European Centre for Medium-Range Weather Forecasts (ECMWF) interim reanalysis (ERA-Interim) [15] for the 2003–2014 period at the daily timescale from March to June. The data assimilation system used to produce this data is based on a 2006 version of the Integrated Forecasting System which includes a four-dimensional analysis with a 12 h analysis window. The spatial resolution of the dataset is 0.75° (approximately 80 km) over 60 vertical levels from the surface up to 0.1 hPa. ERA-Interim products are normally updated once a month to ensure quality and correct technical issues in data production. This product has already been used to study HWs on the whole African continent by Ceccherini et al. [16] and in the Sahel by Oueslati et al. [5]. They found a good accordance between daily observed and reanalysed minimum and maximum temperatures.

2.2. Aerosol Datasets from Remote Sensing and In Situ Measurements

2.2.1. MODIS Products

We use the Deep Blue (DB) Collection in version 6.0 10 km aerosol products from MODIS/Aqua (Moderate Resolution Imaging Spectroradiometre) for the 2003–2014 period. These products are performant over both bright surfaces such as desert and dark surfaces such as vegetation, which enables a unique spatial coverage over Africa. The DB algorithm takes advantage of a refined land surface scheme based on the NDVI (Normalized Difference Vegetation Index) and spectral surface reflectance library [17]. According to Shi et al. [18], the number of retrievals with “very good” quality assurance flags has roughly doubled. Among the DB products, we chose to work with the “land best estimate” aerosol products, which include pixels that have passed quality assurance tests (QA = 2.3) and are anticipated by the majority of data users. The interest variables are Aerosol Optical Depth at 550 nm (AOD 550 ) as a proxy of the aerosol loading within the atmospheric column. The Angstrom Exponent (AE 440 870 ) is an indicator of the aerosol size, and the Single Scattering Albedo at 412 nm (SSA 412 ) as the ratio of scattering efficiency to total extinction efficiency is also an essential parameter used to reflect the aerosol absorption. The uncertainties of DB AOD retrievals are listed as ±0.05 ± 20% at the global scale [17].

2.2.2. Aerosol Optical Thickness from the AErosol RObotic Network

The AErosol RObotic NETwork (AERONET) is the world reference for aerosol monitoring [19,20,21]. The AERONET is deployed at more than 500 stations worldwide and has also provided information on the AOD since the 1990s (1993) at 15-min time steps. The measurements of this network are acquired by means of a sunphotometre or heliophotometre performing measurements of solar irradiance at several wavelengths from visible to near infrared. This implies that measurements are only available during the day (diurnal measurements). AERONET products are available in three levels: level 1.0, 1.5 and 2.0. Level 2.0 is the highest quality level as the measurements have undergone cloud screening and data quality control. Note that level 1.5 data have also undergone cloud screening but without data quality assurance. In our study, we mobilise the optical thickness data of aerosols at level 2.0 for two stations located in West Africa (Figure 1): Banizoumbou station in Niger (13.547° N, 2.665° E) and Cinzana in Mali (13.278° N, 5.934° W).
In order to obtain the AOD 550 from the AERONET, we assume that the spectral dependency of aerosols between 440 nm and 870 nm is equal to that between 550 nm and 870 nm. Spectral dependency is referred to as AE 440 870 (Angstroem Exponent between 440 and 870 nm) in the following formula:
AOD 870 × ( 550 870 ) AE 440 870
We used the AOD from the AERONET datasets in order to feed a discussion (Section 5) on the vertical distribution of aerosol optical properties in the atmospheric column (see Section 5.1).

2.2.3. PM 10 Mass Concentrations at the Surface from the Sahelian Dust Transect

The Sahelian Dust Transect (SDT) is a network dedicated to monitoring mineral dust in the Sahel, particularly the particulate matter lower than 10 μm in diameter (PM 10 ). It was deployed in 2006 as part of the international AMMA (African Monsoon Multidisciplinary Analysis) program. It comprises four ground stations located on an east–west trajectory along the path of Saharan and Sahelian dust plumes as they are transported towards the Atlantic Ocean: Banizoumbou (Niger), Cinzana (Mali), M’Bour and Bambey (Senegal). A similar station was recently deployed in southern Tunisia (Médenine, Tunisia) [22]. The stations are all equipped with AERONET sun photometers. In this study, we considered the data from the two Sahelian sites of Banizoumbou and Cinzana because the aerosol concentrations are not affected by oceanic influences and anthropogenic aerosol sources. The PM 10 concentration is determined at a 5 min time-step by a tapered element oscillating microbalance (TEOM) instrument equipped with a PM 10 inlet [22]. We used the PM 10 measurements from the SDT to feed a discussion (Section 5) on the vertical distribution of the aerosols (see Section 5.1).

3. Study Area and Methods

3.1. Study Area Description

The study area covers a region between 10° N–18° N and 15° W–15° E stretching from Senegal in the west to Niger in the east and bounded in the north by the Sahara and in the south by the Gulf of Guinea (Figure 1). This region is chosen because it presents the largest number of HWs over the West African domain [4,23,24] and it is impacted by various dust sources, notably the Saharan source and the Bodele source. Average monthly temperatures over the 2003–2014 period range from 32 °C to 42 °C during March, April, May and June with relatively high AOD from east to west, up to 1 in some places, particularly in Mali, Burkina-Faso and Niger.
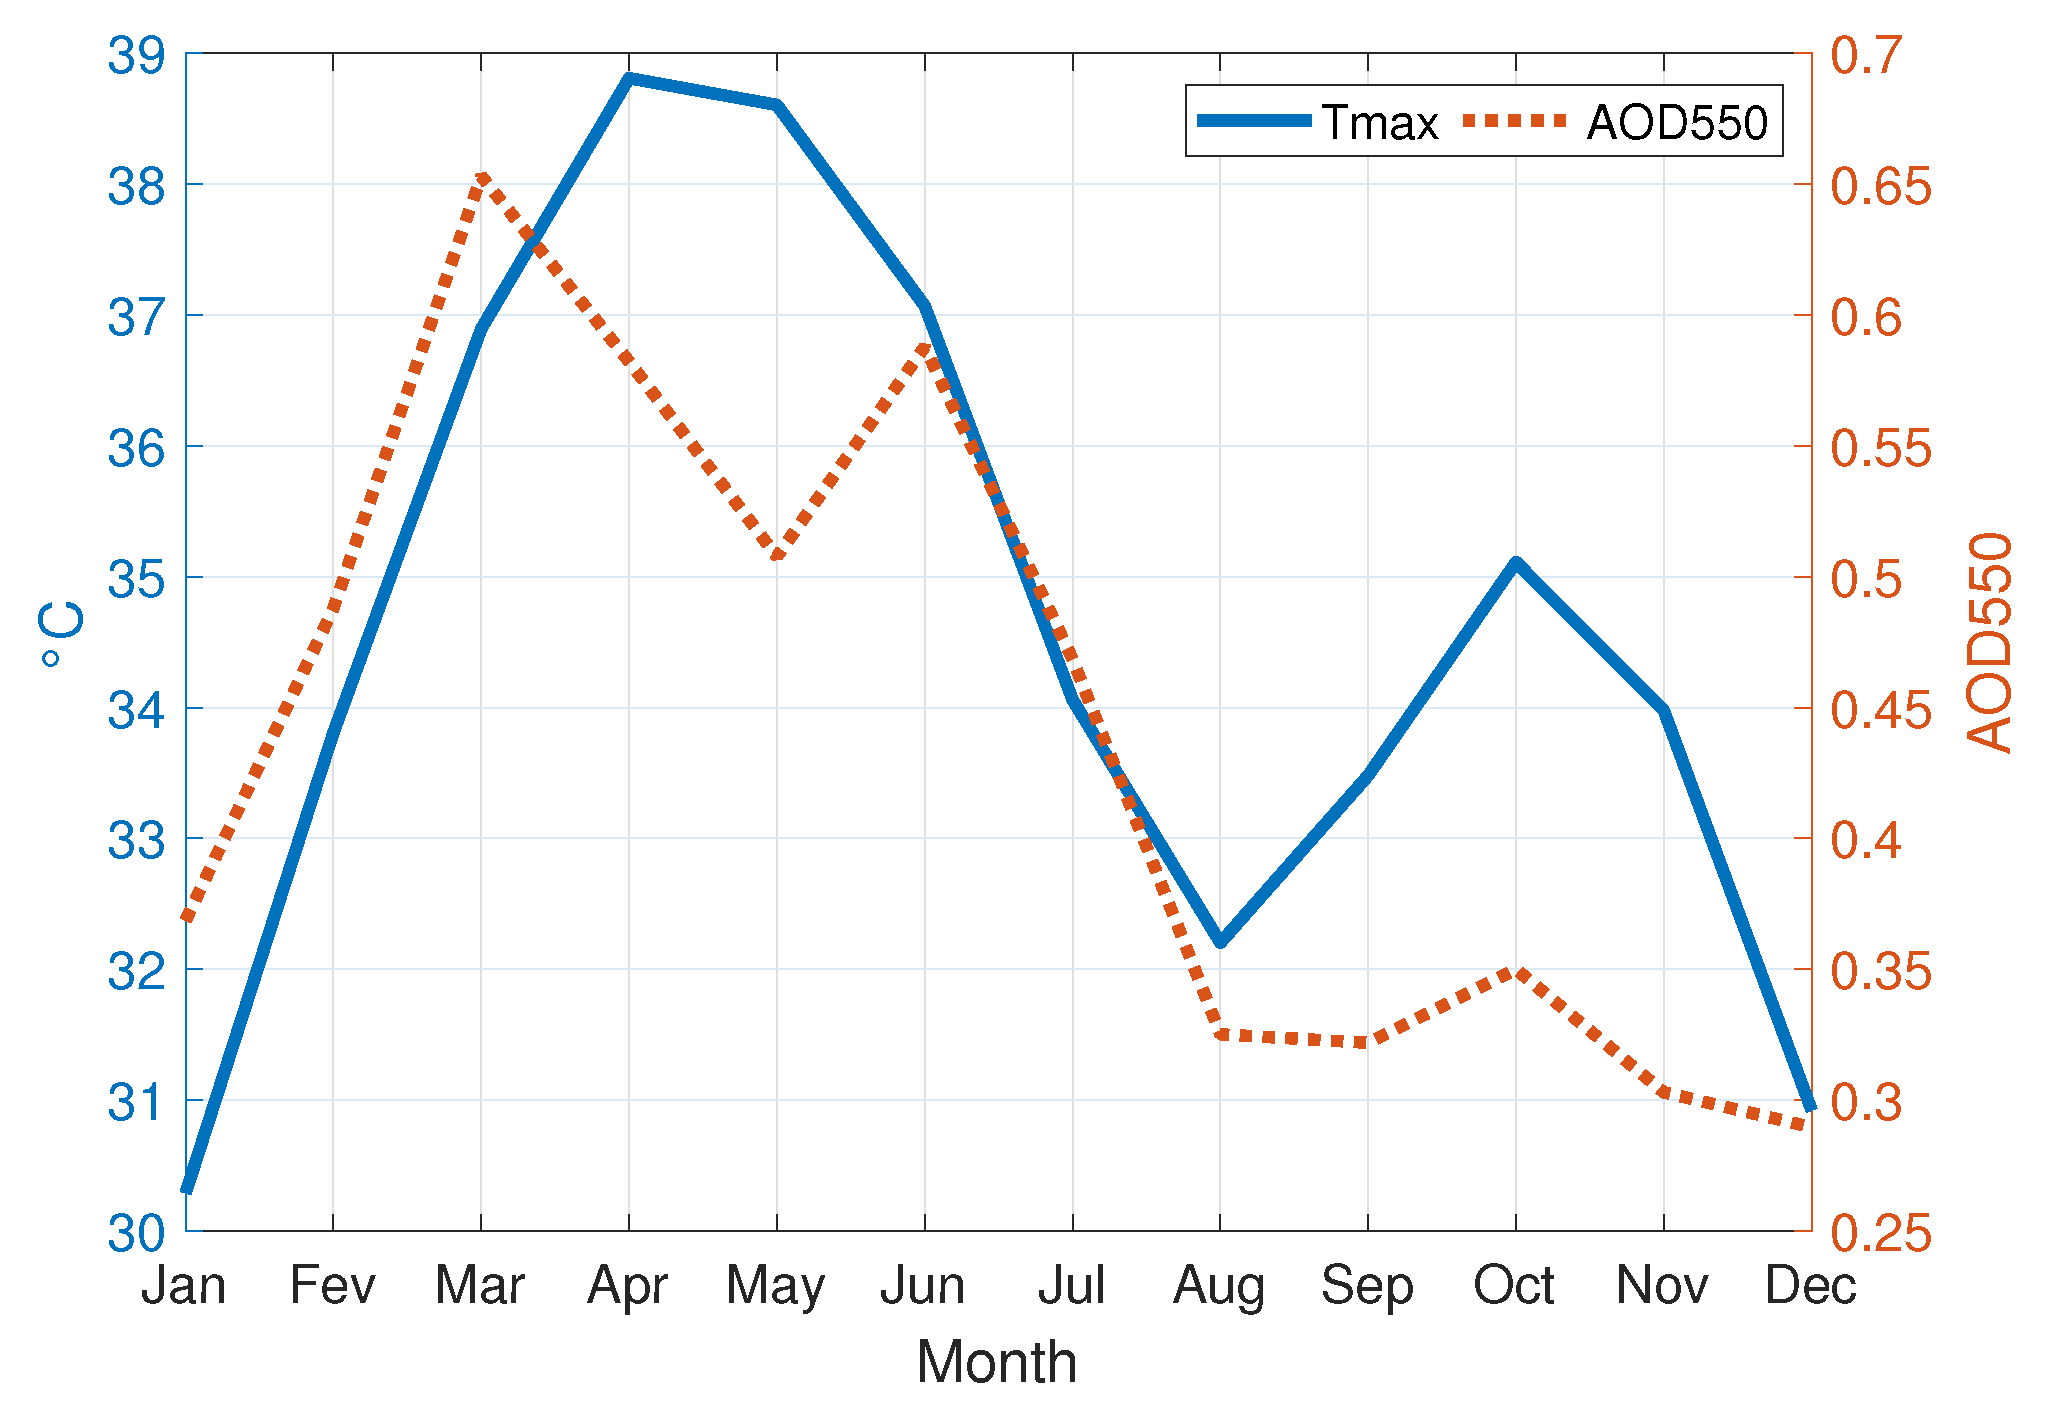
The mean annual cycle of temperatures indicates that the warm season occurs in spring, particularly between March and June with T m a x above 35 °C, and a maximum observed in April with T m a x up to 39 °C (Figure 2). It is the time of the year when the net radiation is the highest and corresponds to the period when the HWs are generally recorded [23]. Then, the temperature decreases during the monsoon season from July to September due to the rainfall and cloudiness which cools the atmosphere [25]. During the warm season, the aerosol mean seasonal cycle indicates that the AOD 550 , the proxy of the aerosols quantity over the atmospheric column, are at a maximum between March (∼0.65) and June (∼0.60) (Figure 2). Figure 1 shows that the March maximum occurs during the dry season when the dry Northeast trades, called Harmattan, blow over the Sahara and the Sahel, carrying huge amounts of mineral dust particles in the lower levels of the atmosphere [26,27] with maximum PM 10 concentrations [22]. In March, AOD 550 above 0.6 extends from the Bodele depression in Niger (South of the Chad lake) to the southwest near the Atlantic coast, in agreement with the study by Prospero et al. [28] who highlighted the maximum activity in winter for the Bodele source. One can note the very high values of AOD 550 along the Guinean Coast (around 1.5), probably due to the occurrence of black carbon aerosols related to bush fires rather than dust [29]. The June maximum occurs when the monsoon uplifts mineral dust which is mixed over the atmospheric column. From March to June, the mineral dust mass concentration from the particle analyser TEOM (Tapered Element Oscillating Microbalance), can reach 500 μg/m 3 /hour [22,29], which is more than 10 times higher than the European standards for air quality [30].

3.2. Heat Wave Definition and Categorization

We considered a HW as a period of at least 3 consecutive days above a daily threshold defined as the 90th percentile (P90) of daily T m a x , centred on a 31-day window, as in Russo et al. [31]. T m a x and P90 are averaged in the study region. The three-day duration has been shown to be well adapted to the West African region [4]. The goal here is to study the duration as well as the intensity of the HW in respect to the aerosol properties. To characterise the HW intensity, we used the T m a x minus the P90 difference during the HW length.
After detecting the HW, MODIS aerosol products can be successfully used to indicate the presence of dust [32]. For each HW event identified, we combined the AOD 550 and the AE 440 870 in order to identify dust aerosols during HWs by each pixel. According to Eck et al. [33], the desert dust can be characterised by a very high AOD concomitantly with low AE, i.e., a high quantity of desert dust in the atmosphere.
In the Sahelian context, a day is considered very dusty if the AOD 550 ≥ 1, dusty if the AOD 550 is between 0.5 and 1 and not very dusty if the AOD 550 < 0.5 [27]. Regarding aerosol composition, fine particles correspond to AE 440 870 > 0.5 and coarse particles to AE 440 870 < 0.5 [19]. This information on AOD 550 and AE 440 870 is combined to define the type of each HW: Type 1, Type 2 and Type 3 (see Section 4.1 for details).

4. Results

4.1. Aerosol Characteristics during the Spring Heat Waves

Table 1 reports the main characteristics of the HW in 2003–2014. The first column (Date) reports the start date, the end date, the month and the year of each HW. In the following columns, the number of HW days (Duration) and the mean T m a x allow us to characterise each event. The total number of HWs detected is 14, which represents 66 days over a total of 1440, i.e., approximately 5% of the days for the March–June months. Most of the HWs occur in April (five events) and May (six events). Their mean duration is 4.7 days and the mean HW T m a x is 40.1 °C, i.e., 5 °C above the T m a x climatology (35.2 °C). According to the Expert Team on Climate Change Detection and Indices (ETCCDI) [34,35], the 35 °C threshold for T m a x characterises hot days. We note that HWs have become more frequent since 2010: 9 HWs out of 14 have been detected between 2010 and 2014.
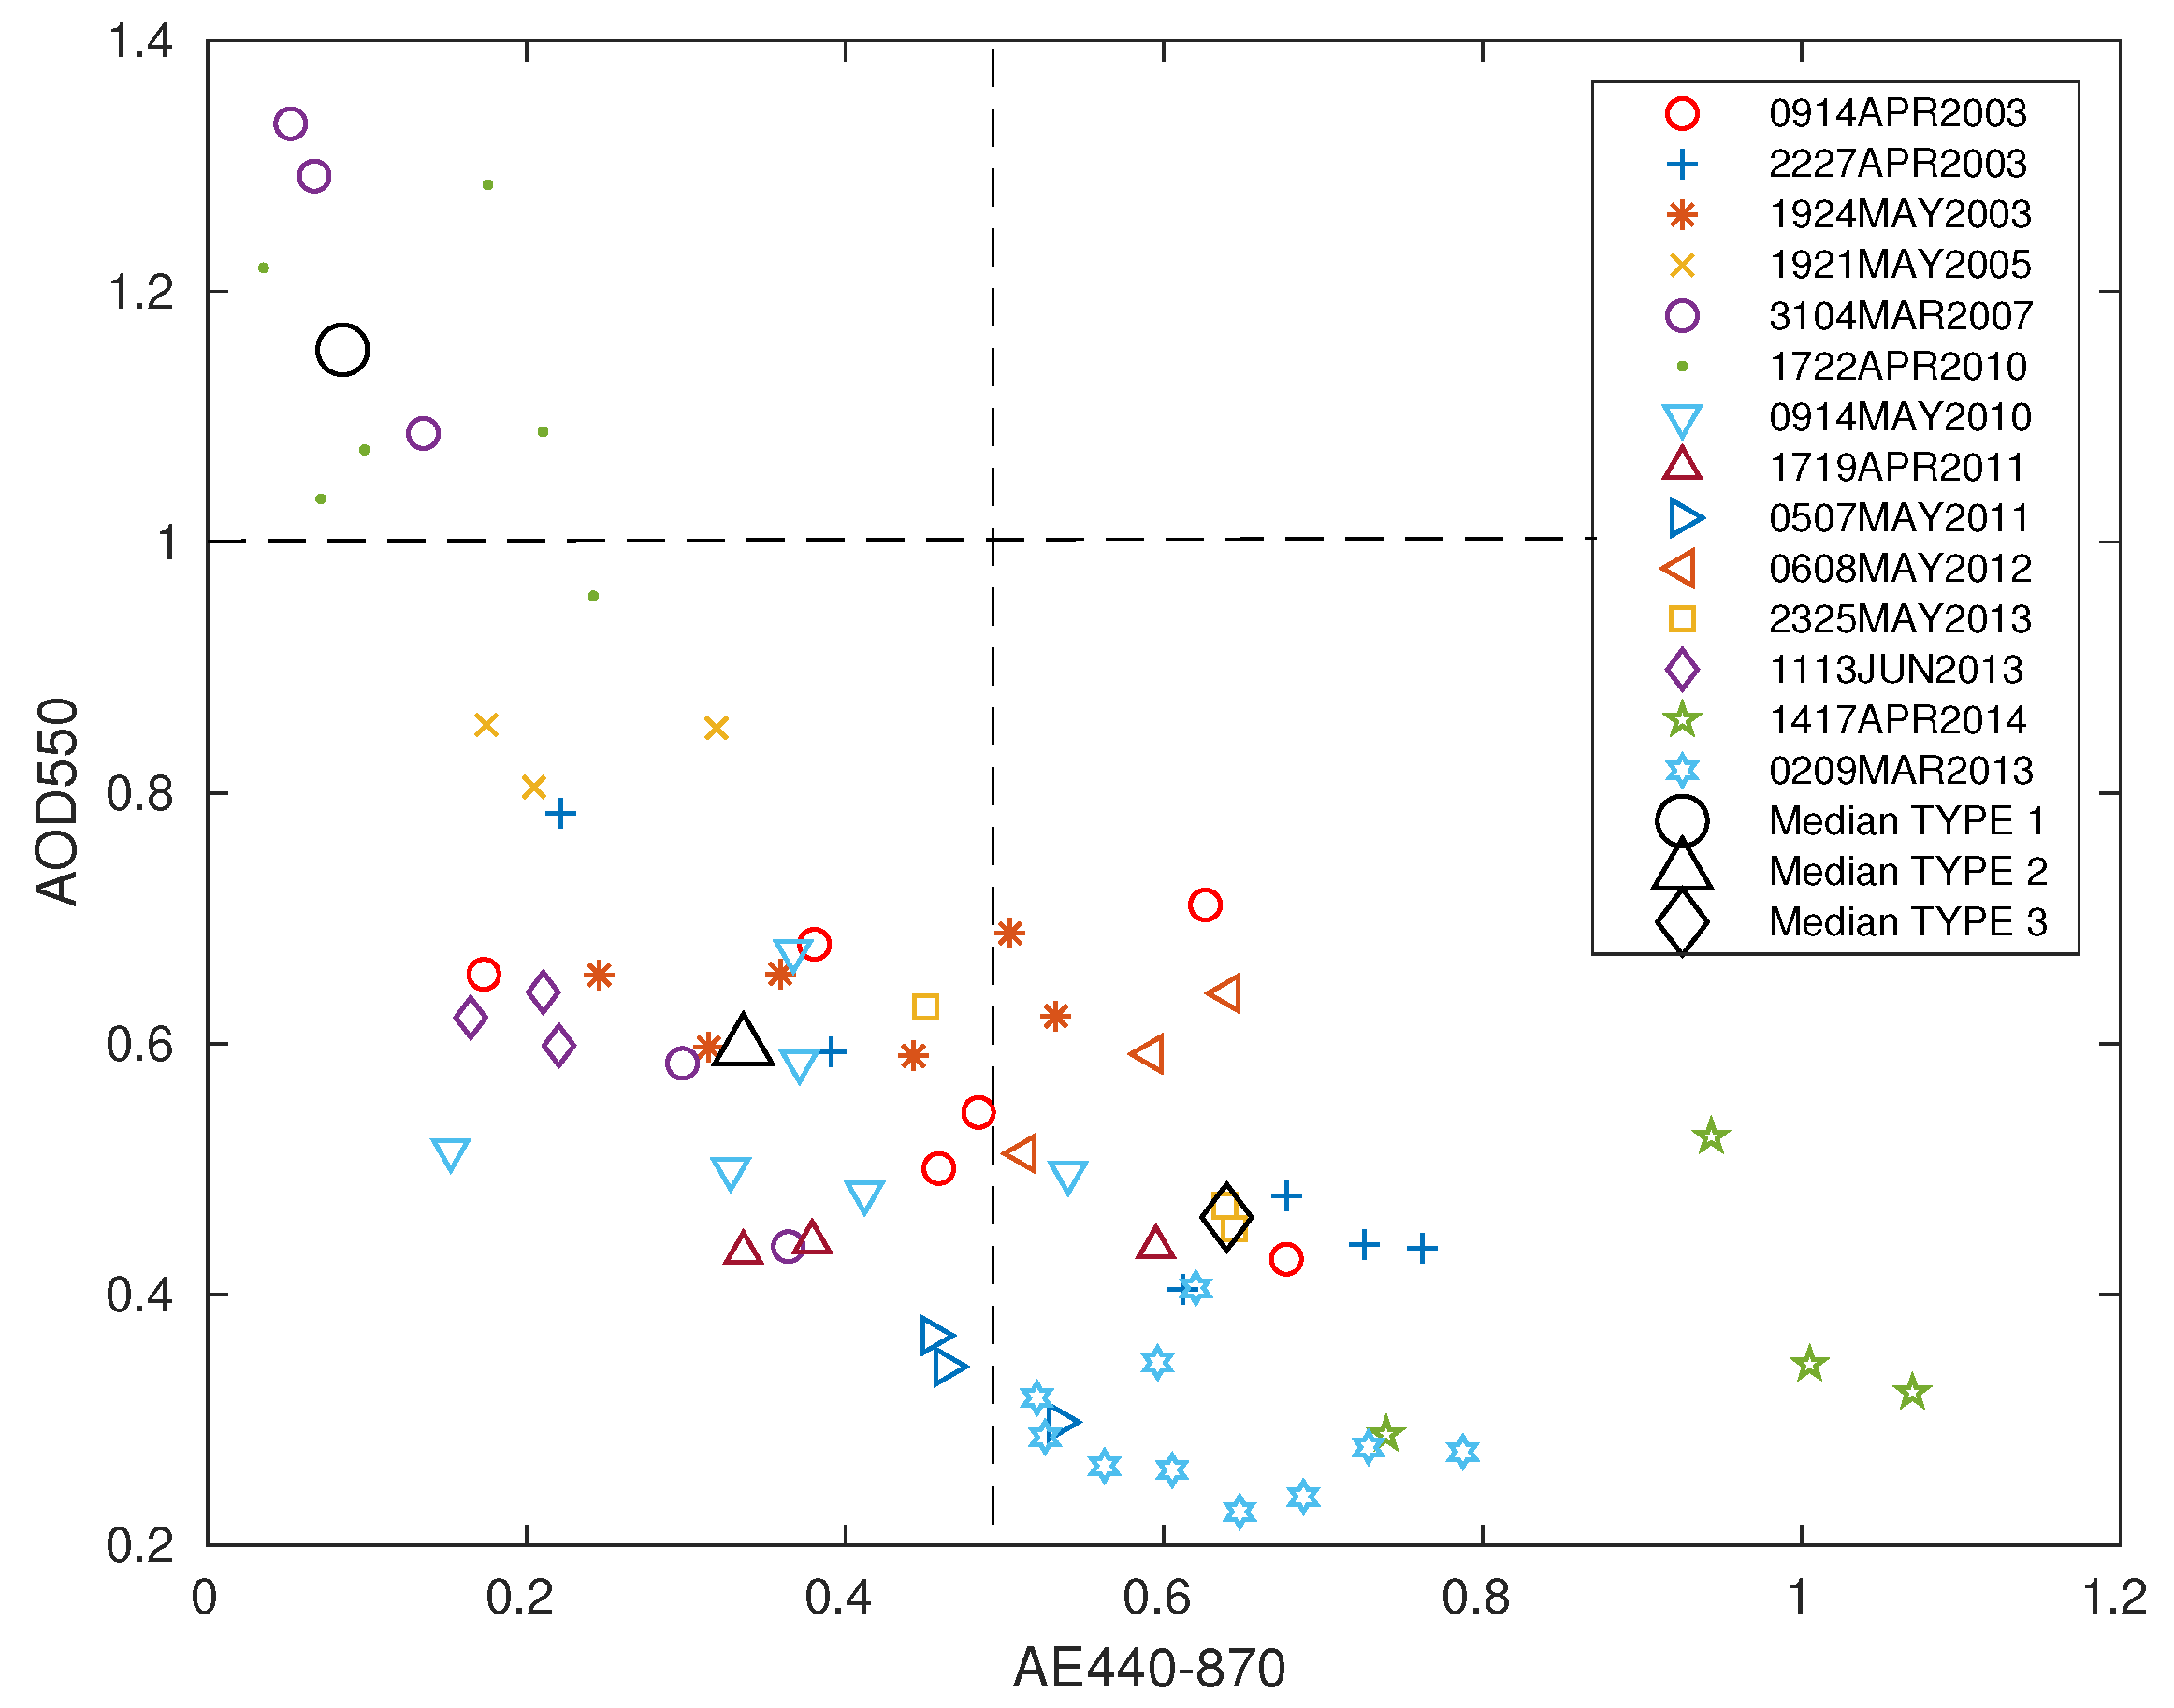
Table 1 also presents the category of each HW regarding the aerosol optical properties (Figure 3). The relationship between AOD 550 and AE 440 870 is consistent with the literature in this area of the world [22,36]. Among the 66 HW days, those with AOD 550 ≥ 1 and AE 440 870 < 0.5 are defined as Type 1, those with AOD 550 < 1 and AE 440 870 < 0.5 as Type 2 and those with AOD 550 < 1 and AE 440 870 ≥ 0.5 as Type 3.
As the days of a given HW can be assigned to two different types (Figure 3), we have used the median value to assign them to the corresponding type. For instance, the first HW detected from 9 to 14 April 2003 (Table 1, first line; Figure 3, red circle) is composed of Type 2 (4 days) and Type 3 (2 days). The final attribution for this HW is Type 2 because the median values for AOD 550 and AE 440 870 are < 1 and < 0.5, respectively. Following the classification, two HWs are attributed to Type 1, in 2007 and 2010, when the spring recorded historical high temperatures in West Africa [4]. Six HWs are assigned to Type 2 and six to Type 3 (Table 1).
Type 1 HWs are characterised by a median AOD 550 of 1.17 and a median AE 440 870 of 0.10. The median SSA 412 and the HW intensity (T m a x −P90)) correspond, respectively, to 0.931 and +1.1 °C. For Type 2, the AOD 550 are almost half of those observed in Type 1 with 0.6 with an AE 440 870 of 0.35. The SSA 412 and the intensity are, respectively, measured at 0.938 (seven-thousandths higher than Type 1) and +0.5 °C. As for Type 3, the AOD 550 is even lower with 0.46. The AE 440 870 is estimated at 0.65. On the other hand, the SSA 412 is three-thousandths lower than that of Type 2 with 0.935 and the estimated intensity is +0.4. These different characteristics are summarised in Table 2.
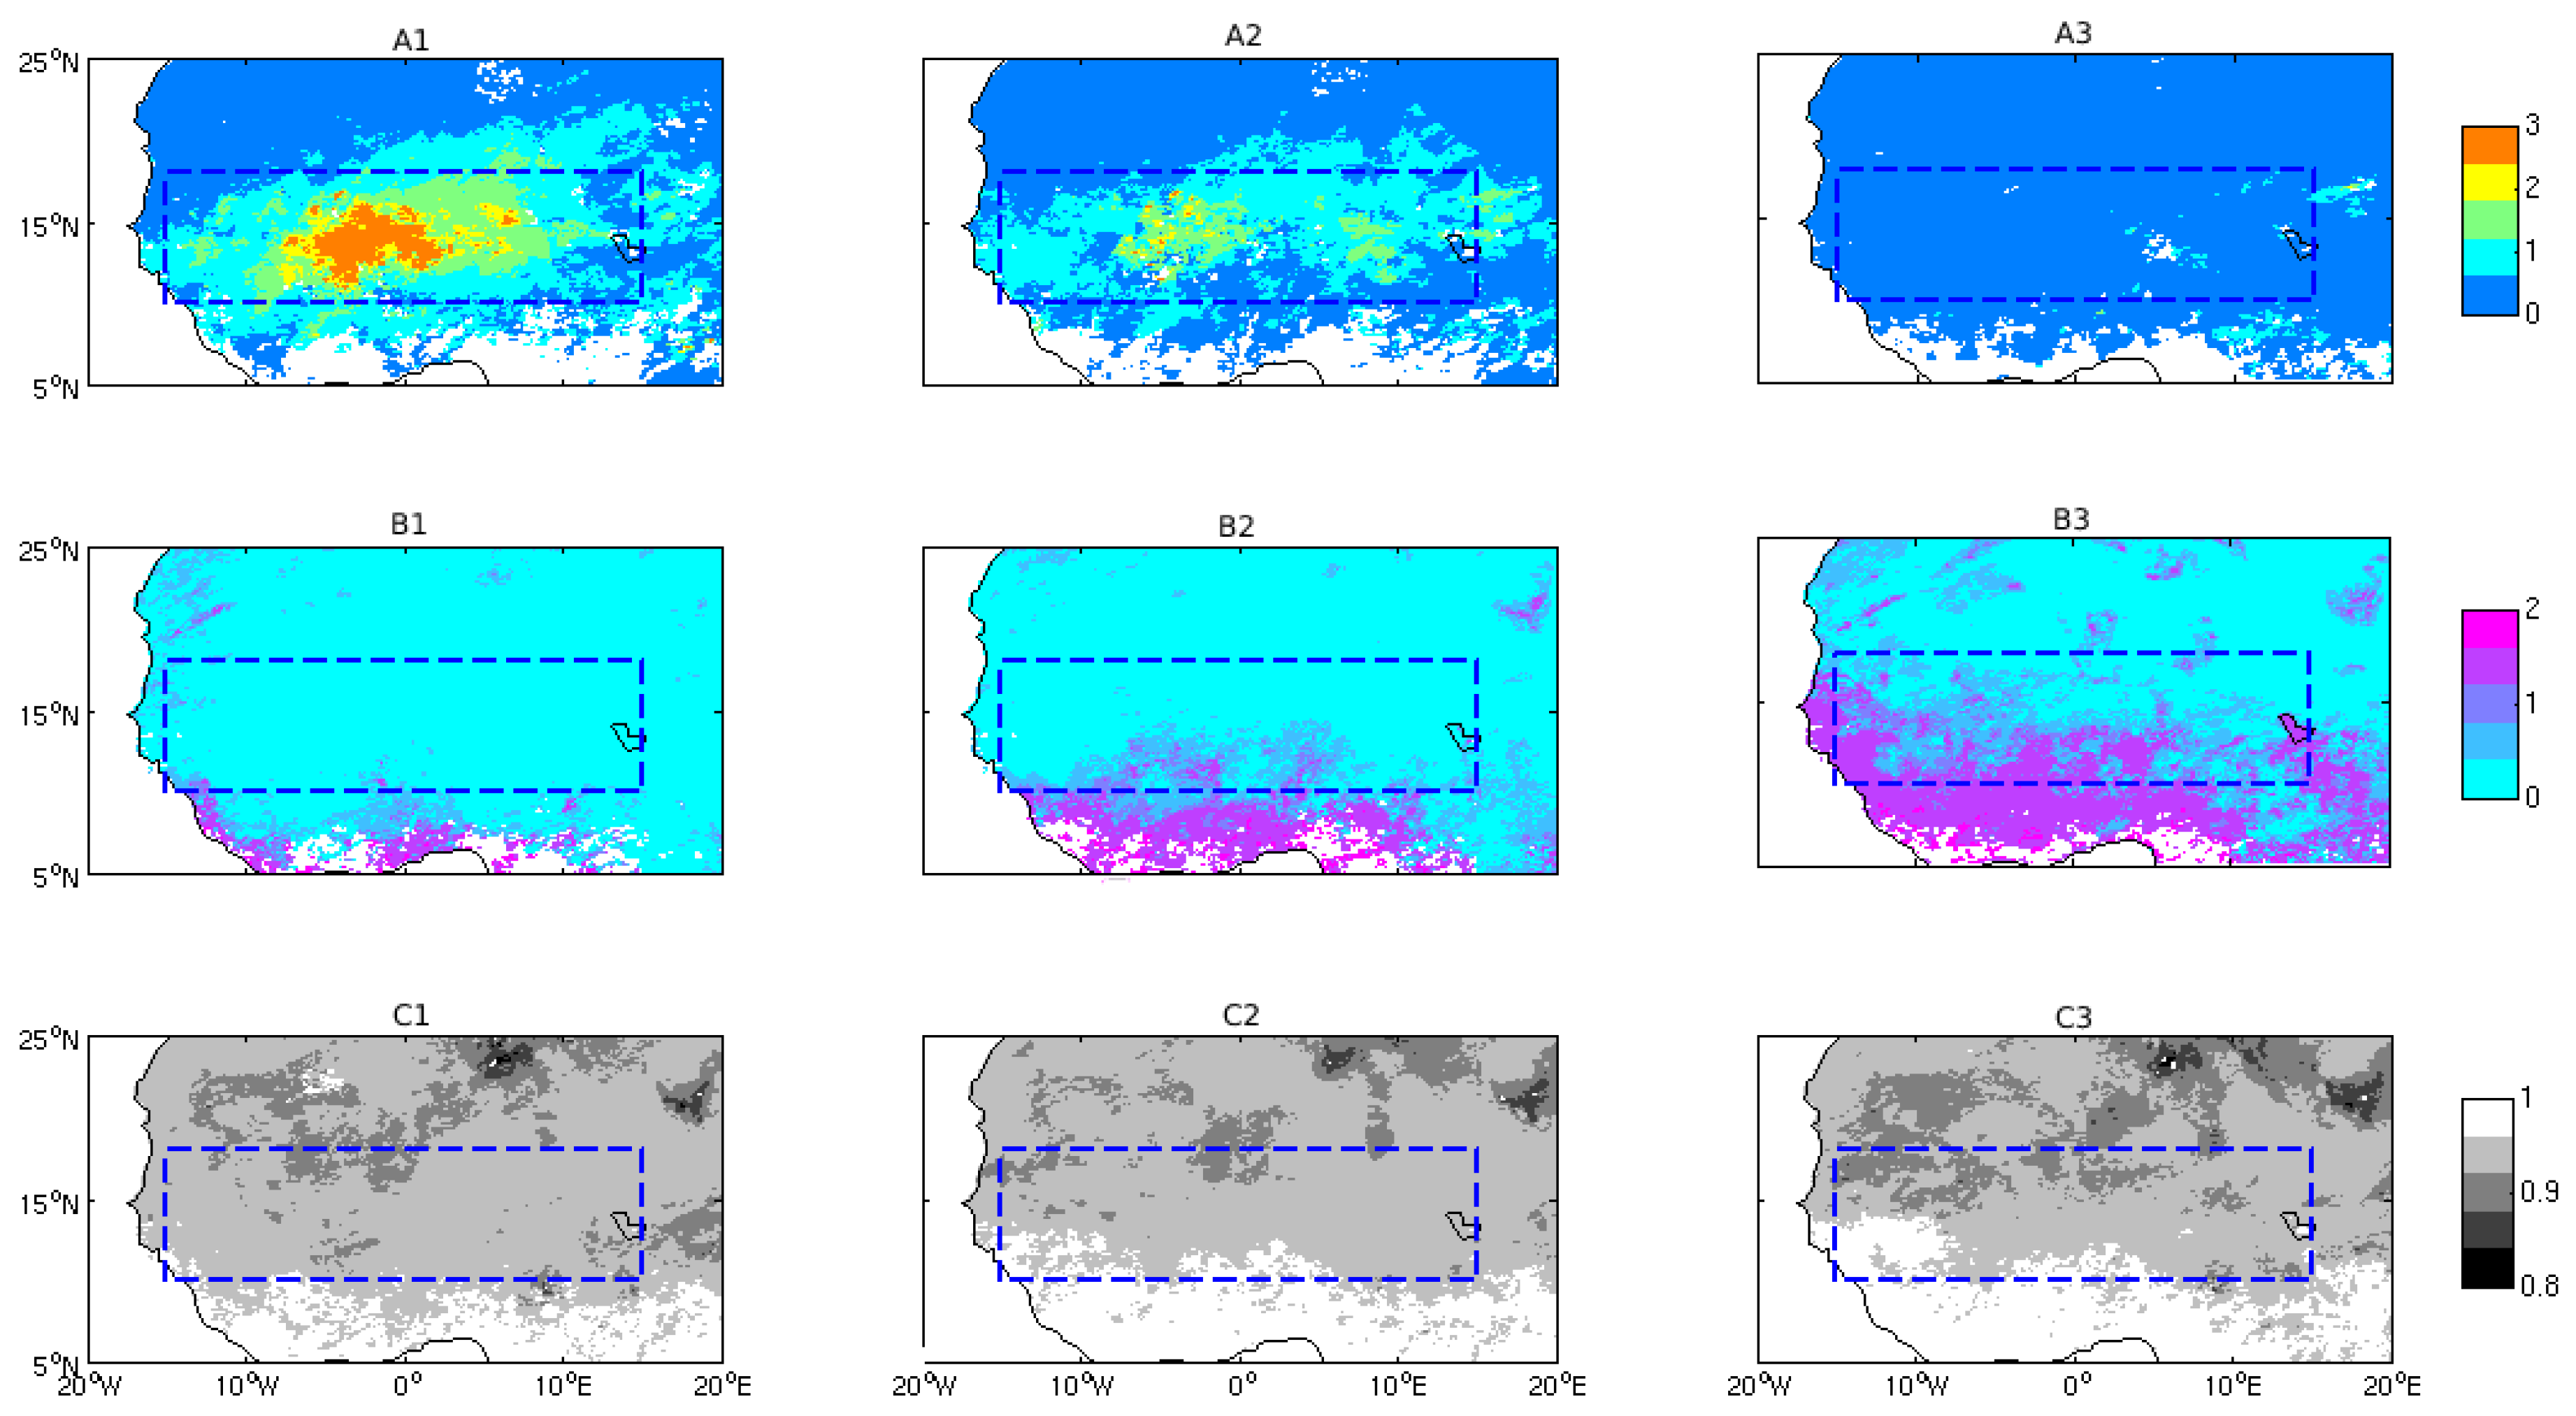
Figure 4 shows the spatial extent of each type of HW according to AOD 550 , AE 440 870 and SSA 412 . Type 1 is marked by a high level of dust, with 98.7% of pixels containing an AOD 550 > 1 and up to 3 in the centre of the study area (Figure 4(A1)). This type corresponds mainly to a pure dust situation (PDS) with 94.7% of pixels containing an AE 440 870 < 0.5 (Figure 4(B1)). Type 2 HWs are also characterised by a strong presence of dust, although this remains lower than in Type 1. Indeed, during these HWs, 96.5% of the study area recorded AOD 550 > 1 (Figure 4(A2)). Like Type 1, Type 2 HWs are regional phenomena with a large spatial scale. However, the composition of the dust during Type 2 events is characterised by a mixture of coarse and fine particles (Figure 4(B2)). Spatial analysis shows this mixed situation with a predominance of coarse particles (MS-CP), with 63.9% of pixels made up of coarse particles (AE 440 870 > 0.5) and 36.1% of fine particles (AE 440 870 < 0.5). For Type 3 HWs, the situation is quite different with lower AOD550s, with almost all pixels recording AOD 550 ≤ 0.5 (Figure 4(A3)). As in the case of Type 3 HWs, a mixed situation is also observed, but this time with a predominance of fine particles (MS-FP) (Figure 4(B3)). In fact, only 43.8% of the pixels contained coarse particles (AE 440 870 < 0.5) compared with 56.2% with fine particles (AE 440 870 > 0.5).
The annual dust cycle correlates well with changes in near-surface convergence associated with the annual north–south movement of the Inter-Tropical Convergence Zone (ITCZ) [37]. The analysis of the mixing situations (MS-CP and MS-FP) shows that there is an intrusion of fine particles from the southern part of the study area coming from the Gulf of Guinea. This situation is typical of that encountered during the transition between the Harmattan and the Monsoon regimes with winds blowing from south to north transporting biomass burning due to fires from the Gulf of Guinea to the Sahel [33]. The difference between the two mixing situations could simply be linked to the fact that the only HW recorded in March (02-09MAR2013) is precisely a Type 3 HW. March is a month in which intrusions of biomass burning from the south are most likely [38].
Note that the absorbing characteristics of aerosols (SSA 412 ) are very close for Type 1 (Figure 4(C1)), Type 2 (Figure 4(C2)) and Type 3 (Figure 4(C3)). This is due to the MODIS Deep Blue inversion which tends to overestimate SSA 412 when compared to the 0.85 value found by Di Bagio et al. (2019) [39] for pure dust based on a large in situ measurements campaign conducted in 19 Sahelian sites. For a mixed situation, the SSA 412 is found to range from 0.85 to 0.90 (e.g., [40]).

4.2. Relationship between Heat Wave Intensity and Aerosol Type and Quantity

We question here the potential relationship between the intensity of the HW and the type of the HW: are the most intense HWs associated with the most absorbent aerosol situations? The intensity of the HW is estimated by the T m a x −P90) difference. We chose the 90th percentile because it is the threshold used to detect the HW [41].
Table 2 shows that Type 1 HWs, corresponding to a PDS (with SSA 412 median of 0.931), is the most intense HW (+1.1 °C). Each day of the two HWs of this type is rather similar in terms of AOD 550 (between 1 and 1.4), AE 440 870 (between 0 and 0.2) and SSA 412 (between 0.920 and 0.936). Conversely, Type 2 and Type 3 (SSA 412 median of 0.938 and 0.935, respectively) are less intense than Type 1 (+0.5 °C and +0.4 °C, respectively). Does this mean that PDS may have a warming effect on HWs? Further, does this mean that absorbing mixed situations, which combines desert dust and potentially biomass burning (MS-CP and MS-FP), may also cause a warming effect, to a lesser extent?
At this stage, we need to be cautious with these results as the MODIS Deep Blue SSA inversions, for all types, appear in the same SSA range. A study by Di Bagio et al. [39] based on dust samples in 19 sites throughout the world found, in the Sahel, SSA values varying from 0.81 in the UV to 0.97 in the near infrared. For a mixed situation, the SSA 440 ranged from 0.85 to 0.90 [40]. The particles observed by MODIS DB products during the HW are therefore much less absorbent than what is described in the literature. This is not that surprising as the SSA at each wavelength is prescribed as a function of location and season, unless heavy dust is detected, in which case, a maximum likelihood method is used to pick from a suite of aerosol optical models [42].
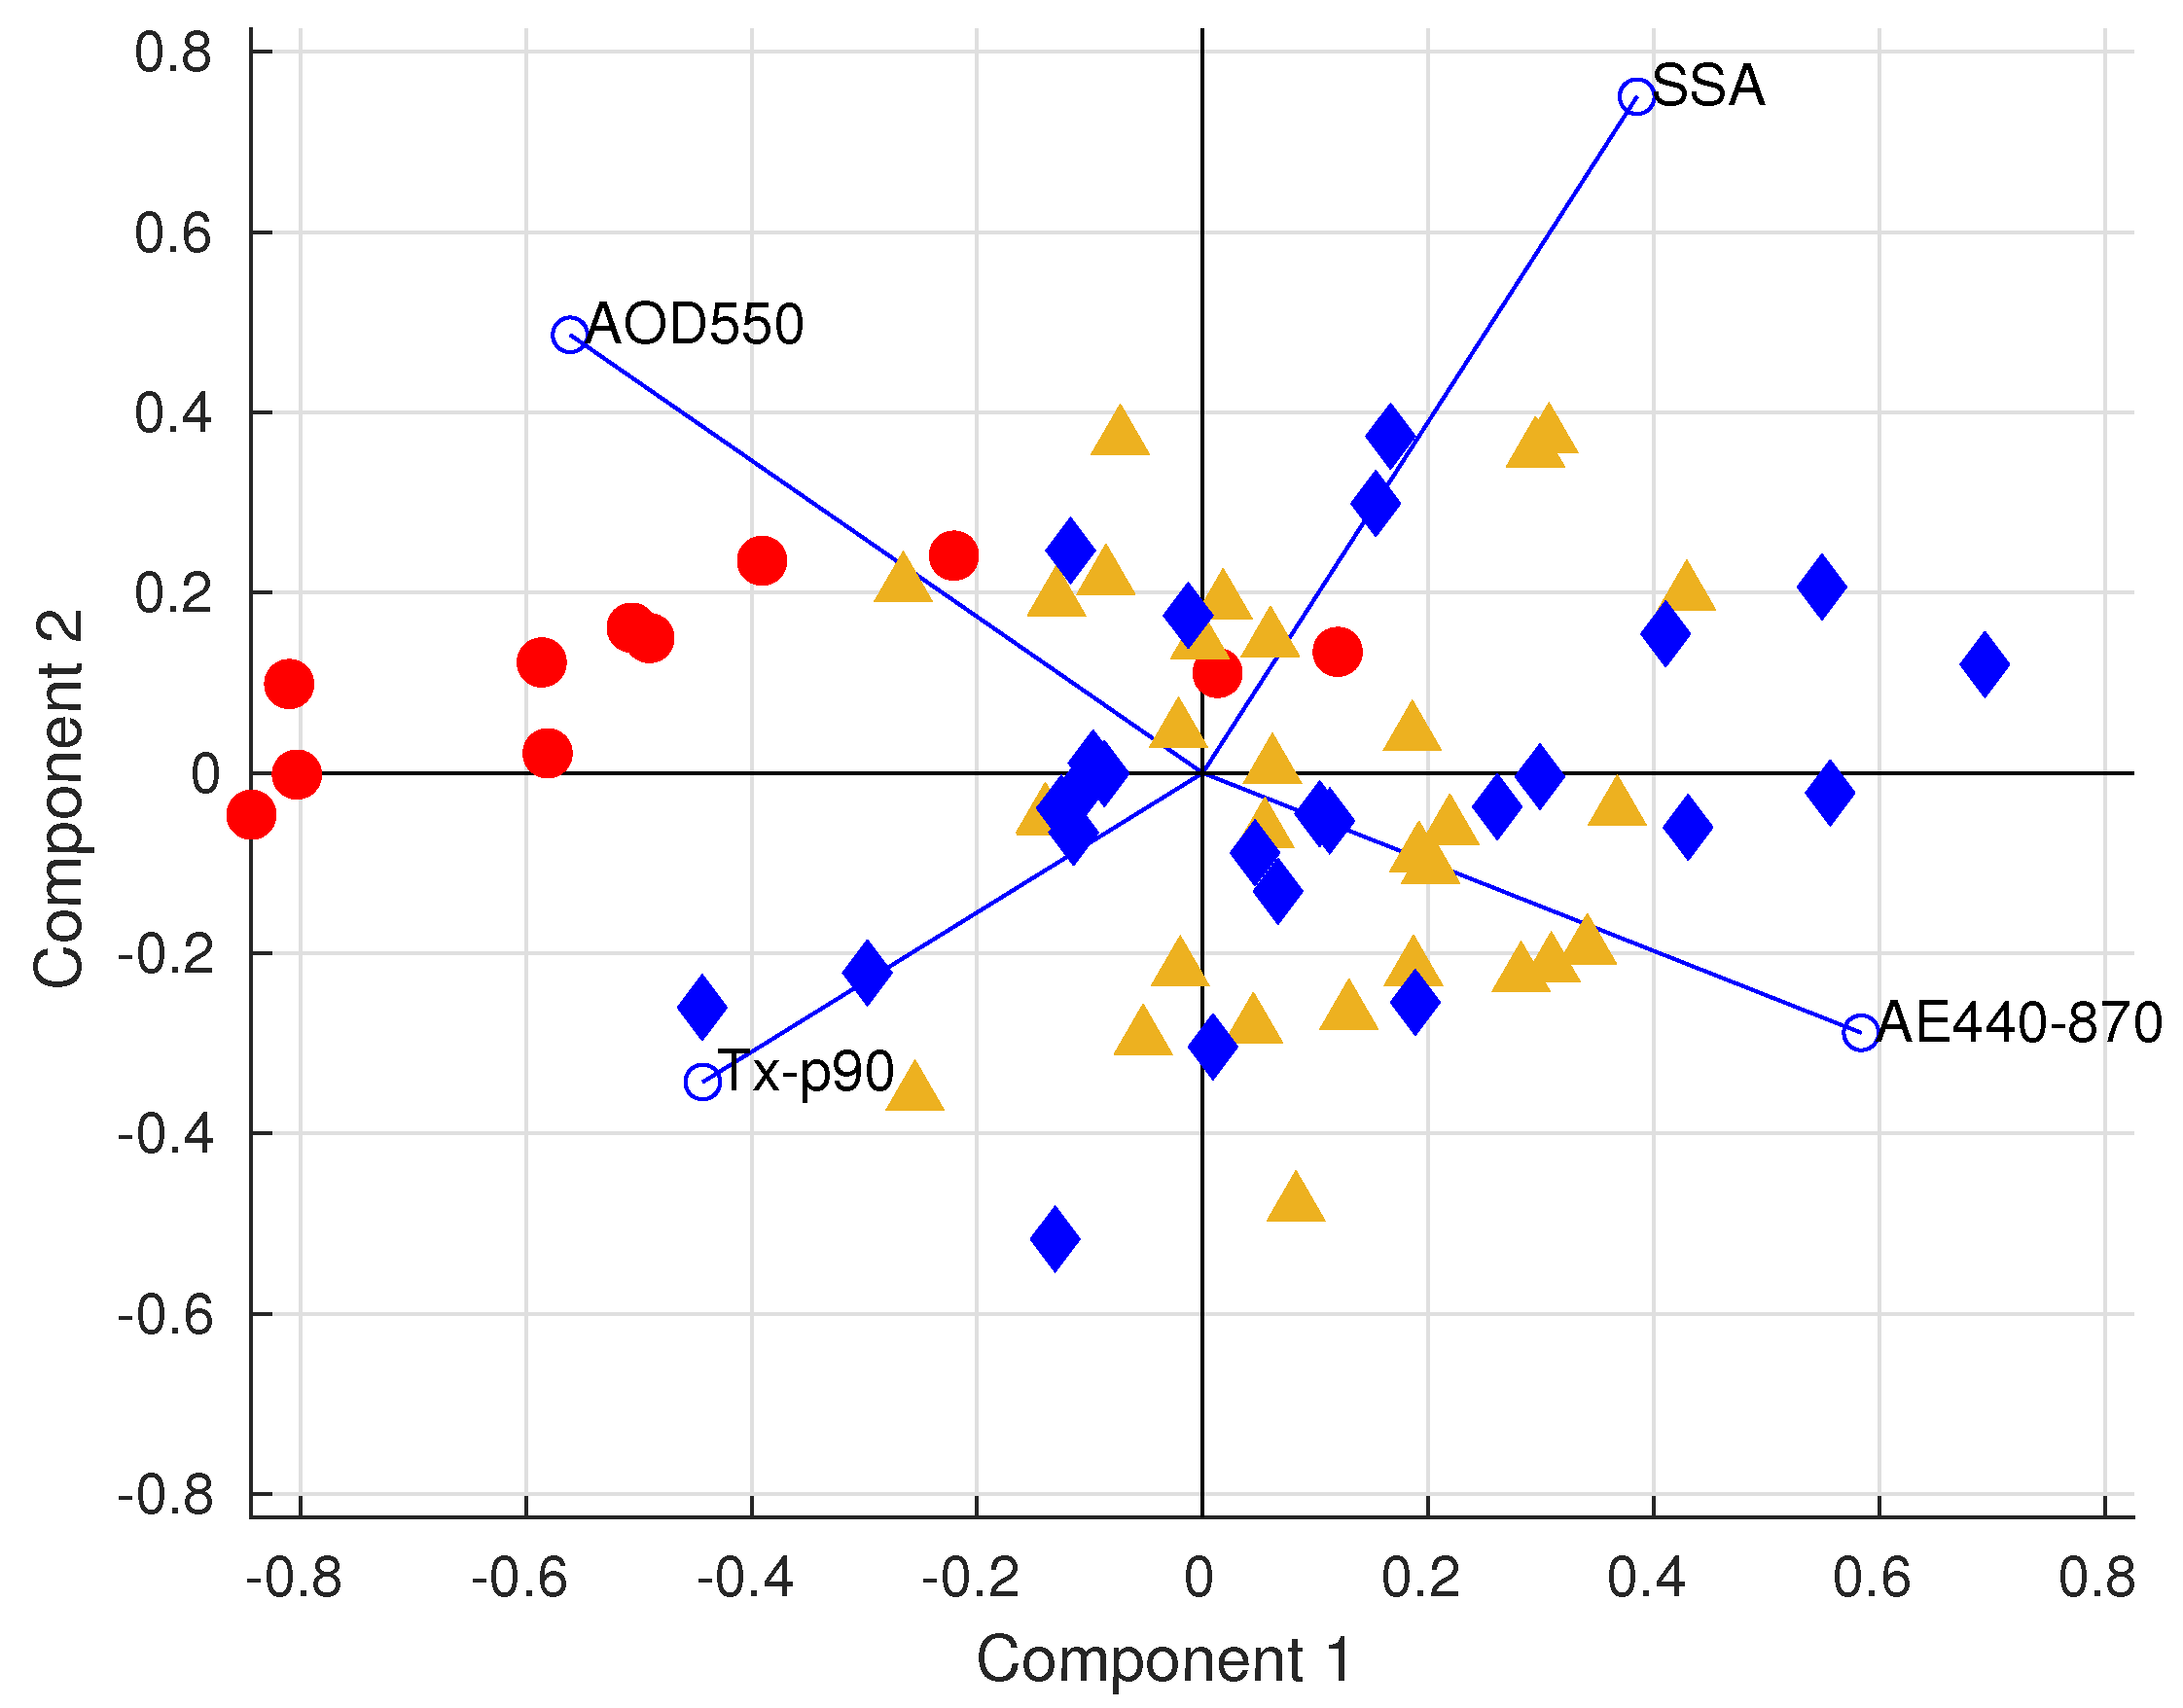
To synthetize the relationship between the HW intensity and the aerosol conditions through the AOD 550 , the AE 440 870 and the SSA 412 , we present the results of a Principal Component Analysis (PCA) [43]. Figure 5 is the scatter plot of the two first principal components which take into account, respectively, 55.3% and 22.3% of the total variance. The variable markers are displayed as segments with large blue circles. The red circles, blue diamonds and orange triangles are, respectively, the markers of Type 1, Type 2 and Type 3 HW days. The correlation coefficients between the variables and Component 1 (horizontal axis) are −0.83 and −0.66 for AOD 550 and T m a x −P90), whereas they are 0.87 and 0.57 for AE 440 870 and SSA 412 . SSA 412 is rather, and strongly, correlated (0.71) to Component 2 (vertical axis). We can therefore notice that AOD 550 and AE 440 870 are of opposite sign on Component 1. As a result, the current PCA highlights that Component 1 (left side) associates very dusty warm days, i.e., high AOD 550 , with coarse particles, i.e., low AE 440 870 , and (right side) less dusty warm days, i.e., lower AOD 550 , with fine particles, i.e., higher AE 440 870 . Indeed, most of the days of Type 1 are on the left side, whereas the days of Type 2 and Type 3 are mainly displayed along the right side of Component 1. Component 2 is structured by the SSA 412 and is associated with the Type 2 and Type 3 days, illustrating their relatively high SSA 412 (less absorption than for Type 1 days).
Finally, Figure 5 shows a clear statistical association between the type of HW and the PDS, supporting the hypothesis developed in this study.

5. Discussion

5.1. Assumption on the Aerosol Vertical Distribution: Focus on Type 1 Heat Waves

According to the previous results, Type 1 HW, from 31 March to 4 April 2007 and from April 17 to 22 2010, may present the strongest heating. Could it be in connection with a high quantity of coarse and highly absorbent aerosols referred to as PDS in this article? As the A O D 550 is integrated over the atmospheric column, one important point to consider here is the altitude of the aerosols. Indeed, at high altitude, aerosols will be more likely to warm the upper layers of the atmosphere and cool the surface layers. Simulations over West Africa for the summer months, during which dust transport occurs at high altitudes [44,45,46] show that dust episodes associated with intense convective events such as squall lines have a positive radiative force in the atmosphere, and a negative radiative force at the surface. Conversely, dust particles near the ground may have a positive impact on the surface atmospheric temperature related to the LW radiation emission [47]. This may then intensify the HW.
In order to characterise the altitude of aerosols during Type 1 HWs, we used the method of Deroubaix et al. (2013) [36], PM 10 surface concentrations, AOD from the AERONET [48] and AOD inverted form MODIS. For the two Type 1 HWs, we extracted the level-two cloud-free bias-noise-reduced AERONET AOD [49] and the SDT PM 10 measurements at ±1 h around the satellite overpass (13.30 p.m. local time) in two stations in Cinzana (Mali) and Banizoumbou (Niger).
Table 3 shows that during the 2007 HW, the MODIS AOD 550 is high both in Cinzana (3.1) and in Banizoumbou (0.6). This result is retrieved in the AERONET ground-based measurements in Cinzana (1.6) and Banizoumbou (2.7), indicating that dust particles are in high quantity both at the surface and in the upper atmospheric layers in the two Sahelian sites. One can note here the specific case of Banizoumbou, with a very high AOD 550 detected from the AERONET (2.7) compared to that from MODIS (0.6), suggesting that aerosols may be more concentrated at the surface in this station than in Cinzana. The surface PM 10 measurements confirm this assumption. In Cinzana, the PM 10 concentration during the 2007 HW is 183 μg/m 3 , whereas in Banizoumbou it reaches 380 μg/m 3 . In both cases, the PM 10 concentrations measured are above the normal PM 10 (144 μg/m 3 for Cinzana and 189 μg/m 3 for Banizoumbou). As a result, during the 2007 HW, dust is found to be in high concentration at the surface over the study region.
During the 2010 HW, the conclusion is similar, with PM 10 surface concentrations considerably higher than the normal PM 10 : 1745 μg/m 3 (2010 HW) versus 157 μg/m 3 (normal) in Cinzana and 565 μg/m 3 (2010 HW) versus 214 μg/m 3 (normal) in Banizoumbou. This emphasises the specificity of the 2010 HW compared to 2007, which experiences lower PM 10 surface concentrations. This result is supported by the higher intensity of the 2010 HW (+1.03 °C) compared to that in 2007 (+0.85 °C) at the scale of the Sahel window. As highlighted by Meloni et al. (2018) [13], the dust radiative effect in infrared is non-negligible, inducing a positive radiative force at the surface. Our results are consistent with their findings. Specific effort should be made to access spatialized PM 10 concentrations at the surface in order to better understand their effect on Tmax. Satellites provide maps of integrated aerosol products over the column but not concentrations at the surface. The next section, based on the CAMS (Copernicus Atmosphere Monitoring Service) [46] illustrates the spatial pattern of PM 10 concentrations for the 2010 HW.

5.2. Analysis of the Specific Case of the Historic 2010 Heat Wave in the Sahel Based on PM 10 Mass Concentrations Products from Reanalysis

The historic 2010 HW in the Sahel starts on 17 April and ends on 22 April 2010. In order to describe the atmospheric circulation associated with the HW, we map the PM 10 concentrations and the wind at 925 hPa, 3 days before the starting day, during the 6 days of the HW and 3 days after the ending day (Figure 6) based on the CAMS reanalysis [46]. Satellite retrievals of AOD, among other variables, are assimilated for the CAMS reanalysis with ECMWFs IFS (European Center for Medium-Range Weather Forecasts Integrated Forecasting System). The spatial resolution is a regular 0.75° × 0.75° grid provided every 3 h on 60 pressure levels.
The PM 10 concentrations increase gradually around 20° N/5° W until the 17th to reach more than 500 μg/m 3 [22,29]. The dust may originate from the Eastern Lybian Desert dust source as identified in Prospero et al. (2002) [28] and transported by the Harmattan winds from the northeast. The PM 10 concentrations remains high during the HW and decrease from the 22th, associated with more developed southern winds penetrating far to he north between 15° N–18° N. This could imply less dust emission from the Lybian source. It is important to note here that the PM 10 surface concentrations are higher during the HW than the days before and after. Oueslati et al. (2017) [5] have shown that the greenhouse effect of water vapour advected from the ocean drives and sustains the HW. Our results suggests that the dust occurrence during the 2010 HW could amplify this effect by absorbing solar radiation. Special attention should be paid on the atmospheric circulation. For instance, the anticylonic circulation located around 20° N/15° W seems like a weather type identified by Moron et al. (2018) [4], which could be related to propagative systems such as Rossby waves [6].

6. Conclusions and Perspectives

The purpose of this study was to enlarge our knowledge of the HW in the Sahel by identifying to what extent the warm days are associated with mineral dust. Further, we estimated the aerosol quantity and type during the HW in order to be able reinforcing or invalidating the assumption according to which above normal Saharan dust (type) amount (quantity) could impact the atmospheric temperature elevation at the surface in West Africa.
We detected and characterised the HW in the Sahel for a 10-year period in the 2000s. Following Russo et al. (2014) [31] based on the P90 threshold, 14 HWs have been detected between 2003 and 2014 (Table 1). Their mean duration is 4.7 days and their mean maximum temperature is 40.1 °C, i.e., 5 °C above the T m a x climatology (35.2 °C). Then, we categorize HWs in three types (Table 1) according to the aerosol properties, AOD 550 , AE 440 870 and SSA 412 (Figure 1 and Figure 3). Type 1, Pure Dust Situation (PDS), corresponds to absorbing dust in very high quantity in the atmosphere with a huge spatial extent. Aerosols in Type 2 and Type 3, less absorbing, are Mixed Situation with Coarse Particles (MS-CP) and Fine Particles (MS-FP), respectively.
Our study shows that the intensity of Type 1 HWs, which is the difference between T m a x and P90, is twice as high as that of Type 2 and Type 3 (+1.1 °C versus +0.5 °C). A focused study on the 2007 and 2010 HWs, both categorized as Type 1, show that PM 10 concentrations are high at the surface, and especially for the 2010 huge and historical HWs, for which the PM 10 mean ranges from 144 μg/m 3 to 214 μg/m 3 , suggesting that this could have effects on the temperature elevation at the surface. This places mineral dust as a potential booster of the spring HW intensity in the Sahel. This result reinforces, for the Sahel, the assumption proposed by Valenzuela et al. (2017) for Saharan dust episodes recorded in Portugal [8] and more recently, by Sousa et al. (2019) for Spain [7].
Our findings raise the question of the potential warming effect of the coarse, particularly absorbing and highly concentrated dust at the surface during HWs from March to June in West Africa. This results put stress on the importance of considering mineral dust in the understanding and modelling of the HWs in the Sahel for the current period and for the next decades. In the context of climate change, more frequent and intense HWs are expected in West Africa [50] as well as more mineral dust, projected to increase by the end of the century which dampens the warming by 0.1–1 °C in all seasons in West Africa [51]. The potential increase in the dusty HWs in the future may be particularly critical for human health impacts, related to the combined dust/temperature factors.
To go further, dusty HWs needs a comprehensive study because they are rare events and the results obtained are difficult to generalize—one solution could be to investigate dust–HW relationships in other tropical regions contaminated by mineral dust as in India or China—but above all, because we need to better understand the aerosol absorption properties and their role in the modification of the radiative budget compared to other factors such as water vapour, cloud cover or other types of aerosols such as biomass burning. A first step would be to work with more robust aerosol absorption products from remote sensing datasets. For instance, the synergy between the Cloud-Aerosol Lidar and Infrared Pathfinder Satellite Observation (CALIPSO) and MODIS could give more precise SSA values at the surface, as suggested by Jeong and Hsu (2008 [45] for biomass burning. Moreover, the CALIPSO data could give information on the vertical distribution of aerosols, type and quantity, specifically PM 10 mass concentrations at the surface [52]. The integration of in situ radiation measurements at different levels in the atmosphere and in different IR bands may also help in constraining the aerosol properties and the radiative effect. This consideration is key as mineral dust has the largest capability to perturb the IR radiative field, due to the particles’ large size and the abundance at the global level, which peaks in the arid regions and their surroundings [28,32]. Another perspective is the clear discrimination between the water vapour effect from the dust radiative forcing during the spring HWs in the Sahel. The study by Largeron et al. (2020) [53] explains that advected water vapour increases the nocturnal radiative warming at the soil surface during Sahelian HWs. Our study suggests that during a Type 1 HW (for instance, in April 2010), Saharan dust could add a warming effect near the surface.
One research line would be to characterise the atmospheric conditions leading to dust emission and transport associated with a HW. For instance, Moron et al. [4] described some weather types associated with the Sahelian HWs that could lead to better understanding of the mineral dust transport and the case of dusty HWs explored in this study.

Author Contributions

Conceptualization, P.M.N., N.M. (Nadège Martiny) and P.R.; methodology, P.M.N., N.M. (Nadège Martiny) and P.R.; data curation, P.M.N.; formal analysis, P.M.N., N.M. (Nadège Martiny) and P.R.; project administration, P.M.N. and N.M. (Nadège Martiny); Supervision, A.T.G., N.M. (Nicolas Marilleau), S.J.; Visualization, P.M.N.; Writing—original draft, P.M.N.; Writing—review & editing, P.M.N., N.M. (Nadège Martiny), P.R. and N.M. (Nicolas Marilleau); funding acquisition, N.M. (Nadège Martiny). All authors have read and agreed to the published version of the manuscript.

Funding

This work was conducted by the MODIS Deep Blue products compiled in the TELEDEM database funded by National Centre for Space Studies (CNES). The lead author has been supported by Research Institute for Development (IRD).

Institutional Review Board Statement

Not applicable.

Informed Consent Statement

Not applicable.

Data Availability Statement

Data sharing not applicable. No new data were created or analyzed in this study. Data sharing is not applicable to this article.

Acknowledgments

The authors acknowledge ECMWF and COPERNICUS for ERA-Interim and CAMS reanalyses. We thank D. Tanré at LOA and J.L. Rageot at LISA for their efforts in establishing and maintaining Banizoumbou in Niger and IER Cinzana in the Mali AERONET sites. We thank LISA for the Sahelian dust transect TEOM dataset. This study benefited from HPC resources from DNUM CCUB (Centre de Calcul de l’Université de Bourgogne).

Conflicts of Interest

The authors declare no conflict of interest.

References

  1. Luterbacher, J.; Dietrich, D.; Xoplaki, E.; Grosjean, M.; Wanner, H. European seasonal and annual temperature variability, trends, and extremes since 1500. Science 2004, 303, 1499–1503. [Google Scholar] [CrossRef] [PubMed]
  2. Schneidereit, A.; Schubert, S.; Vargin, P.; Lunkeit, F.; Zhu, X.; Peters, D.H.W.; Fraedrich, K. Large-scale flow and the long-lasting blocking high over Russia: Summer 2010. Mon. Weather. Rev. 2004, 140, 2967–2981. [Google Scholar] [CrossRef]
  3. Sy, I.; Cissé, B.; Ndao, B.; Touré, M.; Diouf, A.A.; Sarr, M.A.; Ndiaye, O.; Ndiaye, Y.; Badiane, D.; Lalou, L.; et al. Heat waves and health risks in the northern part of Senegal: Analysing the distribution of temperature-related diseases and associated risk factors. Environ. Sci. Pollut. Res. 2022, 29, 83365–83377. [Google Scholar] [CrossRef]
  4. Moron, V.; Oueslati, B.; Pohl, B.; Rome, S.; Janicot, S. Trends of mean temperatures and warm extremes in northern tropical Africa (1961–2014) from observed and PPCA-reconstructed time series. J. Geophys. Res. Atmos. 2016, 121, 5298–5319. [Google Scholar] [CrossRef]
  5. Oueslati, B.; Pohl, B.; Moron, V.; Rome, S.; Janicot, S. Characterization of Heat Waves in the Sahel and Associated Physical Mechanisms. J. Clim. 2017, 30, 3095–3115. [Google Scholar] [CrossRef]
  6. Fontaine, B.; Janicot, S.; Monerie, P.A. Recent changes in air temperature, heat waves occurrences and atmospheric circulation in Northern Africa. J. Geophys. Res. 2004, 118, 8536–8552. [Google Scholar] [CrossRef]
  7. Sousa, P.M.; Barriopedro, D.; Ramos, A.M.; García-Herrera, R.; Espírito-Santo, F.; Trigo, R.M. Saharan air intrusions as a relevant mechanism for Iberian heatwaves: The record breaking events of August 2018 and June 2019. Weather. Clim. Extrem. 2019, 26, 100224. [Google Scholar] [CrossRef]
  8. Valenzuela, A.; Costa, M.J.; Guerrero-Rascado, J.L.; Bortoli, D.; Olmo, F.J. Solar and thermal radiative effects during the 2011 extreme desert dust episode over Portugal. Atmos. Environ. 2017, 148, 16–29. [Google Scholar] [CrossRef]
  9. Osborne, S.R.; Baran, A.J.; Johnson, B.T.; Haywood, J.M.; Hesse, E.; Newman, S. Short-wave and long-wave radiative properties of Saharan dust aerosol. Q. J. R. Meteorol. Soc. 2011, 137, 1149–1167. [Google Scholar]
  10. Bohren, C.F.; Donald, R.H. Absorption and Scattering of Light by Small Particles; John Wiley & Sons: Hoboken, NJ, USA, 2008. [Google Scholar]
  11. Highwood, E.J.; Ryder, C.L. Mineral Dust: A Key Player in the Earth System, 1st ed.; Knippertz, P., Stuut, J.B., Eds.; Springer Science + Business Media: Dordrecht, The Netherlands, 2014; pp. 267–283. [Google Scholar] [CrossRef]
  12. Papachristopoulou, K.; Raptis, I.P.; Gkikas, A.; Fountoulakis, I.; Masoom, A.; Kazadzis, S. Aerosol optical depth regime over megacities of the world. Atmos. Chem. Phys. 2022, 22, 15703–15727. [Google Scholar] [CrossRef]
  13. Meloni, D.; di Sarra, A.; Brogniez, G.; Denjean, C.; De Silvestri, L.; Di Iorio, T.; Formenti, P.; Gómez-Amo, J.L.; Gröbner, J.; Kouremeti, N.; et al. Determining the infrared radiative effects of Saharan dust: A radiative transfer modelling study based on vertically resolved measurements at Lampedusa. Atmos. Chem. Phys. 2018, 18, 4377–4401. [Google Scholar] [CrossRef]
  14. Quijano, A.L.; Sokolik, I.N.; Toon, O.B. Radiative heating rates and direct radiative forcing by mineral dust in cloudy atmospheric conditions. J. Geophys. Res. Atmos. 2000, 105, 12207–12219. [Google Scholar] [CrossRef]
  15. Dee, D.P.; Uppala, S.M.; Simmons, A.J.; Berrisford, P.; Poli, P.; Kobayashi, S.; Andrae, U.; Balmaseda, M.A.; Balsamo, G.; Bauer, P.; et al. The ERA-Interim reanalysis: Configuration and performance of the data assimilation system. Q. J. R. Meteorol. Soc. 2011, 137, 553–597. [Google Scholar] [CrossRef]
  16. Ceccherini, G.; Russo, S.; Ameztoy, I.; Marchese, A.F.; Carmona-Moreno, C. Heat waves in Africa 1981–2015, observations and reanalysis. Nat. Hazards Earth Syst. Sci. 2017, 17, 115–125. [Google Scholar] [CrossRef]
  17. Hsu, N.C.; Jeong, J.M.; Bettenhausen, C.; Sayer, A.M.; Hansell, R.; Seftor, C.S.; Huang, J.; Tsay, S.C. Enhanced Deep Blue aerosol retrieval algorithm: The second generation. J. Geophys. Res. Atmos. 2013, 118, 9296–9315. [Google Scholar] [CrossRef]
  18. Shi, J.H.; Gao, H.W.; Zhang, J. Examination of causative link between a spring bloom and dry/wet deposition of Asian dust in the Yellow Sea. China J. Geophys. Res. 2012, 117, D17304. [Google Scholar] [CrossRef]
  19. Holben, B.N.; Tanre, D.; Smirnov, A.; Eck, T.F.; Slutsker, I.; Abuhassan, N.; Newcomb, W.W.; Schafer, J.; Chatenet, B.; Lavenue, F.; et al. An emerging ground-based aerosol climatology: Aerosol optical depth from AERONET. J. Geophys. Res. 2001, 106, 12067–12097. [Google Scholar] [CrossRef]
  20. Dubovik, O.; King, M. A flexible inversion algorithm for retrieval of aerosol optical properties from sun and sky radiance measurements. J. Geophys. Res. 2000, 105, 20673–20696. [Google Scholar] [CrossRef]
  21. Dubovik, O.; Smirnov, A.; Holben, B.; King, M.; Kaufman, Y.; Eck, T.; Slutsker, I. Accuracy assessments of aerosol optical properties retrieved from Aerosol Robotic Network (AERONET) sun and sky radiance measurements. J. Geophys. Res. 2000, 105, 9791–9806. [Google Scholar] [CrossRef]
  22. Marticorena, B.; Chatenet, B.; Rajot, J.L.; Traore, S.; Coulibaly, M.; Diallo, A.; Koné, I.; Maman, A.; NDiaye, T.; Zakou, A. Temporal variability of mineral dust concentrations over West Africa: Analyses of a pluriannualmonitoring from the AMMA Sahelian dust transect. Atmos. Chem. Phys. 2010, 10, 8899–8915. [Google Scholar] [CrossRef]
  23. Rome, S.; Oueslati, B.; Moron, V.; Pohl, B.; Diedhiou, A. Les vagues de chaleur au sahel: Définition et principales caractéristiques spatio-temporelles (1973–2014). In Proceedings of the 29ème Colloque de l’Association Internationale de Climatologie, Besançon, France, 4–7 July 2016; pp. 345–350, <hal-01360076>. [Google Scholar]
  24. Vizy, E.K.; Cook, K.H. Mid-twenty-first-century changes in extreme events over northern and tropical Africa. J. Clim. 2012, 25, 5748–5767. [Google Scholar] [CrossRef]
  25. Oueslati, B.; Camberlin, P.; Zoungrana, J.; Roucou, P.; Diallo, S. Variability and trends of wet season temperature in the Sudano-Sahelian zone and relationships with precipitation. Clim. Dyn. 2018, 50, 1067–1090. [Google Scholar] [CrossRef]
  26. Schepanski, K.; Tegen, I.; Macke, A. Saharan dust transport and deposition towards the tropical northern Atlantic. Atmos. Chem. Phys. 2004, 9, 1173–1189. [Google Scholar] [CrossRef]
  27. Martiny, N.; Chiapello, I. Assessments for the impact of mineral dust on the meningitis incidence in West Africa. Atmos. Environ. 2013, 70, 245–253. [Google Scholar] [CrossRef]
  28. Prospero, J.M.; Ginoux, P.; Torres, O.; Nicholson, S.E.; Gill, T.E. Environmental characterisation of global sources of atmospheric soil dust identified with the Nimbus 7 Total Ozone Mapping Spectrometre (TOMS) absorbing aerosol product. Rev. Geophys. 2002, 40, 31. [Google Scholar] [CrossRef]
  29. Haywood, J.M.; Pelon, J.; Formenti, P.; Bharmal, N.; Brooks, M.; Capes, G.; Chazette, P.; Chou, C.; Christopher, S.; Coe, H.; et al. Overview of the dust and biomass-burning experiment and African Monsoon Multidisciplinary Analysis special observing period-0. J. Geophys. Res. Atmos. 2008, 113, 20. [Google Scholar] [CrossRef]
  30. Martiny, N.; Roucou, P. Regional dust modeling for the onset of the meningitis outbreaks in Burkina Faso. In Proceedings of the 3rd Iberian Meeting on Aerosol Science and Technology, Oral, Conférence Invitée, Elche, Alicante, Spain, 29 June–1 July 2015. [Google Scholar]
  31. Russo, S.; Dosio, A.; Graversen, R.G.; Sillmann, J.; Carrao, H.; Dunbar, M.B.; Singleton, A.; Montagna, P.; Barbola, P.; Vogt, J.V. Magnitude of extreme heat waves in present climate and their projection in a warming world. J. Geophys. Res. Atmos. 2014, 119, 12500–12512. [Google Scholar] [CrossRef]
  32. Ginoux, P.; Prospero, J.M.; Gill, E.T.; Hsu, N.C.; Zhao, M. Global-scale attribution of anthropogenic andnatural dust sources and their emission rates based on MODIS Deep Blue aerosol products. Rev. Geophys. 2012, 50, RG3005. [Google Scholar] [CrossRef]
  33. Eck, T.F.; Holben, B.N.; Reid, J.S.; Dubovik, O.; Smirnov, A.; O’Neill, N.T.; Slutsker, I.; Kinne, S. Wavelength dependence of the optical depth of biomass burning, urban and desert dust aerosols. J. Geophys. Res. 1999, 104, 31333–31349. [Google Scholar] [CrossRef]
  34. Zhang, X.; Alexander, L.; Hegerl, G.C.; Jones, P.; Tank, A.K.; Peterson, T.C.; Trewin, B.; Zwiers, F.W. Indices for monitoring changes in extremes based on daily temperature and precipitation data. WIREs Clim. Chang. 2011, 2, 851–870. [Google Scholar] [CrossRef]
  35. ETCCDI (Expert Team on Climate Change Detection and Indices). Available online: http://etccdi.pacificclimate.org/list_27_indices.html (accessed on 29 January 2013).
  36. Deroubaix, A.; Martiny, N.; Chiapello, I.; Marticorena, B. Suitability of OMI aerosol index to reflect mineral dust surface conditions: Preliminary application for studying the link with meningitis epidemics in the Sahel, in revision. Remote. Sens. Environ. J. 2013, 133, 116–127. [Google Scholar] [CrossRef]
  37. Engelstaedter, S.; Tegen, I.; Washington, R. North African dust emissions and transport. Earth Sci. Rev. 2006, 79, 73–100. [Google Scholar] [CrossRef]
  38. Roberts, G.; Wooster, M.J.; Lagoudakis, E. Annual and diurnal african biomass burning temporal dynamics. Biogeosciences 2009, 6, 849–866. [Google Scholar] [CrossRef]
  39. Di Biagio, C.; Formenti, P.; Balkanski, Y.; Caponi, L.; Cazaunau, M.; Pangui, E.; Journet, E.; Nowak, S.; Andreae, M.O.; Kandler, K.; et al. Complex refractive indices and single-scattering albedo of global dust aerosols in the shortwave spectrum and relationship to size and iron content. Atmos. Chem. Phys. 2019, 19, 15503–15531. [Google Scholar] [CrossRef]
  40. Kaufman, Y.J.; Tanré, D.; Dubovik, O.; Karnieli, A.; Remer, L.A. Absorption of sunlight by dust as inferred from satellite and ground-based remote sensing. Geophys. Res. Lett. 2001, 28, 1479–1482. [Google Scholar] [CrossRef]
  41. Barbier, J.; Guichard, F.; Bouniol, D.; Couvreux, F.; Roehrig, R. Detection of Intraseasonal Large-Scale Heat Waves: Characteristics and Historical Trends during the Sahelian Spring. J. Clim. 2017, 31, 61–80. [Google Scholar] [CrossRef]
  42. Sayer, J.; Sunderl, T.; Ghazoul, J.; Pfund, J.L.; Sheil, D.; Meijaard, E.; Buck, L.E. Ten principles for a landscape approach to reconciling agriculture, conservation, and other competing land uses. Proc. Natl. Acad. Sci. USA 2013, 110, 8349–8356. [Google Scholar] [CrossRef]
  43. Jolliffe, I.T.; Cadima, J. Principal Component Analysis: A Review and Recent Developments. Philos. Trans. Ser. A Math. Phys. Eng. Sci. 2016, 374, 20150202. [Google Scholar] [CrossRef]
  44. Léon, J.F.; Derimian, Y.; Chiapello, I.; Tanré, D.; Podvin, T.; Chatenet, B.; Diallo, A.; Deroo, C. Aerosol vertical distribution and optical properties over M’Bour (16.96° W; 14.39° N), Senegal from 2006 to 2008. Atmos. Chem. Phys. 2009, 9, 9249–9261. [Google Scholar] [CrossRef]
  45. Jeong, M.J.; Hsu, N.C. Retrievals of aerosol single-scattering albedo and effective aerosol layer height for biomass-burning smoke: Synergy derived from “A-Train” sensors. Geophys. Res. Lett. 2008, 35, L24801. [Google Scholar] [CrossRef]
  46. Inness, A.; Ades, M.; Agusti-Panareda, A.; Barré, J.; Benedictow, A.; Blechschmidt, A.M.; Dominguez, J.J.; Engelen, R.; Eskes, H.; Flemming, J.; et al. The CAMS reanalysis of atmospheric composition. Atmos. Chem. Phys. 2018, 19, 3515–3556, Discussions 1–55. [Google Scholar] [CrossRef]
  47. Tegen, I.; Fung, I. Modeling of mineral dust in the atmosphere: Sources, transport, and optical thickness. J. Geophys. Res. 1994, 99, 22897–22914. [Google Scholar] [CrossRef]
  48. Holben, B.N.; Eck, T.F.; Slutsker, I.; Tanré, D.; Buis, J.P.; Setzer, A.; Vermote, E.; Reagan, J.A.; Kaufman, Y.; Nakajima, T.; et al. AERONET-A Federated Instrument Network and Data Archive for Aerosol Characterization. Rem. Sens. Environ. 1998, 66, 1–16. [Google Scholar] [CrossRef]
  49. Smirnov, A.; Holben, B.; Eck, T.; Dubovik, O.; Slutsker, I. Cloud screening and quality control algorithms for the AERONET database. Remote Sens. Environ. 2000, 73, 337–349. [Google Scholar] [CrossRef]
  50. Sambou, M.J.G.; Pohl, B.; Janicot, S.; Landry Famien, A.M.; Roucou, P.; Badiane, D.; Gaye, A.T. Heat waves in spring from Senegal to Sahel: Evolution under climate change. Int. J. Climatol. 2021, 41, 6238–6253. [Google Scholar] [CrossRef]
  51. Ji, Z.; Wang, G.; Yu, M.; Pal, J.S. Potential climate effect of mineral aerosols over West Africa: Part II—contribution of dust and land cover to future climate change. Clim. Dyn. 2018, 50, 2335–2353. [Google Scholar] [CrossRef]
  52. Léon, J.-F.; Martiny, N.; Merlet, S. A Multi Linear Regression Model to Derive Dust PM10 in the Sahel Using AERONET Aerosol Optical Depth and CALIOP Aerosol Layer Products. Remote Sens. 2020, 12, 3099. [Google Scholar] [CrossRef]
  53. Largeron, Y.; Guichard, F.; Roehrig, R.; Couvreux, F.; Barbier, J. The April 2010 North African heatwave: When the water vapor greenhouse effect drives nighttime temperatures. Clim. Dyn. 2020, 54, 3879–3905. [Google Scholar] [CrossRef]
Figure 1. Daily mean values of T m a x and AOD 550 for a monthly mean value in March, April, May and June over the 2003–2014 period in West Africa. Our study area is defined as the black rectangle (10° N–18° N of latitude and 15° W–15° E of longitude). The sun-photometric stations of Banizoumbou in Niger (13.547° N, 2.665° E) are represented by a red triangle and the station of Cinzana in Mali (13.278° N, 5.934° W) by a green triangle.
Atmosphere 14 01373 g001
Figure 2. Mean annual cycle of T m a x and AOD 550 over the 2003–2014 period in the study area defined by 10° N–18° N of latitude and 15° W–15° E of longitude (black rectangle in Figure 1).
Atmosphere 14 01373 g002
Figure 3. Characterization of aerosols during each HW day based on the AOD 550 (Y-axis) and the AE 440 870 (X-axis). The dashed horizontal (vertical) line indicates the threshold used for the AOD 550 (AE440-870) to define the aerosol type. If the AOD 550 ≥ 1 and the AE 440 870 < 0.5, the HW day is attributed to Type 1. If AOD 550 < 1 and AE 440 870 < 0.5, the HW day is attributed to Type 2. If the AOD 550 < 1 and the AE 440 870 > 0.5, the HW day is attributed to Type 3. The median values of the AOD 550 and the AE440-870 for Type 1 (large black circle), 2 (large black triangle) and 3 (large black lozenge) are reported in the appropriate quadrant.
Atmosphere 14 01373 g003
Figure 4. Averaged aerosol properties in West Africa for the 3 HW types previously identified in Table 1. The map of the mean AOD 550 is represented for Type 1 HW in A1, for Type 2 HW in A2 and for Type 3 HW in A3. The map of the mean AE 440 870 is represented for Type 1 HW in B1, for Type 2 HW in B2 and for Type 3 HW in B3. The map of the mean SSA 412 is represented for Type 1 HW in C1, for Type 2 HW in C2 and for Type 3 HW in C3. Our study area is materialized as the blue rectangle (10° N–18° N of latitude and 15° W–15° E).
Atmosphere 14 01373 g004
Figure 5. Principal plane of the Principal Component Analysis based on the following variables (blue empty circles on the quadrants): the HW intensity (T m a x −P90), the AOD 550 , the AE 440 870 and the SSA 412 . The red circles, yellow triangles and blue lozenges stand for the Type 1, Type 2 and Type 3 HW days, respectively. The principal plane explains 77.6% of the total variance with Component 1 at 55.3% and Component 2 at 22.3%.
Atmosphere 14 01373 g005
Figure 6. Daily maps of PM 10 mass concentrations (in μg/m 3 ) and wind speed (in m/s) and direction at 925 hPa during the historic 2010 HW. The HW starts from 17 April to 22 April. The aerosol and wind conditions are represented 3 days before the starting date (14 April to 16 April) and 3 days after the ending date (23 April to 25 April) of the 2010 HW. Our study area is materialized as the orange rectangle (10° N–18° N of latitude and 15° W–15° E).
Atmosphere 14 01373 g006
Table 1. Characteristics of the heat wave detected in the study area, defined as 10° N–18° N of latitude and 15° W–15° E of longitude, for the 2003–2014 period, between the months of March and June. Column ‘Date’: first and last day of the HW, with the month written as APR for April, MAY for May and JUN for June, and the year. Column ‘Duration’: length in days of the HW event. Column ‘Mean T m a x ’: mean daily maximum atmospheric temperature at 2 m during the HW (in degrees Celsius). Column ‘Type’: give the number (1, 2 or 3) of the type attributed to the HW. A HW is attributed to Type 1 if the median values of AOD 550 HW days ≥ 1 and the median values of AE 440 870 HW days < 0.5. A HW is attributed to Type 2 if the median values of AOD 550 HW days < 1 and the median values of AE 440 870 HW days < 0.5. A HW is attributed to Type 3 if the median values of AOD 550 HW days < 1 and the median values of AE 440 870 HW days > 0.5. The bold dates in the Column ‘Date’ indicate the HW characterised by HW days belonging to a sole type (see Section 4.1 for the detailed explanation). The number of HW days by type: 11 (Type 1), 24 (Type 2) and 31 (Type 3).
DateDurationMean T max Type
9–14 APR 2003641.52
22–27 APR 2003640.83
19–24 MAY 2003640.43
19–21 MAY 2005340.32
31–04 MAR 2007 1540.71
17–22 APR 2010641.11
09–14 MAY 2010640.42
17–19 APR 2011340.42
5–7 MAY 2011340.63
6–8 MAY 2012340.63
23–25 MAY 2013340.72
11–13 JUN 2013339.32
2–10 MAR 2013938.93
14–17 APR 2014440.23
1 31 March to 4 April 2007.
Table 2. Median values of the aerosol properties (AOD 550 , AE 440 870 , SSA 412 ) and HW intensity (T m a x −P90), in degrees Celsius) for Type 1, Type 2 and Type 3 HWs (see Table 1 for the attribution criteria).
AOD 550 AE 440 870 SSA 412 T max -P90
Type 11.170.100.931+1.1
Type 20.600.350.938+0.5
Type 30.460.650.935+0.4
Table 3. Averaged values of aerosol properties during the two Type 1 HWs: from 31 March to 4 April 2007, from 17 April to 22 April 2010. The AOD 550 are inverted from remote sensing (daily MODIS/Aqua products) or measured from the in situ AERONET sun-photometres at a 15-min time-step (see Section 2.2.2 for details). The PM 10 mass concentrations (in μg/m 3 ) are measured from the Sahelian Dust Transect TEOM at a 5-minute time-step (see Section 2.2.3 for details). The AERONET and TEOM measurements are available in two stations in Banizoumbou/Niger (13.547° N, 2.665° E) and Cinzana/Mali (13.278° N, 5.934° W). The ‘Normal TEOM PM 10 ’ corresponds to the averaged values of PM 10 mass concentration TEOM measurements for the Type 1 HW dates from the 2003–2014 period.
Type 1 HW31 March to 4 April 200717 April to 22 April 2010
SitesCinzanaBanizoumbouCinzanaBanizoumbou
MODIS AOD 550 3.10.63.02.9
AERONET AOD 550 1.62.71.51.0
TEOM PM 10 1833801745565
Normal TEOM PM 10 144189157214
Disclaimer/Publisher’s Note: The statements, opinions and data contained in all publications are solely those of the individual author(s) and contributor(s) and not of MDPI and/or the editor(s). MDPI and/or the editor(s) disclaim responsibility for any injury to people or property resulting from any ideas, methods, instructions or products referred to in the content.