Article

Source-Specific Health Risk of PM2.5-Bound Metals in a Typical Industrial City, Central China, 2021–2022

1
School of Environmental Science and Engineering, Hubei Polytechnic University, Huangshi 435003, China
2
Hubei Key Laboratory of Mine Environmental Pollution Control and Remediation, Hubei Polytechnic University, Huangshi 435003, China
3
Huangshi Ecological and Environmental Monitoring Center, Huangshi 435000, China
4
State Key Laboratory of Biogeology and Environmental Geology, School of Environmental Studies, China University of Geosciences, Wuhan 430074, China
*
Authors to whom correspondence should be addressed.
Atmosphere 2023, 14(9), 1406; https://doi.org/10.3390/atmos14091406
Submission received: 26 July 2023 / Revised: 23 August 2023 / Accepted: 4 September 2023 / Published: 6 September 2023

Abstract

:
In order to study the pollution characteristics, sources, and health risks of heavy metals in urban atmospheric PM2.5, samples were collected in Huangshi City from June 2021 to May 2022. The contents of 16 kinds of metal elements were analyzed by XRF, and the pollution degree and sources of elements were analyzed by the enrichment factor method, correlation analysis, and cluster analysis. The health risk of heavy metal elements was evaluated by the USEPA health risk assessment model. The results of enrichment factor analysis show that the metal elements carried by PM2.5 were affected by human emissions except for Ti. Heavy metals mainly come from industrial sources, motor vehicle sources, mixed combustion sources, and dust sources, according to correlation analysis and cluster analysis. Mn had a non-carcinogenic risk to children, and the non-carcinogenic risk of other elements to the human body was generally acceptable. The carcinogenic risks of Cr, As, Cd, and Co exceeded the acceptable carcinogenic risk threshold (10−6 ~10−4), and there were potential carcinogenic risks.

1. Introduction

PM2.5 (aerodynamic equivalent diameter ≤ 2.5 μm) receives widespread attention from scholars at home and abroad because of its small grain size, extensive source, and harm to human health [1,2]. PM2.5 has complicated chemical compositions, showcasing different pollution characteristics depending on different industrial structures, industrial layouts, energy structures, geological positions, and pollutant emission sources in different cities [3]. In addition to affecting ambient air quality [4,5], PM2.5 also influences atmospheric visibility [6,7], atmospheric radiation balance [8], human health, and global climate change [9,10,11]. Studies have shown that long-term exposure to PM2.5-polluted atmospheric environment will increase the risks of developing diseases in the respiratory system, cardiovascular system, immune system, etc. [12,13], even causing premature death [14,15,16]. As a result, it has become the focus of research in the field of atmospheric environment.
Fine particulate matter with a small grain size and a large specific surface area can easily absorb pollutants in the environment (such as heavy metals, polycyclic aromatic hydrocarbons, black carbon, etc.) [17]. As one primary chemical composition of particulate matter [18,19], metal elements are migrated and converted in the air with PM2.5 [20], polluting soil and water bodies through dry and wet deposition. After being absorbed by plants, it enters the human body through the food chain or respiration and constantly accumulates in the human body [21]. Even with a low concentration, these highly toxic metal elements (such as Cr, Cd, As, Pb, and Ni) can trigger greater carcinogenic risk in the body [22] or shorten the lifespan [23]. So far, toxicology studies point out that excessive exposure to heavy metals in PM2.5 may threaten human health, causing respiratory tract and lung inflammation, cardiovascular disease, heart disease, and cancer [24,25,26]. So far, many studies have been carried out at home and abroad on the pollution characteristics, source, and health risk assessment of heavy metals in particulate matter [18,19,27,28,29,30,31,32,33,34]. However, little study has been undertaken on heavy metal pollution of the atmosphere in small and medium-sized cities, particularly in typical industrial cities [32].
Currently, inductively coupled plasma-automatic emission spectrometry (ICP-AES), atomic absorption, X-ray fluorescence, inductively coupled plasma-mass spectrometry (ICP-MS), neutron activation, atomic fluorescence, etc., are used for the analysis and determination of metal elements in particulate matter [35]. Among them, energy-dispersive X-ray fluorescence (ED-XRF) is a non-destructive means of analysis, does not require sample pre-treatment, can significantly reduce the labor intensity of analytical operators, and can detect a variety of elements at the same time. Moreover, the instrument is relatively inexpensive and has low routine maintenance costs, so it is widely used in related research. The sources of heavy metal elements in particulate matter are complex, originating mainly from industrial emissions, traffic exhaust, fossil fuel combustion, waste incineration, crustal dust, etc. [19,27,28,34]. As particulate matter can be suspended in the air for a long period of time, the concentration of particulate matter is not only affected by local sources of pollution emissions but also by meteorological conditions, such as temperature, humidity, wind speed, wind direction, height of the boundary layer, etc., which are important factors affecting the concentration of particulate matter [36,37,38], which in turn may affect the concentration of heavy metals in particulate matter.
The eastern Hubei Province, as an important heavy industry area in Hubei, is not only a nationally important raw material supply base but also an important area with rich metallurgical materials and mineral resources. Located in southeastern Hubei Province, Huangshi City is a subcenter of the Wuhan metropolitan area and an important industrial base in the lower reaches of the Yangtze River. With rapid economic development, Huangshia time-honored industrial city in Hubei Province is prone to environmental pollution, especially against the backdrop of nationwide frequent heavy pollution weather. It was found in numerous studies that the atmosphere [39], soil [40,41], sediment [42,43], street dust [44], and water bodies [45] in this region have serious over-proof heavy metals, posing a great danger to local ecological environmental safety and population health. So far, Huangshi is in the midst of industrial structural transformation and energy consumption structure adjustment to drive the development of non-fossil energy such as wind energy, solar energy, and biomass energy. Despite the significantly improved atmospheric quality during the “14th Five-Year Plan” period, traditional industry and traffic transportation still produce a large amount of pollution, so the atmospheric environment still faces grim pollution. This paper studies PM2.5 concentration, pollution characteristics, source, and health risk of heavy metal elements with a view to providing effective reference and a theoretical basis for the prevention, control, and management of heavy metal pollution of atmospheric particulate matter in Huangshi.

2. Materials and Methods

2.1. Research Area

Huangshi City is located on the south bank of the middle reach of the Yangtze River between the east longitude of 114°31′ and 115°30′ and the north latitude of 29°30′–30°15′, covering a total area of 4583 km2. Huangshi is the birthplace of bronze culture, mining, and metallurgy civilizations in China and the cradle of national industry in modern China. Huangshi governs 4 districts (Huangshigang District, Xialu District, Tieshan District, and Xisaishan District), 1 county (Yangxin County), and administers one county-level city (Daye City). Located in the middle latitude, Huangshi has four distinct seasons, with a cold winter and a warm summer, sufficient sunshine, thermal energy, and rainfall, belonging to a typical subtropical continental monsoon climate.
In this study, sampling monitoring site was located at the top of the office building of the Huangshi Ecological Environment Bureau (115.029213° E, 30.197914° N). With a mixed zone of commerce and residence on the periphery, there is no industrial pollution emission source nearby (Figure 1).

2.2. Sample Collection and Analysis

The four-channel atmospheric particulate sampler (TH-16A, Wuhan Tianhong Environmental Protection Industry Co., Ltd., Wuhan, China) was used to collect ambient air PM2.5 samples from 1 June 2021 to 31 May 2022. The filter membrane used was Teflon (Whatman, 47 mm in diameter). During the two periods of June–September 2021 and April–May 2022, samples were taken once every 3 days. During the two periods of October to December 2021 and January to March 2022, samples were taken once every day. Under a sampling flow of 16.67 L/min, samples were taken from 9:00 to 8:00 the next day for 23 h. Before and after sampling, the filter membrane was equalized for 24 h in a balance room with constant temperature (20 ± 1 °C) and constant humidity (50 ± 5%), and measured with an over-million analytical balance (XP6, Mettler Toledo). Afterwards, the sample membrane was frozen in the refrigerator at −18 °C for sample analysis.
Energy dispersive X-ray fluorescence (ED-XRF) (Epsilon 5, Panalytical B. V., Amsterdam, The Netherlands) was used to measure the 16 elements contained in aerosols on the Teflon sampling membrane filter of 47 mm diameter. The specific analytical methods and steps can be found in the literature [28]. Each filter sample was analyzed for twenty minutes to obtain an X-ray spectrum corresponding to the photon energy. Each peak energy represents an element, and the concentration of that element is calculated by integrating the different peaks. The entire sample analysis was undertaken in the Key Laboratory of Aerosol Chemistry and Physics of the Chinese Academy of Sciences. The instrument was calibrated using MicroMatter (Washington, DC, USA) membrane filter paper in accordance with the NIST 2783 standard. In this study, the method detection limits of the 16 metal elements (MDLs, μg/cm2) were as follows: Mg (0.085), Al (0.043), K (0.006), Ca (0.009), Ti (0.005), V (0.002), Cr (0.003), Mn (0.015), Fe (0.018), Co (0.004), Ni (0.003), Cu (0.004), Zn (0.005), Pb (0.023), Cd (0.020), As (0.028), etc.

2.3. Clustering Analysis

In clustering analysis, two or several similar indexes were classified as one category by successive polymerization according to index similarity and kinship degree. This method is widely used in related studies [28,46].

2.4. Enrichment Factor Method (EF)

The enrichment factor method (EF) is an effective method used to characterize the enrichment degree of microelements relative to the earth’s crust elements and then judge whether the particulate matter belongs to a natural or artificial source. The enrichment factor is calculated as follows [19]:
E F = ( X i / X n ) a t m o s p h e r e ( X i / X n ) e a r t h .
where (Xi/Xn)atmosphere is the concentration ratio between elements to be measured in aerosol and the reference elements; (Xi/Xn)earth is the concentration ratio between elements to be measured in earth crust and the reference elements.
The element Al was selected as the reference element of the earth crust [19], and the soil element concentration of Hubei was taken as the background value [47]. It is generally believed that, if EF < 1, the element is not enriched and is mainly sourced naturally from earth crust or rock weathering without human interference; if 1 ≤ EF < 10, the elements are moderately enriched and are simultaneously affected by natural and artificial sources; if 10 ≤ EF < 20, the elements are massively enriched and are sourced from human activities; if EF ≥ 20, the elements are highly enriched and are seriously polluted by human emissions [18].

2.5. Human Health Risk Assessment

2.5.1. Exposure Dose

Using the USEPA health risk assessment model [48] and referring to the Exposure Factors Handbook of the Chinese Population [49], the human health risk was assessed based on respiratory inhalation of heavy metal elements in PM2.5. In this study, Pb, Zn, Cd, Co, Cr, Cu, Ni, As, Mn, and V are non-carcinogenic elements, while Cd, Cr, Ni, Co, and As are carcinogenic elements.
The average daily exposure dose of non-carcinogenic heavy metal intake in the human body through respiratory inhalation (ADD, mg/(kg·d)−1) is calculated as follows [31]:
A D D i n h = C × I n h R × E F × E D A T × B W .
The lifelong average daily exposure dose of carcinogenic heavy metal intake in human body through respiratory inhalation (LADD, mg/(kg·d)−1) is calculated as follows:
L A D D = C × E F A T × ( I n h R c h i l d × E D c h i l d B W c h i l d + I n h R a d u l t × E D a d u l t B W a d u l t ) .
The values of other parameters in formulas (2) and (3) are detailed in Table 1 [49].

2.5.2. Heath Risk Assessment

Formulas (3)–(5) are used to calculate the non-carcinogenic risk of single heavy metal exposure via respiratory inhalation (HQ), the non-carcinogenic risk of multiple heavy metal exposure (HI), and the carcinogenic risk of single heavy metal exposure (ILCR) [19]:
H Q i = A D D i R f C i ,
H I = i = 1 n H Q i = i = 1 n ( A D D i R f C i ) ,
I L C R = L A D D × S F
where RfCi is the reference dose for the element i, mg/m3; HQi is the non-carcinogenic risk of a single heavy metal under respiratory inhalation; HI indicates comprehensive non-carcinogenic risk of multiple heavy metal elements; ILCR is lifetime incremental carcinogenic risk; and SF is the carcinogenic slope factor (mg·(kg·d)−1). When HQ or HI ≤ 1, the risk is low and ignorable; when HQ or HI > 1, there is a possibility of non-carcinogenic risk for adults and children. When ILCR > 10−4, there is a serious carcinogenic risk; when ILCR is between 10−6 and 10−4, the risk is acceptable or tolerable. When ILCR < 10−6, the risk is ignorable [27,28,30]. Reference values for SF and RfC are shown in Table 2 [31,50].

3. Results and Discussions

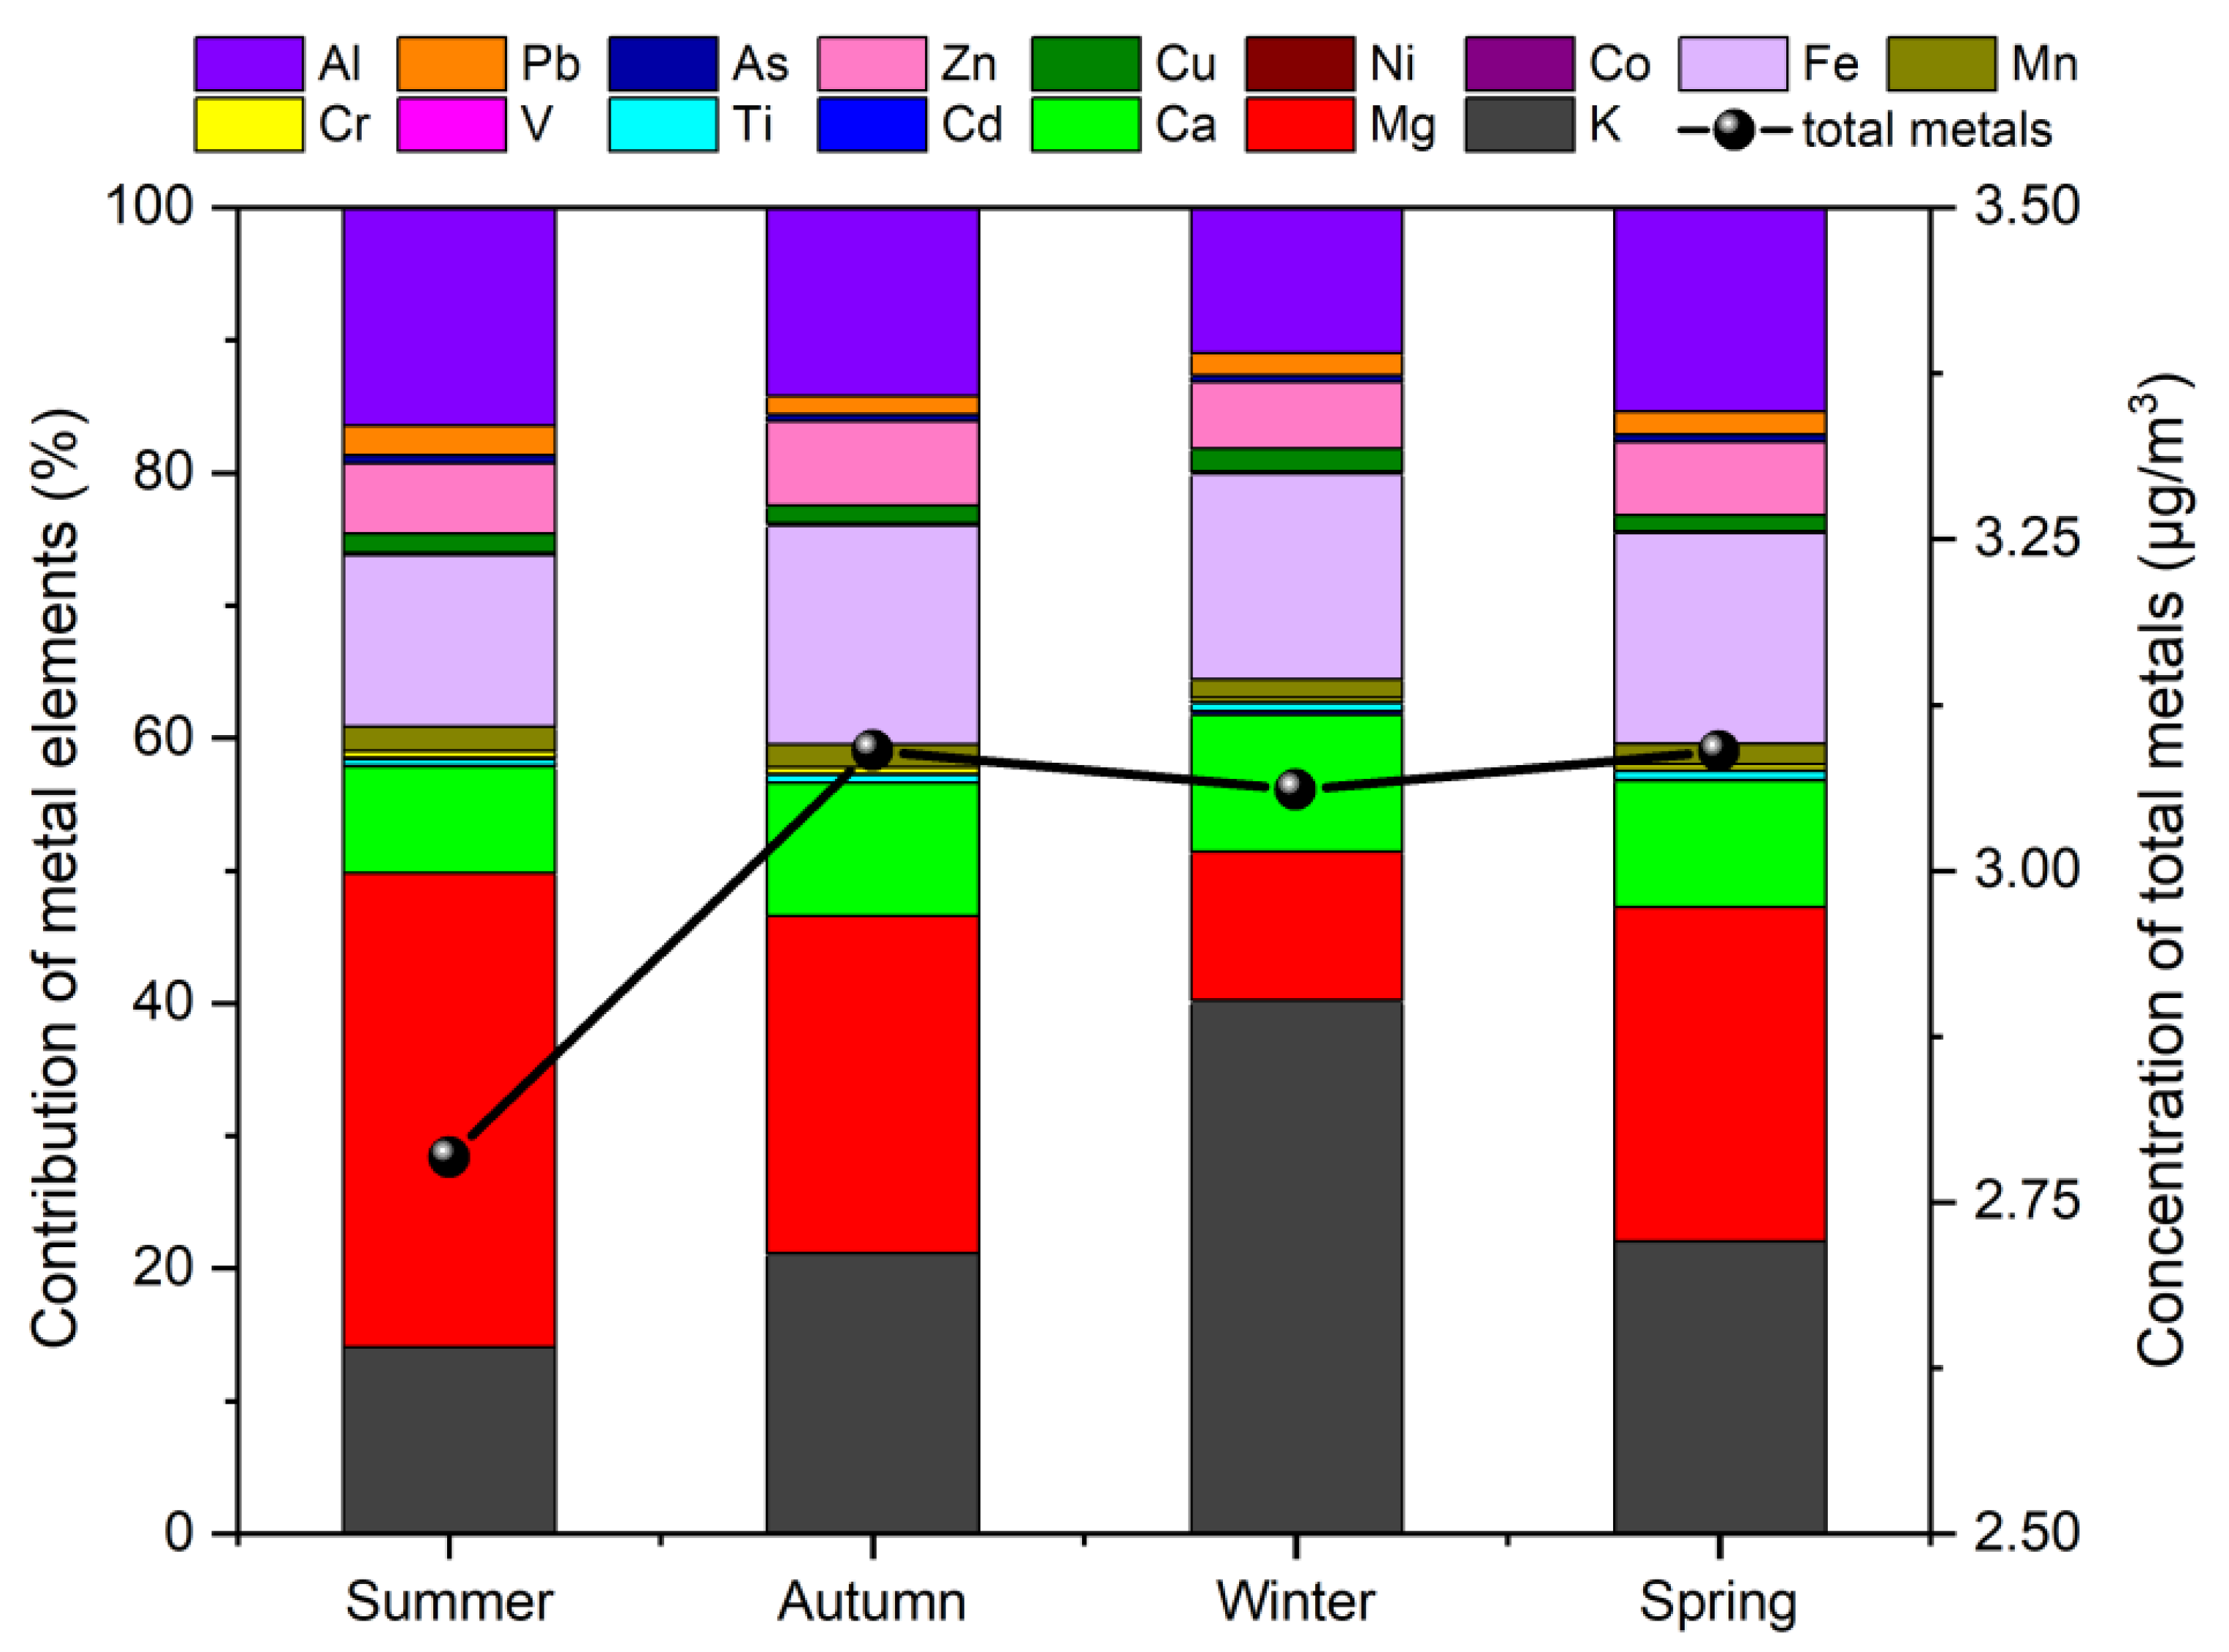
3.1. Seasonal Variation Characteristics of PM2.5 and Metal Elements

The variation characteristics of PM2.5 mass concentration in Huangshi during the monitoring period are shown in Figure 2. The variation range in this region is 5.97–193.08 μg/m3, with an average value of 53.03 ± 28.33 μg/m3, which is far below the concentration limit of the secondary standard of China’s ambient air quality standard (GB3095-2012) (75 μg/m3), but higher than that of the primary standard (35 μg/m3) [51]. Compared with other cities in China, the mass concentration in Huangshi is significantly higher than that in Zhoushan (35 μg/m3), Wenzhou (40 μg/m3), and Taizhou (36 μg/m3) [27] but lower than that in Beijing (84.4 μg/m3) [52], Pingyao (73.88 μg/m3) [30], and Chengdu (67.44 μg/m3) [53], which is much the same as that in Guangzhou (53.39 μg/m3) [54] and Hangzhou (58 μg/m3) [27]. The seasonal variation characteristics of PM2.5 mass concentration in Huangshi are as follows: winter (71.11 μg/m3) > spring (46.08 μg/m3) ≈ autumn (46.06 μg/m3) > summer (25.85 μg/m3). It can be seen that PM2.5 pollution in Huangshi is the most serious in winter, followed by spring, autumn, and summer, which is also consistent with the findings of many other studies at home and abroad [55,56,57,58]. Figure 3 shows the wind rose diagrams for four seasons developed for the same sampling period. From Figure 3, it can be seen that relatively high wind speeds were seen in the general direction of ESE in summer, NW in autumn, WNW in winter, and E and ESE in spring. It seems higher PM2.5 concentrations were connected to the wind coming from the northwestern areas, while lower PM2.5 concentrations were connected to the wind coming from the southeastern areas. The research finds that atmospheric PM2.5 concentrations are influenced by the mixed layer height, which affects the diffusion distance of pollutants in the vertical direction of the atmosphere. Since the atmospheric mixed layer height is lower in winter than in summer and the lower temperature leads to a decrease in atmospheric diffusion and dilution capacity, PM2.5 pollution will be aggravated gradually. In addition, rainfall in Huangshi is mainly concentrated in the summer. While summer rainfall has a certain effect on the removal of particulate matter [59], PM2.5 concentrations are significantly lower in the summer.
The statistical results of the mass concentrations of different metal elements in PM2.5 are shown in Table 3. The concentrations of Mg, Al, K, Fe, and Ca elements were ranked from high to low as K > Mg > Fe > Al > Ca, with all five elements accounting for over 85% of the total elemental mass concentrations (Table 3 and Figure 4). The concentration of crustal elements is significantly higher than trace metal elements, which may be related to traffic and architecture dust, as Al and Fe are indicator elements of soil or crustal elements, and Ca is mainly from soil or architecture dust [60]. The trace element mass concentrations were ranked as Zn > Pb > Mn > Cu > Ti > As > Cr > Cd > Ni > V > Co. People in central China do not apply for coal-fired heating in the winter. Therefore, the seasonal variation characteristics of different elements are different from PM2.5, without an obvious pattern of highs in winter and lows in summer. From the results of the one-way analysis of variance (ANOVA) statistical analysis (Table 3), K, Mg, Al, Co, Cd, Mn, and V showed significant seasonal differences during the four seasons (p < 0.05), while other elements did not show significant seasonal differences. It indicates that there are differences in the sources of some metal elements in different seasons. Referring to China’s ambient air quality standards (GB3095-2012), Cd and Pb concentrations did not exceed the annual average concentration limit. As concentration exceeded the annual average concentration limit (6 ng/m3) with an exceeding multiple of 1.58, based on the calculation that Cr(VI) concentration is 1/7 of the total Cr concentration, the annual average concentration of Cr(VI) is 1.82 ng/m3, which is significantly higher than the annual average concentration limit (0.25 ng/m3), with the exceeding multiple reaching 6.28. Therefore, As and Cr(VI) pollution should be given more attention by the relevant authorities. The annual average concentration of Mn is 48.42 ng/m3, which does not exceed the WHO concentration limit (150 ng/m3) [61].
The contributions of different metal elements in different seasons are shown in Figure 4. From Figure 4, the total concentration of metal elements is lowest in summer (2.78 μg/m3), while it is similar in other seasons. The contributions of most metal elements varied little over the four seasons. The seasonal contributions of Mg and Al were similar, both showing a trend of highest in summer, followed by spring, autumn, and winter. The contribution of K was the highest in winter (40.18%), followed by spring (22.06%), autumn (21.12%), and summer (14.05%). The increase in biomass burning in winter may be responsible for the largest contribution of K in winter. The finding of Yan et al. [31] differed from that of this paper, as they found that most elements in PM2.5 in Shenzhen contributed significantly to autumn and winter but less to spring and summer. The main reason was meteorological conditions.

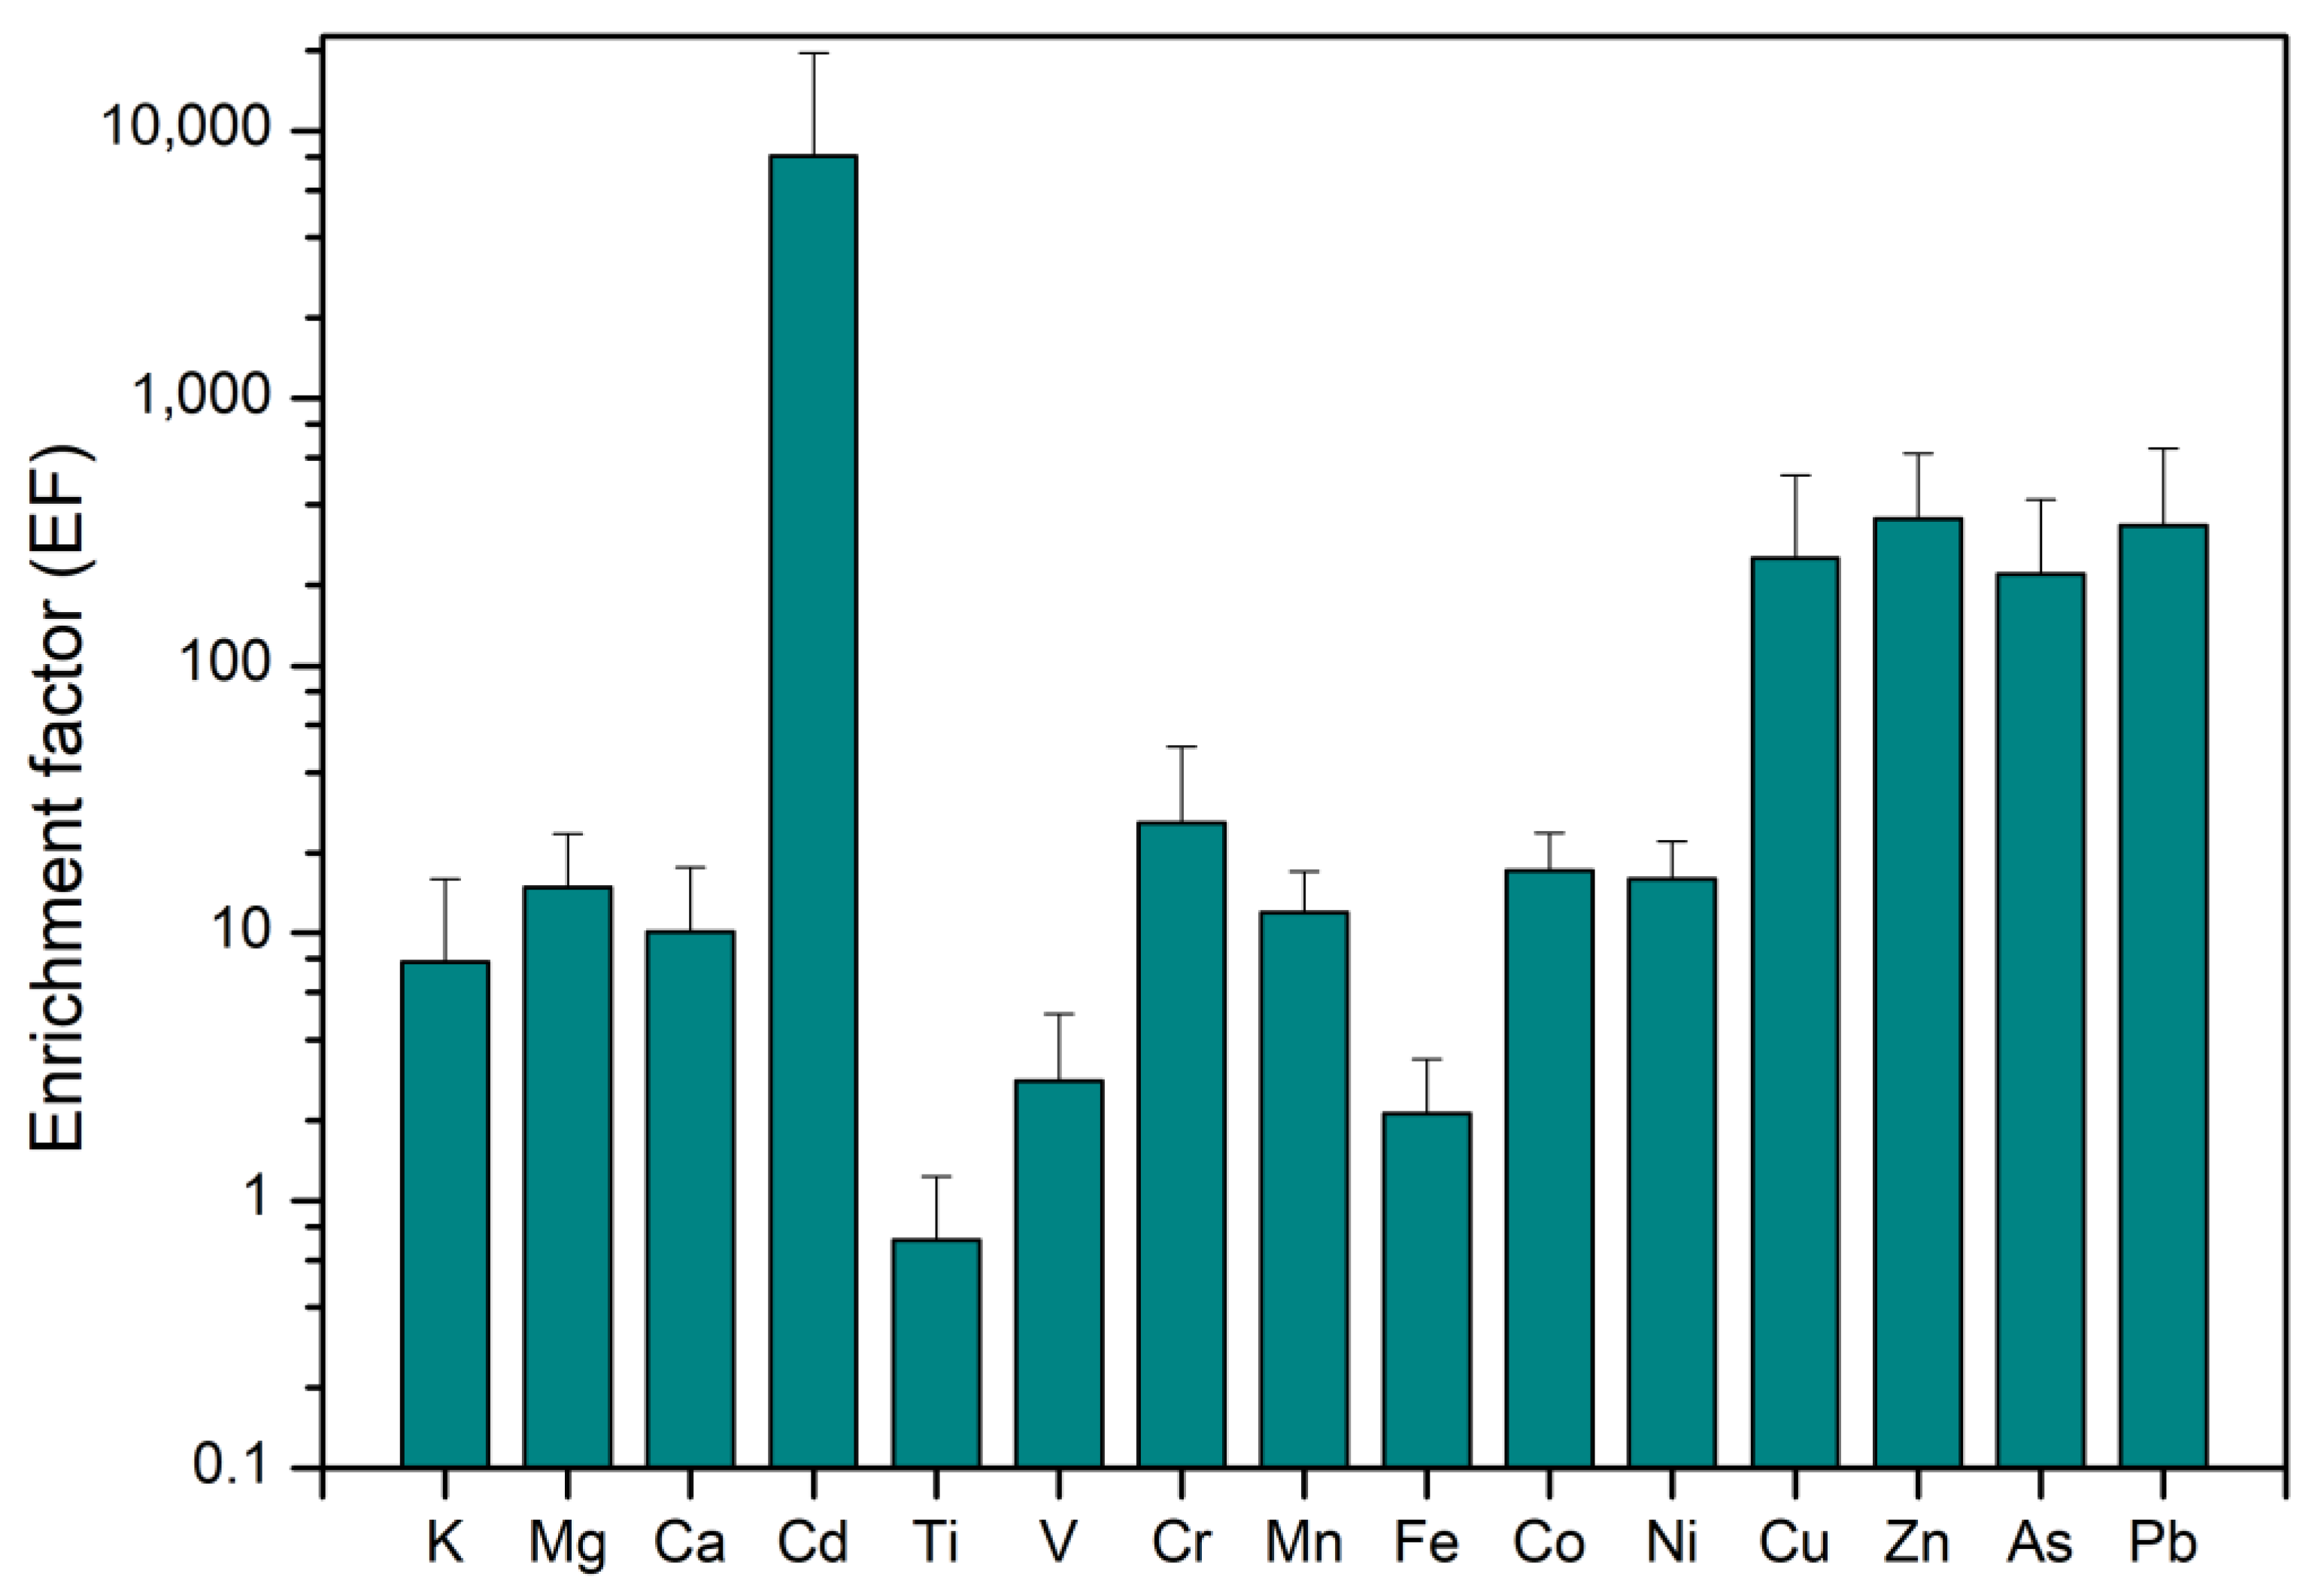
3.2. Evaluation of Metal Element Pollution

To identify the effect of human activities on metal elements in PM2.5, the pollution degree was evaluated by enrichment factors. From Figure 5, the EF of all elements except Ti is greater than 1. The mean values of enrichment factors are ranked as: Cd (8051.80) > Zn (353.84) > Pb (334.04) > Cu (253.19) > As (220.30) > Cr (25.95) > Co (17.08) > Ni (15.97) > Mg (14.82) > Mn (11.89) > Ca (10.07) > K (7.81) > V (2.81) > Fe (2.12). It indicates that the metal elements carried by PM2.5 in Huangshi are influenced by anthropogenic emissions to different degrees. Among them, the EF values of Cd, Zn, Pb, Cu, As, and Cr are all greater than 20, indicating that these elements are heavily polluted by human activities. They may have something to do with road traffic and industrial mineral activities in Huangshi; the EF values of Co, Ni, Mg, Mn, and Ca are between 10 and 20, indicating that these elements have been heavily enriched and mainly from human activities. The EF values of K, V, and Fe are less than 10, indicating that these three elements are moderately enriched and affected by natural and anthropogenic activities; the EF value of Ti was 0.71, indicating that it was not disturbed by human activities and mainly from natural sources such as crustal or rock weathering.

3.3. Source Analysis of Metal Elements in PM2.5

3.3.1. Pearson Correlation Analysis

The results of the Pearson correlation analysis of 16 metal elements in PM2.5 are shown in Figure 6. Ca, Fe, Ti, Mn, and Zn have positive correlations. Ca is significantly correlated with Fe (r = 0.83, p < 0.01), Ti (r = 0.67, p < 0.01), Zn (r = 0.62, p < 0.01), and Mn (r = 0.55, p < 0.01). Ca, Ti, Fe, and Mn are the major components of crustal elements. They may originate from soil dust. Mn was significantly correlated with Fe (r = 0.81, p < 0.01), Ni (r = 0.67, p < 0.01), and Zn (r = 0.66, p < 0.01). Mn and Ni are considered motor vehicle brake wear-releasing elements, and tire wear and motor vehicle exhaust emit Zn and Fe [62,63]. As such, motor vehicle emission sources are the common source of these four elements. Cu is significantly correlated with Zn (r = 0.58, p < 0.01), As (r = 0.63, p < 0.01), and Pb (r = 0.58, p < 0.01); Zn is significantly correlated with As (r = 0.75, p < 0.01) and Pb (r = 0.66, p < 0.01); and As are significantly correlated with Pb (r = 0.82, p < 0.01). As and Pb were tracers of coal-fired sources [18,34]. Pb also originates from metallurgical industries [64] and motor vehicle emissions [33]. Cu and Zn can be derived from industrial emissions, especially metal smelting processes [34], in addition to motor vehicle emissions [30]. Therefore, these four elements may be linked to metallurgical industrial production processes and coal combustion activities.

3.3.2. Cluster analysis

Cluster analysis on 16 metal elements was performed, and the results are shown in Figure 7. From Figure 7, it can be seen that the 16 metal elements were divided into four different groups. Group 1 includes Zn, Pb, Cu, Mn, As, Cr, Ti, Ni, Co, V, and Cd. V and Ni are important markers of liquid fuel combustion [27,28]; Zn, Pb, Cu, and Mn, and Cr are often associated with motor vehicle emissions [27,28] and non-ferrous metallurgy [65]. Co originates from industrial emissions and coal combustion. The mean values of V/Ni, Zn/Pb, and Cu/Pb ratios in this study were 0.52, 3.32, and 0.87, respectively. Referring to the findings of Matawle et al. [66], these elements are derived from motor vehicle emissions. As and Cd are tracers of coal combustion sources [27]. Studies also find that As is derived from metalworking and other industries [34]. In summary, group 1 is mainly associated with emissions from fuel powered motor vehicles and metal smelting. Group 2 includes Al, Fe, and Ca, which are the main components of crustal elements [33], suggesting an association with soil dust. Groups 3 and 4 are Mg and K, respectively, which are distant and discrete from each other; Mg is the marker of soil and road dust [53], while K is the marker of biomass combustion [55]. Therefore, Groups 3 and 4 may reflect biomass combustion sources and road dust sources.

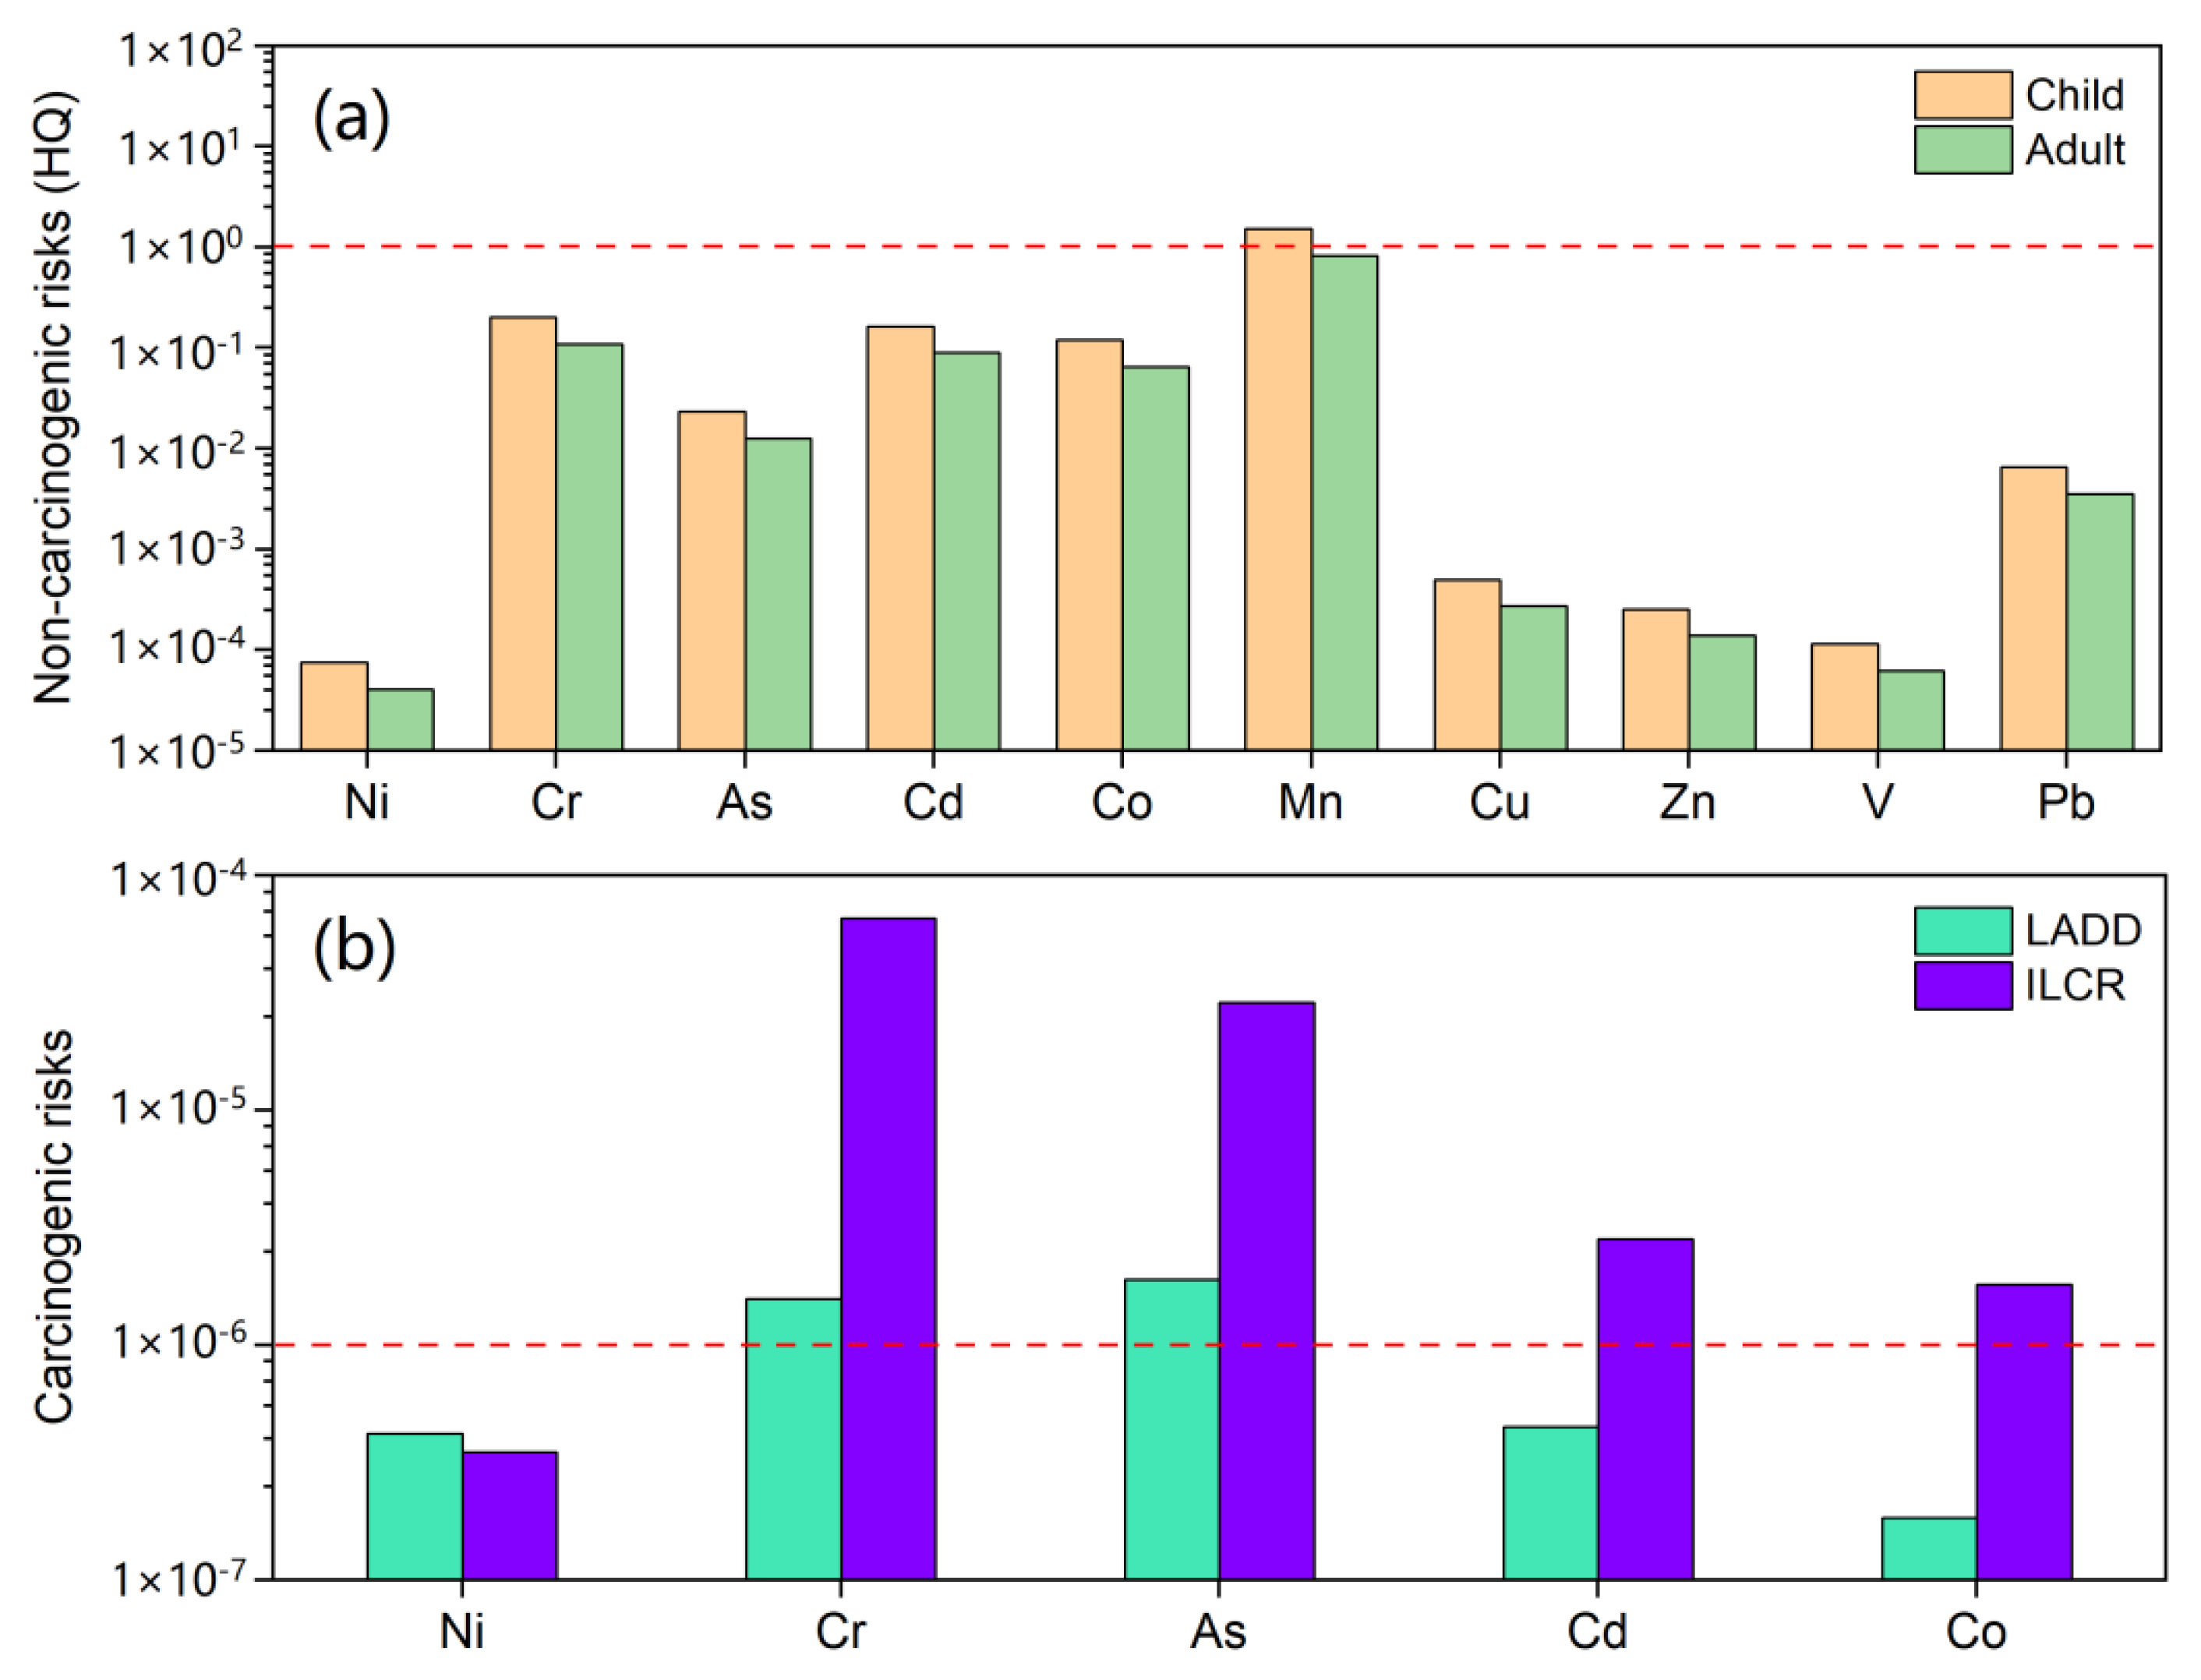
3.4. Health Risks of Metal Elements in PM2.5

The values of HQ, LADD, and ILCR for children and adults exposed to PM2.5 in the respiratory intake pathway are shown in Figure 8. The non-carcinogenic risks of different heavy metal elements are significantly higher in children than in adults (Figure 8). The non-carcinogenic risks caused by the respiratory inhalation pathway were Mn > Cr > Cd > Co > As > Pb > Cu > Zn > V > Ni in descending order. For children, only the HQ value (1.53) of Mn was greater than one, which indicates that they have a non-carcinogenic risk. For adults, the HQ values of each heavy metal element were less than one, which indicates that they have a low non-carcinogenic risk.
The carcinogenic risk of Ni was 3.51 × 10⁻⁷, which was lower than the acceptable risk level of 10−6. The carcinogenic risks of the other four elements were ranked as follows: Cr (6.57 × 10⁻⁵) > As (2.87 × 10⁻⁵) > Cd (2.81 × 10⁻⁶) > Co (1.81 × 10⁻⁶). All of them are between 10−6 and 10−4, indicating that these four elements have potential carcinogenic risks and need certain safeguard measures. As Cr, As, Cd, and Co are involved in industrial production processes, it is necessary to strengthen the supervision of pollution emissions from industrial enterprises, improve process equipment and processes, promote cleaner production, and effectively control exhaust gases, thereby reducing the impact of heavy metal elements on ambient air and reducing health risks.

4. Conclusions

The average daily PM2.5 concentration in Huangshi from June 2021 to May 2022 was 53.03 ± 28.33 μg/m3, which was far below the second-class standard of ambient air quality standards (75 μg/m3). The seasonal variation characteristics of PM2.5 mass concentration were winter > spring ≈ autumn > summer. The concentration of crustal elements (Mg, Al, K, Fe, and Ca) in PM2.5 is the highest, accounting for more than 85% of the total element concentration. The order of mass concentration of trace elements was Zn > Pb > Mn > Cu > Ti > As > Cr > Cd > Ni > V > Co. The results of enrichment factor analysis show that the metal elements carried by PM2.5 were affected by human emissions, and the pollution of Cd, Zn, Pb, Cu, As, and Cr was serious. Heavy metals mainly come from metallurgical industry sources, motor vehicle sources, mixed combustion sources, and dust sources, according to correlation analysis and cluster analysis. During the sampling period, children had a significantly higher risk of non-carcinogenicity than adults under the inhalation routes. Except for Mn, there was a non-carcinogenic risk to children, and the non-carcinogenic risk of other metal elements to humans was within the acceptable range. The carcinogenic risk of Cr, As, Cd, and Co to humans exceeded the risk threshold range (10−6–10−4), and the carcinogenic risk of Ni was lower than the acceptable human risk level.

Author Contributions

Data curtain, S.L. and C.Z.; funding acquisition, Z.L. and X.L.; investigation, H.L. and S.L.; project administration, Z.L. and J.Q.; resources, C.Z. and J.Q.; supervision, C.Z., J.Z., X.L. and C.Q.; writing original draft, Z.L. and C.Z. All authors have read and agreed to the published version of the manuscript.

Funding

This work was supported by the National Natural Science Foundation of China (No. 41603117), the Manual Monitoring of Atmospheric Particulate Component Project of Huangshi City (LY-ZCFW-202105-037/01), and the Foundation of Central Guidance on Local Science and Technology Development (2022BGE252).

Institutional Review Board Statement

Not applicable.

Informed Consent Statement

Not applicable.

Data Availability Statement

The datasets used and/or analyzed during the current study are available from the corresponding author on reasonable request.

Conflicts of Interest

The authors declare no conflict of interest.

References

  1. Pui, D.Y.H.; Chen, S.C.; Zuo, Z. PM2.5 in China: Measurements, sources, visibility and health effects, and mitigation. Particuology 2014, 13, 1–26. [Google Scholar] [CrossRef]
  2. Lin, Y.; Zou, J.; Yang, W.; Li, C.Q. A review of recent advances in research on PM2.5 in China. Int. J. Environ. Res. Public Health 2018, 15, 438. [Google Scholar] [CrossRef] [PubMed]
  3. Cheng, Z.; Luo, L.; Wang, S.; Wang, Y.; Sharma, S.; Shimadera, H.; Wang, X.; Bressi, M.; de Miranda, R.M.; Jiang, J.; et al. Status and characteristics of ambient PM2.5 pollution in global megacities. Environ. Int. 2016, 89, 212–221. [Google Scholar] [CrossRef] [PubMed]
  4. Balasubramanian, S.; Domingo, N.G.G.; Hunt, N.D.; Gittlin, M.; Colgan, K.K.; Marshall, J.D.; Robinson, A.L.; Azevedo, I.M.L.; Thakrar, S.K.; Clark, M.A.; et al. The food we eat, the air we breathe: A review of the fine particulate matter-induced air quality health impacts of the global food system. Environ. Res. Lett. 2021, 16, 103004. [Google Scholar] [CrossRef]
  5. Singh, B.P.; Kumar, P. Spatio-temporal variation in fine particulate matter and effect on air quality during the COVID-19 in New Delhi, India. Urban Clim. 2021, 40, 101013. [Google Scholar] [CrossRef] [PubMed]
  6. Wang, X.; Zhang, R.; Yu, W. The effects of PM2.5 concentrations and relative humidity on atmospheric visibility in Beijing. J. Geophys. Res.-Atmos. 2019, 124, 2235–2259. [Google Scholar] [CrossRef]
  7. Liu, M.; Bi, J.; Ma, Z. Visibility-based PM2.5 concentrations in China: 1957–1964 and 1973–2014. Environ. Sci. Technol. 2017, 51, 13161–13169. [Google Scholar] [CrossRef]
  8. Chen, S.L.; Chang, S.W.; Chen, Y.J.; Chen, H.L. Possible warming effect of fine particulate matter in the atmosphere. Commun. Earth Environ. 2021, 2, 208. [Google Scholar] [CrossRef]
  9. Sun, J.; Liu, H.; Zhang, C.; Liu, X.; Sun, X.; Chen, X.; Yang, G.; Wang, N. Predisposed obesity and long-term metabolic diseases from maternal exposure to fine particulate matter (PM2.5)—A review of its effect and potential mechanisms. Life Sci. 2022, 310, 121054. [Google Scholar] [CrossRef]
  10. Mukherjee, A.; Agrawal, M. World air particulate matter: Sources, distribution and health effects. Environ. Chem. Lett. 2017, 15, 283–309. [Google Scholar] [CrossRef]
  11. Grantz, D.A.; Garner, J.H.B.; Johnson, D.W. Ecological effects of particulate matter. Environ. Int. 2003, 29, 213–239. [Google Scholar] [CrossRef] [PubMed]
  12. Dominici, F.; Peng, R.D.; Bell, M.L.; Pham, L.; McDermott, A.; Zeger, S.L.; Samet, J.M. Fine particulate air pollution and hospital admission for cardiovascular and respiratory diseases. JAMA 2006, 295, 1127–1134. [Google Scholar] [CrossRef] [PubMed]
  13. Nagappan, A.; Park, S.B.; Lee, S.J.; Moon, Y. Mechanistic implications of biomass-derived particulate matter for immunity and immune disorders. Toxics 2021, 9, 18. [Google Scholar] [CrossRef] [PubMed]
  14. Xing, Y.F.; Xu, Y.H.; Shi, M.H.; Lian, Y.X. The impact of PM2.5 on the human respiratory system. J. Thorac. Dis. 2016, 8, E69–E74. [Google Scholar] [PubMed]
  15. Englert, N. Fine particles and human health—A review of epidemiological studies. Toxicol. Lett. 2004, 149, 235–242. [Google Scholar] [CrossRef] [PubMed]
  16. Tarín-Carrasco, P.; Im, U.; Geels, C.; Palacios-Peña, L.; Jiménez-Guerrero, P. Contribution of fine particulate matter to present and future premature mortality over Europe: A non-linear response. Environ. Int. 2021, 153, 106517. [Google Scholar] [CrossRef]
  17. Zhang, R.; Wang, G.; Guo, S.; Zamora, M.L.; Ying, Q.; Lin, Y.; Wang, W.; Hu, M.; Wang, Y. Formation of urban fine particulate matter. Chem. Rev. 2015, 115, 3803–3855. [Google Scholar] [CrossRef] [PubMed]
  18. Li, F.; Yan, J.; Wei, Y.; Zeng, J.; Wang, X.; Chen, X.; Zhang, C.; Li, W.; Chen, M.; Lü, G. PM2.5-bound heavy metals from the major cities in China: Spatiotemporal distribution, fuzzy exposure assessment and health risk management. J. Clean. Prod. 2021, 286, 124967. [Google Scholar] [CrossRef]
  19. Bui, D.L.; Hoang, A.L.; Ngo, Q.K.; Nghiem, X.T. Chemical characterization, source apportionment, and health risk assessment nexus of PM2.5-bound major heavy metals in Bien Hoa city, southern Vietnam. Atmos. Environ.-X 2023, 17, 100209. [Google Scholar] [CrossRef]
  20. Ma, Q.; Wu, Y.; Zhang, D.; Wang, X.; Xia, Y.; Liu, X.; Tian, P.; Han, Z.; Xia, X.; Wang, Y.; et al. Roles of regional transport and heterogeneous reactions in the PM2.5 increase during winter haze episodes in Beijing. Sci. Total Environ. 2017, 599–600, 246–253. [Google Scholar] [CrossRef]
  21. Shahid, M.; Natasha; Dumat, C.; Niazi, N.K.; Xiong, T.T.; Farooq, A.B.U.; Khalid, S. Ecotoxicology of Heavy metal(loid)-enriched particulate matter: Foliar accumulation by plants and health impacts. In Reviews of Environmental Contamination and Toxicology; de Voogt, P., Ed.; Springer International Publishing: Cham, Switzerland, 2021; Volume 253, pp. 65–113. [Google Scholar]
  22. Witkowska, D.; Słowik, J.; Chilicka, K. Heavy metals and human health: Possible exposure pathways and the competition for protein binding sites. Molecules 2021, 26, 6060. [Google Scholar] [CrossRef] [PubMed]
  23. Liu, J.; Cao, H.; Zhang, Y.; Chen, H. Potential years of life lost due to PM2.5-bound toxic metal exposure: Spatial patterns across 60 cities in China. Sci. Total Environ. 2022, 812, 152593. [Google Scholar] [CrossRef] [PubMed]
  24. Niu, J.; Liberda, E.N.; Qu, S.; Guo, X.; Li, X.; Zhang, J.; Meng, J.; Yan, B.; Li, N.; Zhong, M.; et al. The role of metal components in the cardiovascular effects of PM2.5. PLoS ONE 2013, 8, e83782. [Google Scholar] [CrossRef] [PubMed]
  25. Zhang, Y.; Ji, X.; Ku, T.; Li, G.; Sang, N. Heavy metals bound to fine particulate matter from northern China induce season-dependent health risks: A study based on myocardial toxicity. Environ. Pollut. 2016, 216, 380–390. [Google Scholar] [CrossRef]
  26. He, X.; Zhao, Q.; Chai, X.; Song, Y.; Li, X.; Lu, X.; Li, S.; Chen, X.; Yuan, Y.; Cai, Z.; et al. Contribution and effects of PM2.5-bound lead to the cardiovascular risk of workers in a non-ferrous metal smelting area considering chemical speciation and bioavailability. Environ. Sci. Technol. 2023, 57, 1743–1754. [Google Scholar] [CrossRef]
  27. Guo, F.; Tang, M.; Wang, X.; Yu, Z.; Wei, F.; Zhang, X.; Jin, M.; Wang, J.; Xu, D.; Chen, Z.; et al. Characteristics, sources, and health risks of trace metals in PM2.5. Atmos. Environ. 2022, 289, 119314. [Google Scholar] [CrossRef]
  28. Qu, Y.; Liu, X.-Q.; Liu, H.-K.; Wang, Q.-Y.; Zhu, C.-S.; Zhou, Y.; Zhang, R.J.; Cao, J.J. PM2.5 elements in the rural area of Jing-Jin-Ji Region in China: Source identification and health risk assessment. Aerosol. Sci. Eng. 2021, 5, 429–439. [Google Scholar] [CrossRef]
  29. Sakunkoo, P.; Thonglua, T.; Sangkham, S.; Jirapornkul, C.; Limmongkon, Y.; Daduang, S.; Tessiri, T.; Rayubkul, J.; Thongtip, S.; Maneenin, N.; et al. Human health risk assessment of PM2.5-bound heavy metal of anthropogenic sources in the Khon Kaen Province of Northeast Thailand. Heliyon 2022, 8, e09572. [Google Scholar] [CrossRef]
  30. Wang, W.; Chen, C.; Liu, D.; Wang, M.; Han, Q.; Zhang, X.; Feng, X.; Sun, A.; Mao, P.; Xiong, Q.; et al. Health risk assessment of PM2.5 heavy metals in county units of northern China based on Monte Carlo simulation and APCS-MLR. Sci. Total Environ. 2022, 843, 156777. [Google Scholar] [CrossRef]
  31. Yan, R.H.; Peng, X.; Lin, W.; He, L.Y.; Wei, F.H.; Tang, M.X.; Huang, X.F. Trends and challenges regarding the source-specific health risk of PM2.5-bound metals in a Chinese megacity from 2014 to 2020. Environ. Sci. Technol. 2022, 56, 6996–7005. [Google Scholar] [CrossRef]
  32. Liu, Y.; Li, S.; Sun, C.; Qi, M.; Yu, X.; Zhao, W.; Li, X. Pollution Level and Health Risk Assessment of PM2.5-bound metals in Baoding City before and after the heating period. Int. J. Environ. Res. Public Health 2018, 15, 2286. [Google Scholar] [CrossRef] [PubMed]
  33. Xu, J.; Jia, C.; Yu, H.; Xu, H.; Ji, D.; Wang, C.; Xiao, H.; He, J. Characteristics, sources, and health risks of PM2.5-bound trace elements in representative areas of Northern Zhejiang Province, China. Chemosphere 2021, 272, 129632. [Google Scholar] [PubMed]
  34. Zhang, J.; Zhou, X.; Wang, Z.; Yang, L.; Wang, J.; Wang, W. Trace elements in PM2.5 in Shandong Province: Source identification and health risk assessment. Sci. Total Environ. 2018, 621, 558–577. [Google Scholar]
  35. Brown, R.J.C.; Milton, M.J.T. Analytical techniques for trace element analysis: An overview. TrAC-Trends Anal. Chem. 2005, 24, 266–274. [Google Scholar] [CrossRef]
  36. Li, X.; Song, H.; Zhai, S.; Lu, S.; Kong, Y.; Xia, H.; Zhao, H. Particulate matter pollution in Chinese cities: Areal-temporal variations and their relationships with meteorological conditions (2015–2017). Environ. Pollut. 2019, 246, 11–18. [Google Scholar] [PubMed]
  37. Wang, T.; Song, H.; Wang, F.; Zhai, S.; Han, Z.; Wang, D.; Li, X.; Zhao, H.; Ma, R.; Zhang, G. Hysteretic effects of meteorological conditions and their interactions on particulate matter in Chinese cities. J. Clean. Prod. 2020, 274, 122926. [Google Scholar] [CrossRef]
  38. Zhang, Y.L.; Cao, F. Fine particulate matter (PM2.5) in China at a city level. Sci. Rep. 2015, 5, 14884. [Google Scholar] [CrossRef]
  39. Zheng, J.; Zhan, C.; Yao, R.; Zhang, J.; Liu, H.; Liu, T.; Xiao, W.; Liu, X.; Cao, J. Levels, sources, markers and health risks of heavy metals in PM2.5 over a typical mining and metallurgical city of central China. Aerosol Sci. Eng. 2018, 2, 1–10. [Google Scholar]
  40. Du, P.; Xie, Y.; Wang, S.; Zhao, H.; Zhang, Z.; Wu, B.; Li, F. Potential sources of and ecological risks from heavy metals in agricultural soils, Daye City, China. Environ. Sci. Pollut. Res. 2015, 22, 3498–3507. [Google Scholar] [CrossRef]
  41. Tang, S.; Yang, K.; Liu, F.; Peng, M.; Li, K.; Yang, Z.; Liu, X.; Guo, F.; Ma, H. Overview of heavy metal pollution and health risk assessment of urban soils in Yangtze River Economic Belt, China. Environ. Geochem. Health 2022, 44, 4455–4497. [Google Scholar]
  42. Wang, Z.; Nie, K. Measuring spatial distribution characteristics of heavy metal contaminations in a network-constrained environment: A case study in river network of Daye, China. Sustainability 2017, 9, 986. [Google Scholar] [CrossRef]
  43. Zhang, J.; Li, Z.H.; Chen, J.; Wang, M.; Tao, R.; Liu, D. Assessment of heavy metal contamination status in sediments and identification of pollution source in Daye Lake, Central China. Environ. Earth Sci. 2014, 72, 1279–1288. [Google Scholar] [CrossRef]
  44. Zhong, P.; Zhang, J.Q.; Xu, D.M.; Tian, Q.; Hu, T.P.; Gong, X.Y.; Zhan, C.L.; Liu, S.; Xing, X.L.; Qi, S.H. Contamination characteristics of heavy metals in particle size fractions from street dust from an industrial city, Central China. Air Qual. Atmos. Health 2020, 13, 871–883. [Google Scholar] [CrossRef]
  45. Wang, C.; Wang, K.; Zhou, W.; Li, Y.; Zou, G.; Wang, Z. Occurrence, risk, and source of heavy metals in lake water columns and sediment cores in Jianghan Plain, Central China. Int. J. Environ. Res. Public Health 2023, 20, 3676. [Google Scholar] [CrossRef]
  46. Zhang, X.; Eto, Y.; Aikawa, M. Risk assessment and management of PM2.5-bound heavy metals in the urban area of Kitakyushu, Japan. Sci. Total Environ. 2021, 795, 148748. [Google Scholar] [CrossRef]
  47. Ministry of Environmental Protection of the People’s Republic of China (MEP). Background Contents on Elements of Soils in China; China Environmental Science Press: Beijing, China, 1990. (In Chinese) [Google Scholar]
  48. USEPA. Risk-Assessment Guidance for Superfund. Volume 1. Human Health Evaluation Manual. Part A. Interim Report (Final); USEPA: Washington, DC, USA, 1989.
  49. Ministry of Environmental Protection of the People’s Republic of China (MEP). Exposure Factors Handbook of Chinese Population; China Environmental Science Press: Beijing, China, 2013. (In Chinese) [Google Scholar]
  50. Chen, H.; Lu, X.; Li, L.Y. Spatial distribution and risk assessment of metals in dust based on samples from nursery and primary schools of Xi’an, China. Atmos. Environ. 2014, 88, 172–182. [Google Scholar] [CrossRef]
  51. GB3095-2012; Ambient Air Quality Standards. Ministry of Environmental Protection of the People’s Republic of China (MEP): Beijing, China, 2012. (In Chinese)
  52. Huang, X.; Tang, G.; Zhang, J.; Liu, B.; Liu, C.; Zhang, J.; Cong, L.; Cheng, M.; Yan, G.; Gao, W.; et al. Characteristics of PM2.5 pollution in Beijing after the improvement of air quality. J. Environ. Sci. 2021, 100, 1–10. [Google Scholar] [CrossRef]
  53. Kong, L.; Tan, Q.; Feng, M.; Qu, Y.; An, J.; Liu, X.; Cheng, N.; Deng, Y.; Zhai, R.; Wang, Z. Investigating the characteristics and source analyses of PM2.5 seasonal variations in Chengdu, Southwest China. Chemosphere 2020, 243, 125267. [Google Scholar] [CrossRef]
  54. Zheng, Y.; Chen, S.; Chen, Y.; Li, J.; Xu, B.; Shi, T.; Yang, Q. Association between PM2.5-bound metals and pediatric respiratory health in Guangzhou: An ecological study investigating source, health risk, and effect. Front. Public Health 2023, 11, 1137933. [Google Scholar] [CrossRef]
  55. Cao, J.J.; Shen, Z.X.; Chow, J.C.; Watson, J.G.; Lee, S.C.; Tie, X.X.; Ho, K.F.; Wang, G.H.; Han, Y.M. Winter and summer PM2.5 chemical compositions in fourteen Chinese cities. J. Air Waste Manag. Assoc. 2012, 62, 1214–1226. [Google Scholar] [CrossRef]
  56. He, K.; Yang, F.; Ma, Y.; Zhang, Q.; Yao, X.; Chan, C.K.; Cadle, S.; Chan, T.; Mulawa, P. The characteristics of PM2.5 in Beijing, China. Atmos. Environ. 2001, 35, 4959–4970. [Google Scholar] [CrossRef]
  57. Lim, S.; Lee, M.; Lee, G.; Kim, S.; Yoon, S.; Kang, K. Ionic and carbonaceous compositions of PM10, PM2.5 and PM1.0 at Gosan ABC Superstation and their ratios as source signature. Atmos. Chem. Phys. 2012, 12, 2007–2024. [Google Scholar] [CrossRef]
  58. Xiong, Y.; Zhou, J.; Schauer, J.J.; Yu, W.; Hu, Y. Seasonal and spatial differences in source contributions to PM2.5 in Wuhan, China. Sci. Total Environ. 2017, 577, 155–165. [Google Scholar] [CrossRef] [PubMed]
  59. Zhou, Y.; Yue, Y.; Bai, Y.; Zhang, L. Effects of Rainfall on PM2.5 and PM10 in the Middle Reaches of the Yangtze River. Adv. Meteorol. 2020, 2020, 2398146. [Google Scholar] [CrossRef]
  60. Zhang, F.; Wang, Z.W.; Cheng, H.R.; Lv, X.P.; Gong, W.; Wang, X.M.; Zhang, G. Seasonal variations and chemical characteristics of PM2.5 in Wuhan, central China. Sci. Total Environ. 2015, 518–519, 97–105. [Google Scholar] [CrossRef]
  61. World Health Organization. Air Quality Guidelines for Europe, 2nd ed.; World Health Organization: Copenhagen, Denmark, 2000. [Google Scholar]
  62. Świetlik, R.; Trojanowska, M.; Strzelecka, M.; Bocho-Janiszewska, A. Fractionation and mobility of Cu, Fe, Mn, Pb and Zn in the road dust retained on noise barriers along expressway—A potential tool for determining the effects of driving conditions on speciation of emitted particulate metals. Environ. Pollut. 2015, 196, 404–413. [Google Scholar] [CrossRef]
  63. Thorpe, A.; Harrison, R.M. Sources and properties of non-exhaust particulate matter from road traffic: A review. Sci. Total Environ. 2008, 400, 270–282. [Google Scholar] [CrossRef]
  64. Nazir, R.; Shaheen, N.; Shah, M.H. Indoor/outdoor relationship of trace metals in the atmospheric particulate matter of an industrial area. Atmos. Res. 2011, 101, 765–772. [Google Scholar] [CrossRef]
  65. Jabłońska, M.; Rachwał, M.; Wawer, M.; Kądziołka-Gaweł, M.; Teper, E.; Krzykawski, T.; Smołka-Danielowska, D. Mineralogical and chemical specificity of dusts originating from iron and non-ferrous metallurgy in the light of their magnetic susceptibility. Minerals 2021, 11, 216. [Google Scholar] [CrossRef]
  66. Matawle, J.L.; Pervez, S.; Dewangan, S.; Shrivastava, A.; Tiwari, S.; Pant, P.; Deb, M.K.; Pervez, Y. Characterization of PM2.5 source profiles for traffic and dust sources in Raipur, India. Aerosol Air Qual. Res. 2015, 15, 2537–2548. [Google Scholar] [CrossRef]
Figure 1. Location of the sampling site and surrounding environment.
Atmosphere 14 01406 g001
Figure 2. Characteristics of time and seasonal variation of PM2.5 concentration in Huangshi City during the sampling period.
Atmosphere 14 01406 g002
Figure 3. The wind rose for four seasons, as obtained from the weather station in Huangshi City.
Atmosphere 14 01406 g003
Figure 4. Seasonal changes in total metal concentration and relative contribution of each metal to the total metal concentration.
Atmosphere 14 01406 g004
Figure 5. Enrichment factor of metal elements carried in PM2.5.
Atmosphere 14 01406 g005
Figure 6. Correlation heat map of metal elements carried in PM2.5.
Atmosphere 14 01406 g006
Figure 7. A dendrogram of hierarchical cluster analysis of 16 elements.
Atmosphere 14 01406 g007
Figure 8. Average non-carcinogenic risks and carcinogenic risks of different metals for children and adults.
Atmosphere 14 01406 g008
Table 1. Health risk assessment parameters of the respiratory pathway.
DefinitionChildAdultUnit
CMetal concentration in PM2.5//mg/m3
InhRInhalation rate7.514.5m3·d−1
EFExposure frequency350350d·a−1
EDExposure duration624a
BWBody weight15.956.8kg
ATAverage carcinogenic risk exposure time70 × 36570 × 365d
Average non-carcinogenic risk exposure TimeED × 365ED × 365d
Table 2. RfC and SF values of heavy metals inhaled by the respiratory pathway.
ElementRfC (mg/m3)SF (mg·(kg·d)−1)
Ni2.06 × 10−20.84
Cr2.86 × 10−542
As3.01 × 10−415.10
Cd1.00 × 10−56.30
Mn1.43 × 10−5/
Cu4.02 × 10−2/
Zn3.00 × 10−1/
V7.00 × 10−3/
Pb3.52 × 10−3/
Co5.70 × 10−69.80
Table 3. Seasonal and annual average concentrations of metallic elements in PM2.5 in Huangshi City.
ElementSummerAutumnWinterSpringAnnual AverageANOVA
Mean ± S.D.Fp
K0.39 ± 0.190.65 ± 0.321.23 ± 1.260.68 ± 0.450.8411.160.00
Ca0.22 ± 0.130.31 ± 0.210.32 ± 0.250.30 ± 0.230.301.330.27
Mg1.00 ± 0.330.79 ± 0.100.34 ± 0.430.78 ± 0.110.6451.090.00
Zn0.15 ± 0.160.20 ± 0.140.15 ± 0.110.17 ± 0.120.171.710.16
Fe0.36 ± 0.260.51 ± 0.260.47 ± 0.310.49 ± 0.280.471.980.12
Al0.46 ± 0.160.44 ± 0.120.34 ± 0.270.48 ± 0.210.416.090.00
Co *1.67 ± 0.671.25 ± 0.331.79 ± 0.631.25 ± 0.381.5014.310.00
Ti *14.13 ± 7.7418.63 ± 11.3017.95 ± 12.7821.16 ± 18.3118.371.740.16
Cr *14.87 ± 21.8713.96 ± 13.4910.77 ± 7.8013.41 ± 7.8212.761.330.26
As *16.54 ± 19.2915.66 ± 15.1514.38 ± 12.6616.65 ± 12.7115.490.360.78
Cd *2.89 ± 1.663.18 ± 2.3611.18 ± 13.552.70 ± 1.783.6415.970.00
Mn *50.82 ± 21.0854.36 ± 20.1142.90 ± 23.9448.59 ± 14.5748.424.130.01
Cu *39.57 ± 47.7941.59 ± 47.9552.16 ± 52.2437.53 ± 32.5644.441.380.25
Ni *3.47 ± 1.643.32 ± 1.183.51 ± 1.293.31 ± 1.333.410.570.64
V *2.38 ± 1.012.09 ± 1.041.26 ± 1.851.89 ± 0.531.776.570.00
Pb *63.51 ± 99.0443.61 ± 27.8751.43 ± 39.4453.41 ± 43.2651.001.200.31
Note: * indicates that the mass concentration unit is ng/m3 and the mass concentration unit of other elements is μg/m3. S.D. indicates standard deviation. ANOVA means one-way analysis of variance.
Disclaimer/Publisher’s Note: The statements, opinions and data contained in all publications are solely those of the individual author(s) and contributor(s) and not of MDPI and/or the editor(s). MDPI and/or the editor(s) disclaim responsibility for any injury to people or property resulting from any ideas, methods, instructions or products referred to in the content.

