Article

Effects of Extreme Precipitation on Runoff and Sediment Yield in the Middle Reaches of the Yellow River

1
State Key Laboratory of Eco-Hydraulics in Northwest Arid Region of China, Xi’an University of Technology, Xi’an 710048, China
2
State Key Laboratory of Loess and Quaternary Geology, Institute of Earth Environment, Chinese Academy of Sciences, Xi’an 710061, China
3
National Observation and Research Station of Earth Critical Zone on the Loess Plateau, Xi’an 710061, China
*
Author to whom correspondence should be addressed.
Atmosphere 2023, 14(9), 1415; https://doi.org/10.3390/atmos14091415
Submission received: 30 June 2023 / Revised: 29 August 2023 / Accepted: 6 September 2023 / Published: 8 September 2023

Abstract

:
Understanding the link between extreme precipitation and changes in runoff and sediment yield is of great significance for regional flood disaster response and soil and water conservation decision-making. This study investigated the spatial and temporal distribution of extreme precipitation (characterized by 10 extreme precipitation indices recommended by the Expert Team on Climate Change Detection and Indices) in the Toudaoguai–Longmen section of the middle Yellow River from 1960 to 2021 and quantified the effects of extreme precipitation on runoff and sediment yield based on the method of partial least squares regression (PLSR). The extreme precipitation index showed an obvious upward trend in the last 20 years, with the increases in the central and northern regions (upstream) being stronger than the increase in the southern region (downstream). However, the runoff and sediment yield decreased significantly due to the implementation of large-scale soil and water conservation measures on the Loess Plateau, with average rates of 94.7 million m3/a and 13.3 million t/a during 1960–2021, respectively. The change points of runoff and sediment yield change occurred in 1979. Compared with those in the period from 1960 to 1979, the reductions in runoff and sediment yield in the years 1980–2021 were 52.7% and 70.6%, respectively. Moreover, extreme precipitation contributed 35.3% and 6.2% to the reduction in runoff in the 1980–1999 and 2000–2021 periods, respectively, and contributed 84.3% and 40.0% to the reduction in sediment yield, respectively. It indicated that other factors (such as large-scale soil and water conservation construction) played main roles in the decrease in runoff and sediment yield in the study area in recent 20 years.

1. Introduction

Extreme precipitation events are events that seriously deviate from the average state of the weather and are statistically less likely to occur with a small probability. With increasing global temperature, the frequency, intensity, and duration of extreme precipitation events worldwide have also increased, which seriously threatens the safety and property of human society [1,2,3]. Globally, the annual maximum daily precipitation increased by an average of 5.73 mm during the period 1901–2010 [4]. Moreover, the global mean precipitation showed a strong trend toward wetter rainy seasons and drier dry seasons during the period from 1979 to 2010 [5]. However, the extreme precipitation indices events varied in different regions, showing an increasing trend in eastern North America, Eastern Europe, Asia, and most of South America and a decreasing trend in the Mediterranean, Southeast Asia, and northwestern North America during the period 1901–2010 [6]. Considering the catastrophic impact of extreme precipitation events on society, the economy, and the environment, as well as the current limited understanding of extreme precipitation events, strengthening the understanding of the spatial and temporal distribution of regional extreme precipitation events is of great significance for coping with future flood and drought risks and their environmental impacts.
Flood disasters caused by extreme precipitation cause economic losses of more than 30 billion U.S. dollars per year globally [7]. An accurate understanding of the relationship between extreme precipitation and runoff changes will help to scientifically respond to flood disasters and mitigate the impact of extreme climate events [8,9]. It is generally believed that an increase in extreme precipitation events will enhance the frequency of floods [10]. Long-duration (>1 day) heavy rainfall is considered to be the most common cause of flooding in large watersheds, while floods in small watersheds may be caused by short-duration, high-intensity rainfall [11]. However, recent research has found that despite an increase in extreme precipitation events, peak river flows are declining in many parts of the world [12]. A study on the association between extreme precipitation events and flood events in 671 watersheds in the United States from 1980 to 2014 found that there was a very low correlation between extreme precipitation changes and flood changes, and the correlation was less than 0.2 [8]. This suggests that the runoff response to extreme rainfall is nonlinear. Declining soil moisture, enhanced surface evapotranspiration, and decreased surface runoff capacity due to climate warming and land use changes are possible reasons for the nonlinear relationship between precipitation and runoff [12]. In the context of global change, the relationship between extreme precipitation events and runoff has become more complex. A quantitative understanding of the relationship between extreme precipitation and runoff changes will help scientifically formulate flood control strategies and improve regional water resource regulation capabilities.
The Yellow River is the fifth-longest river in the world and one of the rivers with the highest sediment concentration [13]. The Toudaogua-Longmen section in the middle reaches of the Yellow River is located in the Loess Plateau (Figure 1), which has a fragile ecological environment and severe soil erosion, with an area proportion of 14.8% but contribution of 69% sediment yield in the whole basin [14]. Therefore, this river section is the main source area of coarse sediment in the Yellow River basin and shows a sensitive response to extreme precipitation [15,16]. Observation and model-predicted results found that the regional extreme precipitation events showed an overall increasing trend in the middle reaches of the Yellow River in the last 60 years [17,18]. The enhanced extreme precipitation in the annual flood season increases the potential risk of flood and soil erosion in the watershed, resulting in large socio-economic losses [19]. At the same time, due to the implementation of large-scale soil and water conservation measures in the Loess Plateau, the runoff and sediment in the main sub-watersheds of the middle Yellow River showed an obvious downward trend, which further changed the relationship between precipitation, runoff, and sediment yield in the area [20,21]. However, most of the previous studies are qualitative analyses of the relationship between precipitation, runoff, and sediment yield, and lacked the identification of key extreme precipitation affecting runoff changes and the quantification of extreme rainfall to runoff and sediment change. Therefore, the main objectives of this study are to (1) analyze the temporal and spatial distribution characteristics of extreme precipitation in the Toudaoguai–Longmen region of the middle Yellow River and (2) to quantify the impact of extreme precipitation changes on runoff and sediment to provide scientific support for response to flood risks and optimizing soil and water conservation measures in the middle Yellow River.

2. Materials and Methods
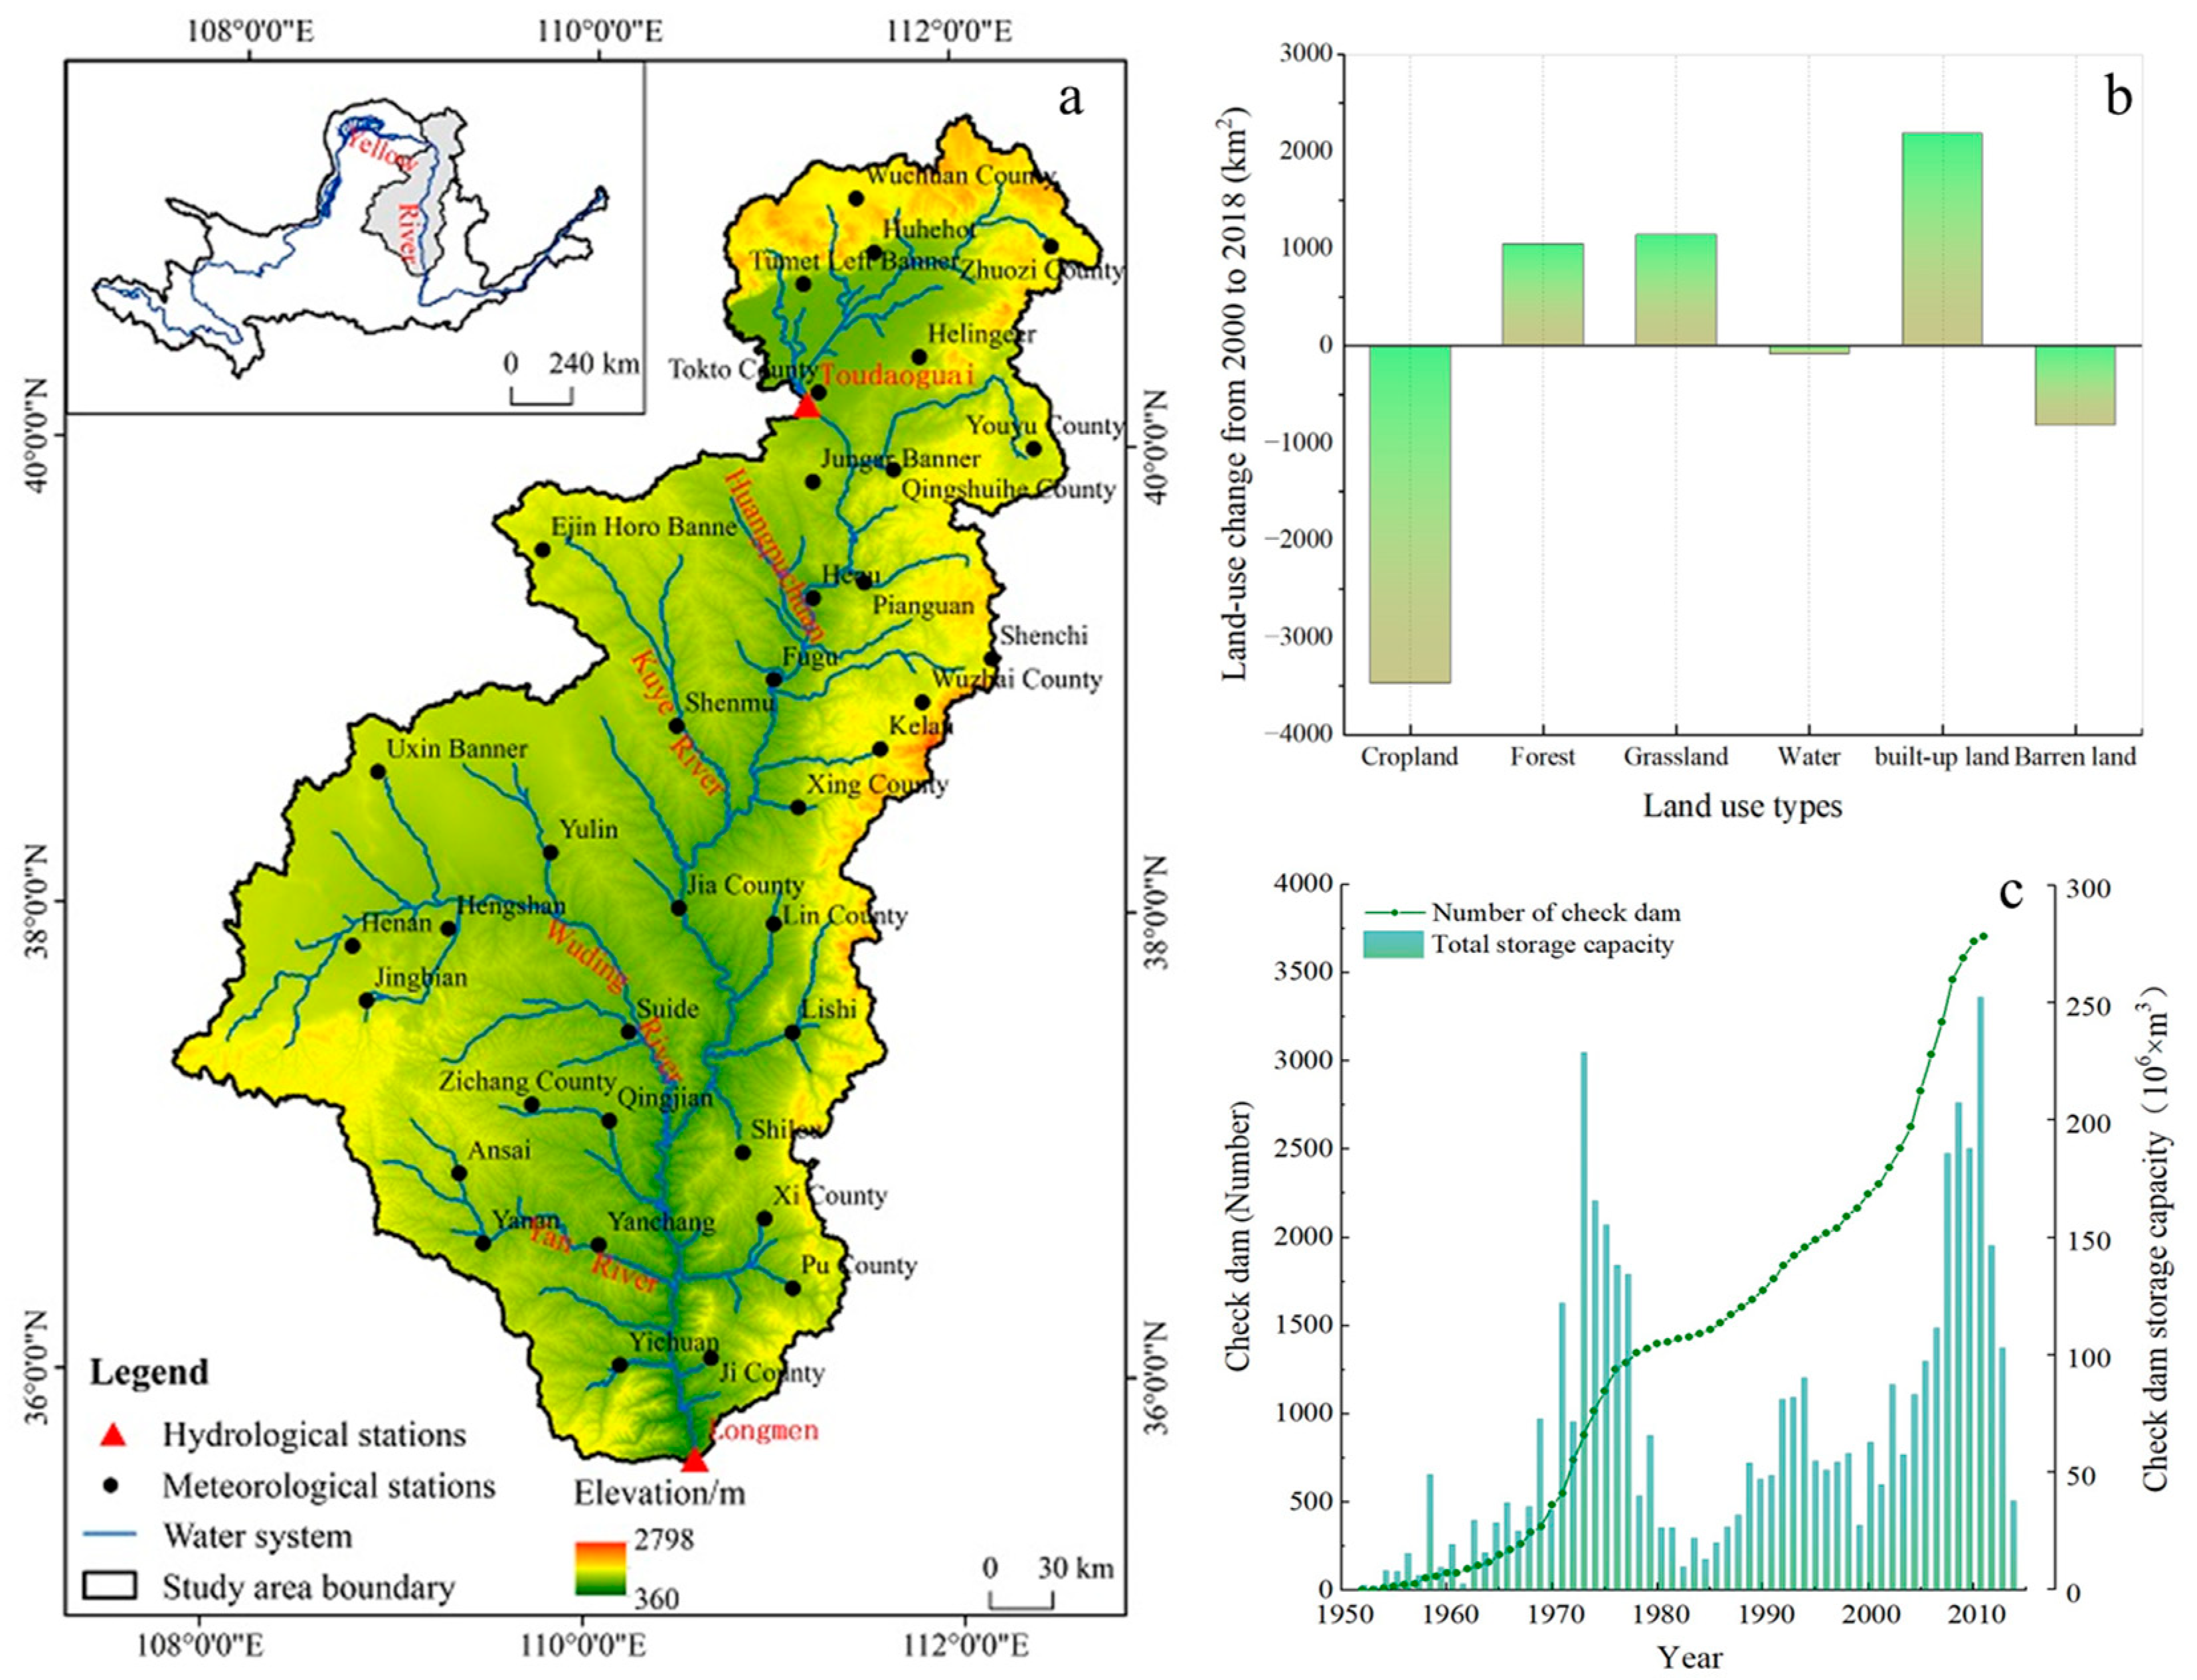
2.1. Study Area

The Toudaoguai–Longmen section is located in the middle reaches of the Yellow River, between 35°40′~40°34 N and 107°54′~112°30′ E, with a mainstream length of 725 km and a total area of 128,000 km2. This area accounts for only 15% of the Yellow River basin, but the sediment yield accounts for 69% of the whole basin, making it the main sediment-producing area of the Yellow River basin [14]. The study area belongs to the temperate continental climate, with an average annual temperature of 7–11 °C and an average annual precipitation of 300–580 mm. About 70% of the annual precipitation occurs in the form of heavy rain from June to September. The vegetation in the region is mainly grassland, which gradually transitions from northwest desert grassland to southeast forest grassland. The geomorphic type is mainly loess hilly gully, and the soil developed on the parent material of eolian loess is loose and porous, easy to erode. There are many tributaries in the area, which are distributed along the main stream of the Yellow River in a feather shape, including Huangfuchuan, Kuye River, Tuwei River, Wuding River, Yanhe River, and other large tributaries [22]. In order to control soil erosion, large-scale soil and water conservation construction has been carried out in the area since the 1950s. By 2006, the area affected by soil and water conservation measures in this region had reached nearly 39,255 km2, including 4928 km2 of terraced fields, 711 km2 of dam land, and 33,616 km2 of forest and grassland [14].

2.2. Data Sources

The daily precipitation data (1960–2021) from 37 meteorological stations in the Toudaoguai–Longmen section (Figure 1) were taken from the Data Center for Resources and Environmental Sciences, Chinese Academy of Sciences (http://www.resdc.cn, accessed on 8 September 2022). Annual runoff and sediment yield data (1960–2021) for Toudaoguai and Longmen hydrological stations (Figure 1) were derived from the Yellow River Basin Hydrological Yearbook compiled by the Yellow River Conservancy Commission. The hydrographic station monitors runoff and suspended sediment yield daily, and the hydrographic Bureau summarizes the daily data from the station into annual data and compiles it into the hydrological yearbook. The measurement of runoff and sediment in hydrology stations is carried out according to the specification for survey in hydrology. The annual runoff and sediment yield of the Toudaoguai–Longmen section were calculated as the difference between the measured data from the Longmen and Toudaoguai stations.

2.3. Methods

2.3.1. Extreme Precipitation Indices

In this study, extreme precipitation indices defined and recommended by the Expert Team on Climate Change Detection and Indices (ETCCDI) [23] were selected to characterize annual extreme precipitation in the Toudaoguai–Longmen section of the Yellow River (Table 1). Those standard indices established by ETCCDI are widely used to assess the characteristics of extreme precipitation changes in different regions of the world [1,18,24]. These indices are annual statistics of observed climate data. The extreme precipitation indices were calculated using the RClimDex software package developed based on R language after data quality control [25].

2.3.2. Spatial–Temporal Analysis

For temporal change, the improved Mann–Kendall (MMK) test method was adopted to assess trends of the hydrometeorological variables (including the 10 extreme precipitation indices, runoff, and sediment yield) in the Toudaoguai–Longmen section [26].
The magnitude of the trend is expressed by the Sen slope [27]. In the formula, β represents the upward or downward trend of each meteorological and hydrological variables, where β > 0 indicates the trend rising and β < 0 indicates the trend declining, and xi and xj represent the sequence values of the hydrometeorological variables at the time i and j, respectively.
β = m e d i a n ( x j x i j i )       1 < i < j < n
A geostatistical interpolation technique of Kinging interpolation was used to explore spatial temporal extreme precipitation indices trend over the study area with the help of GS+ 7.0.

2.3.3. Change Point Analysis
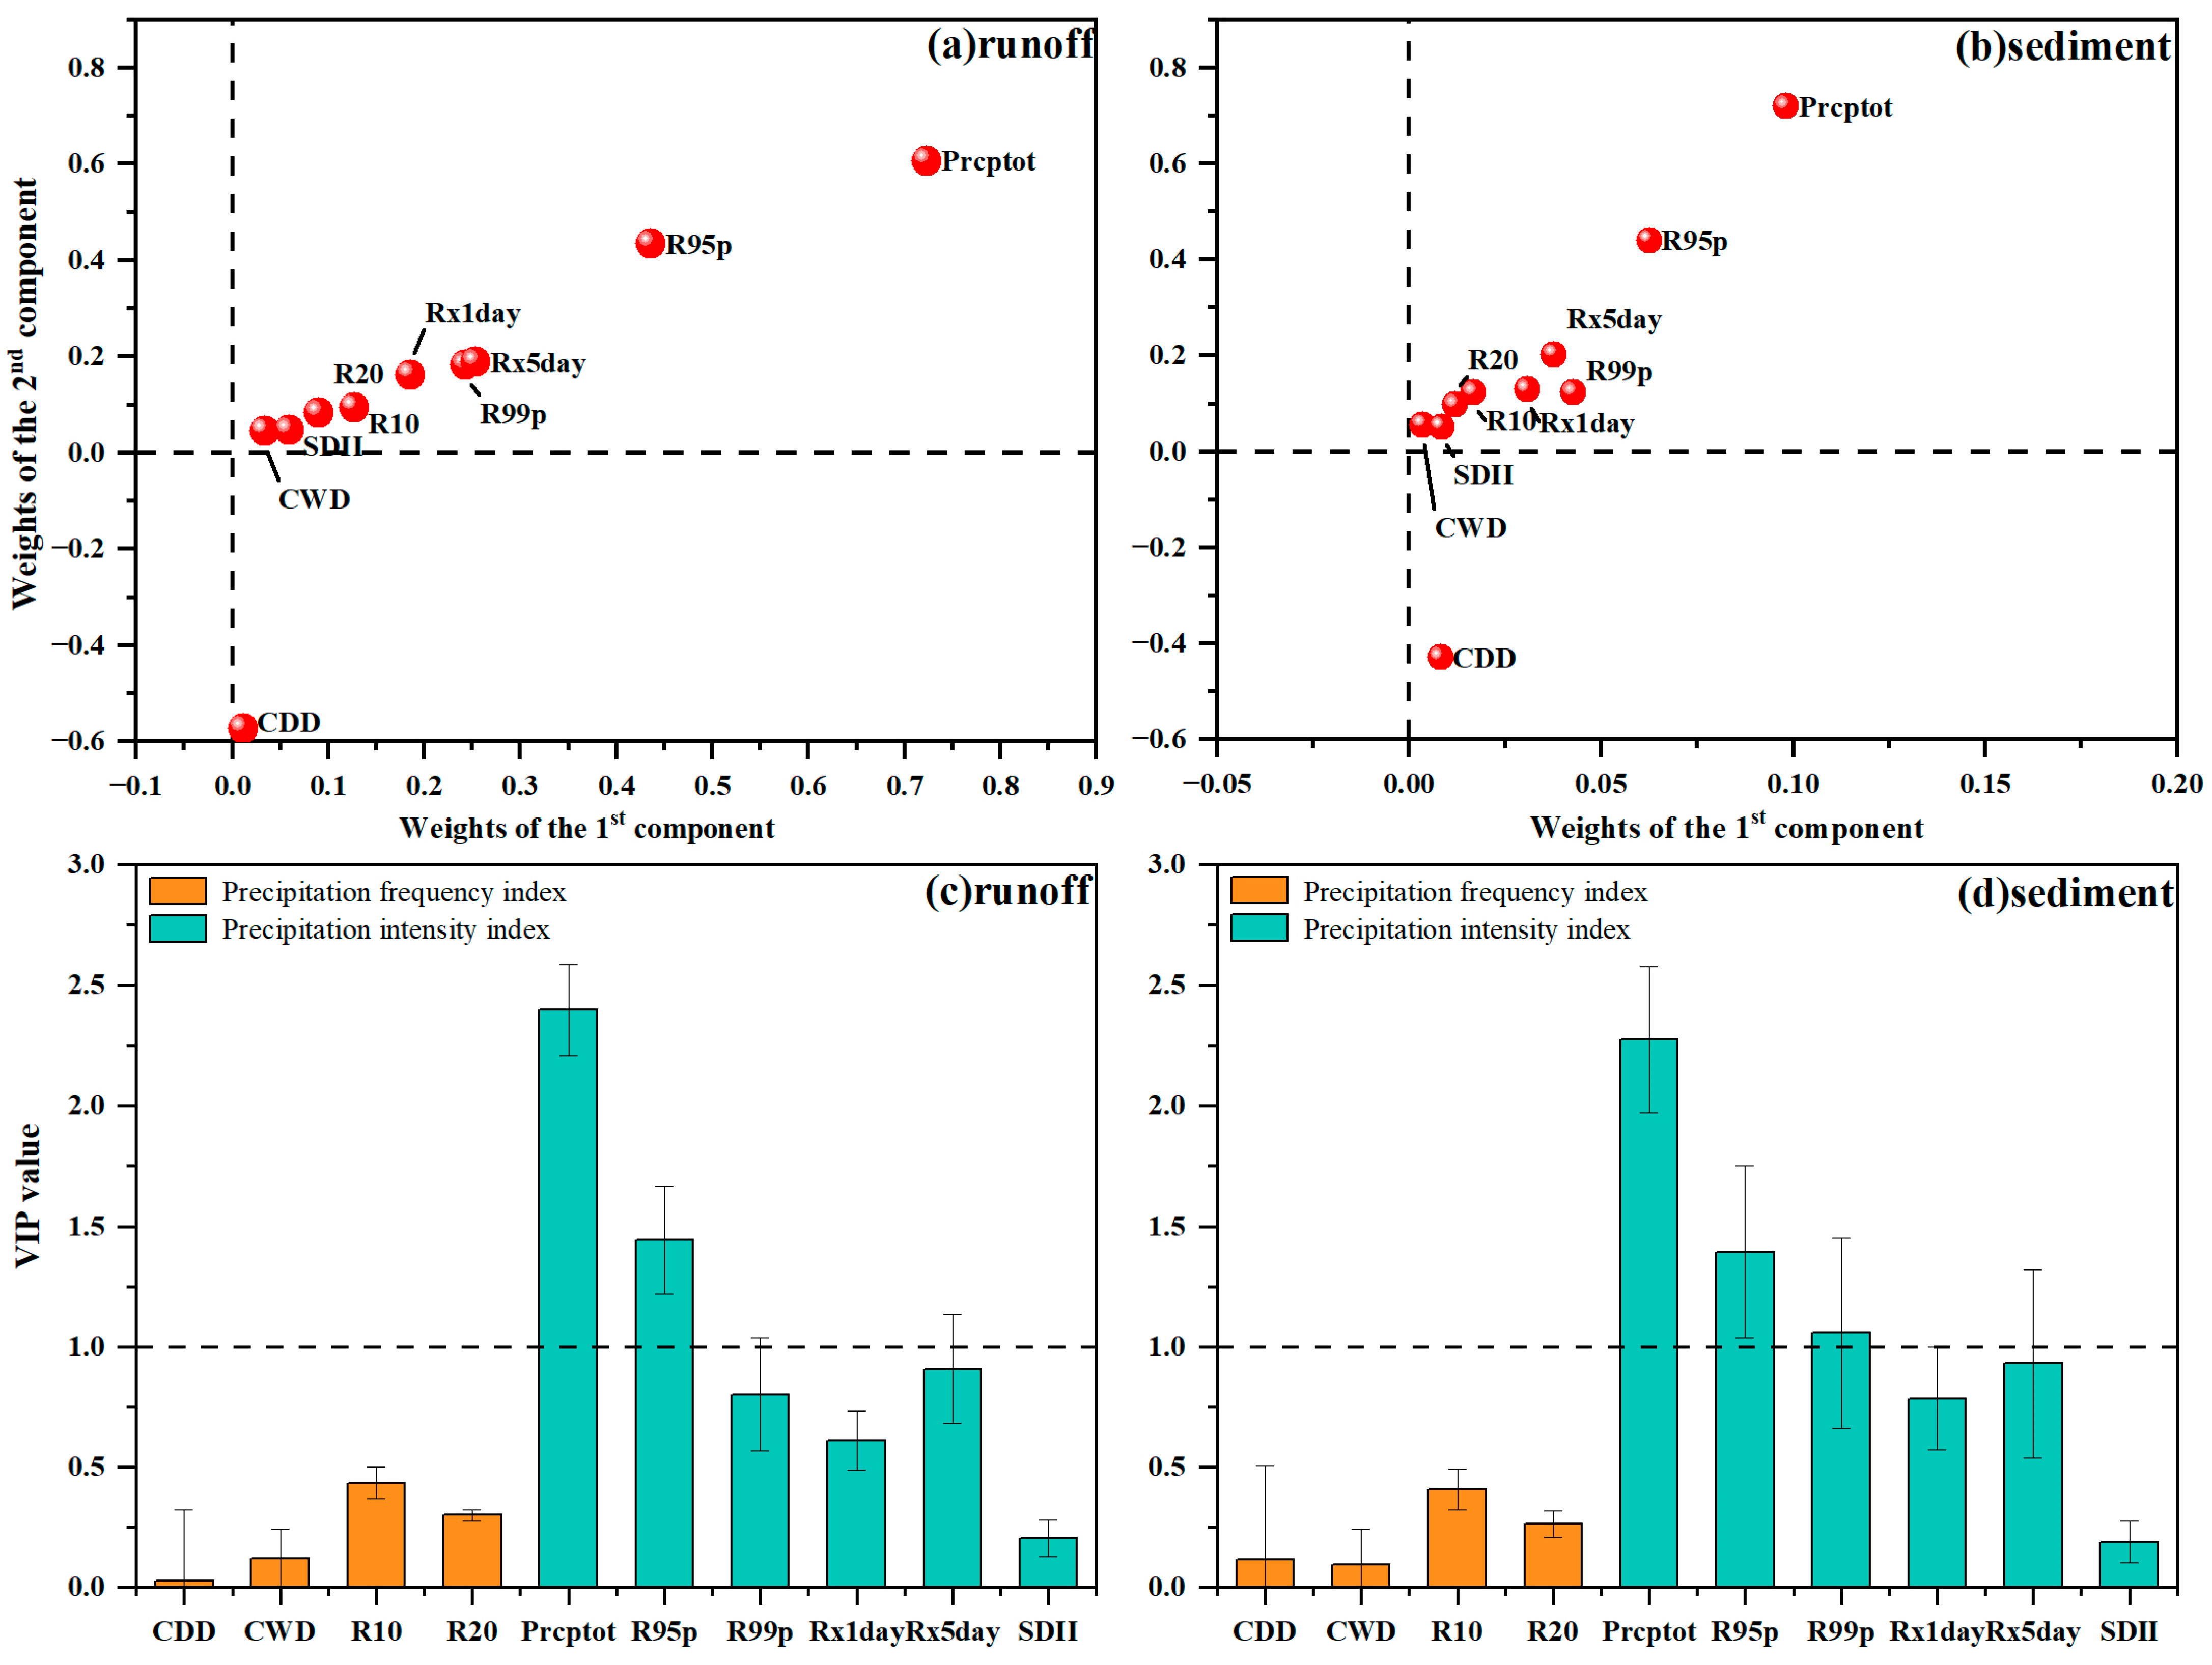
The sequential cluster method was used to identify the change point of the hydrologic series in the Toudaoguai–Longmen section. The hydrologic series was divided into two hydrological periods, periods with few human activities and those with intense human impacts by the change point. The optimal change point was selected using the following equations [28].
V τ = i = 1 τ ( x i x τ ¯ ) 2
V n t = i = τ + 1 n ( x i x n τ ¯ ) 2
S n ( τ ) = ( V τ + V n - τ )
It is assumed that τ is the possible optimal point in sequence x. n is the number of years in the hydrological sequence, x i is the value in the year i, x τ   ¯ and x n τ ¯ are the average of the hydrological sequence before and after τ, respectively.

2.3.4. PLSR Model

The partial least squares regression (PLSR) is a multivariate statistical analysis method that combines principal component analysis, multiple linear regression analysis, and typical correlation analysis among variables, thereby effectively eliminating the multicollinearity problem among independent variables and making the simulation effect of the model better [29]. The main principle is to seek the relationship between independent variables Xm×n and dependent variables Yn×1, including m independent variables and n observed values. In this study, the dependent variable was the annual runoff and sediment value including 62 years in the Toudaoguai–Longmen section. The independent variables were the 10 extreme precipitation indexes, and every extreme precipitation index was the arithmetic mean of 37 stations with also 62 years series. All the analyses were completed using the Soft Independent Modeling of Class Analogy (SIMCA 18.0, Sartorius, Germany).
In order to avoid overfitting, the cross-validation was used to determine the number of significant PLSR components. Within SIMCA, the fraction of the total variation of the dependent variable that can be predicted by the optimal PLSR model (Q2) and the cumulative Q2 over all the selected PLSR components ( Q cum 2 ) were calculated using the following formula:
Q 2 = 1.0 P R E S S / S S
Q cum 2 = 1.0 ( P R E S S / S S ) k       ( k = 1,2 , . . . , m )
where PRESS is the prediction error sum of squares, and SS is the residual sum of squares. When Q cum 2 is greater than 0.5, the PLSR model presents a better simulation effect and prediction ability. In addition, the root-mean-squared error-of-prediction (RMSEP) provides useful information for calibrating and developing the regression model. The RMSEP is calculated by the following:
R M S E C V = P R E S S n
In the PLSR model, the importance of a predictor for variations was presented by the variable importance for the projection (VIP), which was equal to the sum of squares of the PLSR weights across all components. The VIP score larger than 1 is a significant predominant predictor for the dependent variable.

2.3.5. Attribute Analysis of Runoff and Sediment Yield Change

The PLSR model was established for natural runoff or sediment yield (under natural conditions), which could be used for analysis of climate-driven runoff or sediment yield prediction. In this paper, the changes in runoff and sediment yield were divided by two aspects: extreme precipitation and other factors (such as human activity). For this study area, the change in annual runoff or sediment yield (ΔV) could be calculated as:
Δ V = Δ V c + Δ V f
Δ V c = V sim V obs
where ΔV contains two parts: the change caused by climate variability (ΔVc) and other factors (ΔVf). ΔVc was estimated by the PLSR model in the natural condition. Using the same model parameters and meteorological data in a period with intense human impacts, the runoff or sediment yield could be reconstructed without human activities effect (Vsim), Vobs is the measured value of the runoff or sediment yield in a period with intense human impacts.
With the estimation of ΔVc and ΔVf, the contribution of climate variability and human activities to runoff or sediment yield, which are defined as ηc and ηf, respectively, could be separated and estimated by:
η c = Δ V c Δ V × 100 %
η f = Δ V f Δ V × 100 %

3. Results

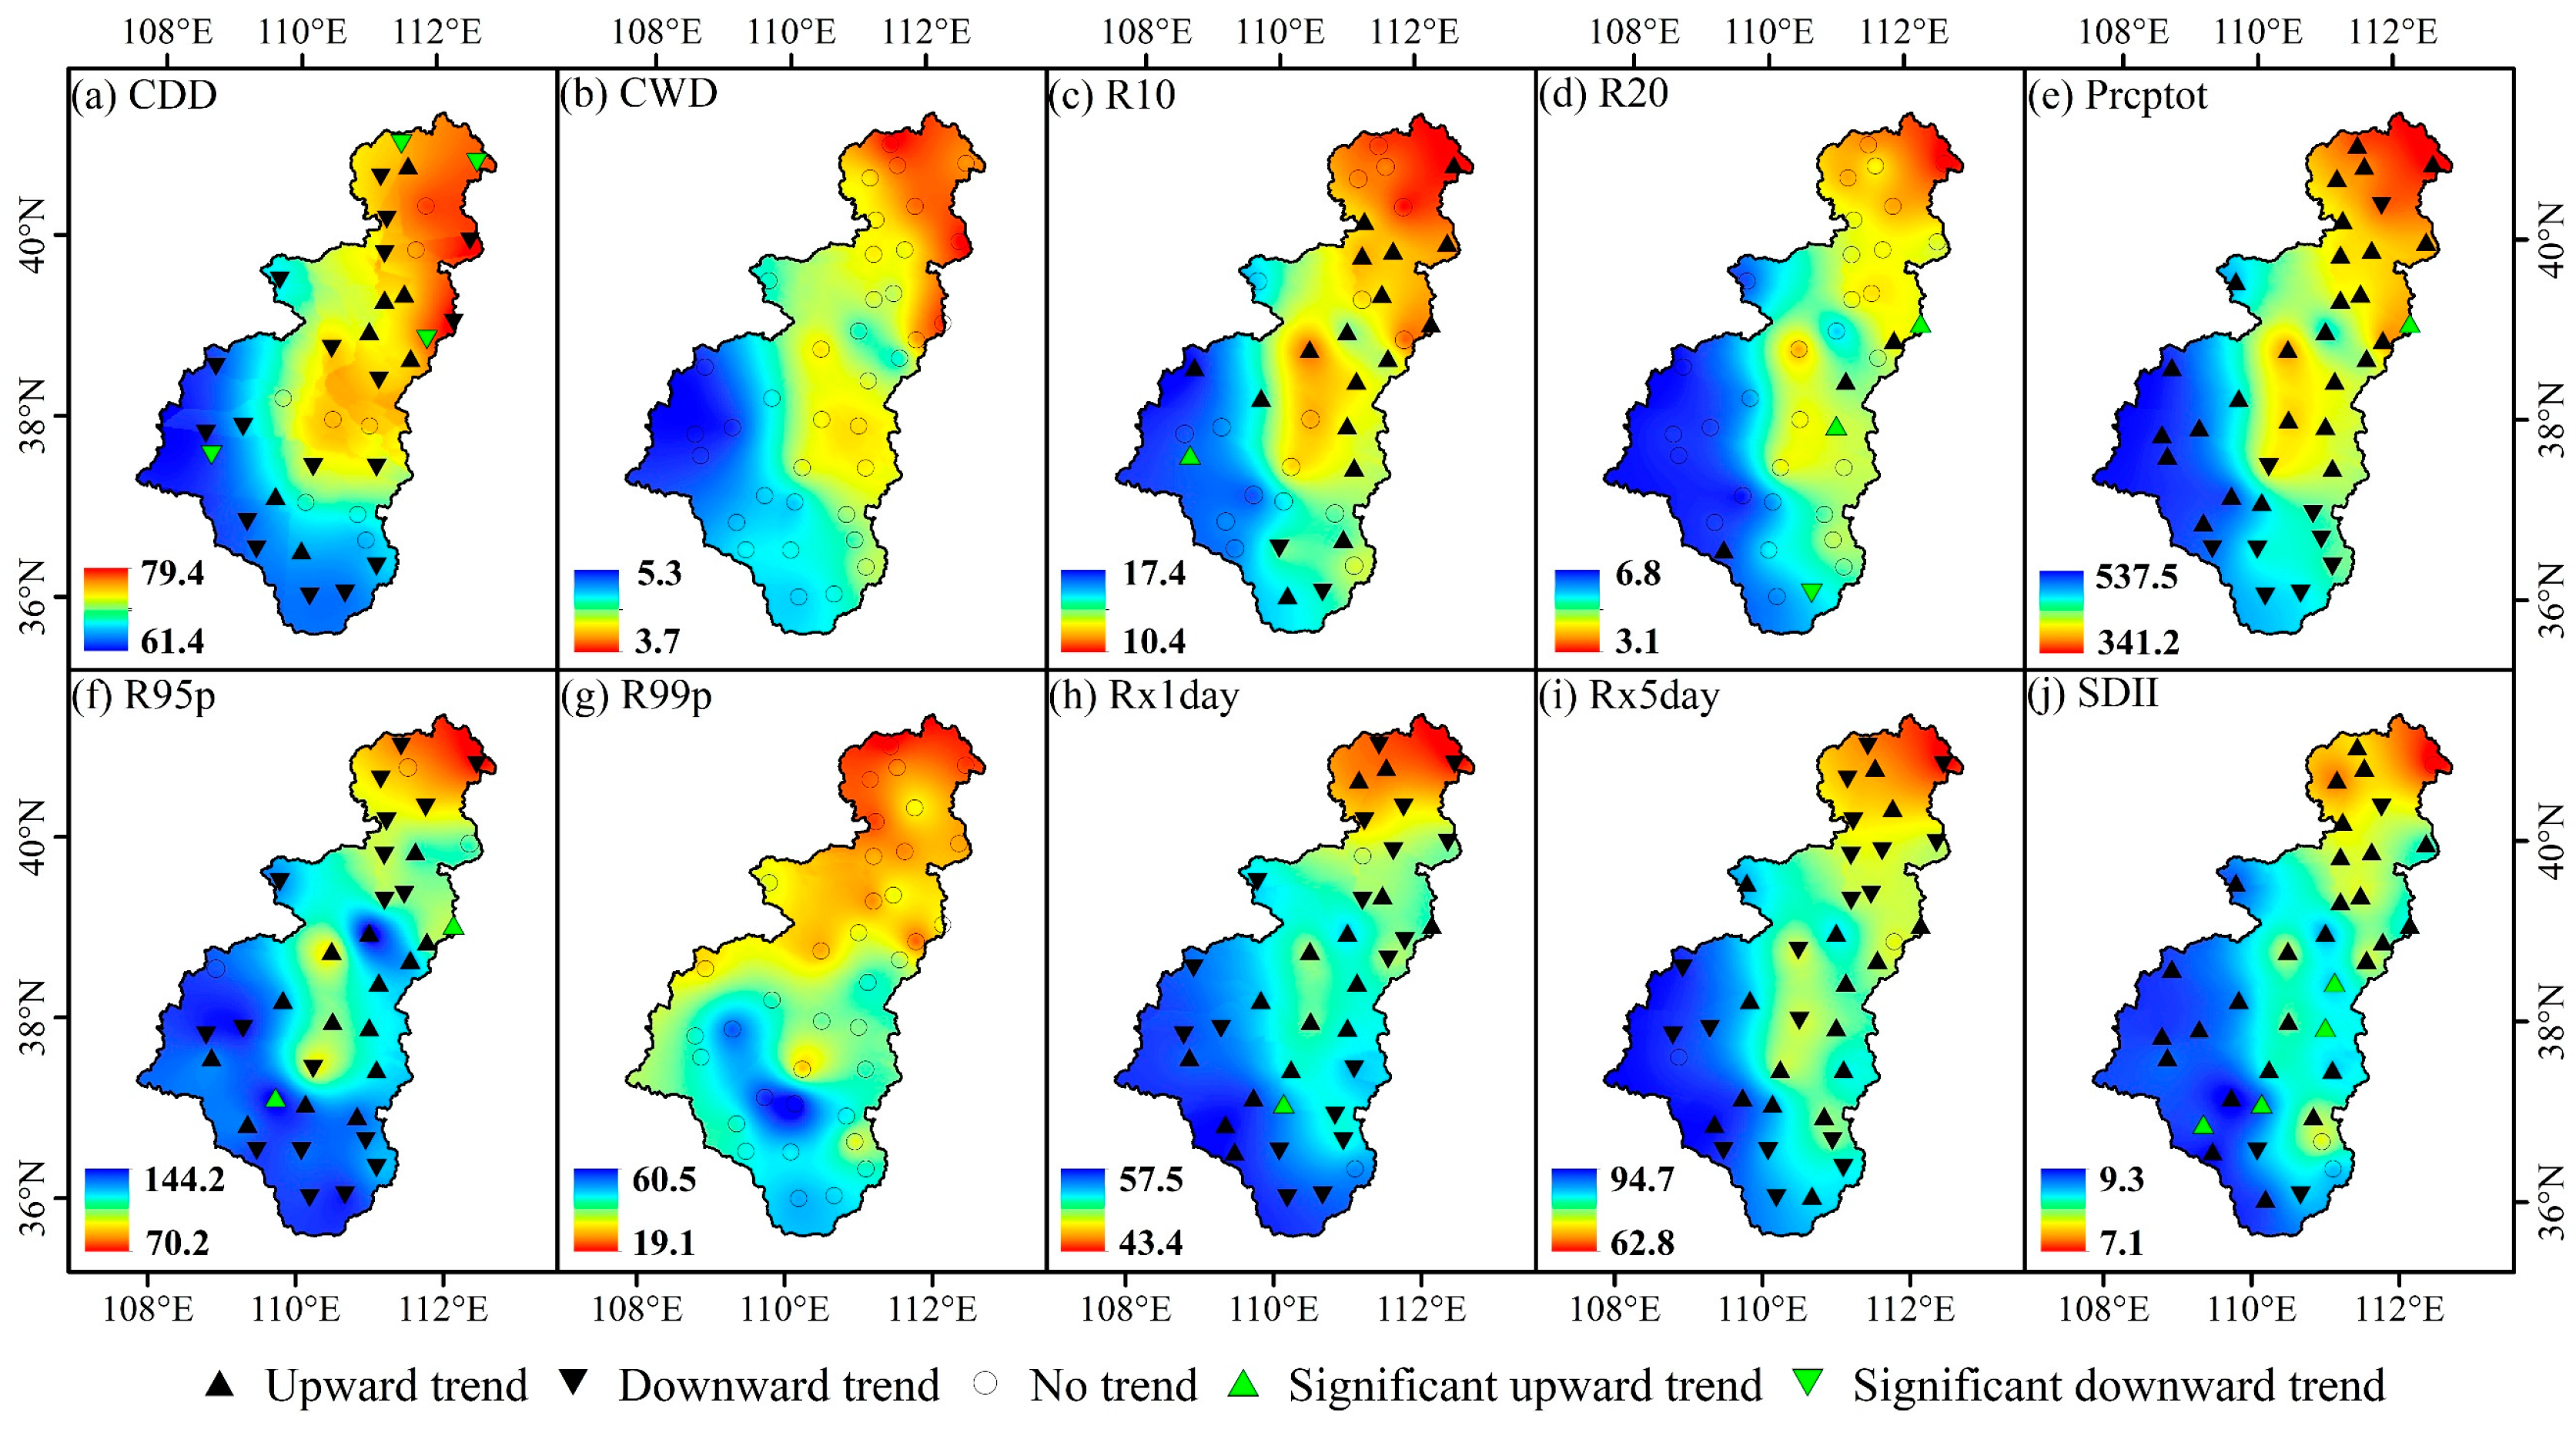
3.1. The Spatio-Tempora Variation Characteristics of Extreme Precipitation

Generally, the temporal change in extreme precipitation characteristics in the Toudaoguai–Longmen section from 1960 to 2021 was not significant (Figure 2). The extreme precipitation indices of R10, R20, Prcptot, SDII, R95p, and R99p showed insignificant upward trends, while the indices of CDD, CWD, Rx1day, and Rx5day showed slight downward trends. However, since 2000, almost all extreme precipitation indices have shown an upward trend, indicating that extreme precipitation in the study area has been increasing in the past 20 years.
Different extreme precipitation indices showed inconsistent spatial trends in the study region during the years 1960–2021 (Figure 3). According to the spatial variation characteristics of extreme precipitation at the 37 meteorological stations, the 10 selected extreme precipitation indices can be divided into four categories: increase dominant type (InD), increase and decrease equivalent type (IDE), unchanged dominant type (UnD), and decrease dominant type (DeD). There were four indices of IDE type, which were R10 (45.9% increase vs. 48.6% decrease), R95p (43.2% increase vs. 48.6% decrease), Rx1day (43.2% increase vs. 51.4% decrease), and Rx5day (43.2% increase vs. 51.4% decrease). Following that was the UnD type, which had three indices, namely CWD (100%), R99p (100%), and R20 (83.8%). There were two indices of InD type, which were SDII (86.5%) and Prcptot (75.7%), and the only CDD index was DeD type, with a 48.6% decrease vs. an 18.9% increase in all 37 stations.
Moreover, SDII, Prcptot, and R10 increased most obviously in the central and northern part of the study area, while they decreased in the southeastern part of the study area. The upward and downward trends in Rx1day, Rx5day, R95p, and CDD were generally staggered in the study area, but they also showed the characteristics of strengthening in the middle and weakening in the north and south to a certain extent. The changing spatial trends in CWD, R99p, and R20 were not obvious.

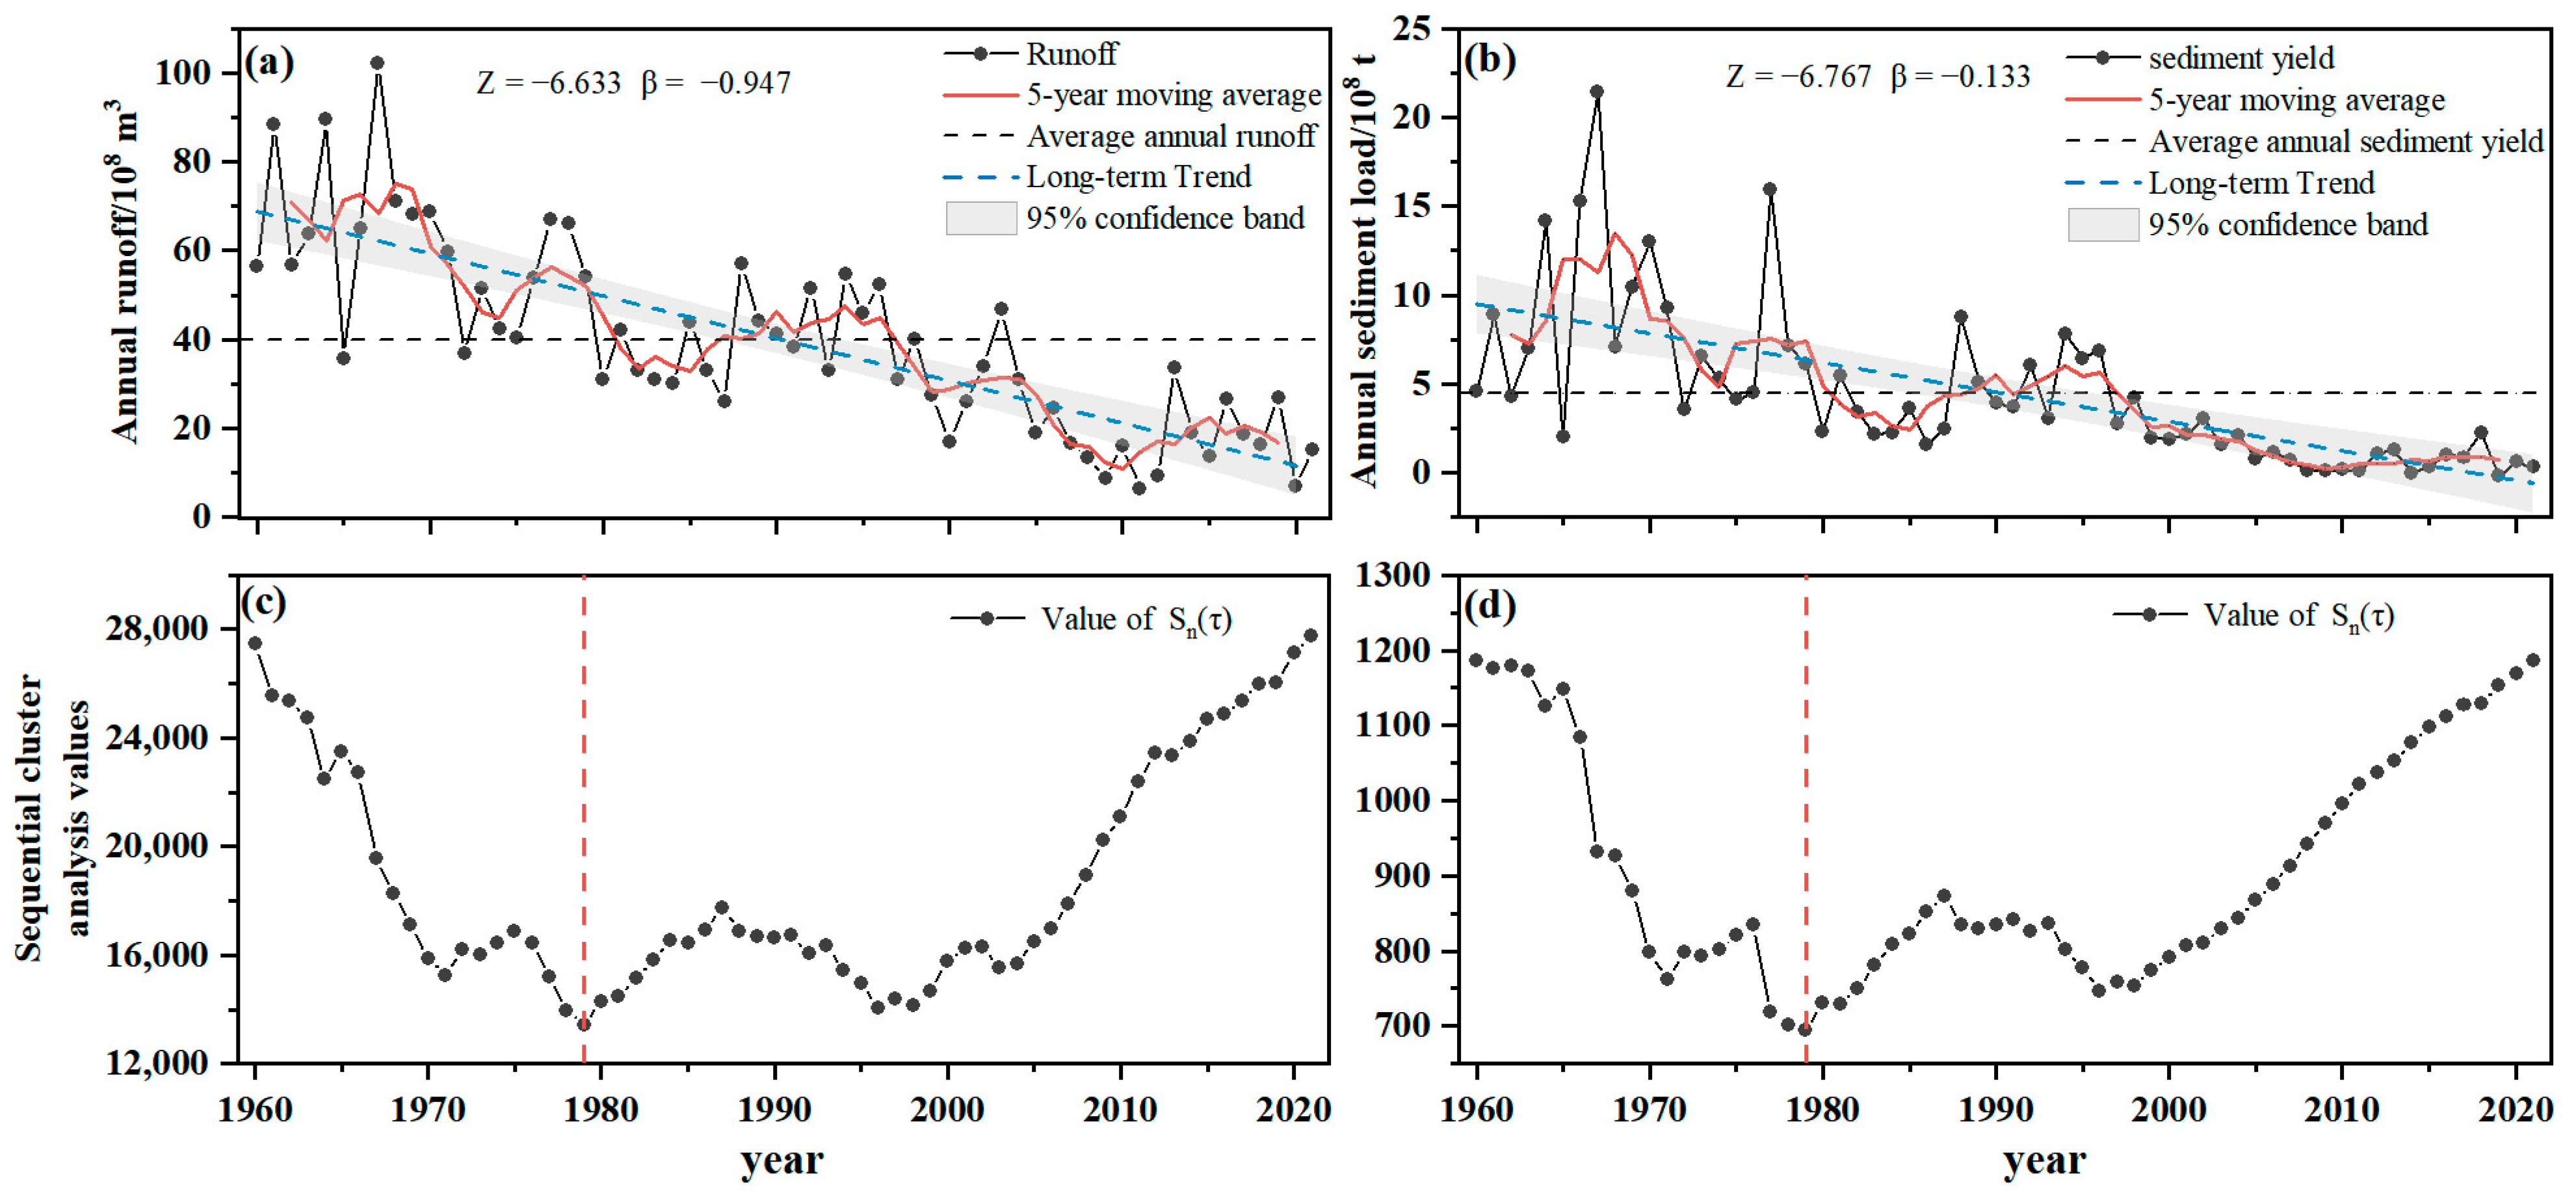
3.2. Temporal Trends of Runoff and Sediment Yield

During the period 1960–2021, the average runoff in the Toudaoguai–Longmen section was 3.98 billion m3, and the runoff showed a significant decreasing trend (p < 0.05), with a decline rate of 0.947 million m3/a (Figure 4a). The results showed that the change point was detected at a significance level of 95% for the runoff in the Toudaoguai–Longmen section by the sequential cluster method (Figure 4b). Based on the results of change point identification, the study period of 1960–2021 for the study area can be divided into two periods: 1960–1979 (P1) and 1980–2021(P2). The annual runoff decreased from 6.19 billion m3/a during P1 to 2.93 billion m3/a during P2, a decline of 52.7% from P1 to P2. Moreover, in period P2, the interannual fluctuation of runoff was relatively small from 1980 to 2000, and it further declined during the period 2000–2010 and stabilized at lower flows after 2010.
The average sediment yield in the Toudaoguai–Longmen section from 1960 to 2021 was 0.446 billion tons, with the highest sediment yield volume appearing in 1967, reaching 2.144 billion tons. Similar to the variation in runoff, the annual sediment yields also showed a significant downward trend from 1960 to 2021 (p < 0.05), with an average annual decline rate of 0.013 billion t/a. In addition, the change point of the sediment yield series in the study area also appeared in 1979. The annual sediment yield decreased from 0.853 billion tons in the period between 1960 and 1979 to 0.251 billion tons in the period between 1980 and 2021, with a decline ratio of 70.6%. In addition, after 2005, the sediment in the Toudaoguai–Longmen section remained low and stable and was below 0.100 billion tons in most periods, indicating that soil and water conservation in the region had achieved remarkable results.

3.3. Effects of Extreme Precipitation on Runoff and Sediment Yield Changes

The period from 1960 to 1979, before the change point in runoff and sediment yield in the Toudaoguai–Longmen section, is taken as the base period for runoff and sediment under natural conditions. The PLSR model was constructed based on the extreme precipitation indices, runoff, and sediment yield during the years 1960–1979. The cumulative interpretation of the model for the total variance in annual runoff and sediment was 85.8% and 63.7%, respectively (p < 0.05). The prediction ability of the model for annual runoff and sediment was 79.8% and 51.1%, respectively (Table 2).
The weights of each extreme precipitation index in the first and second principal components of the annual runoff and sediment yield forecast are shown in Figure 5a,b. A positive weight indicates that the factor had a promoting effect on runoff and sediment yield, while a negative weight indicates that it limited the generation of runoff and sediment yield. Except for CDD, all other extreme precipitation indices had a positive impact on runoff and sediment. The influence degree and explanatory ability of each extreme precipitation index on annual runoff and sediment yield can be measured by the projected importance of variables (VIP). The VIP value and 90% confidence interval of each extreme precipitation index in the constructed PLSR model of annual runoff and sediment yield are shown in Figure 5c,d, respectively. Prcptot and R95p were the most important variables affecting runoff and sediment yield change.
Using the PLSR model, this study further quantified the impact of extreme precipitation and other factors on runoff and sediment yield in the Toudaoguai–Longmen section during the period 1980–2021. Compared with 1960–1979, the runoff depth decreased by 17.6 mm in the period between 1980 and 1999 and 32.5 mm in the period between 2000 and 2021, in which the contribution rate of extreme precipitation to the decrease in runoff depth in the two periods was 35.3% and 6.2%, respectively (Table 3). Compared with 1960–1979, the sediment yield decreased by 3391.6 t/km2 and 5912.9 t/km2 during the periods 1980–1999 and 2000–2021, respectively. The contribution rates of extreme precipitation to sediment yield change in the two periods were 84.3% and 40.0%, respectively (Table 4). The contribution of other factors to the decrease in runoff depth in both periods was higher than that of extreme precipitation, but the contribution of other factors to the decrease in sediment yield in the years 1980–1999 was lower than that of extreme precipitation. Overall, the contribution of other factors to runoff and sediment change has continued to increase over the past 40 years.

4. Discussion

4.1. Characteristics of Extreme Precipitation in the Toudaoguai–Longmen Section under Changing Climate

In the context of climate warming, extreme precipitation events are increasing in most parts of the world [1,4,30]. In China, extreme precipitation indices such as the number of heavy precipitation days, number of very heavy precipitation days, and annual total wet day precipitation show significant increasing trends under RCP4.5 and 8.5 scenarios in the future, especially in arid and semi-arid areas of northwest China [31]. Our study supports the above conclusions to some extent. The Toudaoguai–Longmen section located in the Loess Plateau region of northwest China, and the extreme precipitation indices of R10, R20, Preptot, SDII, R95p, and R99p all showed an insignificantly increasing trend from 1960 to 2021, especially since 2000 when the increase in extreme precipitation indices became more obvious (Figure 2). The variation of extreme precipitation in the middle Yellow River is mainly influenced by the intensity of the Asian summer monsoon and the related large-scale circulation [32]. The East Asian summer monsoon continued to strengthen since the 2000s, resulting in an increase in total precipitation and extreme precipitation in the middle reaches of the Yellow River [33,34]. However, Zhang et al. (2019) found a downward trend in the extreme precipitation indices such as Prcptot, R10, R12, R25, Rx5day, and R95p in the middle reaches of the Yellow River during the years 1960–2013, although the decreases were not significant [18]. We propose two reasons for the inconsistent results. First, the time series of extreme precipitation indices used in this study was longer. As shown in Figure 2, most extreme precipitation indices in the study area had a significant increasing trend since the 21st century compared with the last century. The obvious increase in the extreme precipitation indices over the last 20 years may have led to an upward trend in our results. Second, the study area was also different, and the meteorological stations were more concentrated in our study, which also may have caused inconsistencies in the results. In addition, the time of extreme precipitation intensification in the middle reaches of the Yellow River is not consistent with that in the Yangtze River. The combined action of the southwest monsoon and the East Asian monsoon led to the highest intensity of extreme rainfall in the Yangtze River Basin in the 1990s [35,36], while the intensity of extreme rainfall in the middle reaches of the Yellow River was the highest in 2010s (Figure 2), indicating that the occurrence time of extreme precipitation has certain asynchrony on the regional scale.
In our study, the central and northern parts of the study area had a more intensified upward trend in extreme precipitation (Figure 3). This is consistent with research showing that areas displaying increases in extreme precipitation within the Yellow River Basin mainly occurred in arid and semi-arid regions with annual precipitation below 450 mm [37]. The recent extreme precipitation and flood events observed on the Loess Plateau also basically occurred in the northern and central areas of the study area. For example, an extreme precipitation event occurred in the Wuding River from 25–26 July 2017, in which the maximum daily precipitation exceeded 200 mm and the calculated recurrence interval of the event was within the 500 years range, resulting in the peak flow of 4480 m3 s−1 and maximum sediment concentration of 873 kg m−3 in the downstream Baijiachuan hydrological station [19,20]. In the context of the obvious increase in extreme precipitation in recent 20 years, the risk of flood disasters and soil erosion in the middle reaches of the Yellow River will further intensify in the future. Thus, it is urgent to strengthen the monitoring and early warning for extreme precipitation events so as to scientifically respond to floods and erosion disasters in the region.

4.2. Effects of Extreme Precipitation on Runoff and Sediment Yield in the Toudaoguai–Longmen Section

The increase in extreme precipitation events has led to increased uncertainty in river runoff and sediment changes [8,11]. Some studies believe that extreme precipitation has a significant impact on runoff changes, and heavy precipitation can easily trigger extreme runoff [10,28]. However, other studies have found that the increase in extreme precipitation may not lead to a significant increase in extreme runoff [12,13]. For example, statistics in 390 watersheds in the United States found that only 36% of extreme precipitation events would lead to corresponding extreme runoff [38].
In the Loess Plateau, a previous study has shown that extreme precipitation indices such as heavy precipitation, days of heavy precipitation, and total annual precipitation are the key climate variables that influence annual runoff [39]. This study further clarified that Prcptot, R95p, and R99p are important extreme precipitation indices affecting runoff and sediment changes in the Toudaoguai–Longmen section (Figure 5). However, our study also found that although the frequency of extreme precipitation is increasing, the impact of extreme precipitation on runoff and sediment yield has been weakening in the past decades in the study area. The contribution of extreme precipitation to runoff changes decreased from 35.3% in the years 1980–1999 to 6.2% in the years 2000–2021 (Table 3); and the contribution to sediment yield decreased from 84.3% in the years 1980–1999 to 40% in the years 2000–2021 (Table 4). Previous studies also found that the impact of extreme precipitation on changes in river runoff continued to decline in recent decades on the Loess Plateau. In contrast, the contribution of human activities to the runoff reduction in the middle reaches of the Yellow River increased from 59% during 1980–1999 to 82% during 2000–2015 [39].
The hydrological response of a watershed to precipitation events is determined by multiple interacting factors (such as land use types, terrain, soil parent material, vegetation coverage, etc.) that control runoff and sediment yield [20,39]. In the base period (1960–1979), the relationship between extreme precipitation and runoff would be significant. However, during the period of large-scale soil and water conservation construction, climate change and human activities would jointly affect the runoff and sediment yield changes, and the precipitation threshold for surface runoff and sediment yield would increase significantly [40]. Although the extreme precipitation events in the Toudaoguai–Longmen section have shown an upward trend since 2000, the runoff and sediment yield have been decreasing, which could be attributed to the implementation of a series of soil and water conservation measures in the study area. Changes in the Earth’s surface caused by human activities such as terraces, check dams, and vegetation construction are important driving factors that change the response of runoff and sediment yield to extreme precipitation events [14,20]. Compared with the 1960s, the number of check dams increased by more than 7 times with the major construction periods taking place in the 1970s and 2000s in the study region (Figure 1c). Moreover, the cumulative area of forest and grass increased by 2191 km2, while the cultivated land decreased by 3473 km2 since 2000 (Figure 1b). Previous studies indicated that under similar rainfall conditions after 2000, the average runoff in the basin was reduced by 30.4–78.2%, and the average sediment yield was reduced by 53.0–88.2% in comparison with historical extreme rainfall events [21]. Moreover, during extreme rainfall events, the flood runoff modulus and sediment transport modulus in areas where soil and water conservation were implemented were 57.2% and 75.7% lower, respectively, than in those areas without soil and water conservation measures [16].
In the Toudaoguai–Longmen section, a large number of water and soil conservation measures have been implemented in the past decades, which have effectively changed the underlying surface conditions and played a significant role in blocking water and sediment in this region [14]. Especially after 2000, a large-scale project of returning farmland to forest and grassland has been underway on the Loess Plateau, resulting in an increase in regional vegetation coverage from 32% in 1999 to 63% in 2018, which effectively intercepts slope runoff and sediment [41]. However, in the case of continuous high-intensity extreme precipitation, some soil and water conservation constructions have the risk of being washed away [19]. It is believed that soil and water conservation measures have a significant effect on peak-cutting and reducing sediment during flood processes driven by medium- and low-intensity rainfall events, but they have a limited effect on reducing flood and sediment during high-intensity storm floods [19]. Although the frequency of extreme precipitation events in the Loess Plateau has not shown a significant upward trend, past experience and lessons show that each extreme precipitation event caused great flood disasters [42]. On 26 July 2017, Suide County, Shaanxi Province suffered a “once-in-a-century” torrential rain and flood, which damaged 337 check dams and affected 432,700 people [43]. Thus, in the future, the regulation effects of extreme precipitation intensity, soil and water conservation measures, and ecological construction on regional runoff and sediment should be comprehensively considered to better cope with hydrological disasters caused by global climate change.

5. Conclusions

The study adopted the method of MMK test and sequential cluster to explore the trends characteristics of extreme precipitation, runoff, and sediment yield, and then to identify the dominating extreme precipitation index on runoff and sediment generation and to quantify the contribution of extreme precipitation changes on the reduction of runoff and sediment based on the PLSR method in the Toudaoguai-Longmen section of the middle reaches of the Yellow River from 1960 to 2021.
Our study found that extreme precipitation events in the middle reaches of the Yellow River had no significant trend changes during 1960–2021, although most extreme precipitation indices showed a clear increasing trend after 2000. Moreover, the extreme precipitation index spatially showed a stronger strengthening trend in the central and northern regions than in the southern regions. Runoff and sediment yield decreased significantly from 1960 to 2021 with a break point at 1979. Compared with the base period (1960–1979), runoff and sediment yield decreased by 52.7% and 70.6% during the period 1980–2021. Prcptot and R95p were the most important extreme precipitation variables affecting runoff and sediment yield changes during the period 1960–1979. The contribution of extreme precipitation to the decrease in runoff during the 1980–1999 and 2000–2021 periods was 35.3% and 6.2%, respectively, while its contribution to sediment change was 84.3% and 40.0% compared with the base period. Our results suggest that factors other than extreme precipitation, mainly large-scale soil and water conservation construction, have played an important role in reducing runoff and sediment in the study region over the past 40 years.

Author Contributions

Conceptualization, Z.R. and K.W.; methodology, X.M. and Z.R.; writing—original draft preparation, Z.R., X.M. and K.W.; writing—review and editing, K.W. and Z.L.; funding acquisition, Z.R. and K.W. All authors have read and agreed to the published version of the manuscript.

Funding

This study was funded by the National natural Science Foundation of China (42077074, U2243225), the National Key Research and Development Program of China (2017YFC0504501), and Shaanxi Province science and technology activities for overseas students selected funding project (2021015).

Institutional Review Board Statement

Not applicable.

Informed Consent Statement

Not applicable.

Data Availability Statement

The daily precipitation data are obtained from http://www.resdc.cn (accessed on 8 September 2022). Annual runoff and sediment yield data are derived from the Yellow River Basin Hydrological Yearbook.

Conflicts of Interest

The authors declare no conflict of interest.

References

  1. Gimeno, L.; Sori, R.; Vazquez, M.; Stojanovic, M.; Algarra, I.; Eiras-Barca, J.; Gimeno-Sotelo, L.; Nieto, R. Extreme precipitation events. WIREs Water 2022, 9, e1611. [Google Scholar] [CrossRef]
  2. Giorgi, F.; Raffaele, F.; Coppola, E. The response of precipitation characteristics to global warming from climate projections. Earth Syst. Dyn. 2019, 10, 73–89. [Google Scholar] [CrossRef]
  3. Wang, H.; Huang, Y.; Zhang, D.; Wang, H. Decadal prediction of the summer extreme precipitation over southern China. Atmosphere 2023, 14, 595. [Google Scholar] [CrossRef]
  4. Asadieh, B.; Krakauer, N.Y. Global trends in extreme precipitation: Climate models versus observations. Hydrol. Earth Syst. Sci. 2015, 19, 877–891. [Google Scholar] [CrossRef]
  5. Chou, C.; Chiang, J.C.H.; Lan, C.W.; Chung, C.H.; Liao, Y.C.; Lee, C.J. Increase in the range between wet and dry season precipitation. Nat. Geosci. 2013, 6, 263–267. [Google Scholar] [CrossRef]
  6. Donat, M.G.; Alexander, L.V.; Yang, H.; Durre, I.; Vose, R.; Dunn, R.J.H.; Willett, K.M.; Aguilar, E.; Brunet, M.; Caesar, J.; et al. Updated analyses of temperature and precipitation extreme indices since the beginning of the twentieth century: The HadEX2 dataset. J. Geophys. Res. Atmos. 2013, 118, 2098–2118. [Google Scholar] [CrossRef]
  7. Roxy, M.K.; Ghosh, S.; Pathak, A.; Athulya, R.; Mujumdar, M.; Murtugudde, R.; Terray, P.; Rajeevan, M. A threefold rise in widespread extreme rain events over central India. Nat. Commun. 2017, 8, 708. [Google Scholar] [CrossRef]
  8. Do, H.X.; Mei, Y.; Gronewold, A.D. To what extent are changes in flood magnitude related to changes in precipitation extremes? Geophys. Res. Lett. 2020, 47, e2020GL088684. [Google Scholar] [CrossRef]
  9. Wu, L.; Chen, D.; Yang, D.; Luo, G.; Wang, J.; Chen, F. Response of runoff change to extreme climate evolution in a typical watershed of Karst trough valley, SW China. Atmosphere 2023, 14, 927. [Google Scholar] [CrossRef]
  10. Nanditha, J.S.; Mishra, V. Multiday precipitation is a prominent driver of floods in Indian river basins. Water Resour. Res. 2022, 58, e2022WR032723. [Google Scholar] [CrossRef]
  11. Kundzewicz, Z.W.; Kanae, S.; Seneviratne, S.I.; Handmer, J.; Nicholls, N.; Peduzzi, P.; Mechler, R.; Bouwer, L.M.; Arnell, N.; Mach, K.; et al. Flood risk and climate change: Global and regional perspectives. Hydrol. Sci. J. 2014, 59, 1–28. [Google Scholar] [CrossRef]
  12. Sharma, A.; Wasko, C.; Lettenmaier, D.P. If precipitation extremes are increasing, why aren’t floods? Water Resour. Res. 2018, 54, 8545–8551. [Google Scholar] [CrossRef]
  13. Ran, Q.; Zong, X.; Ye, S.; Gao, J.; Hong, Y. Dominant mechanism for annual maximum flood and sediment events generation in the Yellow River basin. Catena 2020, 187, 104376. [Google Scholar] [CrossRef]
  14. Gao, P.; Deng, J.; Chai, X.; Mu, X.; Zhao, G.; Shao, H.; Sun, W. Dynamic sediment discharge in the Hekou–Longmen region of Yellow River and soil and water conservation implications. Sci. Total Environ. 2017, 578, 56–66. [Google Scholar] [CrossRef] [PubMed]
  15. Xu, Z.; Zhang, S.H.; Yang, X.Y. Water and sediment yield response to extreme rainfall events in a complex large river basin: A case study of the Yellow River Basin, China. J. Hydrol. 2021, 597, 126183. [Google Scholar] [CrossRef]
  16. Zhao, Y.; Xu, X.; Huang, W.; Wang, Y.; Xu, Y.; Chen, H.; Kang, Z. Trends in observed mean and extreme precipitation within the Yellow River Basin, China. Theor. Appl. Climatol. 2019, 136, 1387–1396. [Google Scholar] [CrossRef]
  17. Li, Z.; Zheng, F.L.; Liu, W.Z.; Jiang, D.J. Spatially downscaling GCMs outputs to project changes in extreme precipitation and temperature events on the Loess Plateau of China during the 21st Century. Glob. Planet. Chang. 2012, 82–83, 65–73. [Google Scholar] [CrossRef]
  18. Zhang, Y.; Xia, J.; She, D.X. Spatiotemporal variation and statistical characteristic of extreme precipitation in the middle reaches of the Yellow River Basin during 1960–2013. Theor. Appl. Climatol. 2019, 135, 391–408. [Google Scholar] [CrossRef]
  19. Zhang, P.; Sun, W.; Xiao, P.; Yao, W.; Liu, G. Driving factors of heavy rainfall causing flash floods in the middle reaches of the Yellow River: A case study in the Wuding River Basin, China. Sustainability 2022, 14, 8004. [Google Scholar] [CrossRef]
  20. Li, P.; Xu, G.; Lu, K.; Zhang, X.; Shi, P.; Bai, L.; Ren, Z.; Pang, G.; Xiao, L.; Gao, H.; et al. Runoff change and sediment source during rainstorms in an ecologically constructed watershed on the Loess Plateau, China. Sci. Total Environ. 2019, 664, 968–974. [Google Scholar] [CrossRef]
  21. Zhao, Y.; Cao, W.H.; Hu, C.H.; Wang, Y.S.; Wang, Z.Y.; Zhang, X.M.; Zhu, B.S.; Cheng, C.; Yin, X.L.; Liu, B.; et al. Analysis of changes in characteristics of flood and sediment yield in typical basins of the Yellow River under extreme rainfall events. Catena 2019, 177, 31–40. [Google Scholar] [CrossRef]
  22. Gao, H.; Liu, H.; Jia, L.; Pang, G.; Wang, J. Attribution analysis of precipitous decrease of sediment loads in the Hekou-Longmen section of Yellow River since 2000. Acta Geogr. Sin. 2019, 74, 1745–1757. (In Chinese) [Google Scholar] [CrossRef]
  23. Tank, A.K.M.C.; Zwiers, F.W.; Zhang, X. Guidelines on Analysis of Extremes in a Changing Climate in Support of Informed Decisions for Adaptation; World Meteorological Organization (WMO): Geneva, Switzerland, 2009. [Google Scholar]
  24. Cooley, A.K.; Chang, H. Detecting change in precipitation indices using observed (1977–2016) and modeled future climate data in Portland, Oregon, USA. J. Water Clim. Chang. 2020, 12, 1135–1153. [Google Scholar] [CrossRef]
  25. Zhang, X.B.; Yang, F. RClimDex(1.0) UserManual; Climate Research Branch Environment: Toronto, ON, Canada, 2004. [Google Scholar]
  26. Hamed, K.H.; Ramachandra Rao, A. A modified Mann-Kendall trend test for autocorrelated data. J. Hydrol. 1998, 204, 182–196. [Google Scholar] [CrossRef]
  27. Sen, P.K. Estimates of the regression coefficient based on Kendall’s Tau. J. Am. Stat. Assoc. 1968, 63, 1379–1389. [Google Scholar] [CrossRef]
  28. Sun, J.; Wang, X.; Shahid, S. Precipitation and runoff variation characteristics in typical regions of North China Plain: A case study of Hengshui City. Theor. Appl. Climatol. 2020, 142, 971–985. [Google Scholar] [CrossRef]
  29. Liu, W.; Li, Z.; Zhu, J.; Xu, C.; Xu, X. Dominant factors controlling runoff coefficients in karst watersheds. J. Hydrol. 2020, 590, 125486. [Google Scholar] [CrossRef]
  30. Du, H.; Alexander, L.V.; Donat, M.G.; Lippmann, T.; Srivastava, A.; Salinger, J.; Kruger, A.; Choi, G.; He, H.S.; Fujibe, F.; et al. Precipitation from persistent extremes is increasing in most regions and globally. Geophys. Res. Lett. 2019, 46, 6041–6049. [Google Scholar] [CrossRef]
  31. Li, L.; Yao, N.; Liu, D.L.; Song, S.; Lin, H.; Chen, X.; Li, Y. Historical and future projected frequency of extreme precipitation indicators using the optimized cumulative distribution functions in China. J. Hydrol. 2019, 579, 124170. [Google Scholar] [CrossRef]
  32. Gao, T.; Wang, H.L. Trends in precipitation extremes over the Yellow River basin in North China: Changing properties and causes. Hydrol. Process. 2017, 31, 2412–2428. [Google Scholar] [CrossRef]
  33. Liu, H.; Zhou, T.; Zhu, Y.; Lin, Y.H. The strengthening East Asia summer monsoon since the early 1990s. Chin. Sci. Bull. 2012, 57, 765–769. [Google Scholar] [CrossRef]
  34. Cai, Q.; Liu, Y.; Fang, C.; Xie, M.; Zhang, H.; Li, Q.; Song, H.; Sun, C.; Liu, R.; Di, T.; et al. Insight into spatial-temporal patterns of hydroclimate change on the Chinese Loess Plateau over the past 250 years, using new evidence from tree rings. Sci. Total Environ. 2022, 850, 157960. [Google Scholar] [CrossRef]
  35. Das, S.; Zhu, D.; Cheng, C.H. A regional approach of decadal assessment of extreme precipitation estimates: A case study in the Yangtze River Basin, China. Pure Appl. Geophys. 2020, 177, 1079–1093. [Google Scholar] [CrossRef]
  36. Das, S.; Zhu, D. Comparison between observed and remotely sensed attributes to include in the region-of-influence approach of extreme precipitation estimation: A case study in the Yangtze River basin, China. Hydrol. Sci. J. 2021, 66, 1777–1789. [Google Scholar] [CrossRef]
  37. Xie, M.; Ren, Z.; Li, Z.; Zhang, X.; Ma, X.; Li, P.; Shen, Z. Evolution of the precipitation–stream runoff relationship in different precipitation scenarios in the Yellow River Basin. Urban Clim. 2023, 51, 101609. [Google Scholar] [CrossRef]
  38. Ivancic, T.J.; Shaw, S.B. Examining why trends in very heavy precipitation should not be mistaken for trends in very high river discharge. Clim. Chang. 2015, 133, 681–693. [Google Scholar] [CrossRef]
  39. Zhang, J.; Gao, G.; Li, Z.; Fu, B.; Gupta, H.V. Identification of climate variables dominating streamflow generation and quantification of streamflow decline in the Loess Plateau, China. Sci. Total Environ. 2020, 722, 137935. [Google Scholar] [CrossRef]
  40. Gao, G.; Zhang, J.; Liu, Y.; Ning, Z.; Fu, B.; Sivapalan, M. Spatio-temporal patterns of the effects of precipitation variability and land use/cover changes on long-term changes in sediment yield in the Loess Plateau, China. Hydrol. Earth Syst. Sci. 2017, 21, 4363–4378. [Google Scholar] [CrossRef]
  41. Wang, K.; Deng, L.; Shangguan, Z.; Chen, Y.; Lin, X. Sustainability of eco-environment in semi-arid regions: Lessons from the Chinese Loess Plateau. Environ. Sci. Policy 2021, 125, 126–134. [Google Scholar] [CrossRef]
  42. Yin, S.; Gao, G.; Ran, L.; Li, D.; Lu, X.; Fu, B. Extreme streamflow and sediment load changes in the Yellow River Basin: Impacts of climate change and human activities. J. Hydrol. 2023, 619, 129372. [Google Scholar] [CrossRef]
  43. Liu, B.; Yao, W.; Liu, G.; An, S.; Han, J.; Cao, W.; Dang, W.; Jiao, J. Comprehensive Investigation Report on “7.26” Heavy Rainstorm Flood, and Soil and Water Conservation Benefits in the Loess Plateau; Science Press: Beijing, China, 2020. (In Chinese) [Google Scholar]
Figure 1. Location (a), land use (b) and check dam (c) changes of the study area. The upper left figure shows the Yellow River basin, the shaded part is the Toudaoguai-Longmen section in (a).
Atmosphere 14 01415 g001
Figure 2. Variations in extreme precipitation indices in the Toudaoguai–Longmen section, 1960–2021.
Atmosphere 14 01415 g002
Figure 3. Distribution of long-term trends in extreme precipitation indices in the Toudaoguai–Longmen section during the years 1960–2021. (a): Consecutive dry days (CDD), (b): Consecutive wet days (CWD), (c): Heavy precipitation days (R10), (d): Very heavy precipitation days (R20), (e): Annual total wet-day precipitation (Prcptot), (f): Very wet days (R95p), (g): Extreme wet days (R99p), (h): Highest one-day precipitation amount (Rx1day), (i): Highest five-day precipitation amount (Rx5day), (j): Simple daily intensity index (SDII).
Atmosphere 14 01415 g003
Figure 4. Temporal trends and mutation tests in runoff (a,c) and sediment (b,d) in the Toudaoguai–Longmen section during the period from 1960 to 2021. The dashed red line in subfigures (c,d) indicated the year when the mutation occurred.
Atmosphere 14 01415 g004
Figure 5. Weight plots of the first and second PLSR components and VIP values of each extreme precipitation index in annual runoff (a,c) and sediment yield prediction (b,d) in the Toudaoguai–Longmen Section. The dashed lines in subfigures (c,d) indicated the VIP value equation to 1.0.
Atmosphere 14 01415 g005
Table 1. Definitions of the 10 extreme precipitation indices.
IndicesDefinitionsUnits
Consecutive dry days (CDD)The maximum length of a dry spell (RR < 1 mm) in a year; let RRi be the daily precipitation amount on day i in a year; count the largest number of consecutive days where RRi < 1 mm.day
Consecutive wet days (CWD)The maximum length of a wet spell (RR > 1 mm) in a year;
let RRi be the daily precipitation amount on day i in a year; count the largest number of consecutive days where RRi > 1 mm.
day
Heavy precipitation days (R10)Count of days where RR (daily precipitation amount) ≥ 10 mm, let RRi be the daily precipitation amount on day i in a year. Count the number of days where RRi ≥ 10 mm.day
Very heavy precipitation days (R20)Count of days where RR (daily precipitation amount) ≥ 20 mm, let RRi be the daily precipitation amount on day i in a year. Count the number of days where RRi ≥ 20 mm.day
Annual total wet-day precipitation (Prcptot)Accumulated precipitation with daily precipitation > 1 mm in a year.mm
Simple daily intensity index (SDII)Mean precipitation amount on a wet day.Taking the sum of precipitation in wet days (days with >1 mm of precipitation), and dividing that by the number of wet days in a year dmm/d
Very wet days (R95p)Annual cumulative precipitation with daily precipitation > 95% quantilemm
Extreme wet days (R99p)Annual cumulative precipitation with daily precipitation > 99% quantilemm
Highest one-day precipitation amount (Rx1day)Annual maximum 1-day precipitationmm
Highest five-day precipitation amount (Rx5day)Annual maximum consecutive five-day precipitationmm
Table 2. Summary of the PLSR models for runoff and sediment in the Toudaoguai–Longmen section.
FactorR2Q2ComponentExplanation/%Cumulative Explanation/% Q cum 2
Runoff0.8580.798168.568.50.655
217.385.80.798
Sediment0.6370.511141.941.90.333
221.863.70.511
Table 3. Effects of extreme precipitation on the variation in annual runoff depth in the Toudaoquai–Longmen section.
Time PeriodMeasured Runoff Depth/mmSimulated Runoff Depth/mmMeasured Flow ReductionImpact of Extreme PrecipitationImpact of Human Activities
mm%mm%mm%
1960–197948.4///////
1980–199930.842.217.636.46.235.311.464.7
2000–202115.946.432.567.22.06.230.593.8
Table 4. Effects of extreme precipitation on the variation in annual sediment load in the Toudaoquai–Longmen section.
Time PeriodMeasured Sediment Load/t/km2Simulated Sediment Load/t/km2Measured Sediment Load ChangeImpact of Extreme PrecipitationImpact of Other Factors
t/km2%t/km2%t/km2%
1960–19796678.7///////
1980–19993287.13819.63391.650.82859.084.3532.515.7
2000–2021765.84313.45912.988.52365.340.03547.660.0
Disclaimer/Publisher’s Note: The statements, opinions and data contained in all publications are solely those of the individual author(s) and contributor(s) and not of MDPI and/or the editor(s). MDPI and/or the editor(s) disclaim responsibility for any injury to people or property resulting from any ideas, methods, instructions or products referred to in the content.

