Article

Human Activities Accelerated Increase in Vegetation in Northwest China over the Three Decades

1
College of Geography and Environmental Science, Northwest Normal University, Lanzhou 730000, China
2
Key Laboratory of Resource Environment and Sustainable Development of Oasis, Lanzhou 730000, China
3
Yanchiwan National Nature Reserve Management and Protection Center of Gansu Province, Jiuquan 735000, China
*
Authors to whom correspondence should be addressed.
Atmosphere 2023, 14(9), 1419; https://doi.org/10.3390/atmos14091419
Submission received: 14 August 2023 / Revised: 2 September 2023 / Accepted: 5 September 2023 / Published: 8 September 2023
(This article belongs to the Special Issue Regional Hydrological Processes in a Changing Climate)

Abstract

:
Natural ecosystems are changing more quickly because of human activities, the type and intensity of which are directly correlated with vegetation greenness. To effectively determine how human activities affect trends in vegetation under climate change, we must differentiate between various types of human activities. The GTWR model can study the spatiotemporal non-stationary relationship between the NDVI trend and climate change. The GTWR model was incorporated into multiple climate variables and improved residual analysis to quantify the contributions of climate change and human activities on vegetation change trends in the Hexi region during different periods. This study divides human activities into four groups based on land use change: urbanization, agricultural expansion, desertification, and ecological restoration to further investigate their contribution to vegetation greenness change. The results showed that in 56.9% of the significant vegetation greening trends between 1982 and 2015, climate factors contributed only 7.4%, while human factors contributed a significant 22.7%. Since the ecological restoration project implemented in 2000, the expansion intensity of ecological restoration and urbanization increased significantly, followed by agricultural expansion and desertification. For the considerable greening trends in the Hexi region, the ecological restoration project contributed 26.7%, while agricultural expansion and urbanization contributed 17.5% and 4.6%, respectively. This study aims to provide new insights for more accurate simulation and evaluation of the interaction effects of climate change and human socio-economic development on vegetation growth.

1. Introduction

Land use/cover change (LUCC) is an important indicator of global ecological environment change. Guided by socio-economic policies, the change in each land type is a key driving force that causes the coupling process of ecological, hydrological, and climate change [1,2]. At the same time, against the backdrop of rapid population growth, human activities, including ecological restoration projects, agricultural expansion, and urbanization, are accelerating the transformation of bare land and natural ecosystems [3,4,5]. Some scholars put forward the concept of “bare land increase”, that is, the dynamic transfer of vegetation coverage to bare land due to the development of housing, commerce, industry, transportation and other infrastructure, as well as land cover changes (strip mining of mineral resources) [6]. The increase in bare land will cause structural and functional changes in the ecosystem, such as the reduction of land carbon storage and landscape evapotranspiration, and the increase in surface reflectance [7,8,9], which will threaten the biogeochemical cycle, energy exchange, and biodiversity [10,11]. According to some scholars, land use management is the leading factor of greenness change in grassland and woody vegetation [4,12]. Activities such as land abandonment and agricultural expansion have caused a reversal of vegetation greening to browning [13,14,15,16] (Viglizzo et al., 2011; Pan et al., 2018; Du et al., 2019; Liu et al., 2021). The conversion of forestland into grassland and cropland will have an impact on the net carbon input of soil and loss balance, thus decreasing the carbon storage in cropland soil [17,18,19,20]. Through actions such as artificial afforestation, grassland restoration, and urban landscaping, the rate of vegetation greening has been improved in the ecological degradation area and urban center district [21,22,23,24,25]. In the current study, the direct actions of land use management in the process of greening trends are underestimated [26], and how human activities regulate vegetation dynamics in tackling climate change is not clear [4,13,27,28].
The increasingly frequent human activities have inflicted tremendous pressure on fragile ecological environments, accelerating the global process of vegetation degradation [29,30]. To alleviate the impact of environmental degradation, countries around the world have made significant investments in ecological restoration projects. Since the 1970s, China has successively implemented massive ecological restoration projects, including the National Plain Greening Project, the Beijing-Tianjin Sandstorm Source Control Project, the Wildwood Protection Project, the Conversion of Farmland Back to Forests Project, and the Three-North Shelter Forest Program, to restore and safeguard the degraded ecological environment [31,32,33,34,35]. In recent years, research on vegetation greenness changes driven by ecological restoration projects has drawn interest from domestic and foreign scholars [3,26,29,30,31,32,34,36,37,38]. According to one study, China’s implementation of afforestation and agricultural-intensive greening models contributed 25% to significant global vegetation greening trends [26]. The Conversion of Farmland Back to Forests Project in China, as the world’s greatest ecological restoration project, has achieved remarkable results since its implementation, with a total net income growth of 5.30 × 10¹¹ CNY in 2017 [29]. However, out of the 25 provinces where the project was implemented, 11 experienced net losses as a result of high expenses and low returns [29]. From 1982 to 2013, various afforestation measures implemented in the Three-North Area of China [39], the Karst Plateau region in southwest China [38], the Loess Plateau [40], Inner Mongolia [41], and Horqin sandy land [36] promoted vegetation restoration, and confirmed the vital importance of human intervention on vegetation restoration [34,37]. The characteristics of water deficiency in the arid area all year round have made other scholars question the effective role of afforestation [29,30,42,43]. Due to global climate warming, the increased drought stress in the southwest and northeast regions counteract the positive effect these ecological restoration projects have produced in driving vegetation growth [44]. Additionally, most studies primarily assess changes in vegetation greenness over brief periods using data from limited geographic areas or single data sets. These studies become less representative as a result of the extensive spatiotemporal span of afforestation plans [37,45]. In China’s sensitive ecological areas, overgrazing, deforestation, and agricultural expansion are also significant contributors to vegetation degradation [3,46]. However, the overall contributions of diverse ecological restoration projects and other human activities, and identifying the interactions of climate change and human activities on vegetation are still small [37].
Although fieldwork can gather precise data on vegetation dynamics and the elements that influence them, it is expensive, time-consuming, and limited by available research locations [37]. Satellite pictures have the advantages of extensive cover scope and lengthy periods, and have already become a crucial source for large-scale vegetation dynamic monitoring and act as an important carrier for research in ecological conservation [47,48,49]. Based on data from remote sensing satellites, there are now two basic methods for identifying surface changes. One is to compare and analyze land cover changes using photographs of land use classification from two or more periods, which are typically used to document the impact of human activities on land surfaces, such as deforestation and afforestation, desertification, and urbanization [50,51,52,53,54]. The other way is to focus on the change processes of land degradation and restoration [55], desertification [56] using time series analysis based on the normalized difference vegetation index (NDVI) derived through remote sensing. The latter is widely used to detect the interactions of climate change and human activities on NDVI trends [36,57,58,59]. The relationship between human activities and vegetation greening is closely correlated with the type and intensity of human activities [60,61,62]. Therefore, it is advantageous to make distinctions between various human activities to accurately extrapolate the influence of human activities on greening trends under climate change.
In recent decades, the relative effects of climate change and human activities on greening trends have been quantified by scholars using correlation regression analysis, partial derivative analysis, and multivariate analysis [14,36,63]. These methods, however, presupposed a linear relationship between climatic and human variables and vegetation change, which may ignore nonlinear changes in vegetation and skew the results [26]. Few researchers have tried to integrate these vastly dissimilar but complementary methods for tracking local environmental changes [64,65]. Currently, modeling techniques, e.g., residual trend analysis are the main focus of research on the quantitative effects of non-climatic factors on vegetation greenness [5,66,67]. To determine how human activities affect vegetation greenness, most studies compare actual NDVI values to simulated values based on water use efficiency, precipitation, or temperature [23,66,68,69,70,71]. However, human activities have an impact on ecosystem processes due to their mutual interaction with climate change [72,73,74,75]. There may be substantial variations in the regional and temporal climate elements that influence vegetation development, which is caused by several coupling factors. Additionally, the driving force behind the evolution of vegetation trends is spatiotemporally non-stationary with a time lag [14,76]. Although RESTREND analysis is useful for ecosystem management and protection, its linear assumption of the relationship between climate change and vegetation greening cannot adequately describe the complex and nonlinear mechanism that ecosystems react with toward external influencing factors. Therefore, the driving influence of climate change on vegetation greenness cannot be fully investigated through universal dominant climate elements and linear methodologies, which would increase the uncertainty and error of quantitative analytical results on the driving effects of human activities on vegetation greening [16,62,76,77]. There is currently little research on determining the nonlinear relationship between vegetation and climate factors in order to determine human-induced NDVI (HNDVI) [78,79]. To overcome this limitation, an improved residual trend analysis method was proposed in this study based on geographically and temporally weighted regression (GTWR) using multiple climate variables. In this way, the nonlinear response relationship can be quantified between climate change and human activities to greening trends so as to further investigate the essential response mechanism of vegetation change.
The Hexi region is located in the arid semi-arid region of northwest China [80]. Water from the Qilian Mountains’ glacier melt sustains this region. It produces the Hexi Corridor, a now-developed oasis, as well as the three important inland rivers: Shiyang, Heihe, and Shule. However, the region is dealing with major environmental risks and delicate ecological issues as a result of the dual challenges posed by climate change and human activities, which impede regional sustainable development [81,82]. There is ongoing debate concerning the relative effects of climate change and human activities (such as urbanization, agricultural expansion, and ecological restoration) on vegetation. As a result, it is critical to measure the influence of these driving factors on the ecosystem in the Hexi region, build a sustainable ecological environment, and avert any potential ecological damage [76,81,82]. In summary, the significant coupling effect of climate change on vegetation and changes in vegetation trends were obtained in this study using the GTWR model and the HNDVI trends through an improved residual trend analysis method. Based on this, this study quantitatively analyzed the contribution rate of climate change and human activities on the significant changes in vegetation greenness, as well as that of human-led land use management measures such as urbanization, agricultural expansion, and ecological restoration. Furthermore, this study delved extensively into the nonlinear relationship driven by the coupling of vegetation greenness, climatic change, and human activities to model and evaluate the effects of climate change and human socioeconomic development on terrestrial ecosystems more correctly.

2. Study and Data Processing
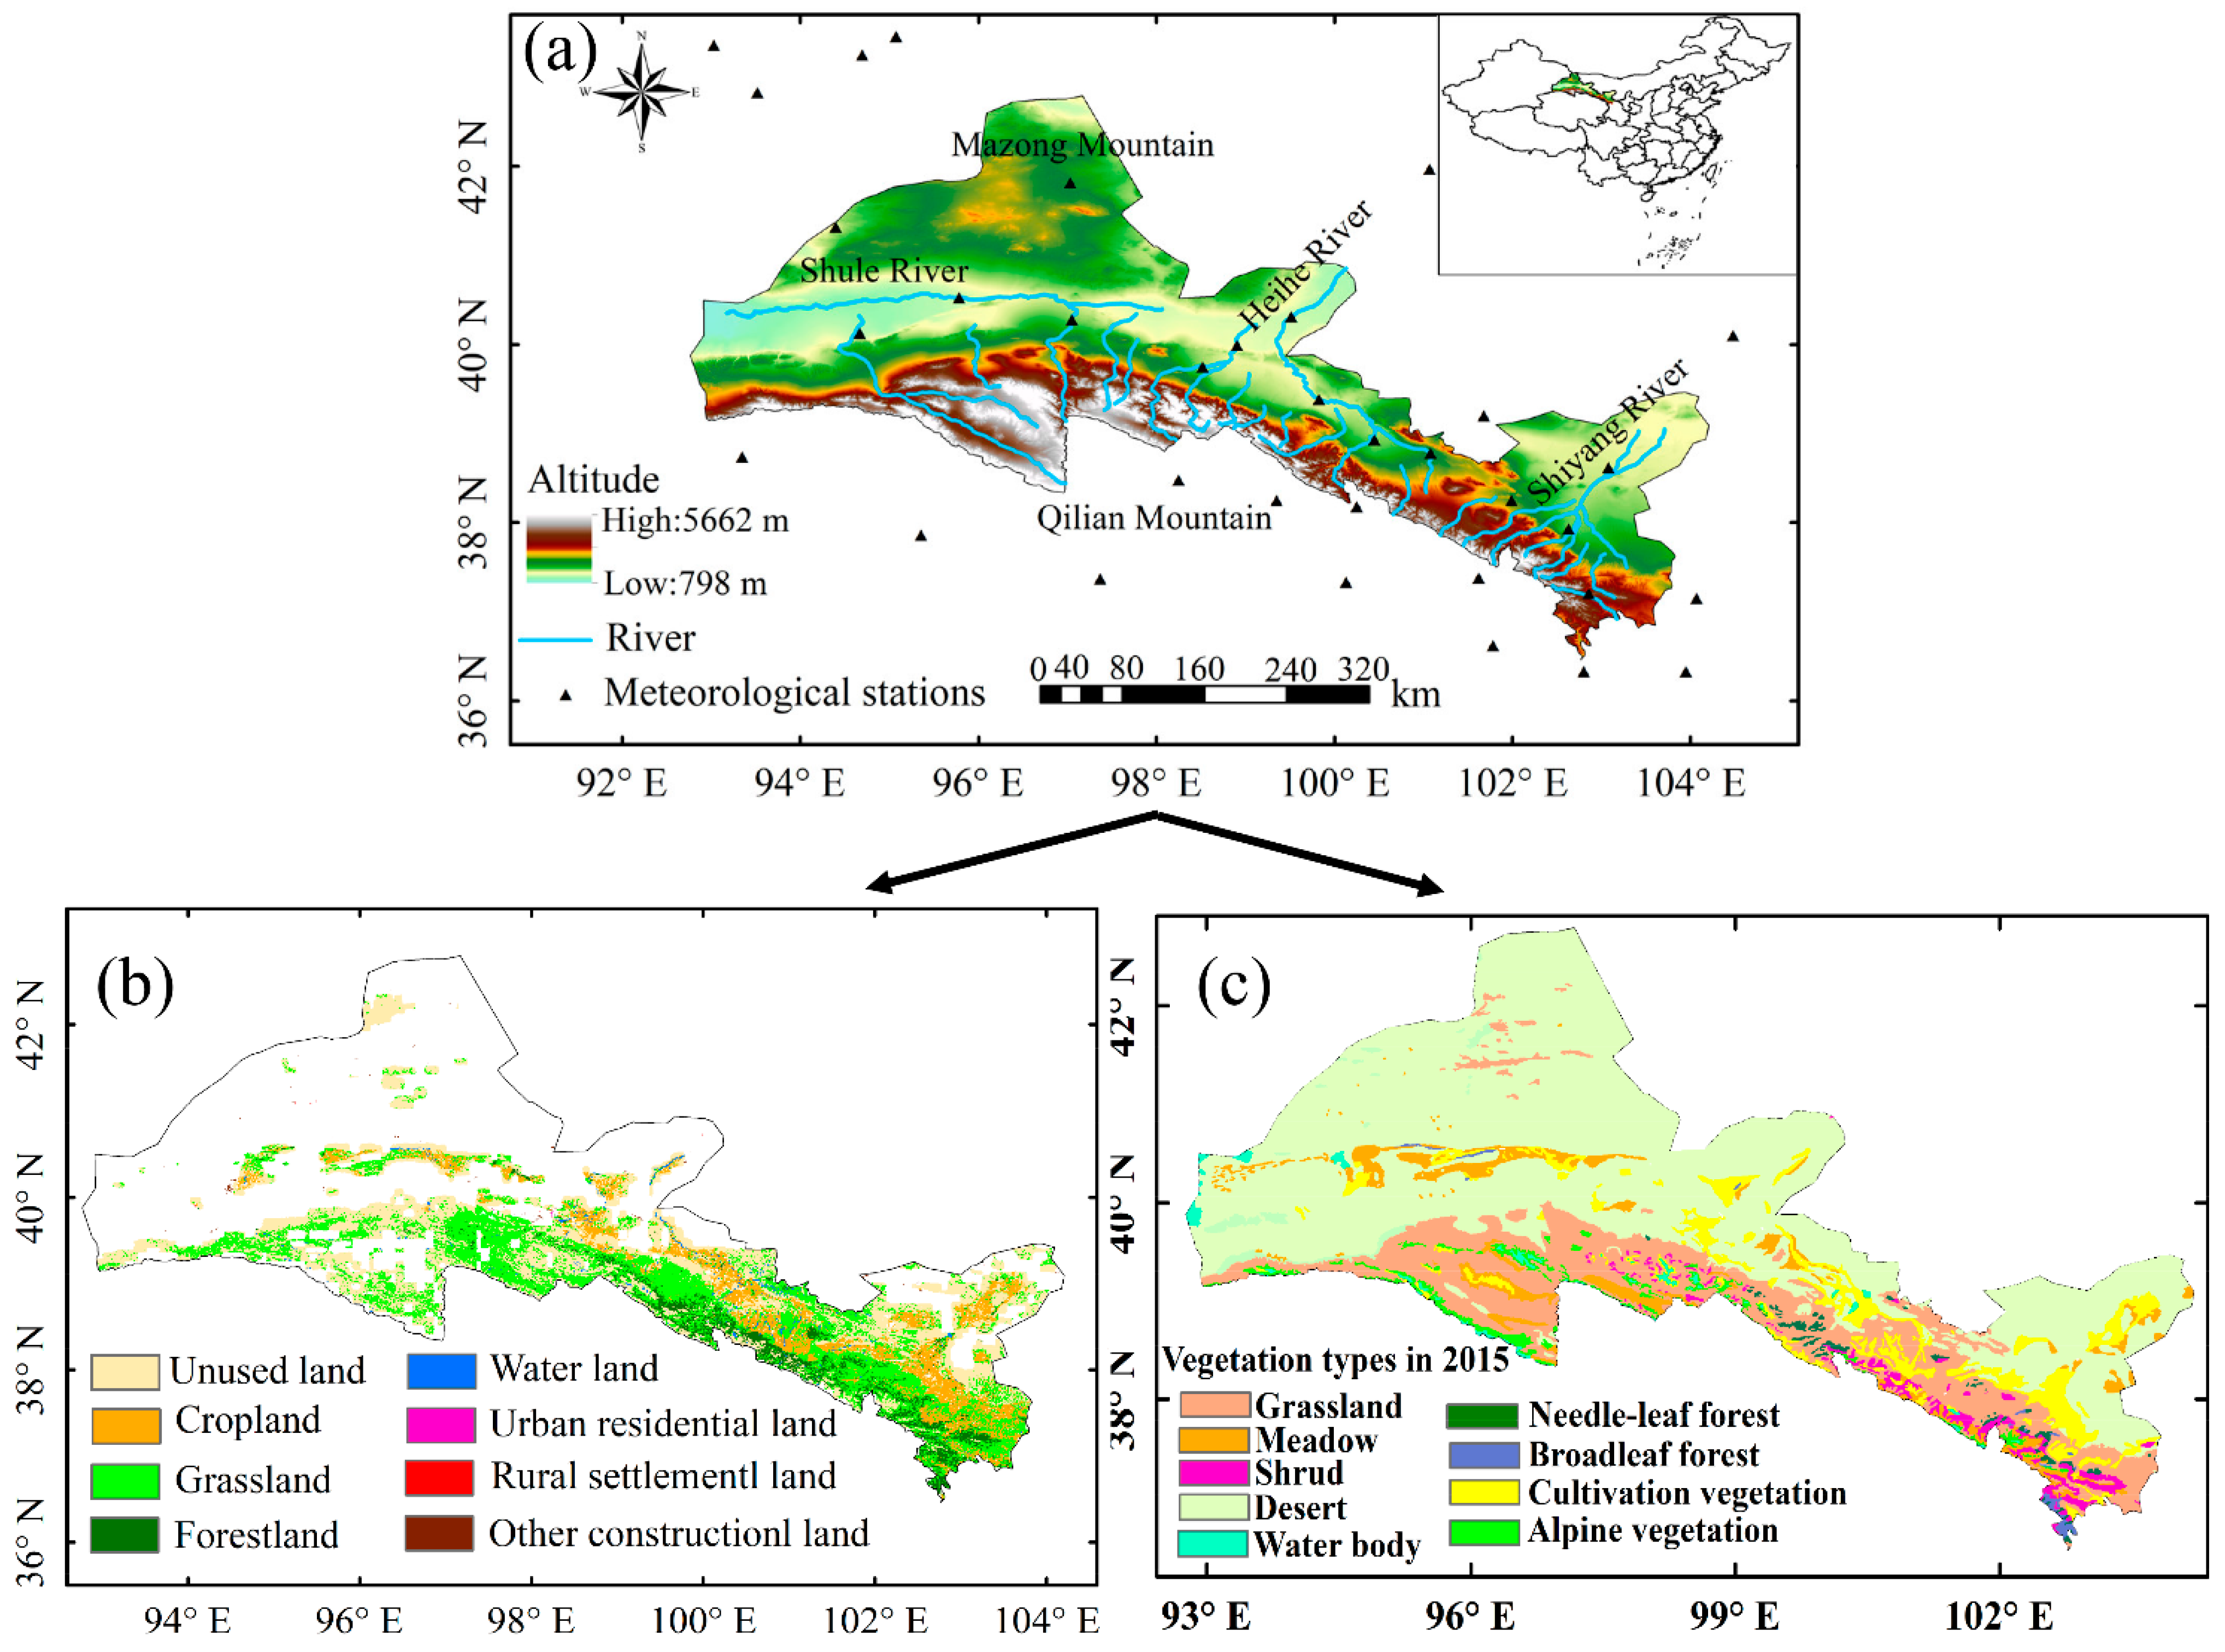
2.1. Research Area

The Hexi region (37° 15′–42° 49′ N, 92° 44′–104° 14′ E) lies west of the Yellow River, from Wushao Mountain in the east to Yumenguan in the west, sandwiched between the Qilian Mountains and the AlxaGaoyuan. The region has an area of about 276,000 km2 and five prefecture-level cities, including Wuwei, Jinchang, Zhangye, Jiuquan, and Jiayuguan (Figure 1a) [76,80]. The Hexi region has a temperate continental climate and consists primarily of temperate arid regions (the eastern and central regions of the Hexi Corridor), warm temperate arid regions (the Dunhuang-Anxi section in the western Hexi Corridor), and alpine semi-arid regions (the southern Qilian Mountains). Affected by the differential structure of landforms and climate conditions, there are significant seasonal differences in meteorological factors in the Hexi region, manifested as sufficient sunlight, insufficient precipitation, high evapotranspiration, drought, and wind. The research area has an annual average total solar radiation of 5500–6400 MJ/m2, a sunshine duration of 2800–3300 h, an annual mean precipitation and temperature of 111 mm and 14.7 °C, respectively [76,80]. In the high-altitude sector of the southern research area, the mountain glaciers have a total area of 1334.75 km2. Precipitation gradually falls from east to west due to the influence of longitudinal zonality, whereas heat gradually increases from east to west.

2.2. Dataset Source and Preprocessing

2.2.1. NDVI Dataset

A Generation of Global Inventory Modeling and Mapping Studies 3rd generation (GIMMS 3g) NDVI dataset with a time resolution of 15 days and a spatial resolution of 1/12° is available on the NASA Earth Exchange platform (http://ecocast.arc.nasa.gov/data/pub/gimms/3g.v1/, accessed on 1 January 2021). Maximum Value Composite (MVC) was utilized in this study to merge GIMMS 3g NDVI data with a 15-day interval into monthly NDVImax data to further minimize the impact of meteorological conditions, residual clouds, and aerosol scattering on NDVI data [83]. The monthly GIMMS 3g NDVI dataset was further integrated into a growth season (April to October) NDVI dataset using the MVC. NDVI pixels with an annual average NDVImax ≤ 0.1 from 1982 to 2015 were considered vegetation-free areas in this study, while vegetation-covered areas were extracted from the research area for further analysis. The growth season NDVI datasets were resampled with a 500 m resolution to obtain the NDVI trends.

2.2.2. Meteorological Dataset

The dataset of precipitation (PRE) and temperature (TEM) interpolation for the 1982–2015 time series was provided by the Resource and Environmental Science Data Center (RESDC) of the Chinese Academy of Sciences (http://www.resdc.cn). A meteorological dataset with a spatial resolution of 0.1° was generated using Australian ANUSPLIN software interpolation. The distribution of meteorological elements is generally related to elevation. A covariable elevation can be introduced into interpolation to improve the accuracy of interpolation. Especially, it has a very good ability to describe the zonal distribution characteristics of meteorological elements. The China meteorological forcing dataset (http://westdc.westgis.ac.cn, accessed on 1 January 2020) is the source of the wind speed (Wind) and total solar radiation (RAD) datasets, both of which have a spatial resolution of 0.1° and a temporal resolution of 3 h. The descending short-wave radiation and long-wave radiation dataset are combined to create the total solar radiation dataset [84].
The daily dataset of potential evapotranspiration was calculated using the Penman-Monteith formula recommended by FAO, which is based on the meteorological data of each meteorological station such as daily maximum temperature, daily minimum temperature, solar radiation, daily average relative humidity, and average wind speed. The daily potential evapotranspiration data set from 1982 to 2015 was integrated into a growth season data set in this paper. Inverse Distance Weighting (IDW) interpolation is a distance-based interpolation method, which assumes that the surrounding points have an effect on the value of the position, and the closer the points are, the greater the effect on the value of the position. The potential evapotranspiration data during growth seasons in the Hexi region was spatially interpolated using IDW to acquire grid data with a spatial resolution of 500 m. The mentioned climate datasets were resampled with a 500 m resolution to obtain significant climate factors that induce changes in vegetation trends.

2.2.3. Auxiliary Data

The digital elevation model (DEM) dataset with a spatial resolution of 30 m was provided by the International Science and Technology Data Mirror Site of the Computer Network Information Center of the Chinese Academy of Sciences (http://www.gscloud.cn, accessed on 1 January 2020). The LUCC data (1:100,000) for 1990, 2000, 2010, and 2015 was obtained from ESDC, as well as vegetation types for 2015.
Land use types are classified into six groups in the LUCC dataset: forestland, grassland, water land, unused land, cropland, and urban and rural residential land. To better describe the land use changes in the Hexi region, this study redivided LUCC into eight categories: (1) cropland; (2) forestland; (3) grassland; (4) water land; (5) urban residential land; (6) rural settlement land; (7) other construction land; and (8) unused land.
To differentiate the impact of climatic and non-climate factors on vegetation patterns, ecological land was defined as forestland, grassland, and water land, whilst non-ecological land was defined as unused land (UL) and cropland [3,85,86]. Meanwhile, this study chose data on urbanization, ecological restoration, and agricultural expansion to reflect the degree of impact of human activities. Urbanization expansion statistics are pixel areas converted from ecological and non-ecological land in 1990 to urban residential land, rural settlement land, and built land in 2015. Ecological restoration statistics are pixel areas converted from cropland and unused land in 1990 to forestland, grassland, and water land in 2015. Agricultural expansion statistics are pixel areas converted from forestland, grassland, water land, and unused land in 1990 to cropland in 2015. Desertification statistics are pixel areas converted from ecological land and cropland in 1990 to unused land in 2015.

3. Methods

3.1. Vegetation Trend Analysis

Theil-Sen Median analysis and Mann-Kendall non-parametric statistics were employed in this study to detect the temporal fluctuation of vegetation trends. To better evaluate vegetation growth, this study divides slopes into six levels: extremely significant decrease (slope < 0, p ≤ 0.001), extremely significant increase (slope > 0, p ≤ 0.001), slight decrease (slope < 0, p > 0.05), slight increase (slope > 0, p > 0.05), significant decrease (slope < 0, 0.001 < p ≤ 0.05) and significant increase (slope > 0, 0.001 < p ≤ 0.05).

3.2. Improved Residual Trend Method for Calculating HNDVI

The residual trend analysis method is frequently used to differentiate the effects of climate change and human activities on vegetation greenness, as well as the role of human activities on greening trends [66,69,87,88,89,90]. Given the assumption of a strong correlation between NDVI and climate factors, the contribution of human activities on NDVI trends can be determined considering the influence of climate change on NDVI trends. Previous studies have mostly used single factors (such as precipitation) or precipitation-temperature to establish linear regression analysis models to predict NDVI values under the impact of climate factors [66,69,80,87,88,89,90]. However, the climate variables that affect vegetation greenness are not limited to precipitation or temperature. Relying solely on a single factor to model the impact of climate change on vegetation trends is one-sided and cannot objectively simulate the contribution of climate change to vegetation trends [87,88,89]. Additionally, the distribution of different geographical regions is accompanied by different climate zones, which have major differences in the climate factors driving NDVI trends [16,27,76]. Therefore, the influence of climate change on NDVI trends cannot be reasonably and correctly presented using the residuals from the NDVI values determined by climate change, which are obtained through a linear regression model based on a single precipitation variable. This will lead to bias in quantifying the influence of human activities on vegetation trends. This study used the Geographically and Temporally Weighted Regression (GTWR) model that includes additional climate factors that significantly affect vegetation growth to generate NDVI prediction values impacted by climate change [76]. The improvements of the residual trend method are the following: first, it can simulate the influence of climate change on NDVI more comprehensively using the GTWR model, which can tackle the imbalance problem of climate-driven mechanisms from a temporal dimension. Second, in addition to the key factors of vegetation growth (precipitation and temperature), this study included potential impact factors such as average wind speed, potential evapotranspiration and total solar radiation. For more information on the GTWR, refer to Yang et al. [76]. The specific procedures are as follows:
(1)
A collinearity analysis was conducted on NDVI data and meteorological data during 1982–2015 based on the variance inflation factor (VIF). By using the climate factors with significant effects, the GTWR model was applied to simulate the predicted NDVI values (PNDVI) of multiple climate factors on vegetation.
(2)
The residual, also known as human-induced NDVI (HNDVI), was obtained by calculating the difference between the actual observed ANDVI value and the predicted PNDVI value of the model.
(3)
The least squares regression trend analysis method was performed on the HNDVI of the obtained time series. These HNDVI trends can be considered as vegetation greenness changes unrelated to climate change. If HNDVI > 0, it indicates that NDVI greening trends are induced by positive human activities; if HNDVI < 0, it indicates that NDVI browning trends are affected by human activities; if HNDVI = 0, it indicates that human activities have no significant effect on NDVI trends.
(4)
An F-test with a 95% confidence interval was conducted for HNDVI results. If HNDVI significantly increases, it indicates that a significant increase is induced by human activities in NDVI trends; if HNDVI significantly decreases, it indicates that a significant decrease is induced by human activities in vegetation greenness.

3.3. Disentangling Climatic and Anthropogenic Activities Contributions

In order to differentiate the contributions of climate change and human activities to vegetation greenness at different periods, this study took the year 2000 as a node to spatially map the driving forces of significant changes in greening trends at the pixel scale. This study was divided into three research periods (1982–2015, 1982–1999 and 2000–2015) to recognize significant changes in NDVI trends, significant response relationships between vegetation and multiple climate factors, and significant changes in HNDVI trends. To further clarify the driving factors that cause changes in vegetation trends, six scenarios were proposed in this study: (1) significant vegetation greening driven by climate change. The HNDVI trend is a pixel with no discernible change. (2) Significant vegetation greening driven by human activities. The HNDVI trend is a pixel with a significant increase. (3) Significant vegetation greening driven by both climate change and human activities. The HNDVI trend is a pixel with a significant increase. (4) Significant vegetation browning driven by climate change. The HNDVI trend is a pixel with no discernible change. (5) Significant vegetation browning driven by human factors, implying a significant decrease in vegetation trend and an indistinctive negative relationship between NDVI and climate factors. The HNDVI trend is a pixel with a significant decrease. (6) Significant vegetation browning driven by both climate change and human factors. The HNDVI trend is a pixel with a significant decrease.

3.4. Impact of Land Management Measures on Vegetation Trends

In this study, the LUCC (1982–2015, 1982–1999, and 2000–2015) maps of the starting and ending years were chosen for the superposition and intersection analysis to establish a transition matrix. The spatiotemporal pattern of land use transfer induced by human activities can be determined through land use classification transfer between the two time nodes, with the quantity and direction of land use change being counted. This study divides the types of land cover transfer during the periods of 1990–2015, 1990–2000, and 2000–2015 into four categories: urbanization, agricultural expansion, desertification, and ecological restoration, so as to quantify the contribution of human activities on NDVI trends over different periods. Specifically, the pixel area of urbanization is defined as the total number of pixels converted from other land use types to urban and rural, industrial and mining, and residential land. The pixel area of agricultural expansion is defined as the total number of pixels converted from other land use types to cropland. The pixel area of desertification is defined as the total number of pixels converted from other land use types to unused land. The pixel area of ecological restoration is defined as the total number of pixels converted from non-ecological land to ecological land. Table 1 depicts the distinction between ecological and non-ecological land based on the classification principle of ecological and non-ecological land conducted by Li et al. [3] and Shao et al. [85].

4. Results

4.1. The NDVI and HNDVI Trends in the Hexi Region

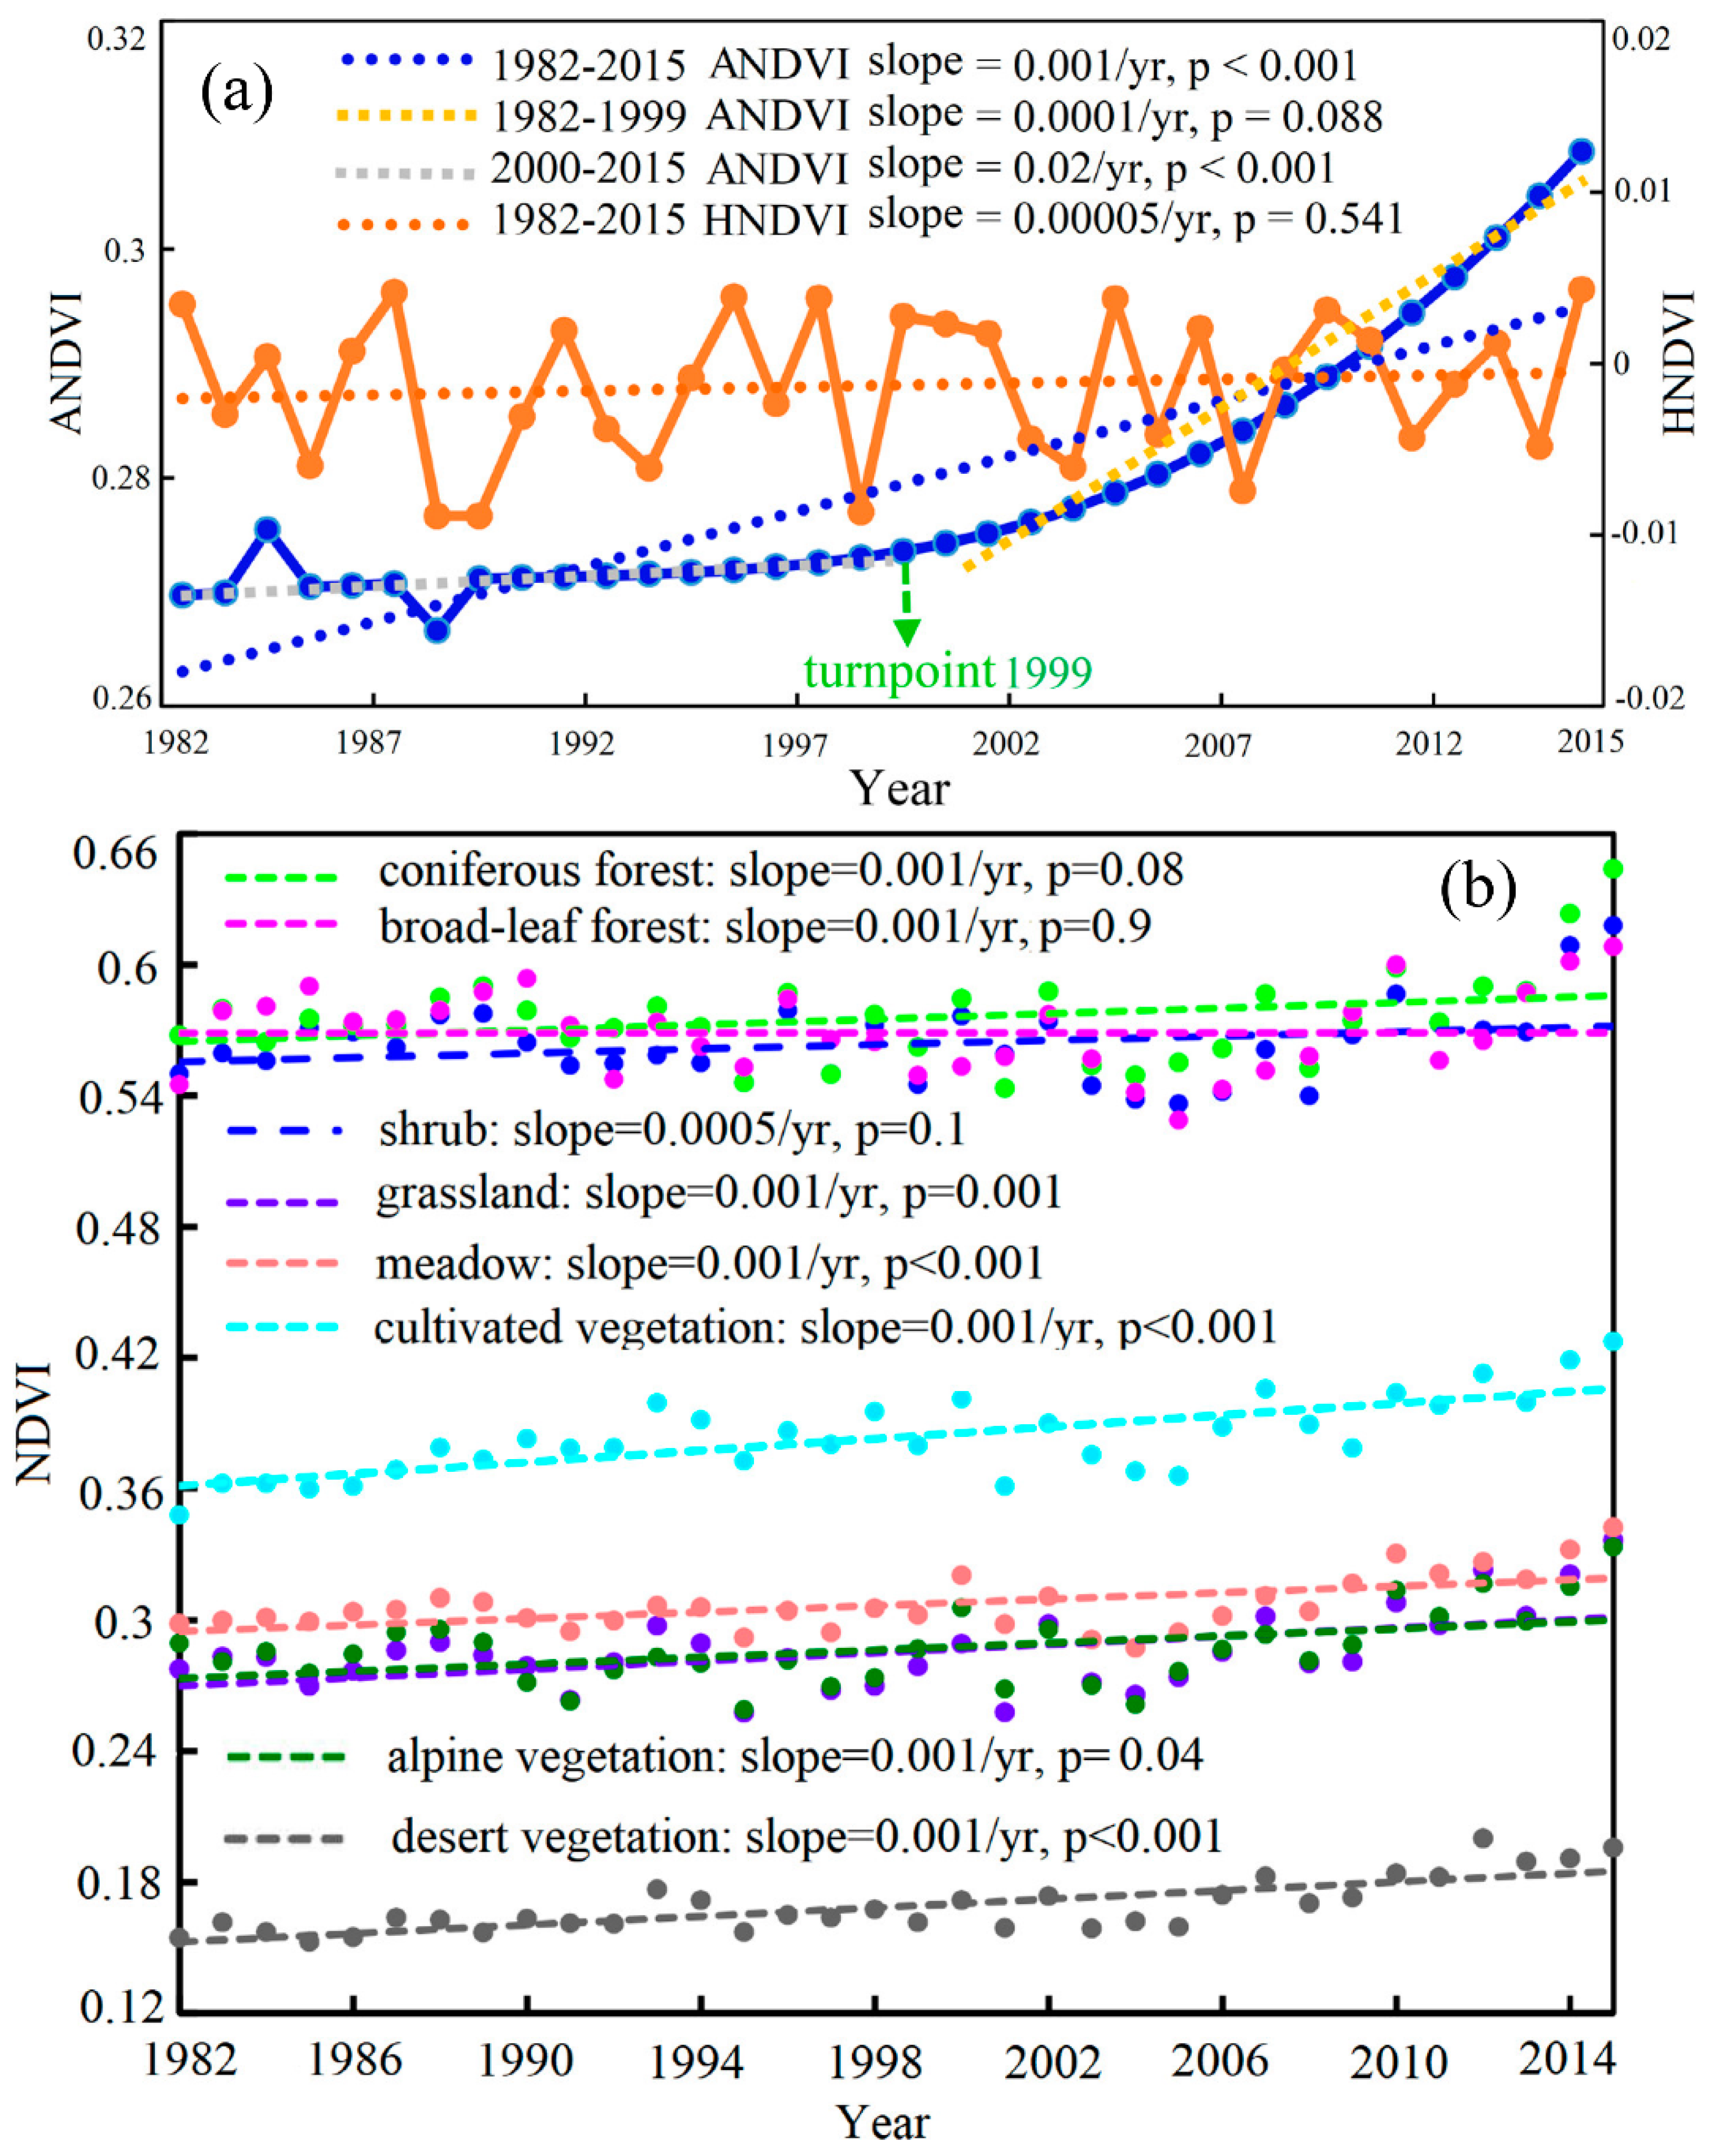
4.1.1. The Interannual Change Pattern

From 1982 to 2015, the ANDVI in the Hexi region increased significantly (0.001/yr, p < 0.001) during the growing season, and the interannual change in ANDVI for different vegetation cover types showed an increasing trend (Figure 2a). The interannual change in coniferous forests (0.001/yr, p = 0.08) was greater than that in shrubs and broad-leaved forests across the entire study period (Figure 2b). Shrubs experienced an extremely steady rise, about 0.0005 per year (Figure 2b). In contrast, the NDVI of cultivated vegetation, meadow, grassland, and desert vegetation has shown a highly significant growth tendency (both are 0.001/yr, p < 0.001) in the last 34 years (Figure 2b). In terms of alpine vegetation, the interannual trend of NDVI was growing at a rate of 0.001 per year during the period. The study revealed a significant mutation in the ANDVI trend in 1999 (Figure 2a). ANDVI grew modestly at a rate of 0.0001/yr (p = 0.09) between 1982 and 1999, then rose rapidly at a rate of 0.02 per year (p < 0.001) between 2000 and 2015 (Figure 2a). Overall, the HNDVI of the Hexi region has shown a consistent rising trend over the last 34 years, yet with considerable interannual oscillations, and underwent significant mutations between 1988 and 1999 (Figure 2a).

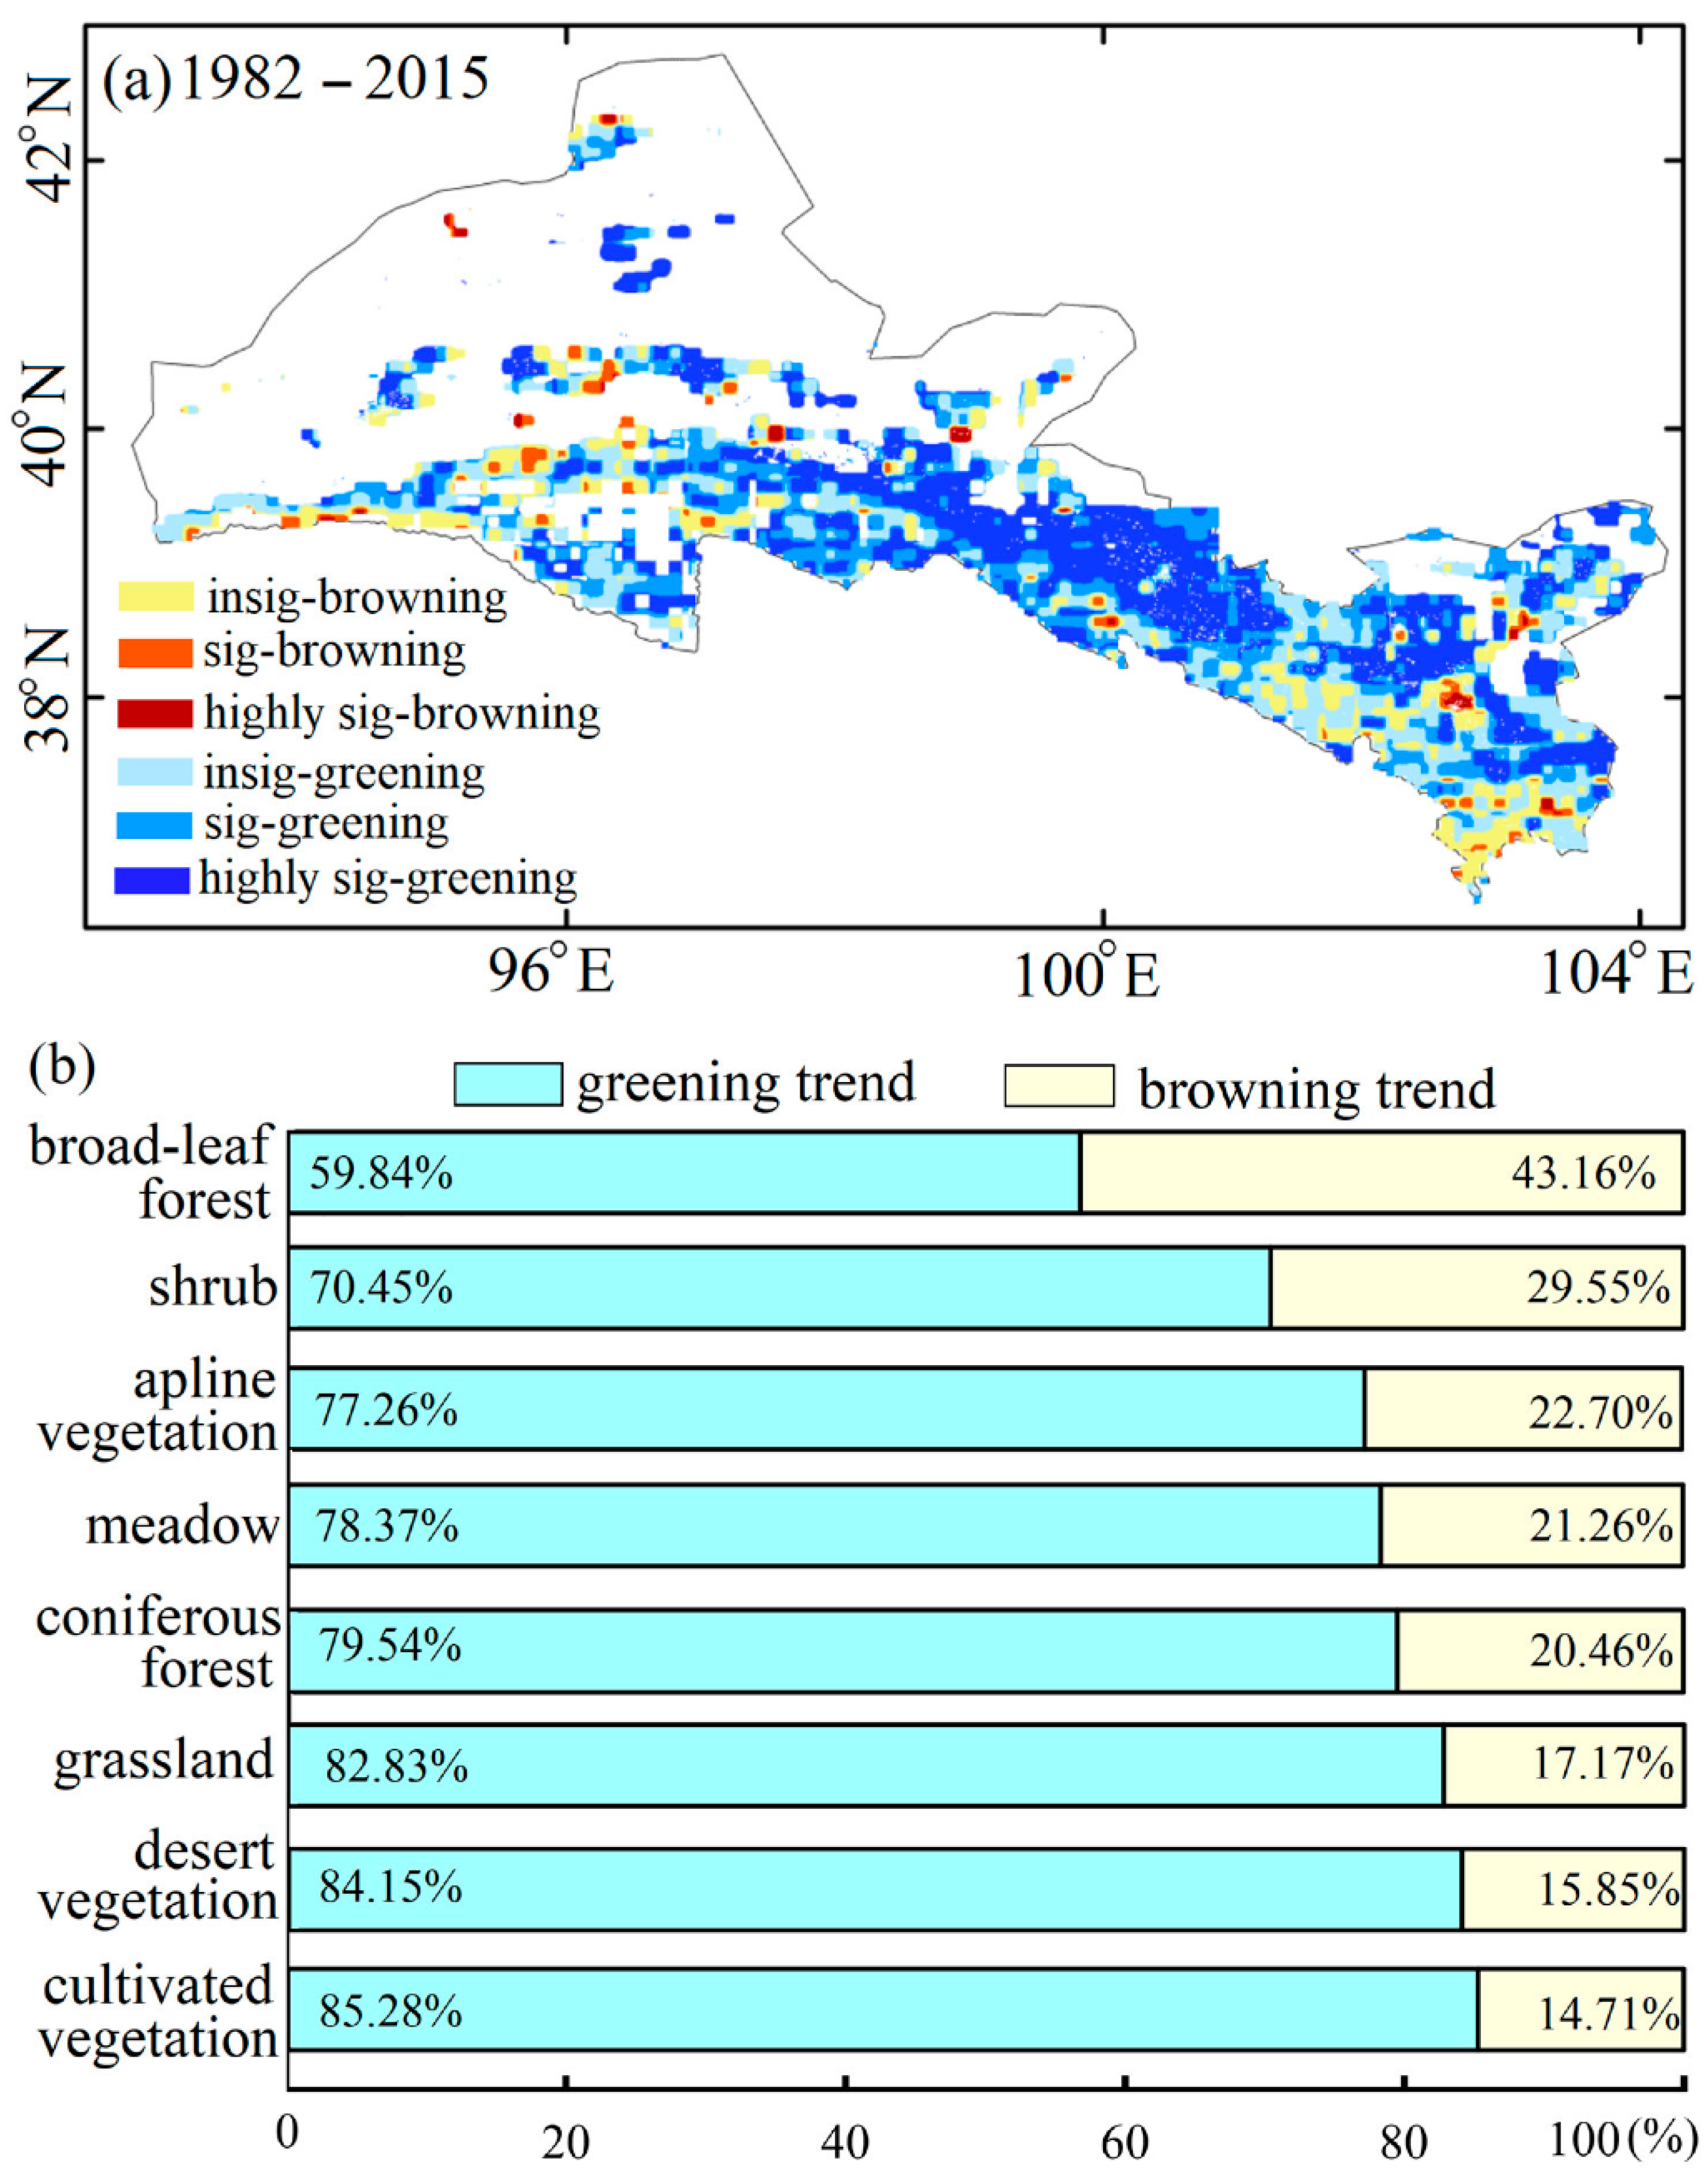
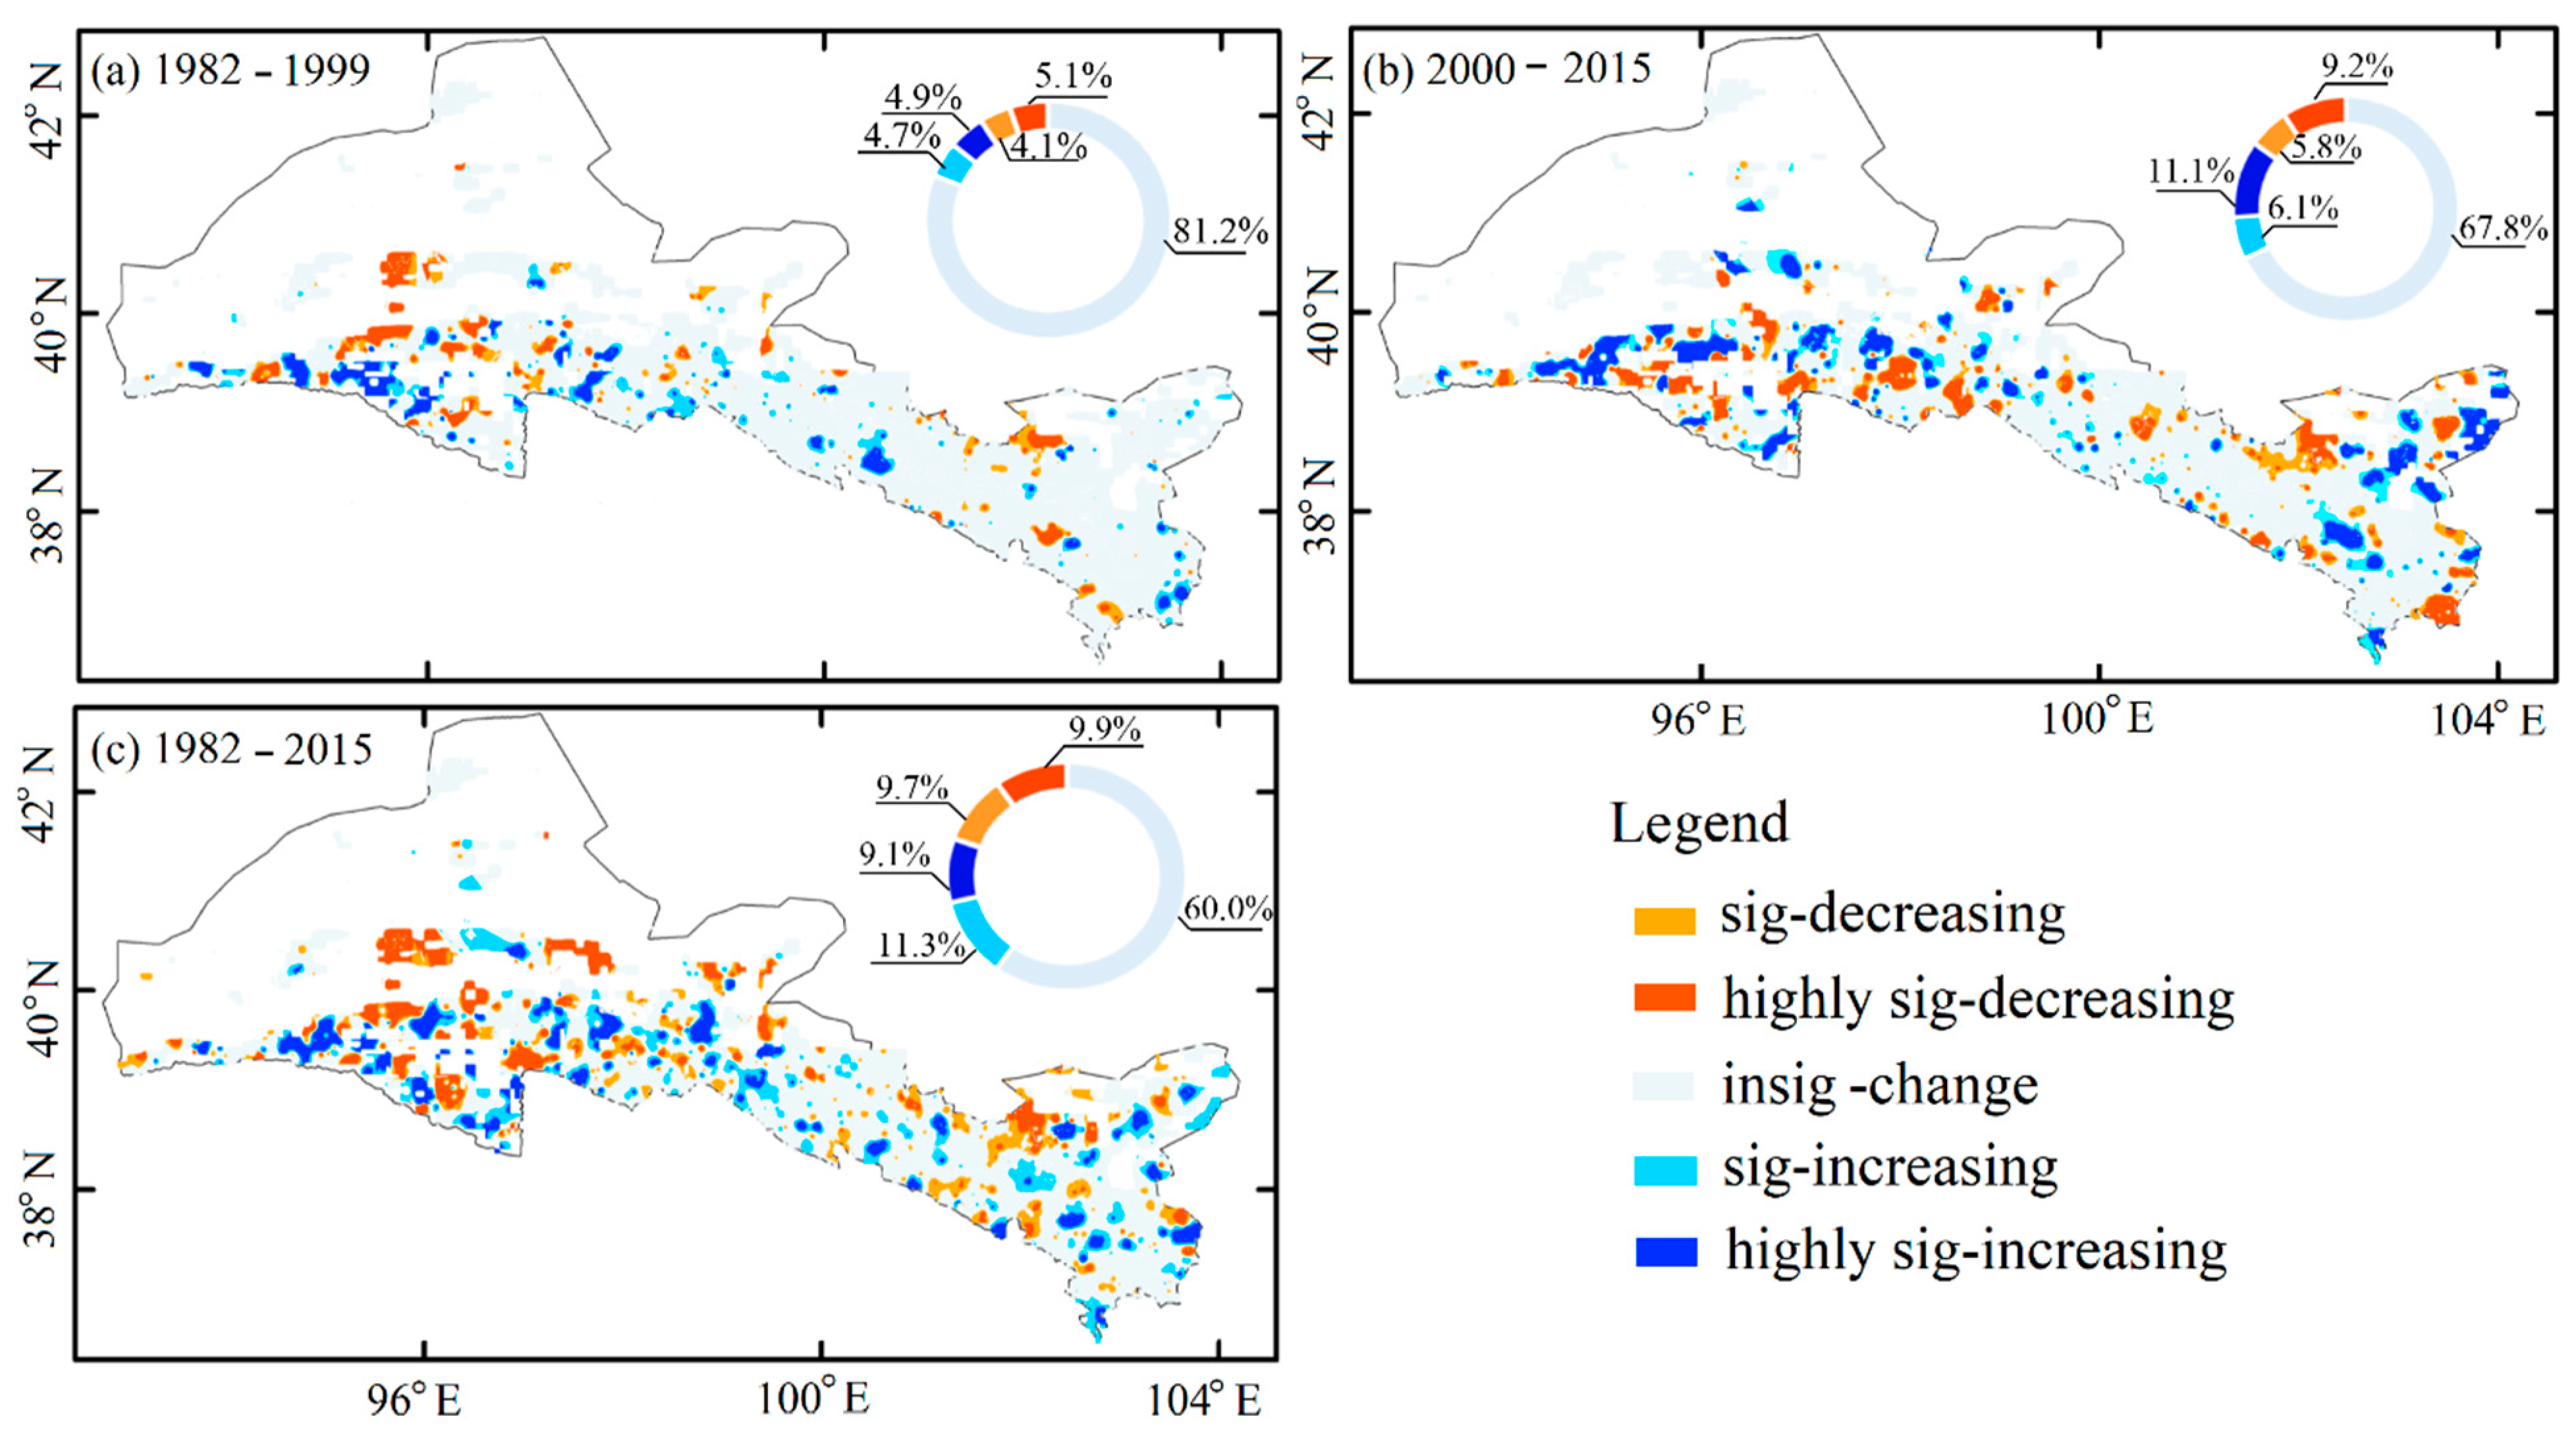
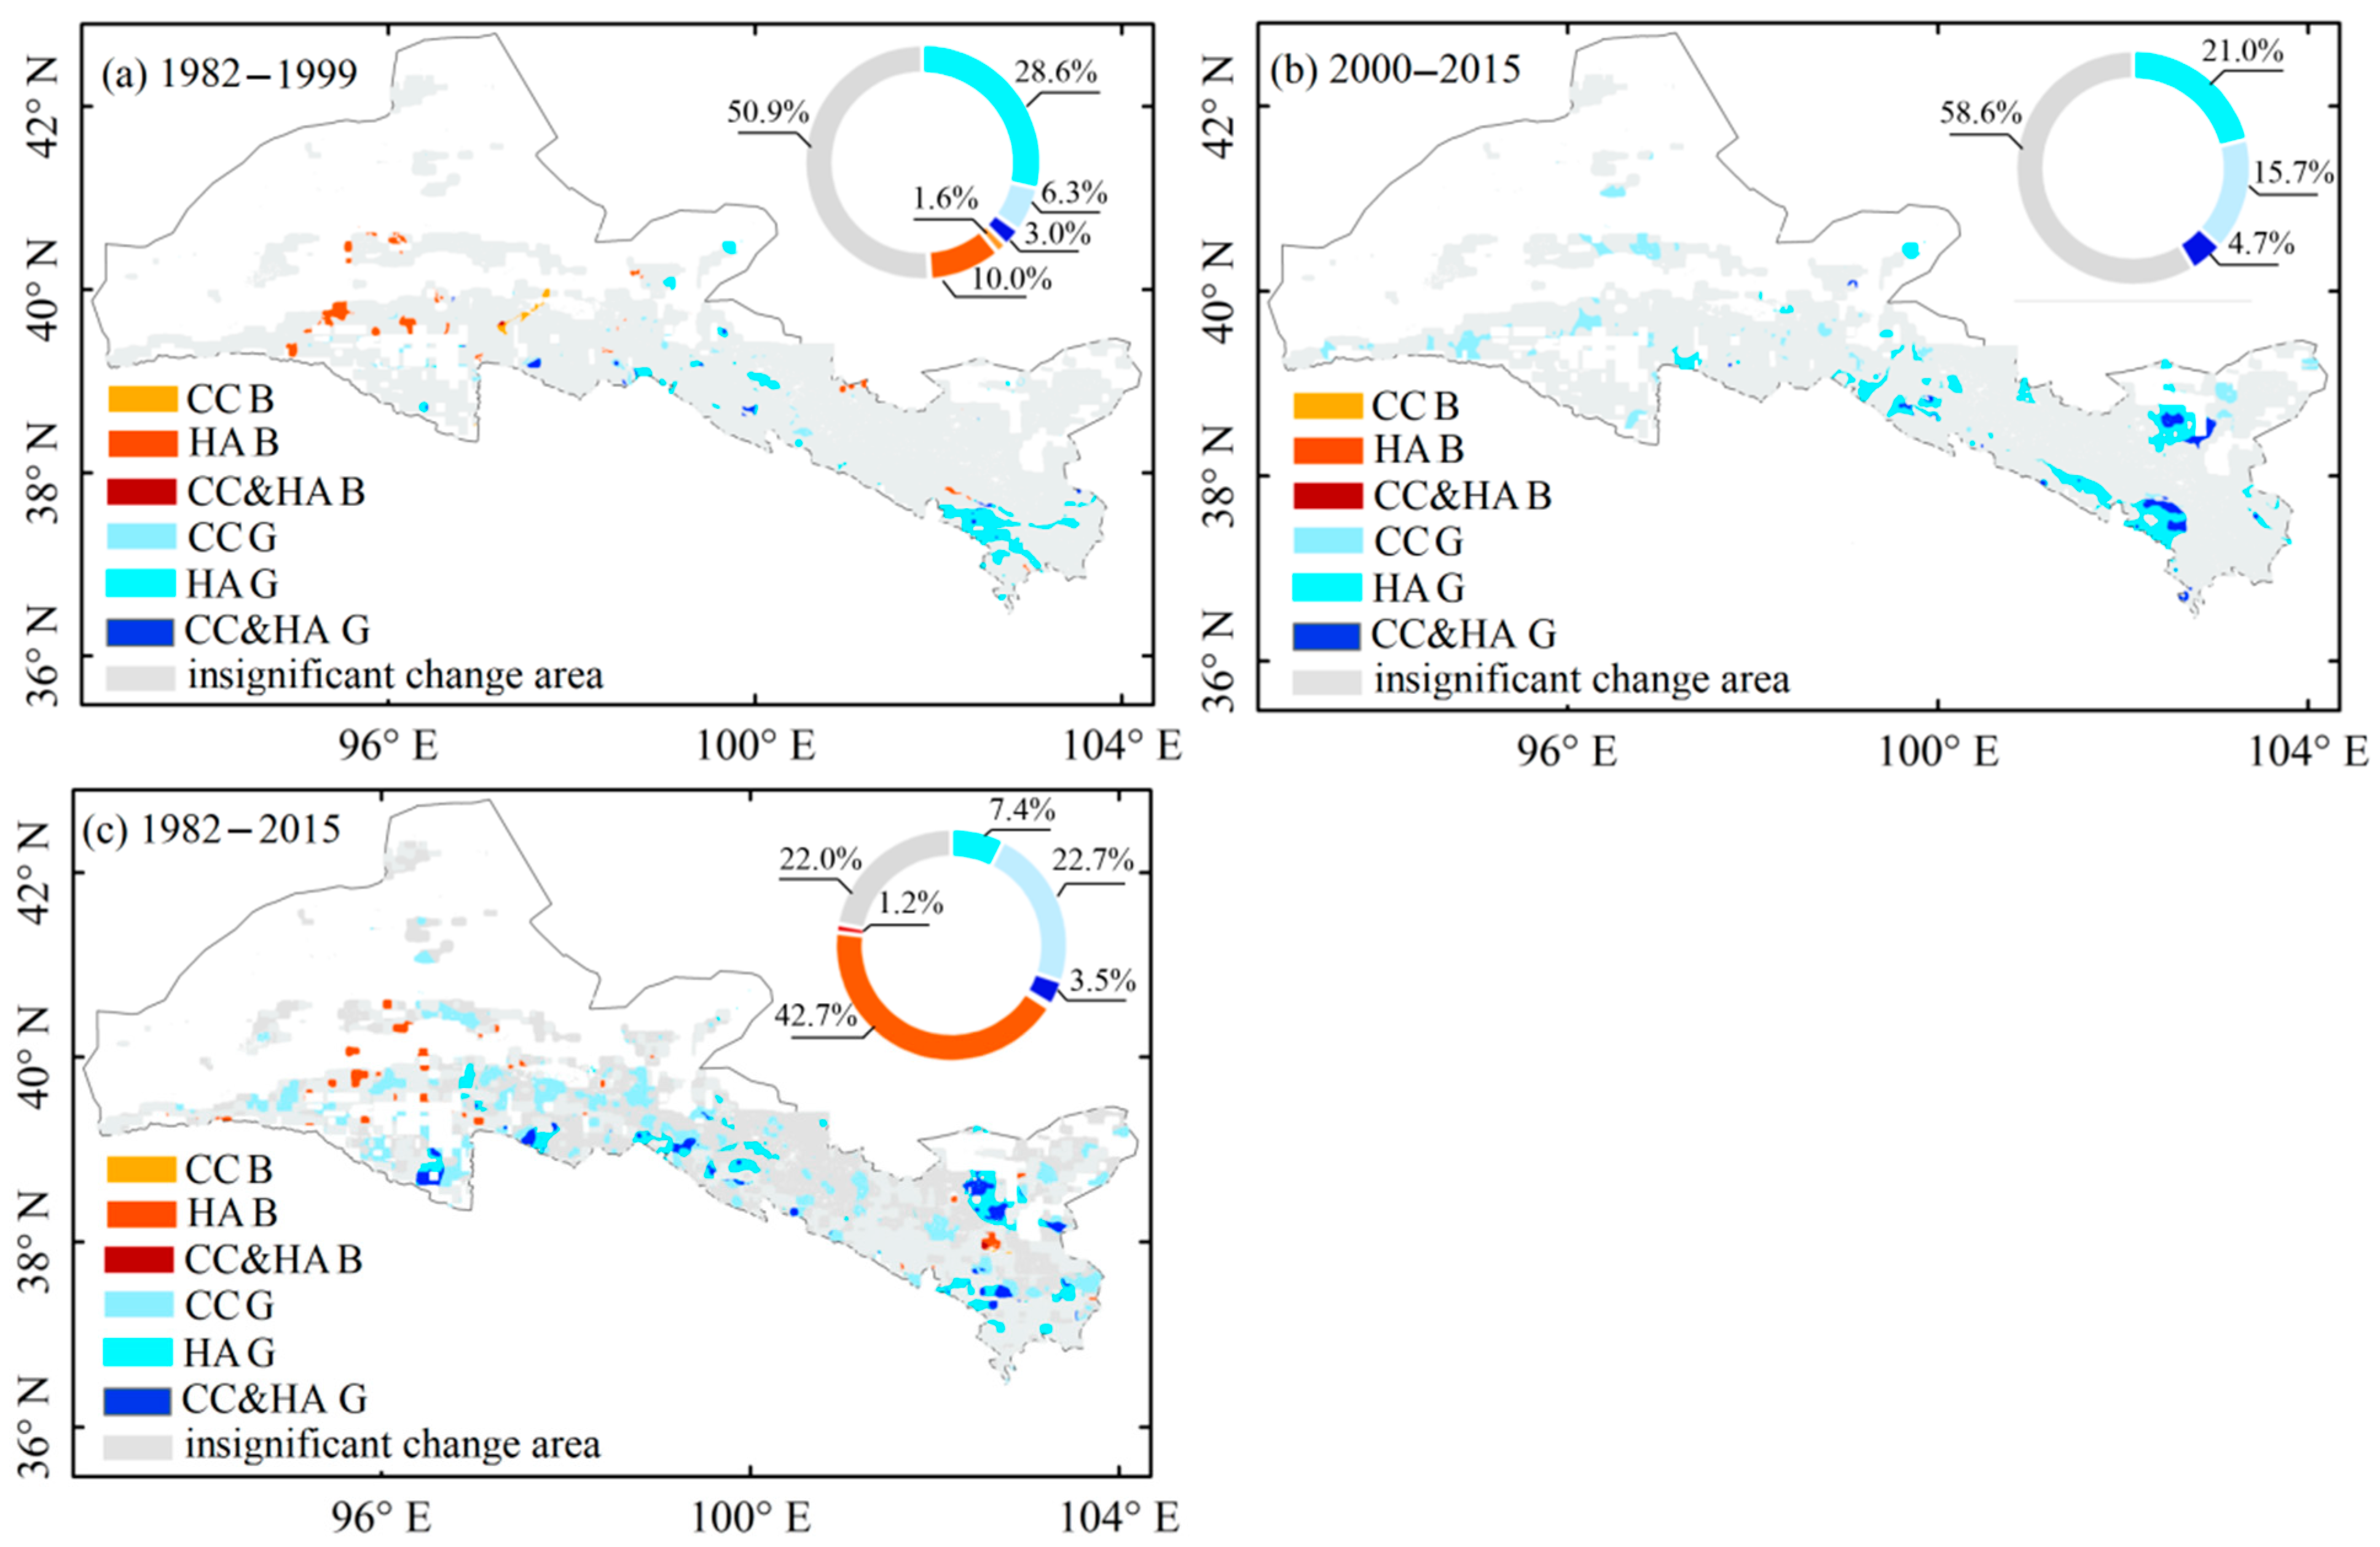
4.1.2. Spatial Patterns of NDVI and HNDVI from 1982 to 2015

The trend of ANDVI shows a significant spatial heterogeneity pattern throughout the entire research area (Figure 3). Greening (oasis area in the middle of the research area) and browning (Wushao Mountains and part of western Qilian Mountains) trends were statistically significant in 56.9% and 3.5% of the pixels in the research area, respectively (Figure 1a and Figure 3a). Notably, the browning trend of vegetation cover type in high-altitude locations has increased, while there is a bigger share of vegetation greening in oasis areas (Figure 3a). Browning was responsible for 43.2% and 30.0% of the NDVI trends in broad-leaved woods and shrubs, respectively (Figure 3b). Greening trends are most prevalent in cultivated and desert vegetation, with browning trends accounting for just 14.7% and 15.9%, respectively (Figure 3b). Meadow, alpine vegetation, grassland and coniferous forest vegetation show similar contributions to NDVI greening and browning during the last 34 years (Figure 3b).
Based on the improved residual trend analysis method, this study calculated the trend changes in HNDVI over 1982–1999, 2000–2015, and 1982–2015, three periods to clarify the impact of human activities dominated by land use change on vegetation greenness during different periods. The proportion of HNDVI that showed a significant increasing trend was 9.60% between 1982 and 1999, which was mainly distributed in the alpine grassland in the western part of the Qilian Mountains and the central oasis area (Figure 1 and Figure 4a). From 2000 to 2015, the HNDVI trend showed a polarized distribution. The proportion of areas with significant increase climbed to twice the level before 2000, reaching 17.16% (Figure 4a). Among them, the proportion of significant and extremely significant increases was 6.05% and 11.11%, respectively (Figure 4a). Notably, taking 2000 as a node year, the HNDVI changed from a significant decrease trend to a significant increase trend in the Aksai area of the western Qilian Mountains, and changed from an insignificant change to a substantial increase trend in the Minqin and Wuwei oasis areas (Figure 1 and Figure 4a). However, the study revealed that, compared with 1999, the significant and extremely significant decrease trends of HNDVI in Subei and Sunan Autonomous County, Jinchang Oasis, and some areas of Wushao Mountain tended to expand from 2000 to 2015 (Figure 1 and Figure 4a).
The significant increase and decrease trends of HNDVI between 1982 and 2015 accounted for 20.36% and 19.61%, respectively (Figure 4c). To be more specific, the significant and extremely significant increase trends were 11.25% and 9.12%, respectively, which were mostly observed in the alpine grassland in the western section of the Qilian Mountains and the middle oasis cropland (Figure 1 and Figure 4c). The significant and extremely significant decrease trends of HNDVI (accounting for 9.73% and 9.88%, respectively) were distributed in the western part of the research area, including Subei and Sunan Autonomous County, Guazhou, Yumen, and Jinchang Oasis (Figure 1 and Figure 4c). Regions with negligible changes in HNDVI trends (i.e., mostly influenced by climate change) accounted for up to 60.02% of the total (Figure 4c).

4.2. Contribution of Driving Forces for Vegetation Trend Evolution

Three research periods (1982–1999, 2000–2015, and 1982–2015) are set in this study to reflect the spatiotemporal impact of climate change, human activities, and their coupling on NDVI trends in the Hexi region. Based on this, this study reveals the contributions of climate change and human activities to significant changes in vegetation greenness at different pixel scales.
Climate change was the main driving force behind vegetation greening in the Hexi region from 1982 to 1999 (Figure 5a). As the main impact factor, climate change had a contribution rate of 28.6% in 11.4% of the areas with significant vegetation greening, mainly distributed in Wushao Mountain in the eastern part of the Qilian Mountain and Zhangye Oasis (Figure 1 and Figure 5a). The areas with significant vegetation greening driven by human factors had a proportion of 6.3%, scattered in the Zhangye Oasis (Figure 1 and Figure 5a). The areas with significant vegetation greening driven by the coupling of human factors and climate factors had a proportion of 2.6% (Figure 5a). Additionally, human factors had the most negative impact in 13.8% of the areas with significant vegetation browning, primarily located in Subei Mongol Autonomous County in the western part of the Qilian Mountains (Figure 1 and Figure 5a). The contribution driven by climate factors was 1.6%, and the coupling of the two drove significant vegetation browning, accounting for only 0.2% (Figure 5a).
The significant greening trend of vegetation in the Hexi region from 2000 to 2015 doubled as compared to 1982 to 1999. Among them, the contribution of climate factors was 21.0% (mainly located in parts of the eastern Qilian Mountains and Minqin Oasis), 15.7% was driven by human factors, and 4.7% was driven by the coupling of climate and human factors (Figure 5b). Compared to 1982 to 1999, the proportion of significant vegetation browning from 2000 to 2015 approached zero. This further indicates that the vegetation greenness in the Hexi region has shown an overall increasing trend since 2000, owing to the positive impact of climate and human activities.
From 1982 to 2015, in 56.9% of the areas with significant vegetation greening in the Hexi region, the contribution driven by climate factors was 7.4%, while the contribution driven by human factors was as high as 22.7%. The coupling effect of climate and human factors accounted for only 3.5% (Figure 5c). The areas with significant vegetation greening driven by climate change are scattered in the oasis in the middle of the research area and the western part of the Qilian Mountains (Figure 1 and Figure 5c). The areas with significant vegetation greening driven by human factors are mainly located in Wushao Mountain, parts of the eastern Qilian Mountains, the central part, and Minqin Oasis. The areas with significant vegetation greening driven by both climate change and human factors are mainly located in the western section of the Qilian Mountains, including Subei Mongol Autonomous County, Sunan Yugur Autonomous County, Tianzhu Zangzu Autonomous County, and Minqin Oasis. Between 1982 and 2015, the negative impact of human factors contributed the most to 3.5% of the areas with significant oasis vegetation browning in the Hexi region, mainly located in the Wuwei oasis under overloaded development (Figure 1 and Figure 5c).

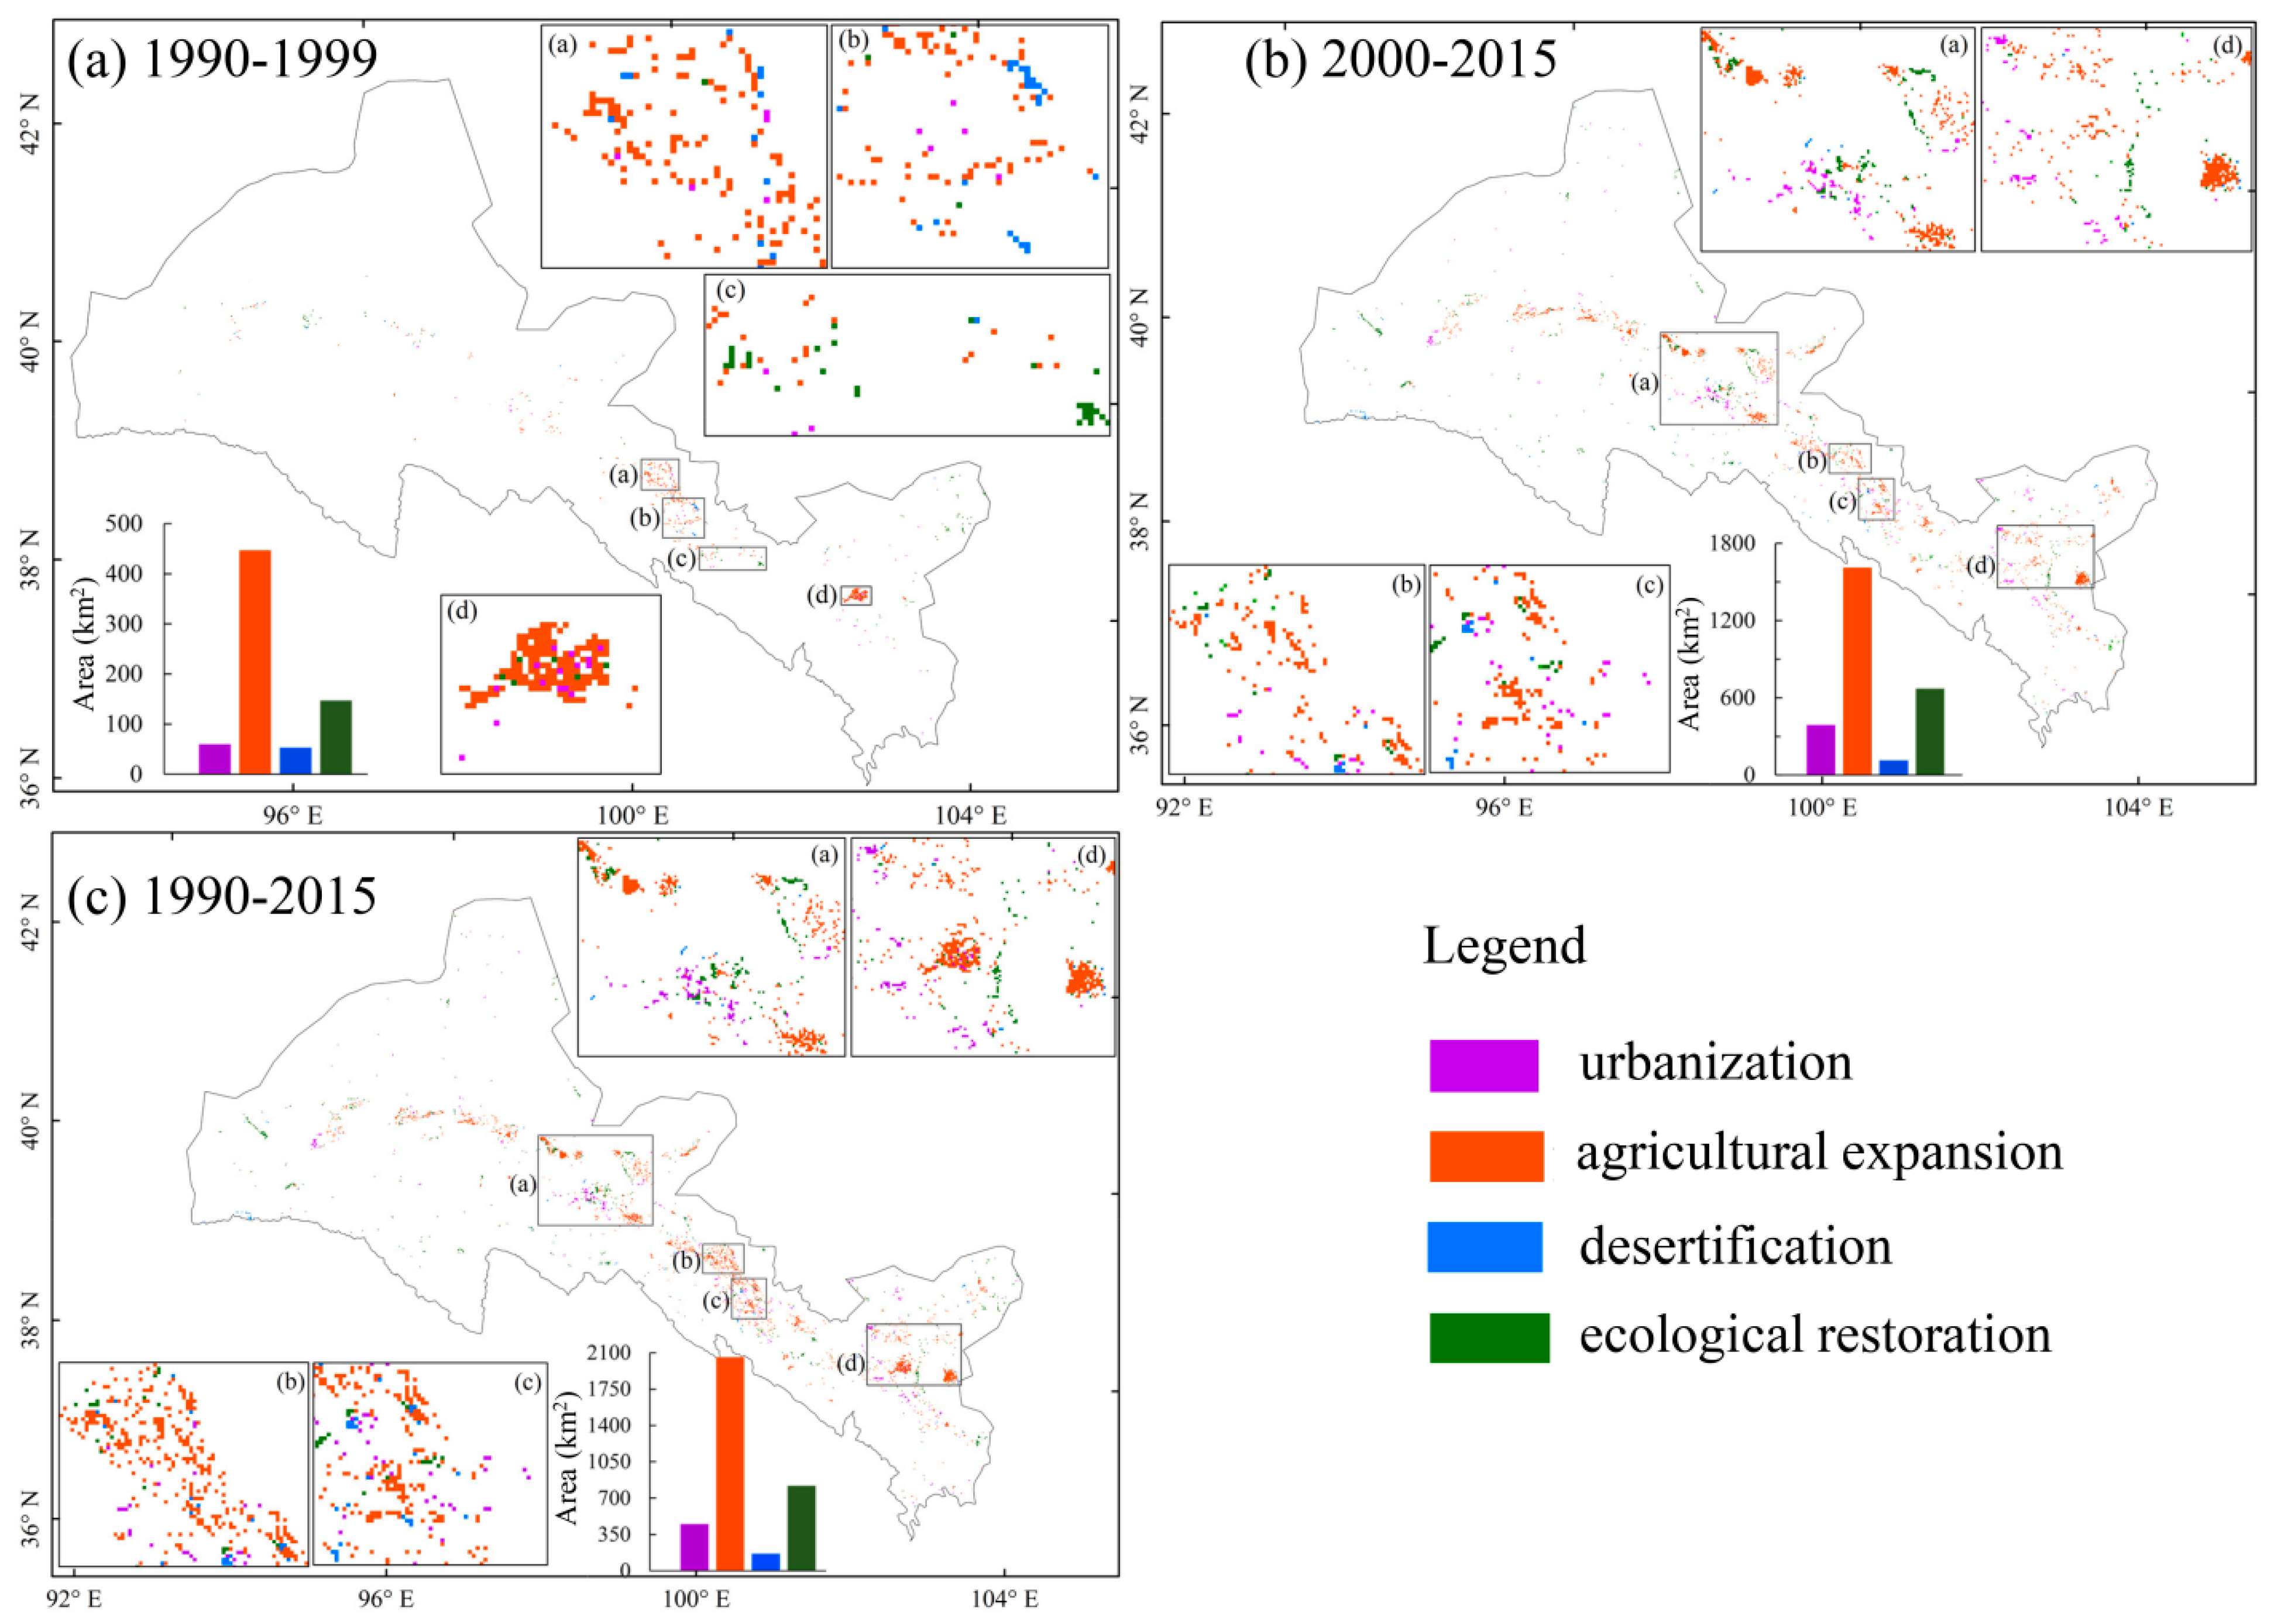
4.3. Impact of Land Use Change on Vegetation Greenness

4.3.1. Land Use Change

As a direct impact factor for vegetation greenness, land use management must be further modified and investigated. Based on the land use data in the Hexi region from 1990 to 2015, this study classified human activities into three categories: urbanization, agricultural expansion, and ecological restoration projects.
From 1990 to 2000, the intensity of land use transfer in the central part of the study area was relatively low (Figure 6a and Table A1). The pixel area of human-induced urbanization reached 60 km2. Locations such as Linze County, Zhangye City, and the oasis area of Wuwei City underwent over-urbanization (Figure 1 and Figure 6a). Desertification (ecological land and cropland were converted into unused land) had a pixel area of up to 53 km2, which mainly occurred near Linze County and Zhangye in the research area (Figure 1 and Figure 6a). The pixel area of cropland expansion (converted from other land use types) accounted for the largest proportion (477 km2), which occurred in a large range around Linze County, Zhangye City, and Weiwu Oasis in the middle of the research area (Figure 1 and Figure 6a). The pixels of ecological restoration caused by the transfer of non-ecological land to ecological land were mainly concentrated in the oasis area of Anxi County and Minle County in the northwest of the research area (Figure 1 and Figure 6a).
During the period from 2000 to 2015, the intensity of land use transfer increased significantly compared to that before 2000 (Table A2). With the rapid urbanization and the implementation of national ecological restoration projects since 2000, the spatial pattern and expansion intensity of land use transfer have undergone substantial changes (Figure 6a,b and Table A2). Specifically, because of urbanization hastened by population growth, the pixel area after 2000 accounted for 6.5 times the transfer area between 1990 and 2000, primarily dispersed in Dunhuang, Jiayuguan, Jiuquan, Zhangye, and Minqin Oasis. Cropland expansion and ecological restoration had the largest expansion intensity, with 1134 km2 and 525 km2 higher than the transfer area before 2000, respectively (Figure 1 and Figure 6a,b). The pixel area of desertification was the smallest (113 km2), scattered in the central oasis areas of Jiuquan, Zhangye, and Minqin in the research area (Figure 1 and Figure 6b). The degree of desertification extension was relatively low in comparison to the large-scale land use expansion caused by land management measures driven by human activities from 1990 to 2000, indicating that the implementation of ecological restoration projects since 2000 has effectively controlled the expansion speed of desertification.
The spatial distribution of land use transition between 1990 and 2015 was largely consistent with that between 2000 and 2015 (Figure 6b,c). However, the size and intensity of land use transition between 1990 and 2015 were larger and more densely dispersed than between 2000 and 2015 and (Table A2 and Table A3). The agricultural expansion area of Wuwei Oasis in the eastern part of the research area has greatly risen, with an increase of 425 km2 compared to that between 2000 and 2015. Overall, the areas of urbanization, agriculture expansion, desertification, and ecological restoration in the Hexi region from 1990 to 2015 were 1.2 times, 1.3 times, 1.3 times, and 1.1 times that of 2000 to 2015 (Figure 6).

4.3.2. Contribution of Land Use Management to Vegetation Trends

This study categorized human activities led by land use management measures into three types: urbanization, agricultural expansion, and ecological restoration projects. The major national forestry projects involved in the Hexi region include the National Plain Greening Project, the Three-North Shelter Forest Program, and the Conversion of Farmland Back to Forests Project. Since 2004, Gansu Province has launched ecological preservation and construction projects to conserve the grassland ecosystem, including grazing closure, restoration and reconstruction of natural grassland, returning cropland to grassland, and returning grazing land to grassland. Based on the proportion and spatial distribution of non-ecological land types converted to ecological land, it can be seen that the ecological restoration area increased by 4.6 times from 147 km2 before 2000 to 672 km2 (Figure 6), as a result of the execution of significant ecological restoration projects. From 1982 to 2015, grassland and forestland contributed 34.7% and 8.8%, respectively, to the vegetation greening in the Hexi region (Figure 1b and Figure 3a). An overlay analysis was conducted in this study on the ecological restoration area, vegetation trend, and its driving force of corresponding time series. The results demonstrate that the national major ecological restoration project implemented in 2000 contributed 26.7% to the significant vegetation greening, which was primarily located in the eastern part of the Qilian Mountains, the Dunhuang, Guazhou, Jiuquan, Zhangye, and Wuwei oasis involved in the Three-North Shelter Forest Program, plain green area, the Conversion of Farmland Back to Forests Project planning area.
Rapid population growth has expedited the progress of urbanization. Between 1990 and 2015, the urbanization pixels covered an area of 439 km2, primarily in Linze County, Zhangye City, and the Wuwei Oasis. The spatial pattern and intensity of urbanization changed dramatically in 2000, expanding from 60 km2 to 389 km2 (Figure 6). Through overlay analysis of the vegetation trends and driving force contribution of the related time series and the urbanization expansion region, this study revealed that the urbanization process did not generate considerable vegetation browning before 2000. From 1990 to 2015, the urbanization process contributed 4.6% to the strong vegetation greening in the Wuwei Oasis area.
Cropland contributed 12.27% and 8.82%, respectively, to vegetation browning and greening in oasis areas (Figure 1b and Figure 3a), demonstrating the strong influence of agricultural expansion on vegetation greenness in the Hexi region. The amount of cropland expanded significantly by 13.10% between 1990 and 2015 (Figure 6c). The pixel area of agricultural expansion reached 2035 km2, which was 4.6 times that before 2000 (Figure 6). Overlay analysis was conducted on the spatial pattern of cropland expansion and the NDVI greening trends and the corresponding driving forces, and it was discovered that agricultural expansion contributed 17.5% to the central oasis’s significant greening trend, which was most pronounced in the Guazhou, Wuwei, and Minqin Oasis areas.

5. Discussion

5.1. Trend Analysis of NDVI and HNDVI

In the previous 34 years, the vegetation trend in the Hexi region has demonstrated considerable growth, with notable mutations occurring in 1999. Between 2000 and 2015, the proportion of substantial vegetation browning in the Hexi region was almost zero (Figure 3b). According to previous research, the greening trend can be observed in most arid and semi-arid areas [4,5,16,62,76]. The HNDVI value of the Hexi region has been steadily increasing over the last 34 years, with substantial changes in 1988 and 1999 (Figure 2a). This is mainly because the Chinese government has successively introduced many green economic development policies since 1999 and implemented a series of ecological restoration measures to promote vegetation and HNDVI growth [5,91]. Precipitation and temperature, as the main climatic factors for vegetation growth in arid and semi-arid regions, can provide water for vegetation and regulate photosynthesis and respiration rates [59,76]. Many studies have revealed the impact of climate change and the geographical environment on vegetation trends [4,76,92]. In addition to climate factors, human intervention also leads to changes in vegetation greenness [16,20,62,64,82]. The results of this study demonstrated that in 56.9% of the areas with significant vegetation greening in the Hexi region from 1982 to 2015, the contribution of climate factors was only 7.4%. This confirms the conclusion of other scholars that climate change is the driving factor for the significant greening of grassland vegetation [4,77,93]. On the other hand, the contribution of human factors driving vegetation greening was as high as 22.7%, which reverses the conclusion that the increasing trend of vegetation greening is mainly driven by climate change, further highlighting the role of human activities such as urbanization, ecological restoration, and agricultural expansion in vegetation restoration.

5.2. Impact of Land Use Change on Vegetation

The spatial pattern and expansion intensity of land use transfer in the Hexi region underwent substantial changes around 2000. After 2000, the area of construction land and cropland showed a rapid expansion trend, while that of unused land and grassland continued to decrease (Figure 6). Taking 2000 as a node year, the area of forestland and water land shifted from a downward trend to an expanding trend. From 2000 to 2015, construction land, urban land, rural residential land, and cropland expanded fast, with an expanding area of urbanization at a rate 6.5 times that of 1990 to 2000; agricultural expansion expanded at a rate 3.7 times that of 1990 to 2000 (Figure 6 and Table A1). Previous studies have also found that the expansion rate of regional construction land and cropland from 2000 to 2015 was 17 times and 10 times that of 1988 to 2000 (expansion by 10.53% and 1.61%, respectively) [79,94]. Additionally, the expansion intensity of urbanization and cropland reclamation was large. Although the area of construction land accounted for only 0.19% of the total in the research area in 2015, it was almost three times as large as that in 2000, contributing significantly toward the ecological footprint [95,96]. The area of ecological restoration increased sharply from 2000 to 2015, with a growth rate 4.6 times that of 1990 to 2000. Under the combined effects of suitable climate conditions, effective irrigation, and a series of ecological restoration projects implemented since 2000, the vegetation of various land types in the research area has shown a significant growth trend [40,97]. Compared with the expansion intensity of ecological restoration from 2000 to 2015, which was five times larger than that from 1990 to 2000, the area of desertification exhibited a slight increase, demonstrating that the ecological restoration project implemented since 2000 has greatly controlled the expansion rate of desertification [25,79]. The rapid increase in population and socio-economic development has accelerated the process of urbanization, and the area of urbanization from 2000 to 2015 was 6.5 times that of 1990 to 2000 [15,80]. The unused land in the region suffered a loss of 173.89% due to the expansion of construction land and cropland reclamation.

5.3. Impact of Land Use Management Measures on Vegetation Greenness

In addition to the significant impact of climate change, the massive ecological restoration programs implemented since 2000 have been some of the direct driving forces for vegetation greening [4,32,37,41,90]. Land use strategies have a direct impact on the spatial pattern of vegetation in terms of land use direction and intensity [23,98,99]. Grassland and forestland, in comparison to other land use types such as cropland, can provide soil and water conservation functions, such as resisting soil erosion, lowering surface runoff, and increasing soil organic carbon [99,100,101,102]. In high-altitude and steep places with extensive slopes, forest vegetation can improve soil fixing and prevent soil erosion by providing structural support to the soil through developed root systems [76,102]. Regarding the actual effects of ecological restoration projects, there is now substantial debate among academics [29,30,44,99,103,104,105]. Ecological restoration projects have considerable advantages for wind prevention, sand fixation, and soil and water conservation from the perspective of environmental protection focused on preventing desertification and soil erosion [32,99,101]. Scholars contend that the advantages of these projects have been overstated in terms of hydrological balance and ecological service value. Particularly in arid and semi-arid regions with limited water resources, forestland will lower soil moisture content and surface runoff due to its strong transpiration [29,30,44,99,103,104,105]. In this case, frequent droughts may potentially cancel out the effects of ecological restoration projects on vegetation changes. Additionally, afforestation may hasten the loss of water content in shallow and deep soil layers in regions where precipitation is insufficient to support normal tree growth, resulting in ecological degradation [101,106,107,108]. Therefore, future environmental protection planning should consider the health and sustainability of the landscape in addition to regulating specific tree species in accordance with different land use types and regional conditions [99,109].
The Hexi region benefited from ecological restoration projects from 1982 to 2015, resulting in a considerable rise in vegetation greening trend over a 672 km2 area (Figure 3a). This is consistent with prior research findings, which demonstrate that the ecological engineering projects implemented by the country since 1998 encouraged a quicker restoration of regional vegetation [23,38,98,110]. Meanwhile, from 1990 to 2015, the area of desertification was 148 km2, and the degree of desertification was 0.76 times that of 2000 to 2015. The expansion of ecological restoration projects, significant slowing of the desertification process, and positive changes in the trend of HNDVI between 2000 and 2015 highlight the critical role of national major restoration projects in improving the ecological environment of the Hexi region. In addition to enhancing the vegetation coverage of bare land and improving the physical and chemical qualities of soil [111], forest planting and afforestation can also regulate precipitation and surface runoff by intercepting natural precipitation through forest canopies [112]. Simultaneously, initiatives such as planting economic forests and sealing mountains for afforestation not only meet the win-win goal of environmental protection and economic development, but also make ecosystem services more valuable [113,114]. Grassland contributed 29.05% to vegetation browning in the last 34 years, mainly located in Subei and Sunan autonomous counties in the western part of the Qilian Mountains (Figure 1 and Figure 3a). This is mainly due to the grassland grazing policy implemented in Gansu Province [115]. In Subei Mongol Autonomous County, Sunan Yugur Autonomous County, and Bairi Tibetan Autonomous County in the western part of the Qilian Mountains, the significant vegetation greening trend in the last 34 years was driven by both climate and human factors. A study has found that grassland restoration in northwest China was mainly caused by climate factors, while human activities cause grassland degradation [116]. Some studies have also suggested that grazing has a certain contribution to the trend of vegetation browning in the Heihe River Basin, although this phenomenon tends to be ignored due to climate change [92,115]. Grazing is the main confounding factor of grassland ecosystems in arid areas. However, accurate data on the long-term spatial distribution of grazing activities are scarce, which makes it a challenge to identify the trends and the environmental impact of grazing activities. Although active grazing management has contributed to the growth of vegetation greenness and has partially offset the negative impact of increased livestock, overgrazing has posed a major challenge to the restoration of the shrub-grassland ecosystem in the Heihe River Basin. The beneficial impacts of climate warming and humidification on plants may be overestimated if the negative consequences of long-term grazing are not taken into account [92,115]. Since 2000, the increase in open pit mining areas on the southern slope of the Qilian Mountains has also led to a decline in the vegetation greenness of wetlands, meadows, and grasslands [117].
As the main socio-economic carrier for human survival and development, the relationship between human activities and vegetation greenness in oases will continue to evolve due to different ecological backgrounds and urban development states [5]. With an expansion area of 2036 km2, the agricultural expansion intensity of the oasis between 1990 and 2015 was 4.6 times that of 1990 and 2000 (Figure 6). Specifically, grassland and unused land were cultivated into cropland, which was most significant in the oasis areas of Guazhou, Wuwei, and Minqin. The considerable vegetation browning caused by agricultural expansion in the Wuwei and Minqin Oasis areas is consistent with earlier research findings [61,118]. This is mainly due to the water-saving measures of irrigation areas in the key management plan of the Shiyang River basin implemented in Gansu Province in 2006. From 2006 to 2010, the focus of water-saving projects in the irrigation areas of Liangzhou District and Minqin County was to control the irrigation scale and quota, which resulted in abandoned cropland or returning cropland to forestland and grassland [118]. The contribution of significant vegetation greening driven by urbanization was 4.6%, mainly in cities such as Wuwei where oases are more developed. This is consistent with other large-scale research results, which indicate that the positive impact of human activities on vegetation only occurs in the most developed regions of China with advanced economic and social development levels [5,15]. In the early stages of urban development, cities usually expand at the cost of vegetation loss [16,119], indicating a negative impact of human activities on vegetation greenness [16]. Rapid urbanization has led to a decline in vegetation on a worldwide and even regional scale [96,120,121], particularly affecting the abrupt changes in global and Chinese vegetation trends around the year 2000 [96,120].

6. Conclusions

The results of this study demonstrate that in 56.9% of the areas with significant vegetation greening between 1982 and 2015, climate factors contributed only 7.4%, while human factors contributed a considerable 22.7%, and the contribution driven by the coupling of climate and human factors was only 3.49%. Additionally, 11.36% of the areas with significant vegetation greening trends between 1982 and 1999 were primarily attributed to climate change, while 11.37% with significant vegetation browning trends were primarily attributed to human factors. After 2000, the percentage of areas with significant vegetation greening trends doubled that between 1982 and 1999, with human activities and climate change accounting for 21.02% and 15.7% of the increase, respectively. The transition intensity of land use was quite low before 2000, while the spatial pattern and expansion intensity of urbanization and ecological restoration projects underwent major changes after the ecological restoration project implemented in 2000, followed by agricultural expansion and desertification. From 2000 to 2015, the area of ecological restoration expanded by 4.6 times that of 1990 to 2000. From 1990 to 2015, the amount of cropland and desertification rose by 4.6 and 2.1 times, respectively, compared to 1990 to 2000. This study reveals that ecological restoration projects, agricultural expansion, and urbanization contribute 26.7%, 17.5%, and 4.6%, respectively, to significant vegetation greening, with the best performance in the Guazhou, Wuwei, and Minqin Oases.

Author Contributions

Conceptualization, L.M. and L.Y.; methodology, C.Z. and J.Z.; software, J.Z. and C.Z.; validation, H.F., J.Z. and C.Z.; formal analysis, C.Z.; investigation, J.Z.; resources, H.F.; data curation, H.F.; writing—original draft preparation, L.Y.; writing—review and editing, L.Y.; supervision, L.M.; project administration, L.Y.; funding acquisition, L.Y. All authors have read and agreed to the published version of the manuscript.

Funding

This research was funded by [the Natural Science Foundation Project of Gansu Province of China] grant number [22JR5RA141], [2023 University Teachers Innovation Foundation Project of Ministry of Education of Gansu Province of China] grant number [2023A-003], and [Youth Scholars Research Ability Enhancement Program of Northwest Normal University of China] grant number [20220024].

Institutional Review Board Statement

Not applicable.

Informed Consent Statement

Not applicable.

Data Availability Statement

A Generation of Global Inventory Modeling and Mapping Studies 3rd generation (GIMMS 3g) NDVI dataset is available on the NASA Earth Exchange platform (http://ecocast.arc.nasa.gov/data/pub/gimms/3g.v1/, accessed on 1 January 2021). The dataset of precipitation and temperature were provided by the Resource and Environmental Science Data Center (RESDC) of the Chinese Academy of Sciences (http://www.resdc.cn). The China meteorological forcing dataset (http://westdc.westgis.ac.cn, accessed on 1 January 2020) is the source of the wind speed (Wind) and total solar radiation (RAD) datasets.

Acknowledgments

The authors would like to express their sincere gratitude to the editors and reviewers, who have put considerable time and effort into their comments on this paper. We are grateful to the professional editing service for improving the language of our manuscript. This work was supported by the Natural Science Foundation Project of Gansu Province of China (grant no. 22JR5RA141), 2023 University Teachers Innovation Foundation Project of Ministry of Education of Gansu Province of China (grant no. 2023A-003), and Youth Scholars Research Ability Enhancement Program of Northwest Normal University of China (grant no. 20220024).

Conflicts of Interest

No conflict of competing interest exits in the submission of this manuscript, and manuscript is ap-proved by all authors for publication.

Appendix A

Table A1. Transitions of the total LUCC observed during 1990–2000 (%).
19902000 Total
(1990)
LossNet Gain in 2000Change in 2000
CLFLGLWLURRSOLUL
CL6.100.000.100.010.000.000.000.086.300.19−0.17−2.54
FL0.003.630.010.000.000.000.000.003.640.010.010.20
GL0.020.0122.370.000.000.000.000.0322.440.060.060.29
WL0.000.000.000.790.000.000.000.000.790.000.010.97
UR0.000.000.000.000.050.000.000.000.060.00−0.019.02
RS0.010.000.000.000.000.340.000.010.360.02−0.026.05
OL0.000.000.000.000.000.000.070.000.070.000.001.26
UL0.000.010.020.000.000.000.0066.3266.350.030.090.16
total (2000)6.133.6522.500.800.050.340.0766.44100.00.31
Gain0.030.020.130.010.000.000.000.120.31
Notes: CL, cropland; FL, forestland; GL, grassland; WL, water land; UR, urban residential land; RS, rural settlement land; OL, other construction land; UL, unused land (mainly Gobi, bare rocky land and sandy land), the same below.
Table A2. Transitions of the total LUCC observed during 2000–2015 (%).
20002015Total
(2000)
WL
Loss
UR
Net Gain in 2015Change in 2015
CLFLGLWLURRSOLUL
CL6.080.000.030.010.010.010.000.016.150.070.6410.41
FL0.023.550.000.000.000.000.000.003.570.020.000.00
GL0.210.0122.070.010.010.000.010.0222.340.27−0.06−0.27
WL0.010.000.010.750.000.000.000.010.780.030.033.85
UR0.470.010.170.040.050.000.000.000.050.000.0360.00
RS0.000.000.000.000.000.350.000.000.350.000.025.71
OL0.000.000.000.000.000.000.070.000.070.000.12171.43
UL0.000.010.020.000.010.010.1165.8866.700.82−0.78−1.17
total (2015)6.793.5722.280.810.080.340.0765.92100.001.21
Gain0.710.020.210.060.030.020.120.041.21
Table A3. Transitions of the total LUCC observed during 1990–2015 (%).
1990 2015Total
(1990)
WL
Loss
UR
Net Gain in 2015Change in 2015
CLFLGLWLURRSOLUL
CL6.030.000.050.010.010.030.000.016.140.110.8213.10
FL0.033.600.010.000.000.000.000.013.650.05−0.03−0.46
GL0.320.0122.070.010.000.000.000.0122.470.40−0.19−0.83
WL0.020.000.010.740.000.000.000.010.780.040.034.41
UR0.000.000.000.000.050.000.000.000.050.000.11213.51
RS0.000.000.000.000.000.340.000.000.340.000.1439.01
OL0.000.000.000.000.000.000.070.000.070.000.12173.89
UL0.560.010.140.050.090.100.1165.4466.501.061.00−1.50
total (2015)6.963.6222.280.810.160.480.1965.50100.001.66
Gain0.930.020.210.070.110.140.120.061.66

References

  1. Foley, J.A.; Coe, M.T.; Scheffer, M.; Wang, G.L. Regime shifts in the Sahara and Sahel: Interactions between ecological and climatic systems in northern Africa. Ecosystems 2003, 6, 524–532. [Google Scholar] [CrossRef]
  2. Ying, Q.; Hansen, M.C.; Potapov, P.V.; Tyukavina, A.; Wang, L.; Stehman, S.V.; Moore, R.; Hancher, M. Global bare ground gain from 2000 to 2012 using Landsat imagery. Remote Sens. Environ. 2017, 194, 161–176. [Google Scholar] [CrossRef]
  3. Li, J.R.; Okin, G.S.; Alvarez, L.; Epstein, H. Quantitative effects of vegetation cover on wind erosion and soil nutrient loss in a desert grassland of southern New Mexico, USA. Biogeochemistry 2017, 85, 317–332. [Google Scholar] [CrossRef]
  4. Chen, T.; Bao, A.; Jiapaer, G.; Guo, H.; Zheng, G.; Jiang, L.; Chang, C.; Tuerhanjiang, L. Disentangling the relative impacts of climate change and human activities on arid and semiarid grasslands in Central Asia during 1982–2015. Sci. Total Environ. 2019, 653, 1311–1325. [Google Scholar] [CrossRef]
  5. Wang, N.; Du, Y.Y.; Liang, F.Y.; Wang, H.M.; Yi, J.W. The spatiotemporal response of China’s vegetation greenness to human socio-economic activities. J. Environ. Manag. 2022, 305, 114304. [Google Scholar] [CrossRef]
  6. Hansen, M.C.; Egorov, A.; Potapov, P.V.; Stehman, S.V.; Tyukavina, A.; Turubanova, S.A.; Roy, D.P.; Goetz, S.J.; Loveland, T.R.; Ju, J.; et al. Monitoring conterminous United States (CONUS) land cover change with Web-Enabled Landsat Data (WELD). Remote Sens. Environ. 2014, 140, 466–484. [Google Scholar] [CrossRef]
  7. Bonan, G.B.; Pollard, D.; Thompson, S.L. Effects of boreal forest vegetation on global climate. Nature 1992, 359, 716–718. [Google Scholar] [CrossRef]
  8. Moran, M.S.; Rahman, A.F.; Washburne, J.C.; Goodrich, D.C.; Weltz, M.A.; Kustas, W.P. Combining the Penman–Monteith equation with measurements of surface temperature and reflectance to estimate evaporation rates of semiarid grassland. Agric. For. Meteorol. 1996, 80, 87–109. [Google Scholar] [CrossRef]
  9. Seto, K.C.; Guneralp, B.; Hutyra, L.R. Global forecasts of urban expansion to 2030 and direct impacts on biodiversity and carbon pools. Proc. Natl. Acad. Sci. USA 2012, 109, 16083–16088. [Google Scholar] [CrossRef]
  10. Kalnay, E.; Cai, M. Impact of urbanization and land-use change on climate. Nature 2003, 423, 528–531. [Google Scholar] [CrossRef]
  11. Grimm, N.B.; Faeth, S.H.; Golubiewski, N.E.; Redman, C.L.; Wu, J.G.; Bai, X.M.; Briggs, J.M. Global change and the ecology of cities. Science 2008, 319, 756–760. [Google Scholar] [CrossRef]
  12. Goldberg, L.; Lagomasino, D.; Thomas, N.; Fatoyinbo, T. Global declines in human-driven mangrove loss. Glob. Change Biol. 2020, 26, 5844–5855. [Google Scholar] [CrossRef] [PubMed]
  13. Viglizzo, E.F.; Frank, F.C.; Carreno, L.V.; Jobbagy, E.G.; Pereyra, H.; Clatt, J.; Pincen, D.; Ricard, M.F. Ecological and environmental footprint of 50 years of agricultural expansion in Argentina. Glob. Change Biol. 2011, 17, 959–973. [Google Scholar] [CrossRef]
  14. Pan, N.Q.; Feng, X.M.; Fu, B.J.; Wang, S.; Ji, F.; Pan, S.F. Increasing global vegetation browning hidden in overall vegetation greening: Insights from time-varying trends. Remote Sens. Environ. 2018, 214, 59–72. [Google Scholar] [CrossRef]
  15. Du, J.; Fu, Q.; Fang, S.; Wu, J.; He, P.; Quan, Z. Effects of rapid urbanization on vegetation cover in the metropolises of China over the last four decades. Ecol. Indic. 2019, 107, 105458. [Google Scholar] [CrossRef]
  16. Liu, H.; Cao, L.; Jia, J.; Gong, H.; Qi, X.; Xu, X. Effects of land use changes on the nonlinear trends of net primary productivity in arid and semiarid areas, China. Land Degrad. Dev. 2021, 32, 2183–2196. [Google Scholar] [CrossRef]
  17. Murty, D.; Kirschbaum, M.U.F.; McMurtrie, R.E.; McGilvray, H. Does conversion of forest to agricultural land change soil carbon and nitrogen? a review of the literature. Glob. Change Biol. 2002, 8, 105–123. [Google Scholar] [CrossRef]
  18. Poeplau, C.; Don, A.; Vesterdal, L.; Leifeld, J.; Van Wesemael, B.; Schumacher, J.; Gensior, A. Temporal dynamics of soil organic carbon after land-use change in the temperate zone—Carbon response functions as a model approach. Glob. Change Biol. 2011, 17, 2415–2427. [Google Scholar] [CrossRef]
  19. Villarino, S.H.; Studdert, G.A.; Baldassini, P.; Cendoya, M.G.; Ciuffoli, L.; Mastrángelo, M.; Piñeiro, G. Deforestation impacts on soil carbon stocks in the Semiarid Chaco Region. Argentina. Sci. Total Environ. 2017, 575, 1056–1065. [Google Scholar] [CrossRef]
  20. Koga, N.; Shimoda, S.; Shirato, Y.; Kusaba, T.; Shima, T.; Niimi, H.; Yamane, T.; Wakabayashi, K.; Niwa, K.; Koyama, K.; et al. Assessing changes in soil carbon stocks after land use conversion from forest land to agricultural land in japan. Geoderma 2020, 377, 114487. [Google Scholar] [CrossRef]
  21. Haaland, C.; van den Bosch, C.K. Challenges and strategies for urban green-space planning in cities undergoing densification: A review. Urban For. Urban Green. 2015, 14, 760–771. [Google Scholar] [CrossRef]
  22. Zhao, S.Q.; Liu, S.g.; Zhou, D.C. Prevalent vegetation growth enhancement in urban environment. Proc. Natl. Acad. Sci. USA 2016, 113, 6313. [Google Scholar] [CrossRef]
  23. Tong, X.W.; Brandt, M.; Yue, Y.M.; Horion, S.; Wang, K.; Keersmaecker, W.D.; Tian, F.; Schurgers, G.; Xiao, X.M.; Luo, Y.Q.; et al. Increased vegetation growth and carbon stock in China karst via ecological engineering. Nat. Sustain. 2018, 1, 44–50. [Google Scholar] [CrossRef]
  24. Sun, L.; Chen, J.; Li, Q.; Huang, D. Dramatic uneven urbanization of large cities throughout the world in recent decades. Nat. Commun. 2020, 11, 5366. [Google Scholar] [CrossRef] [PubMed]
  25. Wang, M.; Peng, J.; Hu, Y.N.; Du, Y.; Qiu, S.; Zhao, M. Scale consistency for investigating urbanization level, vegetation coverage, and their correlation. Urban For. Urban Green. 2021, 59, 126998. [Google Scholar] [CrossRef]
  26. Chen, C.; Park, T.; Wang, X.H.; Piao, S.L.; Xu, B.D.; Chaturvedi, R.K.; Fuchs, R.; Brovkin, V.; Ciais, P.; Fensholt, R.; et al. China and India lead in greening of the world through land-use management. Nat. Sustain. 2019, 2, 122–129. [Google Scholar] [CrossRef]
  27. Wen, Z.F.; Wu, S.J.; Chen, J.L.; Lü, M.Q. NDVI indicated long-term interannual changes in vegetation activities and their responses to climatic and anthropogenic factors in the Three Gorges Reservoir Region, China. Sci. Total Environ. 2017, 574, 947–959. [Google Scholar] [CrossRef]
  28. Wu, J.S.; Li, M.; Zhang, X.Z.; Fiedler, S.; Gao, Q.Z.; Zhou, Y.T.; Cao, W.F.; Hassan, W.; Margarint, M.C.; Tarolli, P.; et al. Disentangling climatic and anthropogenic contributions to nonlinear dynamics of alpine grassland productivity on the Qinghai-Tibetan Plateau. J. Environ. Manag. 2021, 281, 111875. [Google Scholar] [CrossRef]
  29. Cao, S.X.; Xia, C.Q.; Xian, J.L.; Guo, H.; Zheng, H.R. Payoff of the grain for green policy. J. Appl. Ecol. 2020, 57, 1180–1188. [Google Scholar] [CrossRef]
  30. Cao, S.X.; Suo, X.H.; Xia, C.Q. Payoff from afforestation under the Three-North Shelter Forest Program. J. Clean. Prod. 2020, 256, 120461. [Google Scholar] [CrossRef]
  31. Liu, J.G.; Li, S.X.; Ouyang, Z.Y.; Tam, C.; Chen, X.D. Ecological and socioeconomic effects of China’s policies for ecosystem services. Proc. Natl. Acad. Sci. USA 2008, 105, 9477–9482. [Google Scholar] [CrossRef] [PubMed]
  32. Yin, R.S.; Yin, G.P. China’s primary programs of terrestrial ecosystem restoration: Initiation, implementation, and challenges. Environ. Manag. 2010, 45, 429–441. [Google Scholar] [CrossRef] [PubMed]
  33. Li, Z.; Huffman, T.; Mcconkey, B.; Townley-Smith, L. Monitoring and modeling spatial and temporal patterns of grassland dynamics using time-series MODIS NDVI with climate and stocking data. Remote Sens. Environ. 2013, 138, 232–244. [Google Scholar] [CrossRef]
  34. Kong, L.Q.; Zheng, H.; Rao, E.M.; Xiao, Y.; Ouyang, Z.Y.; Li, C. Evaluating indirect and direct effects of eco-restoration policy on soil conservation service in Yangtze River Basin. Sci. Total Environ. 2018, 631–632, 887–894. [Google Scholar] [CrossRef]
  35. Chen, Y.Z.; Feng, X.M.; Tian, H.Q.; Wu, X.T.; Gao, Z.; Feng, Y.; Piao, S.L.; Lv, N.; Pan, N.Q.; Fu, B.J. Accelerated increase in vegetation carbon sequestration in China after 2010: A turning point resulting from climate and human interaction. Glob. Change Biol. 2021, 27, 5848–5864. [Google Scholar] [CrossRef] [PubMed]
  36. Zhang, G.L.; Dong, J.W.; Xiao, X.L.; Hu, Z.M.; Sheldon, S. Effectiveness of ecological restoration projects in Horqin Sandy Land, China based on SPOT-VGT NDVI data. Ecol. Eng. 2012, 38, 20–29. [Google Scholar] [CrossRef]
  37. Zhang, Y.; Peng, C.H.; Li, W.Z.; Tian, L.Z.; Zhu, Q.A.; Chen, H.; Fang, X.Q.; Zhang, G.L.; Liu, G.B.; Mu, X.M.; et al. Multiple afforestation programs accelerate the greenness in the ‘three north’ region of china from 1982 to 2013. Ecol. Indic. 2016, 61, 404–412. [Google Scholar] [CrossRef]
  38. Zhang, X.M.; Yue, Y.M.; Tong, X.W.; Wang, K.L.; Qi, X.K.; Deng, C.X.; Brandt, M. Eco-engineering controls vegetation trends in southwest China karst. Sci. Total Environ. 2021, 770, 145160. [Google Scholar] [CrossRef]
  39. Niu, Q.; Xiao, X.; Zhang, Y.; Qin, Y.; Dang, X.; Wang, J.; Zou, Z.; Doughty, R.B.; Brandt, M.; Tong, X.; et al. Ecological engineering projects increased vegetation cover, production, and biomass in semiarid and subhumid Northern China. Land Degrad. Dev. 2019, 30, 1620–1631. [Google Scholar] [CrossRef]
  40. Feng, X.M.; Fu, B.J.; Piao, S.L.; Wang, S.; Ciais, P.; Zeng, Z.Z.; Lü, Y.H.; Zeng, Y.; Li, Y.; Jiang, X.H.; et al. Revegetation in China’s loess plateau is approaching sustainable water resource limits. Nat. Clim. Change 2016, 6, 1019–1022. [Google Scholar] [CrossRef]
  41. Tian, H.J.; Cao, C.X.; Chen, W.; Bao, S.N.; Yang, B. Response of vegetation activity dynamic to climatic change and ecological restoration programs in Inner Mongolia from 2000 to 2012. Ecol. Eng. 2015, 82, 276–289. [Google Scholar] [CrossRef]
  42. Sun, G.; Zhou, G.; Zhang, Z.; Wei, X.; McNulty, S.G.; Vose, J.M. Potential water yield reduction due to forestation across China. J. Hydrol. 2006, 328, 548–558. [Google Scholar] [CrossRef]
  43. Ma, H.; Lv, Y.; Li, H. Complexity of ecological restoration in China. Ecol. Eng. 2013, 52, 75–78. [Google Scholar] [CrossRef]
  44. Wu, Z.; Wu, J.; He, B.; Liu, J.; Wang, Q.; Zhang, H.; Liu, Y. Drought offset ecological restoration program-induced increase in vegetation activity in the Beijing–Tianjin sand source region, China. Environ. Sci. Technol. 2014, 48, 12108–12117. [Google Scholar] [CrossRef] [PubMed]
  45. He, B.; Chen, A.; Wang, H.; Wang, Q. Dynamic response of satellite-derived vegetation growth to climate change in the Three North shelter forest region in China. Remote Sens. 2015, 7, 9998–10016. [Google Scholar] [CrossRef]
  46. Wu, B.; Ci, L.J. Landscape change and desertification development in the Mu Us Sandland, northern China. J. Arid. Environ. 2002, 50, 429–444. [Google Scholar] [CrossRef]
  47. Tucker, C.J.; Slayback, D.A.; Pinzon, J.E.; Los, S.O.; Myneni, R.B.; Taylor, M.G. Higher northern latitude normalized difference vegetation index and growing season trends from 1982 to 1999. Int. J. Biometeorol. 2001, 45, 184–190. [Google Scholar] [CrossRef]
  48. Nemani, R.R.; Keeling, C.D.; Hashimoto, H.; Jolly, W.M.; Piper, S.C.; Tucker, C.J.; Myneni, R.B.; Running, S.W. Climate-driven increases in global terrestrial net primary production from 1982 to 1999. Science 2003, 300, 1560–1563. [Google Scholar] [CrossRef]
  49. Pettorelli, N.; Vik, J.O.; Mysterud, A.; Gaillard, J.M.; Tucker, C.J.; Stenseth, N.C. Using the satellite-derived NDVI to assess ecological responses to environmental change. Trends Ecol. Evol. 2005, 20, 503–510. [Google Scholar] [CrossRef]
  50. Runnstrom, M.C. Rangeland development of the Mu Us Sandy Land in semiarid China: An analysis using Landsat and NOAA remote sensing data. Land Degrad. Dev. 2003, 14, 189–202. [Google Scholar] [CrossRef]
  51. Hitztaler, S.K.; Bergen, K.M. Mapping resource use over a Russian landscape: An integrated look at harvesting of a non-timber forest product in central Kamchatka. Environ. Res. Lett. 2013, 8, 045020. [Google Scholar] [CrossRef]
  52. Long, H.L.; Liu, Y.Q.; Hou, X.G.; Li, T.T.; Li, Y.R. Effects of land use transitions due to rapid urbanization on ecosystem services: Implications for urban planning in the new developing area of China. Habitat Int. 2014, 44, 536–544. [Google Scholar] [CrossRef]
  53. Wang, X.H.; Piao, S.L.; Ciais, P.; Friedlingstein, P.; Myneni, R.B.; Cox, P.; Heimann, M.; Miller, J.; Peng, S.S.; Wang, T.; et al. A two-fold increase of carbon cycle sensitivity to tropical temperature variations. Nature 2014, 506, 212–215. [Google Scholar] [CrossRef]
  54. Hu, S.G.; Tong, L.Y.; Frazier, A.E.; Liu, Y.S. Urban boundary extraction and sprawl analysis using Landsat images: A case study in Wuhan, China. Habitat Int. 2015, 47, 183–195. [Google Scholar] [CrossRef]
  55. Hüttich, C.; Herold, M.; Schmullius, C.; Egorov, V.; Bartalev, S.A. Indicators of Northern Eurasia’s land-cover change trends from SPOT-VEGETATION time-series analysis 1998–2005. Int. J. Remote Sens. 2007, 28, 4199–4206. [Google Scholar] [CrossRef]
  56. Symeonakis, E.; Drake, N. Monitoring desertification and land degradation over sub-Saharan Africa. Int. J. Remote Sens. 2004, 25, 573–592. [Google Scholar] [CrossRef]
  57. Karnieli, A.; Qin, Z.; Wu, B.; Panov, N.; Yan, F. Spatio-temporal dynamics of land-use and land-cover in the Mu Us Sandy Land, China, using the change rector analysis technique. Remote Sens. 2014, 6, 9316–9339. [Google Scholar] [CrossRef]
  58. John, R.; Chen, J.; Kim, Y.; Ou-yang, Z.T.; Xiao, J.; Park, H.; Shao, C.L.; Zhang, Y.Q.; Amarjargal, A.; Batkhshig, O.; et al. Differentiating anthropogenic modification and precipitation-driven change on vegetation productivity on the Mongolian Plateau. Landsc. Ecol. 2016, 31, 547–566. [Google Scholar] [CrossRef]
  59. Li, S.S.; Yang, S.N.; Liu, X.F.; Liu, Y.X.; Shi, M.M. NDVI-based analysis on the influence of climate change and human activities on vegetation restoration in the Shaanxi-Gansu-Ningxia Region, Central China. Remote Sens. 2015, 7, 11163–11182. [Google Scholar] [CrossRef]
  60. Lü, Y.H.; Zhang, L.W.; Feng, X.M.; Zeng, Y.; Fu, B.J.; Yao, X.L.; Li, J.R.; Wu, B.F. Recent ecological transitions in China: Greening, browning and influential factors. Sci. Rep. 2015, 5, 8732. [Google Scholar] [CrossRef]
  61. Hua, Y.C.; Li, Z.Y.; Gao, Z.H. Variation of vegetation coverage in Minqin County since 2001. Arid. Zone Res. 2017, 2, 337–343. (In Chinese) [Google Scholar] [CrossRef]
  62. Liu, H.Y.; Jiao, F.S.; Yin, J.Q.; Li, T.Y.; Gong, H.B.; Wang, Z.Y.; Lin, Z.S. Nonlinear relationship of vegetation greening with nature and human factors and its forecast—A case study of Southwest China. Ecol. Indic. 2020, 111, 106009. [Google Scholar] [CrossRef]
  63. Piao, S.L.; Yin, G.D.; Tan, J.G.; Cheng, L.; Huang, M.T.; Li, Y.; Liu, R.G.; Mao, J.F.; Myneni, R.B.; Peng, S.S.; et al. Detection and attribution of vegetation greening trend in China over the last 30 years. Glob. Change Biol. 2015, 21, 1601–1609. [Google Scholar] [CrossRef]
  64. Wright, C.K.; de Beurs, K.M.; Henebry, G.M. Combined analysis of land cover change and NDVI trends in the Northern Eurasian grain belt. Front. Earth Sci. 2012, 6, 177–187. [Google Scholar] [CrossRef]
  65. de Beurs, K.; Henebry, G.M.; Owsley, B.C.; Sokolik, I. Using multiple remote sensing perspectives to identify and attribute land surface dynamics in Central Asia 2001−2013. Remote Sens. Environ. 2015, 170, 48–61. [Google Scholar] [CrossRef]
  66. Evans, J.; Geerken, R. Discrimination between climate and human-induced dryland degradation. J. Arid. Environ. 2004, 57, 535–554. [Google Scholar] [CrossRef]
  67. Ge, W.; Deng, L.; Wang, F.; Han, J. Quantifying the contributions of human activities and climate change to vegetation net primary productivity dynamics in China from 2001 to 2016. Sci. Total Environ. 2021, 773, 145648. [Google Scholar] [CrossRef]
  68. Herrmann, S.M.; Anyamba, A.; Tucker, C.J. Recent trends in vegetation dynamics in the African Sahel and their relationship to climate. Glob. Environ. Change 2005, 15, 394–404. [Google Scholar] [CrossRef]
  69. Wessels, K.J.; Prince, S.D.; Malherbe, J.; Small, J.; Frost, P.E.; VanZyl, D. Can human-induced land degradation be distinguished from the effects of rainfall variability? A case study in South Africa. J. Arid. Environ. 2007, 68, 271–297. [Google Scholar] [CrossRef]
  70. Wang, J.; Guo, N.; Cai, D.; Deng, Z. The effect evaluation of the program of restoring grazing to grasslands in Maqu County. Acta Ecol. Sin. 2009, 29, 1276–1284. (In Chinese) [Google Scholar] [CrossRef]
  71. Li, H.; Cai, Y.; Chen, R.; Chen, Q.; Yang, X. Effect assessment of the project of grain for green in the karst region in Southwestern China: A case study of Bijie Prefecture. Acta Ecol. Sin. 2011, 31, 3255–3264. (In Chinese) [Google Scholar] [CrossRef]
  72. Marchant, R. Understanding complexity in savannas: Climate, biodiversity and people. Current Opinion in Environmental. Sustainability 2010, 2, 101–108. [Google Scholar] [CrossRef]
  73. Fan, Y.; Chen, J.; Shirkey, G.; John, R.; Wu, S.R.; Park, H.; Shao, C. Applications of structural equation modeling (SEM) in ecological studies: An updated review. Ecol. Process. 2016, 5, 19. [Google Scholar] [CrossRef]
  74. Pascual, M.; Minana, E.P.; Giacomello, E. Integrating knowledge on biodiversity and ecosystem services: Mind-mapping and bayesian network modelling. Ecosyst. Serv. 2016, 17, 112–122. [Google Scholar] [CrossRef]
  75. Baert, J.M.; Jaspers, S.; Janssen, C.R.; De Laender, F.; Aerts, M. Nonlinear partitioning of biodiversity effects on ecosystem functioning. Methods Ecol. Evol. 2017, 8, 1233–1240. [Google Scholar] [CrossRef]
  76. Yang, L.Q.; Guan, Q.Y.; Lin, J.K.; Tian, J.; Tan, Z.; Li, H.C. Evolution of NDVI secular trends and responses to climate change: A perspective from nonlinearity and nonstationarity characteristics. Remote Sens. Environ. 2021, 254, 112247. [Google Scholar] [CrossRef]
  77. Chen, T.; Tang, G.P.; Yuan, Y.; Guo, H.; Xua, Z.W.; Jiang, G.; Chen, X.H. Unraveling the relative impacts of climate change and human activities on grassland productivity in Central Asia over last three decades. Sci. Total Environ. 2020, 743, 140649. [Google Scholar] [CrossRef]
  78. Wu, S.; Liang, Z.; Li, S. Relationships between urban development level and urban vegetation states: A global perspective. Urban For. Urban Green. 2019, 38, 215–222. [Google Scholar] [CrossRef]
  79. Luo, Y.; Sun, W.; Yang, K.; Zhao, L. China urbanization process induced vegetation degradation and improvement in recent 20 years. Cities 2021, 114, 103207. [Google Scholar] [CrossRef]
  80. Guan, Q.Y.; Yang, L.Q.; Pan, N.H.; Lin, J.K.; Xu, C.Q.; Wang, F.F.; Liu, Z.Y. Greening and Browning of the Hexi Corridor in Northwest China: Spatial patterns and responses to climatic variability and anthropogenic drivers. Remote Sens. 2018, 10, 1270. [Google Scholar] [CrossRef]
  81. Li, Z.X.; Yuan, R.F.; Feng, Q. Climate background, relative rate, and runoff effect of multiphase water transformation in Qilian Mountains, the third pole region. Sci. Total Environ. 2019, 663, 315–328. [Google Scholar] [CrossRef] [PubMed]
  82. Li, Z.X.; Feng, Q.; Li, Z.J.; Wang, X.F.F.; Gui, J.; Zhang, B.J.; Li, Y.C.; Deng, X.H.; Xue, J.; Gao, W.D.; et al. Reversing conflict between humans and the environment—The experience in the Qilian Mountains. Renew. Sustain. Energy Rev. 2021, 148, 111333. [Google Scholar] [CrossRef]
  83. Telesca, L.; Lasaponara, R. Discriminating dynamical patterns in burned and unburned vegetational covers by using SPOT-VGT NDVI data. Geophys. Res. Lett. 2005, 32, L21401. [Google Scholar] [CrossRef]
  84. Yang, K.; He, J.; Tang, W.J.; Qin, J.; Cheng, C.C.K. On downward shortwave and longwave radiations over high altitude regions: Observation and modeling in the Tibetan plateau. Agric. For. Meteorol. 2010, 150, 38–46. [Google Scholar] [CrossRef]
  85. Shao, Q.Q.; Zhao, Z.P.; Liu, J.Y.; Fan, J.W. The characteristics of land cover and macroscopical ecology changes in the source region of three rivers on QinghaiTibet Plateau during last 30 years. Geogr. Res. 2010, 29, 1439–1451. (In Chinese) [Google Scholar] [CrossRef]
  86. Li, Y.R.; Cao, Z.; Long, H.L.; Liu, Y.S.; Li, W.J. Dynamic analysis of ecological environment combined with land cover and NDVI changes and implications for sustainable urban–rural development: The case of Mu Us Sandy Land, China. J. Clean. Prod. 2016, 142, 697–715. [Google Scholar] [CrossRef]
  87. Li, Y.R.; Liu, Y.S.; Long, H.L.; Wang, J.Y. Local responses to macro development policies and their effects on rural system in China’s mountainous regions: The case of Shuanghe Village in Sichuan Province. J. Mt. Sci. 2013, 10, 588–608. [Google Scholar] [CrossRef]
  88. He, C.Y.; Tian, J.; Gao, B.; Zhao, Y.Y. Differentiating climate- and human-induced drivers of grassland degradation in the Liao river basin, China. Environ. Monit. Assess. 2015, 187, 4199. [Google Scholar] [CrossRef]
  89. Ibrahim, Y.Z.; Balzter, H.; Kaduk, J.; Tucker, C.J. Land degradation assessment using residual trend analysis of GIMMS NDVI3g, soil moisture and rainfall in sub-Saharan west Africa from 1982 to 2012. Remote Sens. 2015, 7, 5471–5494. [Google Scholar] [CrossRef]
  90. Tong, X.W.; Wang, K.L.; Yue, Y.M.; Brandt, M.; Liu, B.; Zhang, C.H.; Liao, C.J.; Fensholt, R. Quantifying the effectiveness of ecological restoration projects on long-term vegetation dynamics in the karst regions of Southwest China. Int. J. Appl. Earth Obs. Geoinf. 2017, 54, 105–113. [Google Scholar] [CrossRef]
  91. Yu, L.X.; Xue, Y.K.; Diallo, I. Vegetation greening in China and its effect on summer regional climate. Sci. Bull. 2021, 66, 13–17. [Google Scholar] [CrossRef] [PubMed]
  92. Liu, P.L.; Hao, L.; Pan, C.; Zhou, D.C.; Liu, Y.Q.; Sun, G. Combined effects of climate and land management on watershed vegetation dynamics in an arid environment. Sci. Total Environ. 2017, 589, 73–88. [Google Scholar] [CrossRef] [PubMed]
  93. Qi, X.; Jia, J.; Liu, H.; Lin, Z. Relative importance of climate change and human activities for vegetation changes on China’s silk road economic belt over multiple timescales. Catena 2019, 180, 224–237. [Google Scholar] [CrossRef]
  94. Song, W.; Deng, X. Land-use/land-cover change and ecosystem service provision in China. Sci. Total Environ. 2017, 576, 705–719. [Google Scholar] [CrossRef]
  95. Lambin, E.F.; Geist, H.J.; Lepers, E. Dynamics of land-use and land-cover change in tropical regions. Annu. Rev. Environ. Resour. 2003, 28, 205–241. [Google Scholar] [CrossRef]
  96. Tian, G.; Qiao, Z. Assessing the impact of the urbanization process on net primary productivity in China in 1989–2000. Environ. Pollut. 2014, 184, 320–326. [Google Scholar] [CrossRef] [PubMed]
  97. Yang, X.; Xu, B.; Jin, Y.; Qin, Z.; Ma, H.; Li, J.; Zhu, X. Remote sensing monitoring of grassland vegetation growth in the Beijing–Tianjin sandstorm source project area from 2000 to 2010. Ecol. Indic. 2015, 51, 244–251. [Google Scholar] [CrossRef]
  98. Tong, X.W.; Brandt, M.; Yue, Y.M.; Ciais, P.; Rudbeck Jepsen, M.; Penuelas, J.; Wigneron, J.P.; Xiao, X.; Song, X.P.; Horion, S.; et al. Forest management in southern China generates short term extensive carbon sequestration. Nat. Commun. 2020, 11, 129. [Google Scholar] [CrossRef]
  99. Li, Z.W.; Ning, K.; Chen, J.; Liu, C.; Wang, D.Y.; Nie, X.D.; Hu, X.Q.; Wang, L.X.; Wang, T.W. Soil and water conservation effects driven by the implementation of ecological restoration projects: Evidence from the red soil hilly region of China in the last three decades. J. Clean. Prod. 2020, 260, 121109. [Google Scholar] [CrossRef]
  100. Deng, Y.S.; Dong, X.; Cai, C.F.; Ding, S.W. Effects of land uses on soil physic-chemical properties and erodibility in collapsing-gully alluvial fan of Anxi County, China. J. Integr. Agric. 2016, 15, 1863–1873. [Google Scholar] [CrossRef]
  101. Jia, Y.H.; Shao, M.A. Dynamics of deep soil moisture in response to vegetational restoration on the Loess Plateau of China. J. Hydrol. 2014, 519, 523–531. [Google Scholar] [CrossRef]
  102. Lin, J.K.; Guan, Q.Y.; Pan, N.H.; Zhao, R.; Yang, L.Q.; Xu, C.Q. Spatiotemporal Variations and Driving Factors of the Potential Wind Erosion Rate in the Hexi Region. Land Degrad. Dev. 2021, 32, 139–157. [Google Scholar] [CrossRef]
  103. Cao, S.X. Why large-scale afforestation efforts in China have failed to solve the desertification problem. Environ. Sci. Technol. 2008, 42, 1826–1831. [Google Scholar] [CrossRef]
  104. Cao, S.X.; Chen, L.; Shankman, D.; Wang, C.M.; Wang, X.B.; Zhang, H. Excessive reliance on afforestation in China’s arid and semi-arid regions: Lessons in ecological restoration. Earth-Sci. Rev. 2011, 104, 240–245. [Google Scholar] [CrossRef]
  105. Cao, S.X.; Wang, G.S.; Chen, L. Questionable value of planting thirsty trees in dry regions. Nature 2010, 465, 31. [Google Scholar] [CrossRef] [PubMed]
  106. Asner, G.P.; Hughes, R.F.; Vitousek, P.M.; Knapp, D.E.; Kennedy-Bowdoin, T.; Boardman, J.; Martin, R.E.; Eastwood, M.; Green, R.O. Invasive plants transform the three-dimensional structure of rain forests. Proc. Natl. Acad. Sci. USA 2008, 105, 4519–4523. [Google Scholar] [CrossRef]
  107. Issa, O.M.; Valentin, C.; Rajot, J.L.; Cerdan, O.; Desprats, J.F.; Bouchet, T. Runoff generation fostered by physical and biological crusts in semi-arid sandy soils. Geoderma 2011, 167, 22–29. [Google Scholar] [CrossRef]
  108. Normile, D. Getting at the roots of killer dust storms. Science 2007, 317, 314–316. [Google Scholar] [CrossRef]
  109. Zhou, G.Y.; Xia, J.; Zhou, P.; Shi, T.T.; Li, L. Not vegetation itself but mis-revegetation reduces water resources. Sci. China Earth Sci. 2021, 64, 404–411. [Google Scholar] [CrossRef]
  110. Brandt, M.; Yue, Y.M.; Wigneron, J.P.; Tong, X.W.; Tian, F.; Jepsen, M.R.; Xiao, X.; Verger, A.; Mialon, A.; Al-Yaari, A.; et al. Satellite-observed major greening and biomass increase in South China karst during recent decade. Earths Future 2018, 6, 1017–1028. [Google Scholar] [CrossRef]
  111. Jia, L.; Zhao, W.; Zhai, R.; Liu, Y.; Kang, M.; Zhang, X. Regional differences in the soil and water conservation efficiency of conservation tillage in China. Catena 2019, 175, 18–26. [Google Scholar] [CrossRef]
  112. Wisniewski, P.; Marker, M. The role of soil-protecting forests in reducing soil erosion in young glacial landscapes of Northern-Central Poland. Geoderma 2019, 337, 1227–1235. [Google Scholar] [CrossRef]
  113. Jiang, C.; Zhang, H.; Wang, X.; Feng, Y.; Labzovskii, L. Challenging the land degradation in China’s Loess Plateau: Benefits, limitations, sustainability, and adaptive strategies of soil and water conservation. Ecol. Eng. 2019, 127, 135–150. [Google Scholar] [CrossRef]
  114. Qi, W.; Li, H.; Zhang, Q.; Zhang, K. Forest restoration efforts drive changes in land-use/land-cover and water-related ecosystem services in China’s Han River basin. Ecol. Eng. 2019, 126, 64–73. [Google Scholar] [CrossRef]
  115. Hao, L.; Pan, C.; Zhang, X.Y.; Zhou, D.C.; Liu, P.L.; Liu, Y.Q.; Sun, G. Quantifying the effects of overgrazing on mountainous watershed vegetation dynamics under a changing climate. Sci. Total Environ. 2018, 639, 1408–1420. [Google Scholar] [CrossRef]
  116. Zhou, W.; Gang, C.C.; Zhou, L.; Chen, Y.Z.; Li, J.L.; Ju, W.M.; Odeh, I. Dynamic of grassland vegetation degradation and its quantitative assessment in the northwest China. Acta Oecologica 2014, 55, 86–96. [Google Scholar] [CrossRef]
  117. Qian, D.W.; Yan, C.Z.; Xiu, L.N.; Feng, K. The impact of mining changes on surrounding lands and ecosystem service value in the Southern Slope of Qilian Mountains. Ecol. Complex. 2018, 36, 138–148. [Google Scholar] [CrossRef]
  118. Li, X.; Yang, L.Q. Accelerated Restoration of Vegetation in the Arid Region of Northwestern China since 2000 Driven by the Interaction between Climate and Human Beings. Remote Sens. 2023, 15, 2675. [Google Scholar] [CrossRef]
  119. Guan, X.; Shen, H.; Li, X.; Gan, W.; Zhang, L. A long-term and comprehensive assessment of the urbanization-induced impacts on vegetation net primary productivity. Sci. Total Environ. 2019, 669, 342–352. [Google Scholar] [CrossRef]
  120. Liu, X.P.; Pei, F.S.; Wen, Y.Y.; Li, X.; Wang, S.J.; Wu, C.J.; Cai, Y.L.; Wu, J.G.; Chen, J.; Feng, K.S.; et al. Global urban expansion offsets climate-driven increases in terrestrial net primary productivity. Nat. Commun. 2019, 10, 5558. [Google Scholar] [CrossRef]
  121. Jiang, C.; Wu, Z.F.; Cheng, J.; Yu, Q.; Rao, X.Q. Impacts of urbanization on net primary productivity in the Pearl River Delta, China. Int. J. Plant Prod. 2015, 9, 581–598. [Google Scholar] [CrossRef]
Figure 1. The study area (a) and land cover types (b) and vegetation types (c).
Atmosphere 14 01419 g001
Figure 2. The interannual change in ANDVI and HNDVI in the total area (a) and different vegetation cover types (b) during 1982–2015.
Atmosphere 14 01419 g002
Figure 3. The spatiotemporal pattern of NDVI trends in the total area (a) and different vegetation types (b).
Atmosphere 14 01419 g003
Figure 4. The spatiotemporal patterns of HNDVI trends during 1982–1999 (a), 2000–2015 (b) and 1982–2015 (c).
Atmosphere 14 01419 g004
Figure 5. The contributions of climate change (CC) and human activities (HA) on NDVI trends during 1982–1999 (a), 2000–2015 (b) and 1982–2015 (c). Notes: CCB, HAB, and CCB and HAB represent climate change, human activities and the coupling of climate and human factors driving vegetation browning, respectively; CCG, HAG and CCG and HAG represent climate change, human activities and the coupling of climate and human factors driving vegetation greening, respectively.
Atmosphere 14 01419 g005
Figure 6. Land use change induced by human activities in the Hexi region during 1982–1999 (a), 2000–2015 (b) and 1982–2015 (c).
Atmosphere 14 01419 g006
Table 1. Land use type and ecological land reclassification.
NumberLand Use TypeEcological Land
1CroplandNo
2ForestlandYes
3GrasslandYes
4Water areaYes
5Unused landNo
6Urban land, rural residential land and other construction landNo
Disclaimer/Publisher’s Note: The statements, opinions and data contained in all publications are solely those of the individual author(s) and contributor(s) and not of MDPI and/or the editor(s). MDPI and/or the editor(s) disclaim responsibility for any injury to people or property resulting from any ideas, methods, instructions or products referred to in the content.

