Abstract
The venting of methane from coal mining is China’s main source of methane emissions. Accurate and up-to-date methane emission factors for coal mines are significant for reporting and controlling methane emissions in China. This study takes a typical coal mine in Shanxi Province as the research object and divides the coal mine into different zones based on the occurrence structure of methane in Shanxi Province. The methane emission characteristics of underground coal mine types and monitoring modes were studied. The emissions of methane from coal seams and ventilation methane of six typical coal mine groups in Shanxi Province were monitored. The measured methane concentration data were corrected by substituting them into the methane emission formula, and the future methane emissions were predicted by the coal production and methane emission factors. The results show that the number of methane mines and predicted reserves in Zone I of Shanxi Province are the highest. The average methane concentration emitted from coal and gas outburst mines is about 22.52%, and the average methane concentration emitted from high-gas mines is about 10.68%. The methane emissions from coal and gas outburst mines to the atmosphere account for about 64% of the total net methane emissions. The predicted methane emission factor for Shanxi coal mines is expected to increase from 8.859 m3/t in 2016 to 9.136 m3/t in 2025, and the methane emissions from Shanxi coal mines will reach 8.43 Tg in 2025.
1. Introduction
Global warming poses risks to human society and ecosystems, which are closely related to human survival and development. It has become a global consensus that human activities are the main cause of global warming [1,2]. In addition to controlling CO2 emissions, reducing non-CO2 greenhouse gas emissions is also crucial for mitigating global warming [3,4]. Methane (CH4), as the second-largest anthropogenic greenhouse gas, causes a greenhouse effect that is 20 to 23 times more potent than that of CO2 [5,6,7]. The relative importance of methane compared to carbon dioxide depends on its shorter atmospheric lifetime, more substantial warming potential, and recent changes in its atmospheric growth rate [7,8,9,10]. According to the Intergovernmental Panel on Climate Change (IPCC), the level of CH4 in the atmosphere has increased by approximately 162% over the past 250 years [11]. The United Nations Environment Programme (UNEP) and the Climate and Clean Air Coalition (CCAC) believe that over 50% of methane emissions globally are caused by three major industries: fossil fuels, waste, and agriculture [12]. Between 2008 and 2017, coal mine methane emissions accounted for 33% of global methane emissions related to fossil fuel activities [9]. Coal mine methane emissions are essentially the same in all countries of the world. Coal mine methane emissions in The Netherlands accounted for nearly 29% of direct methane emissions [13], coal mine methane emissions in Poland exceeded 9.3 × 10⁸ m3 per year [14], and coal mine methane emissions in Australia accounted for 68% of the country’s total energy sector emissions [3]. Although COVID-19 resulted in the closure of most of the coal industry during 2020, the increase in atmospheric methane concentrations is still higher than the average annual growth rate over the past decade, and the task of reducing methane emissions from coal mines is a long way off [2]. Since the 21st century, China has gradually become the country with the highest methane emissions in the world. China’s anthropogenic methane emissions account for 14% to 22% of the global total anthropogenic methane emissions [15]. The majority of methane emissions in China are from energy-related activities, with a significant portion originating from methane leakage during coal mining processes. According to official Chinese statistics, coal mining activities emitted approximately 25,000 Gg of methane in 2015, ranking first in the world, accounting for about 45% of China’s total methane emissions [16]. Currently, most of the studies on the emission characteristics of coal mine methane are based on the combination of actual measurements and methane emission modeling to obtain methane emissions [3,13,14], and relatively little attention is paid to the methane concentration in coal mines. Therefore, this study introduces the coal mine methane concentration into the methane emission formula and corrects the methane emission factor, which is of great practical significance.
Shanxi Province, as a typical coal city in China, is an important energy and chemical base in the country. The province has abundant coal resources, with many coal mines and a coal-bearing area accounting for about 40% of the total provincial area [17]. The abundant coal resources give Shanxi Province an absolute advantage in coalbed methane resources, with a total of 8309.8 billion m3, accounting for 27.7% of the national total [16]. Shanxi has abundant coalbed methane resources, and their exploitation and utilization can not only significantly reduce greenhouse gas emissions and lower the risk of methane explosions and fires, but also alleviate the coal-rich and gas-poor energy consumption pattern in Shanxi with broad development prospects. With the continuous introduction and innovation of coalbed methane exploration and development technologies, expanding investments, and further strengthening policy support, by the end of 2017, the coalbed methane and coal mine methane extraction in the province reached 12 billion m3, an increase of 18.8% compared to 2015, with a utilization volume of 7.5 billion m3 [16]. However, much methane is still being released into the atmosphere without being utilized. Coal mine methane abatement technologies include variable pressure adsorption technology [18,19], thermal oxidation technology [20,21], catalytic oxidation technology [22,23,24], etc. The realization of regional methane emission prediction is of guiding significance for the selection of appropriate methane abatement technologies. In addition, this technology can be subsequently extended to the whole country, which is of great significance to China’s greenhouse gas emission reduction policy.
This study focuses on the geological characteristics of methane in coal mines and combines the methane geological map of Shanxi Province to divide the region. It summarizes the number of high-gas and coal and gas outburst mines and coalbed methane resources in different gas occurrence zones. We performed a quantitative analysis of methane emissions from coal mines, estimating the emission factor for coal mines without measured data by establishing a quantitative relationship between the emission factor and actual measured coal production data, and correcting the methane emission factor for coal mines. The prediction model for methane emissions from coal mines in Shanxi Province is established based on the original coal production method. Methane emissions from coal mines are an environmental issue, productivity barrier, and safety concern. Therefore, understanding the characteristics of methane emissions, enhancing monitoring, expanding prediction, and controlling or reducing methane emissions from coal mines have multiple benefits and are important for methane management in coal mines.
2. Research Methods
2.1. Calculation Method of Methane Emission
This study aims to investigate the methane emissions from coal mines using absolute and relative methane emissions. Absolute methane emission refers to the total amount of methane released by wind and methane extracted and discharged within a given time. When multiple intake and return airways exist in the measuring area, the absolute methane emission includes the total gas emissions from all ventilation circuits. The specific calculation formula is as follows:
In the formula, qa represents the absolute methane emission rate in the measurement area, m3/min; qem represents the methane emission rate caused by wind in the measurement area, m3/min; qex represents the methane extraction rate in the measurement area, m3/min.
In the formula, n represents the shift system. When the mine adopts a three-shift system, n = 3. When the mine adopts a four-shift system, n = 4. i represents the sequence number of the shift. For the mine that adopts a three-shift system, i = 1, 2, 3. For the mine that adopts a four-shift system, i = 1, 2, 3, 4. qemi represents the methane emission of the i-th shift, m3/min. Qri represents the airflow in the return airway of the i-th shift, m3/min. Cri represents the methane concentration in the airflow of the return airway of the i-th shift, %. Qei represents the airflow in the intake airway of the i-th shift, m3/min. Cei represents the methane concentration in the airflow of the intake airway of the i-th shift, %.
Relative methane emission refers to the average amount of methane emitted daily under normal mining conditions. This study calculates the relative methane emission by converting it into absolute methane emission, following the specific calculation method below:
In the equation, qr represents the relative methane emission rate, m3/t; qa represents the absolute methane emission rate, m3/min; D represents the monthly average coal production, t/d; 1440 represents the number of minutes in a day.
The original formula does not mention the methane concentration when defining the methane emission from extraction. However, in real life, the methane concentration in coal mine extraction is mostly below 30%, according to relevant emission standards. If the methane emission factor is calculated directly based on the amount of extracted methane, the result will be too high, thus easily overestimating the underground coal mine methane emissions. Therefore, the explanation for qex in Formula (1) is supplemented as follows:
In the formula, Qd represents the methane extraction rate in the measurement area, m3/min; Cd represents the average methane concentration in the extraction, %.
2.2. Emission Factor Prediction Models of Methane Emission
The metabolic GM(1, 1) model creates new time series data for subsequent forecasting by continuously adding new data while removing old data in a “metabolic” manner. The new data series better reflects the inner development pattern of the data, thus obtaining more accurate prediction results. Compared with the traditional GM(1, 1), the metabolic GM(1, 1) model is more practical. The MATLAB program code is as follows:
| y = input; n = length(y); yy = ones(n,1); yy(1) = y(1); for i = 2:n yy(i) = yy(I − 1) + y(i); end B = ones(n-1, 2); for i =1:(n − 1) B(i, 1) = −(yy(i) + yy(i + 1))/2; B(i,2) = 1; end BT = B’; for j = 1:(n − 1) YN(j) = y(j + 1); end YN = YN’; A = inv(BT*B)*BT*YN; a = A(1); u = A(2); t = u/a; | t_test = input(‘Enter the number of predictions to be made ‘); i = 1:t_test + n; yys(i + 1) = (y(1) − t).*exp(−a.*i) + t; yys(1) = y(1); for j = n + t_test:−1: 2 ys(j) = yys(j) − yys(j − 1); end x = 1:n; xs = 2:n + t_test; yn = ys(2:n + t_test); plot(x, y, ‘^r’, xs, yn, ‘*−b’); det = 0; for i = 2:n det =det + abs(yn(i) − y(i)); end det = det/(n − 1); disp([‘The per cent absolute error is:’,num2str(det), ‘%’]); disp([‘The predicted value is:’,num2str(ys(n + 1: n + t_test))]); |
2.3. Emission Factor Prediction Models of Methane Emission
The Monte Carlo method is used to study the effects of uncertainty in coal mine methane emission. This is a method that uses statistical sampling theory to approximate the solution of a mathematical problem. The basic steps of the Monte Carlo method include selecting the input parameters for the uncertainty analysis, determining the probability distributions and ranges of the input parameters, and generating the probability distributions of the model output values. In this study, we used the Oracle Crystal Ball program to analyze the uncertainty of emissions. The input parameters were the values of the modified emission factor model GM (1,1) and the values of the coal mine production in Shanxi Province. The methane emission factor took the values of 8.85–9.14 m3/t and a median of 8.99 m3/t. The model was set up to simulate the running of 10,000 experiments according to the probability distribution for each parameter.
3. Results and Discussion
3.1. Characteristics and Type Classification of Methane Distribution
The coal mine methane geological map of Shanxi Province is used to divide Shanxi Province into regions, and the number of total high-gas and coal and gas prominent mines and the predicted coal bed methane resources are summarized in the zones. The methane geological map is based on quantitative theory and takes methane geological conditions as indicators, through which the regional division is of great significance for the analysis of coal mine methane emission chemistry in specific coal mines.
3.1.1. Methane Distribution Characteristics in Coal Mines
Shanxi Province has large coal reserves with wide distribution, but they are primarily concentrated in six coal fields: Datong, Ningwu, Hedong, Xishan, Huoxi, and Qinshui. There are also scattered coal-producing areas such as Hunyuan, Wutai, Fanzhi, Pinglu, and Yuanqu. The satellite monitoring map of methane emissions and the geological map of coal mine methane in Shanxi Province in 2019 are shown in Figure 1. From the figure, it can be seen that the methane concentration in Shanxi Province in 2019 was 1864.9 ppb. The areas with high methane concentrations are mainly concentrated in the central and southern parts of Shanxi Province. Among them, the methane concentrations in Jincheng and Yangquan are relatively high, reaching 1884.1 ppb and 1887.7 ppb, respectively. The methane concentration in the northern part of Shanxi Province is relatively low, with Shuozhou and Datong having methane concentrations of 1848.3 ppb and 1849.0 ppb, respectively. The methane content in the coal seams in the Hedian, Datong, Ningwu, and Qinshui coal basins decreases from shallow to deep, and the distribution of methane content in the coal seams gradually increases from the periphery of the basin to the core. The overall occurrence pattern of methane in coal mines is low in the north and high in the south, and the amount of methane emitted during the mining process will also be higher in areas with higher methane occurrence. According to the theory of hierarchical control of methane occurrence structures, Shanxi Province can be divided into five zones: the high outburst zone in the Qinshui Basin, the high outburst zone in the Hedong Coalfield, the high outburst zone in the Xuangang Xishan, the methane zone in the northern Shanxi uplift, and the methane zone in the Fenwei Fault Depression, as shown in Figure 1.
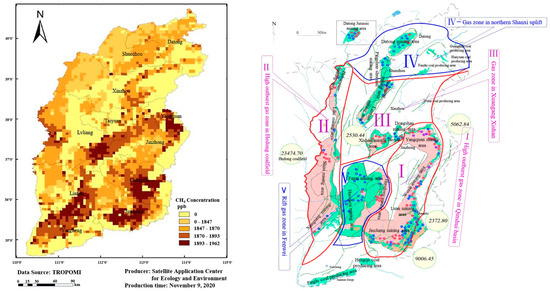
Figure 1.
Methane emission satellite monitoring map and coal mine methane geological map in Shanxi Province in 2019.
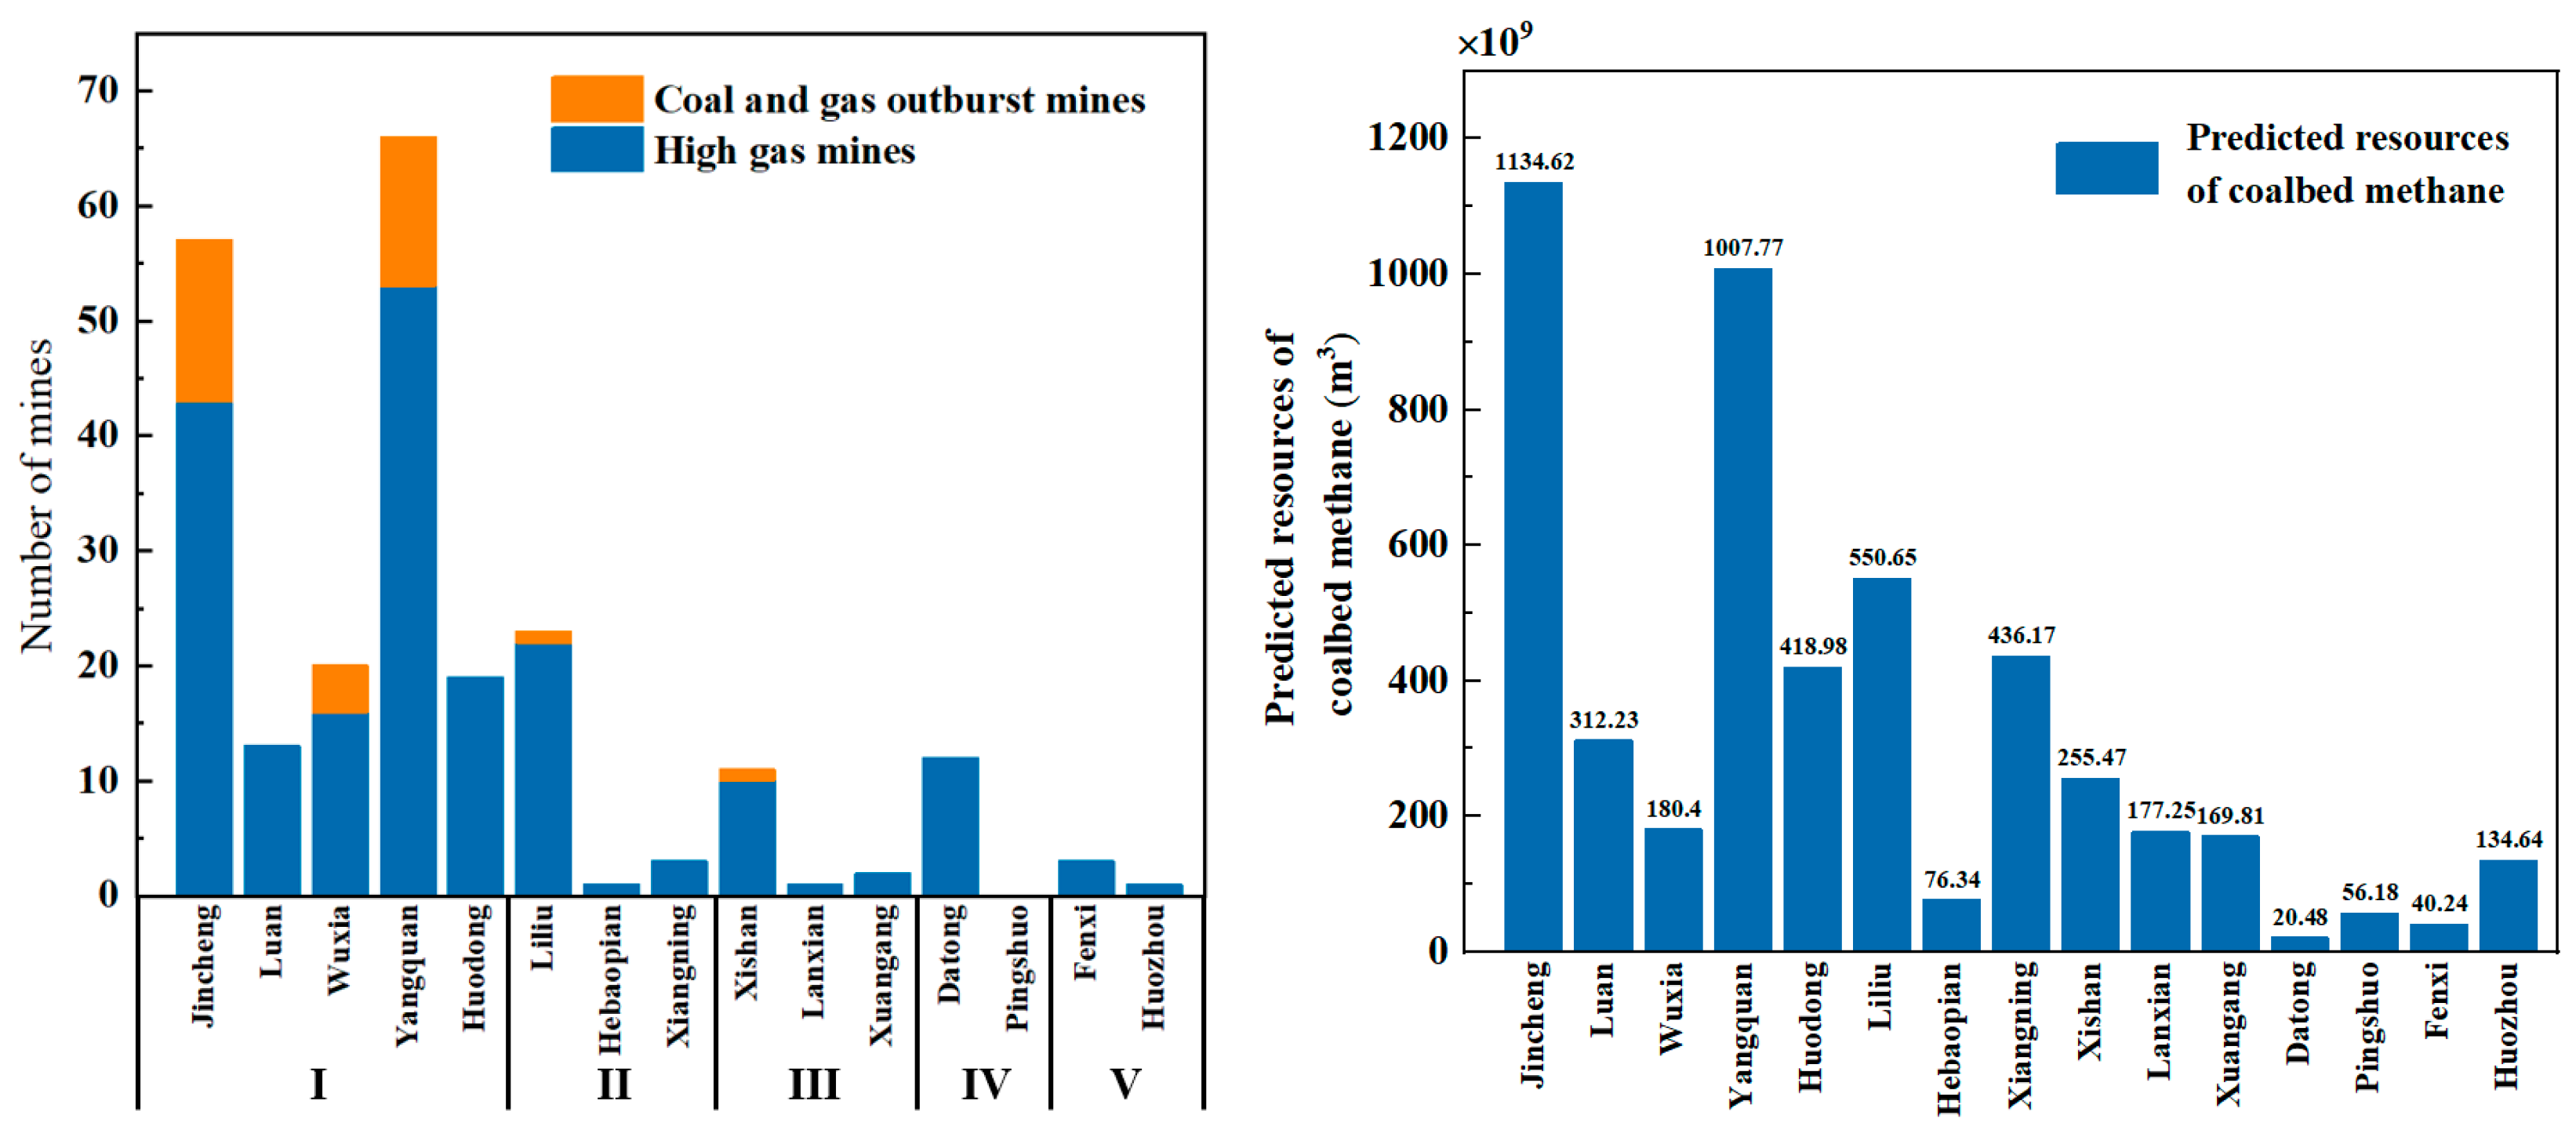
In order to more intuitively demonstrate the distribution characteristics of methane in different coal mines and predict the resource reserves, investigations were conducted on the types, quantities, and predicted methane emissions in five different mining areas. The results are shown in Figure 2. The high-gas zone of the Qingshui Basin (I) includes the Qingshui Coalfield, where the coal seam has a high methane content. The number of high-gas or coal and gas outburst mines is significantly higher than in other zones, and the abundance of methane reserves is highest. The high-gas zone of the Hedong Coalfield (II) includes the Hedong Coalfield area, where the coal seam thickness is greater, and the methane content is higher. The number of high-gas mines is significantly higher than in the Xuangang Xishan high-gas zone (III), Northern Shanxi uplift methane zone (IV), and Fenwei rift methane zone (V), and the abundance of methane reserves is second highest. The Xuangang Xishan high-gas zone (III) includes the Xishan Coalfield, where the coal seams are shallow or low-grade, and the abundance of methane reserves is moderate. The Northern Shanxi uplift methane zone (IV) includes the Datong Coalfield and part of the Ningwu Coalfield. The number of high-gas or coal and gas outburst mines is similar to that in the Xuangang Xishan high-gas zone (III), but the reserves are lower due to the shallow burial depth of the coal seams and low coal grade. The Fenwei rift methane zone (V) includes the Huoxi Coalfield, which has the fewest high-gas mines and lower regional methane pressure. Due to the development of extensional structures, a large amount of methane in the coal seams has escaped, resulting in the lowest abundance of methane reserves.
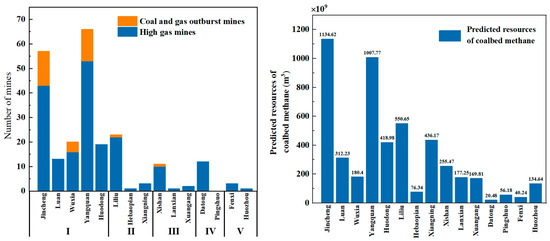
Figure 2.
Characteristics of coal mine gas occurrence zones in Shanxi.
3.1.2. Classification of Underground Coal Mine Types
The relative methane emission in coal mines mainly depends on the type of coal mining, underground geological structure, history, and quality of coal. Based on the methane emission and emission forms, underground coal mines can be divided into three categories: low-gas, high-gas, and coal and gas outbursts. The classification of coal mine methane emission rates is shown in Table 1.

Table 1.
Underground coal mine gas classification.
According to statistics, there are currently 978 coal mines in Shanxi Province. Among them are 232 high-gas mines and 50 coal and gas outburst mines. Except for some mines under construction, there are currently 247 mines conducting methane drainage. In this study, a total of 183 mines were counted, including 151 high-gas mines and 32 coal and gas outburst mines. The five methane-bearing zones are shown in Table 2, and the number of high-gas mines in each region roughly corresponds to Figure 2. The number of high-gas mines in Zone I is significantly higher than in other regions, covering the Yangquan–Jincheng high-gas zone.
Table 2.
Classification of coal mine samples.
3.2. Accounting and Analysis of Methane Emissions from Different Areas
In this study, methane pumping data from 182 coal mines in Shanxi Province in 2019 were collected from January to December. Based on the basic data, the amount of methane pumped under different extraction modes in each gas-endowed subzone of Shanxi Province and the amount of gas pumped from mines with different coal mine gas levels were regionally summarized and discussed.
3.2.1. Accounting for Methane Emissions in Different Monitoring Modes for Partition
Based on the limitations of coal seams and their physical properties, coalbed gas resources and their potential, coalbed gas extraction conditions, and topographical conditions, two modes, namely underground extraction and surface extraction, were used to calculate the methane emissions in different regions of Shanxi Province. The results are shown in Figure 3, and it can be seen that the methane emissions in Shanxi Province are mainly emitted through surface extraction mode, with an emission volume of about 3.087 billion cubic meters, accounting for approximately 64% of the total methane emissions. However, the methane emissions from underground also reached 1.485 billion cubic meters, accounting for about 36% of the total methane emissions. At the same time, there are significant differences in methane emissions in different regions. According to Figure 3a, it is found that 80% of the methane extraction in Shanxi Province comes from Region I, and the methane extraction volumes of Region II and III “contribute” 7.9% and 9.5% of the total extraction volume, respectively. Due to the smaller number of high-gas outburst mines in Region IV and V, there are relatively fewer mines to be extracted, resulting in a smaller extraction volume.
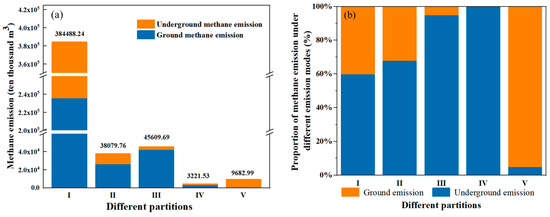
Figure 3.
(a) Emission and (b) proportion of the amount of gas pumped by different drainage modes.
According to different criteria, methane emissions were calculated in different regions, and the main sources of methane emissions varied in different regions. Figure 3 shows that in Regions I, II, III, and IV, methane extraction is mainly from surface pumping, while in Region V, methane extraction is mainly from underground pumping. During the data aggregation process, it was found that the amount of methane extraction varies significantly for the same mine under different pumping modes. In contrast, the total methane extraction remains relatively stable. The size of methane emission from underground and surface pumping systems in different mines is related to the choice of pumping mode mentioned above. The total methane emission is not directly related to the choice of pumping mode. The emission varies with the change in extraction volume and methane extraction efficiency. The methane extraction volume of each mine is determined based on the methane concentration in the mine air to ensure safe coal production.
3.2.2. Accounting for Methane Emissions in Different Categories of Mining Areas
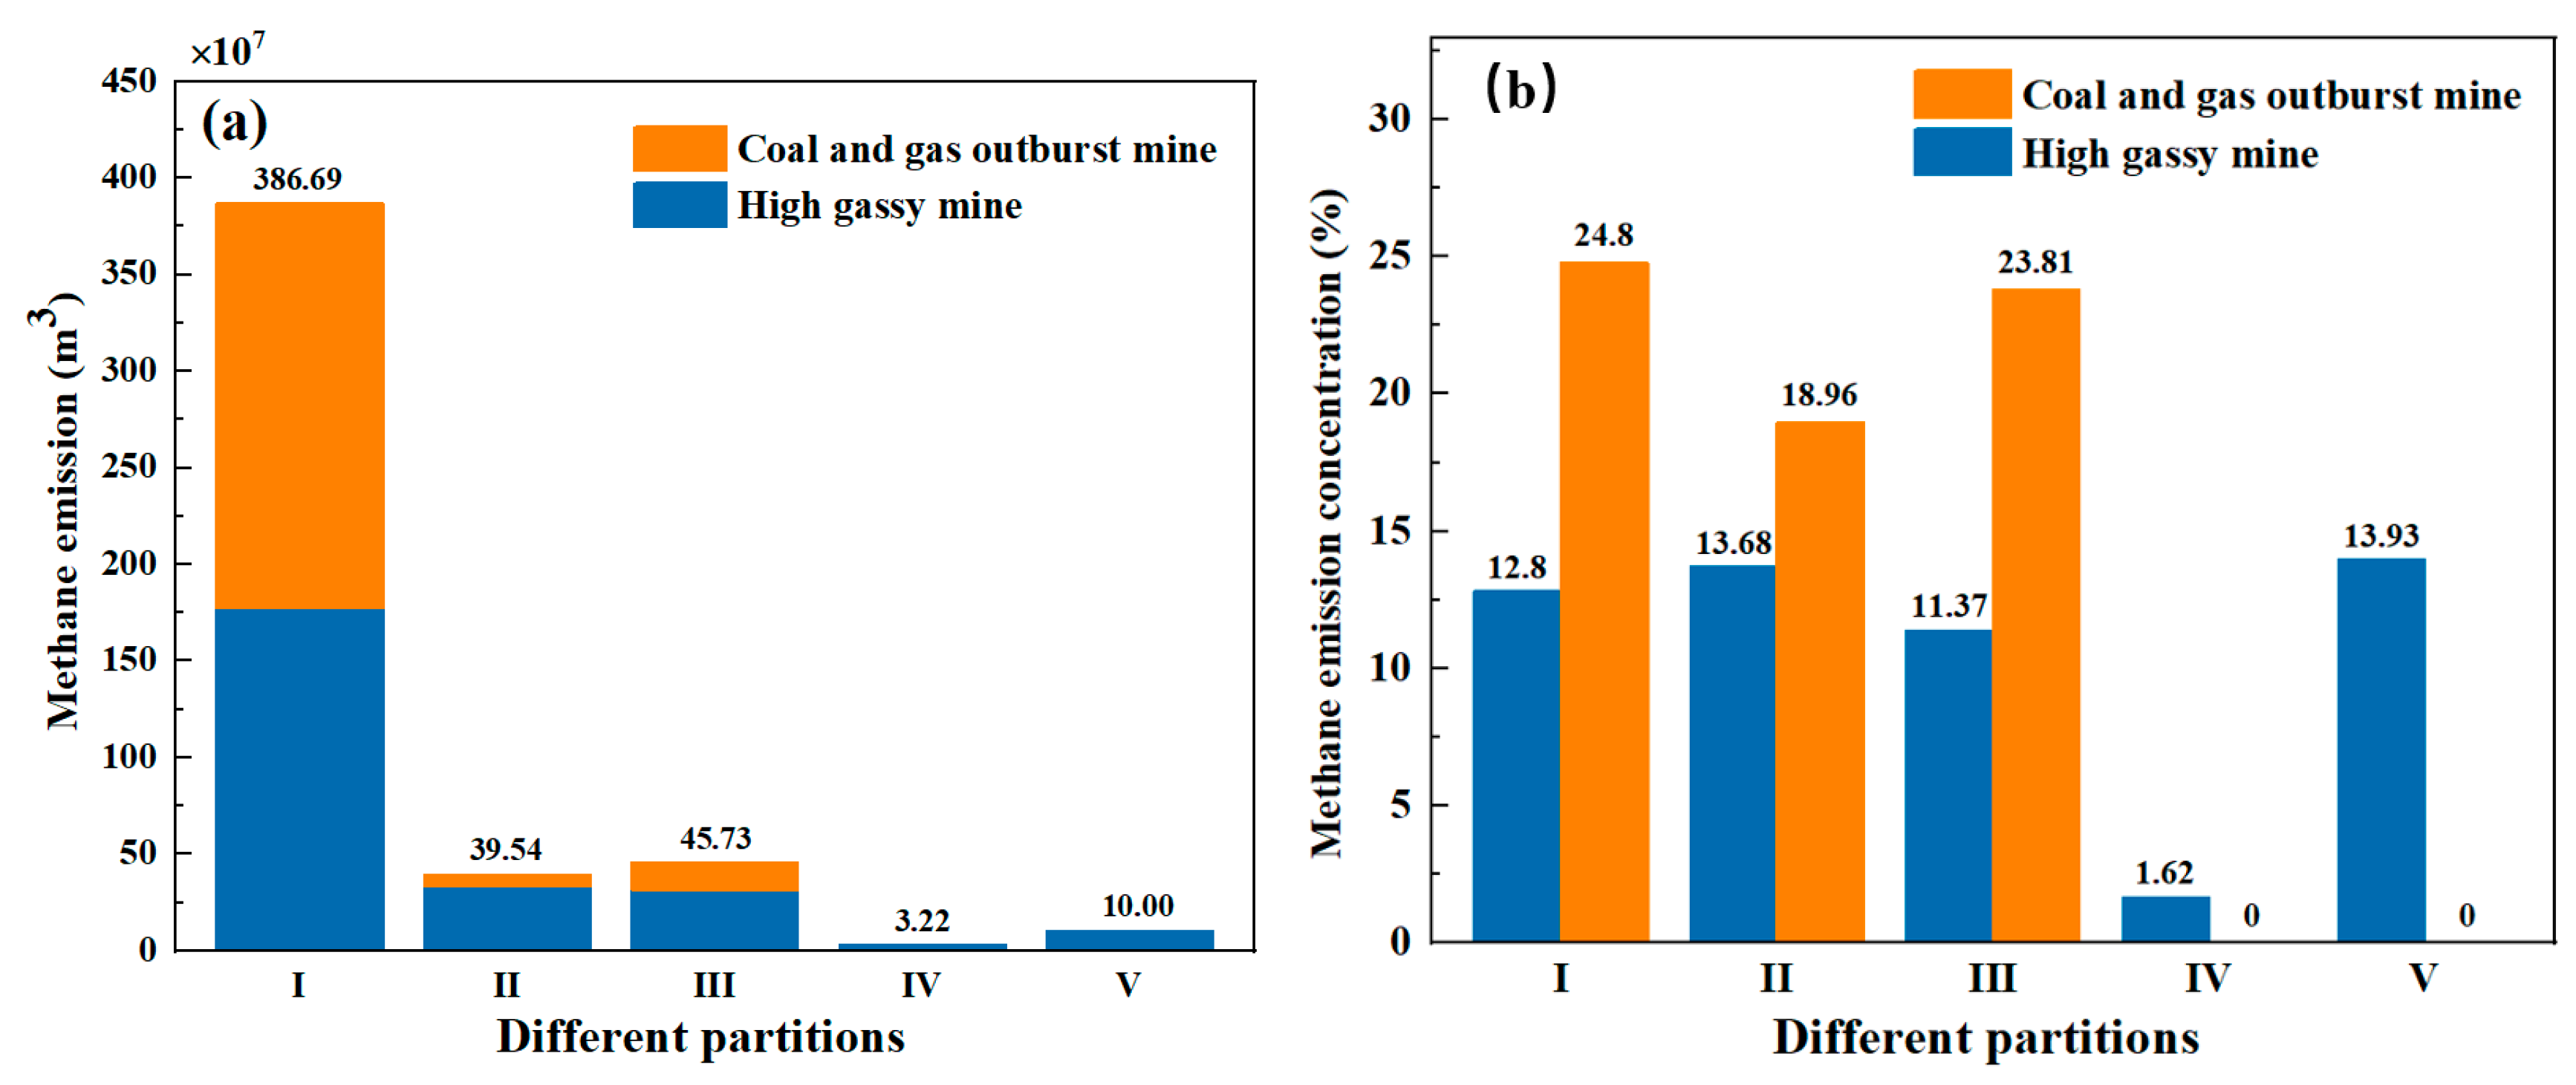
Based on the classification of different types of underground coal mines, the methane emission and average concentration in different mining areas were investigated, as shown in Figure 4a. It can be seen that the methane extraction in high-gas mines in Shanxi is not significantly different from the extraction in coal and gas outburst mines, accounting for 52.6% and 47.4% of the total methane extraction, respectively. The average methane concentration in high-gas mines and coal and gas outburst mines in Shanxi is 10.68% and 22.52%, respectively. These data are significant for estimating the net methane emissions in mining areas. In terms of the average methane emission concentration in each region, the methane emission concentration in high-gas mines is significantly lower than in coal and gas outburst mines. The methane emission concentration in Region I and III of coal and gas outburst mines is equivalent to twice that of high-gas mines.

Figure 4.
(a) Emission and (b) concentration of methane drainage in different grades of gas mines.
The emission and concentration of methane extracted from high-gas mines and coal and gas outburst mines in each region are shown in Figure 4b. From the figure, it can be seen that there is a significant difference in methane extraction between high-gas mines and coal and gas outburst mines in each region. Since no coal and gas outburst mines exist in Regions IV and V, the methane extraction from coal and gas outburst mines is 0. The methane extraction from high-gas mines in Regions II and III is higher than that from coal and gas outburst mines, possibly because these regions have fewer coal and gas outburst mines and no high-gas zones. Although the number of high-gas mines in Region I is significantly higher than that of coal and gas outburst mines, it is equivalent to four times the number of coal and gas outburst mines. However, the methane extraction from coal and gas outburst mines in this region is higher than that from high-gas mines, accounting for approximately 54.1% of the total extraction in this region. This is possibly due to the coverage of the Yangquan–Jincheng high-gas zone in this region and the higher methane content in the mined coal seam, which requires a large amount of methane extraction to ensure mine safety and production.
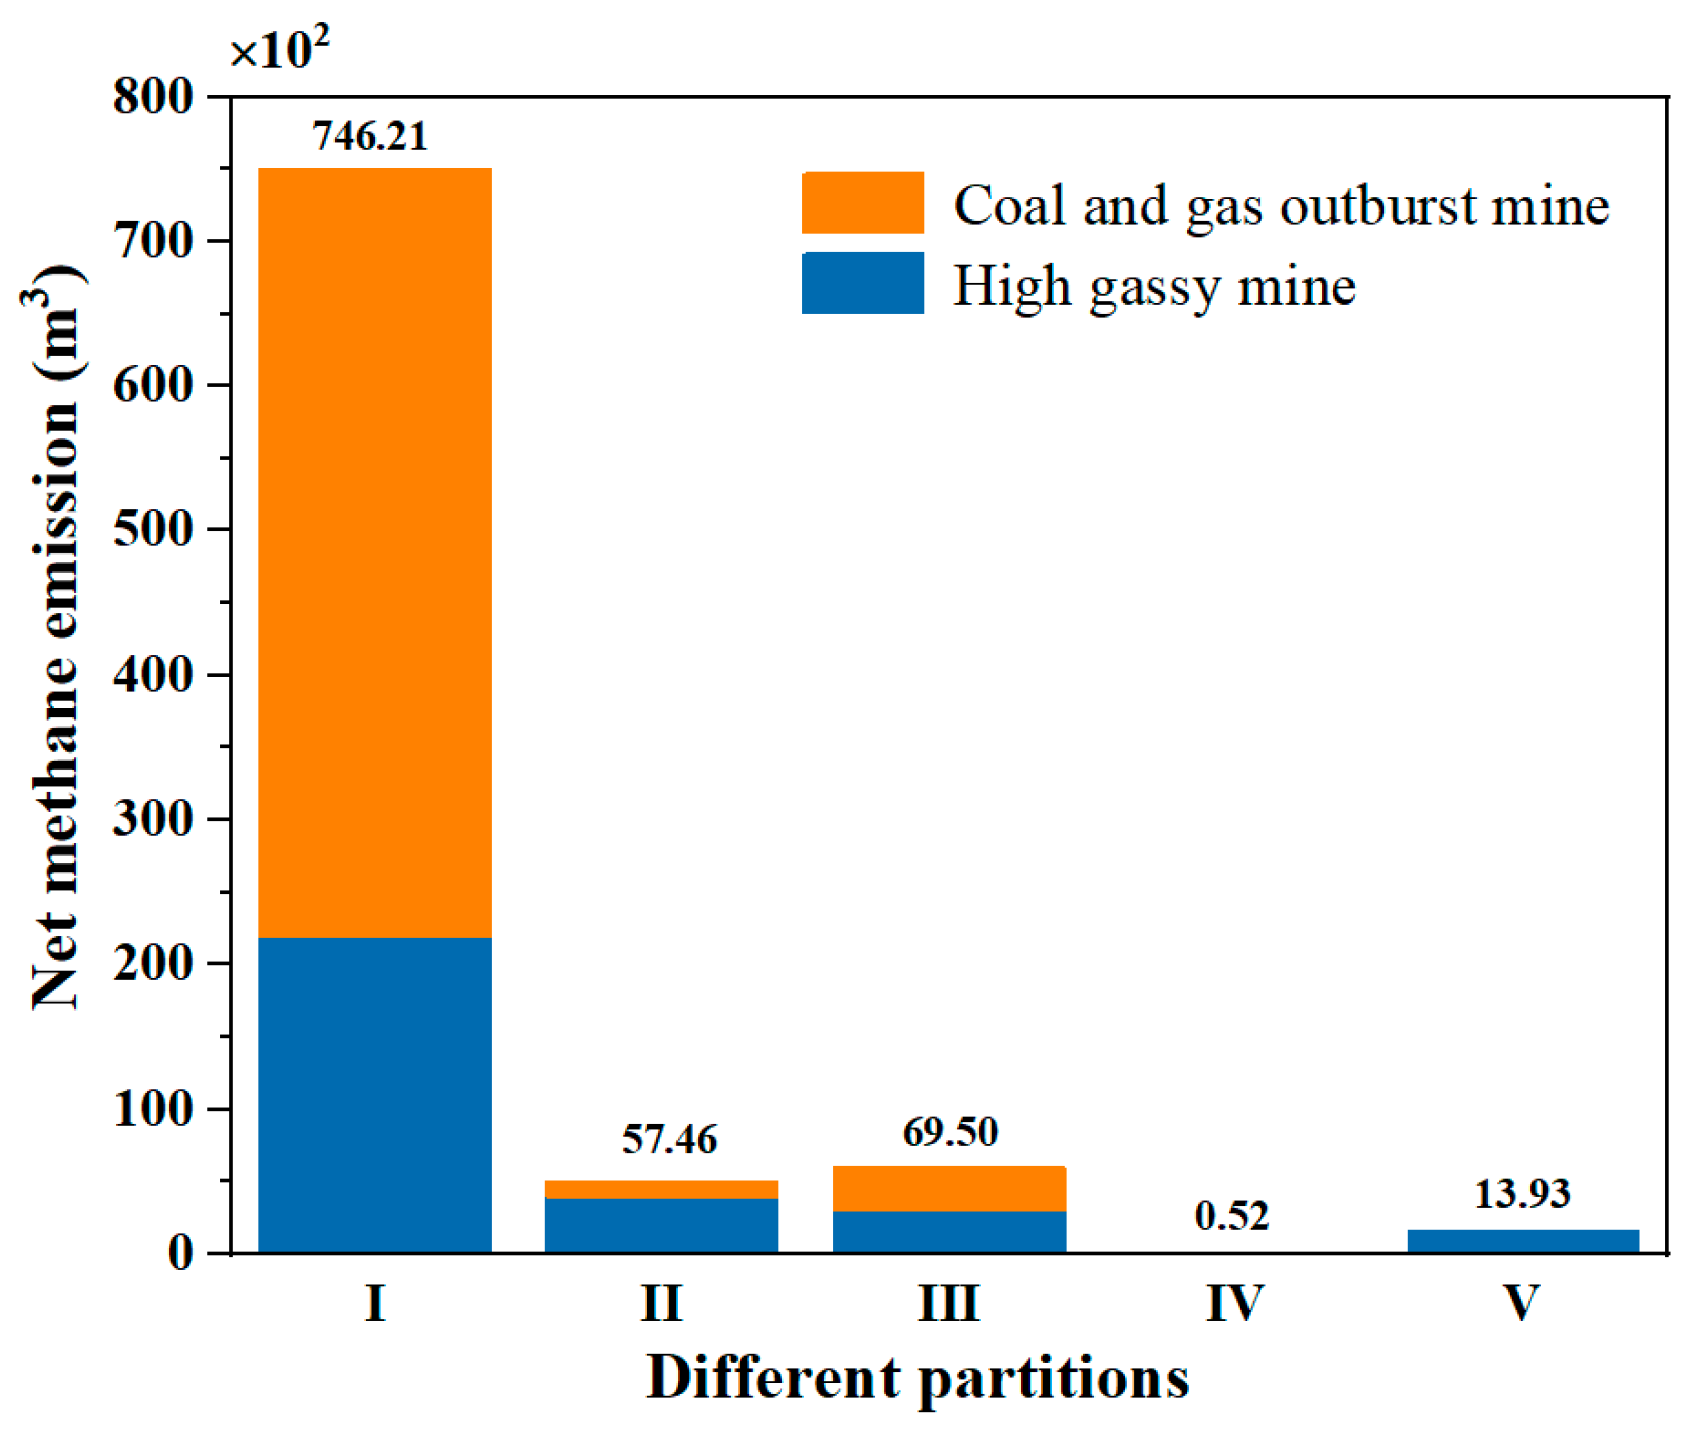
According to the summary of net methane emission and average emission concentration in Figure 4, the net methane emissions and distribution of net methane emissions from classified mines in each region are shown in Figure 5. The figure shows that Region I still has the highest net methane emissions among the five regions, significantly higher than the other four regions, contributing 84% of the total net methane emissions in the province. In terms of net methane emissions in Shanxi Province, the net methane emissions from coal and gas outburst mines are significantly higher than those from high-gas mines, accounting for about 64% of the total net methane emissions. In comparison, the net methane emissions from high-gas mines only account for 36%. The main reason for the higher net methane emissions from coal and gas outburst mines is the higher average emission concentration (reaching 23%). In the future, methane control and emission reduction can start with improving the utilization rate of methane extraction from coal and gas outburst mines.
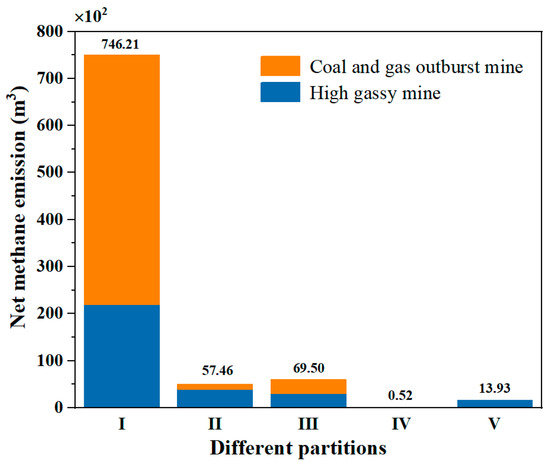
Figure 5.
Summary of net methane drainage from mines by region and category.
3.3. Characteristics and Emission Factor Correction of Methane Emissions from Coal Mines
In the face of specific measured data, the specific methane emissions from coal mines can be obtained through source aggregation. However, obtaining monitoring data from various emission sources is difficult, and there are many issues, such as the lack of monitoring devices at emission sources. A feasible method for quantifying underground coal mine methane emissions is to use the factor method. By multiplying the regionally calculated raw coal production with the aggregated methane emission factor for the region, an estimated amount of coal mine methane emissions can be obtained.
3.3.1. Estimation of Methane Emissions from Key Group Coal Mines
The six major coal mining groups in Shanxi Province were selected in the methane occurrence bands I, II, III, and V, and Formulas (1)–(3) were used to estimate their methane emissions, as shown in Table 3. The trends of methane emissions are shown in Figure 6. From the perspective of coal production, the overall coal production of these groups shows an increasing trend. In contrast, the overall methane emission factors of the coal mines vary, but the changes are relatively small. The coal production of the three groups in Region I is significantly higher than that of the other coal mining groups. On the level of methane emission factors, the overall methane emission factors of groups 1, 2, and 5 are increasing, the emission factors of group 4 remain unchanged, and the emission factors of groups 3 and 6 are decreasing. The methane emission factor of group 4 is the highest among the six groups and significantly higher than the other five groups. The methane emission factors of the three groups in Region I are not high compared to the other six groups. From the perspective of methane emissions, it can be seen from the graph and table that the overall methane emissions of the six major coal mining groups are increasing. Among them, the methane emissions of the three groups in Region I are higher than the other three groups due to their significantly higher coal production. Although the methane emission factors of groups 4 to 6 are relatively high, the methane emissions are relatively low compared to groups 1 to 3 due to their low coal production. Therefore, large coal mining groups in Shanxi should take the corresponding responsibility for methane control and emission reduction. Based on the large coal production base, the methane drainage and ventilation rate should be gradually increased to reduce the methane emission factor and control methane emissions. In the subsequent quantitative process of setting methane emission control targets in Shanxi, it is recommended to conduct demonstration studies on methane emissions from key coal mining groups in Shanxi, first to develop specific methane recovery and utilization targets for coal mines and then to quantify emission reduction targets. It can be seen that quantifying methane emissions from specific coal mining groups is conducive to the scientific formulation of policies and regulations for methane emission reduction in the coal industry.
Table 3.
Table of estimated values of methane emissions from coal mines of the six coal mine groups.
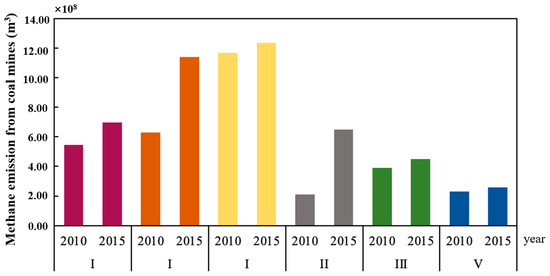
Figure 6.
Trend chart of methane emissions in six major coal mine groups.
3.3.2. Key Coal Mine Offline Methane Emission Monitoring
Offline field surveys were conducted on nine coal mines (seven high-gas mines and two coal and gas outburst mines). The basic information of the surveyed coal mines is shown in Table 4. For this study, three mines in the Lu’an mining area in Region I and one mine in the Liliu mining area in Region II were selected as examples for the quantitative analysis of methane emissions from coal mines. As many samples as possible were chosen from mines with methane outburst zones, with at least a high-gas mine methane grade, and mines where methane extraction is conducted, with good continuity and higher accuracy of mining monitoring data. The following data were collected from each coal mine: methane extraction and coal production plans, including methane extraction utilization rate (%), methane emission concentration (%), monthly coal production (t), actual mining days per month (d), ventilation air volume of each ventilation shaft (m3/min), and methane concentration in ventilation air (%). The underground methane emissions from coal mines mainly come from the mine’s ventilation system and extraction system; thus, the following text will provide a specific quantitative analysis of methane extraction and ventilation.
Table 4.
List of survey coal mine information.
Coalbed Methane Extraction
The methane extraction, utilization, and emissions from mines A, B, C, and G are summarized in Table 5. Among the four mines, mine A has the highest methane extraction volume. Although its utilization rate is also the highest, the emitted methane volume is still considerable, with an average release of 45.70 m3/min and an average methane concentration of 20.77%. Approximately 4.99 million m3/y of pure methane is estimated to be emitted into the atmosphere annually. Mine B has a relatively lower methane extraction volume compared to the other mines, and its methane utilization rate is slightly below the average for Shanxi Province, at 44.3%. The average methane concentration in its emissions is 14.45%. The estimated annual methane emissions into the atmosphere are approximately 2.36 million m3/y. Mine C has the lowest methane utilization rate compared to the other mines, significantly lower than the average for Shanxi Province.
Table 5.
Table of coal mine gas utilization and emission in A, B, C, and G coal mines.
Consequently, it has the highest methane emissions, with an average release of 52.23 m3/min and an average methane concentration of 16.48%. The estimated methane emissions into the atmosphere are approximately 4.52 million m3/y. Mine G has the lowest methane emissions among the four mines, with an average release of 19.65 m3/min and an average methane concentration of 13.03%. The estimated methane emissions into the atmosphere are approximately 1.35 million m3/y.
Methane Emission from Ventilation System
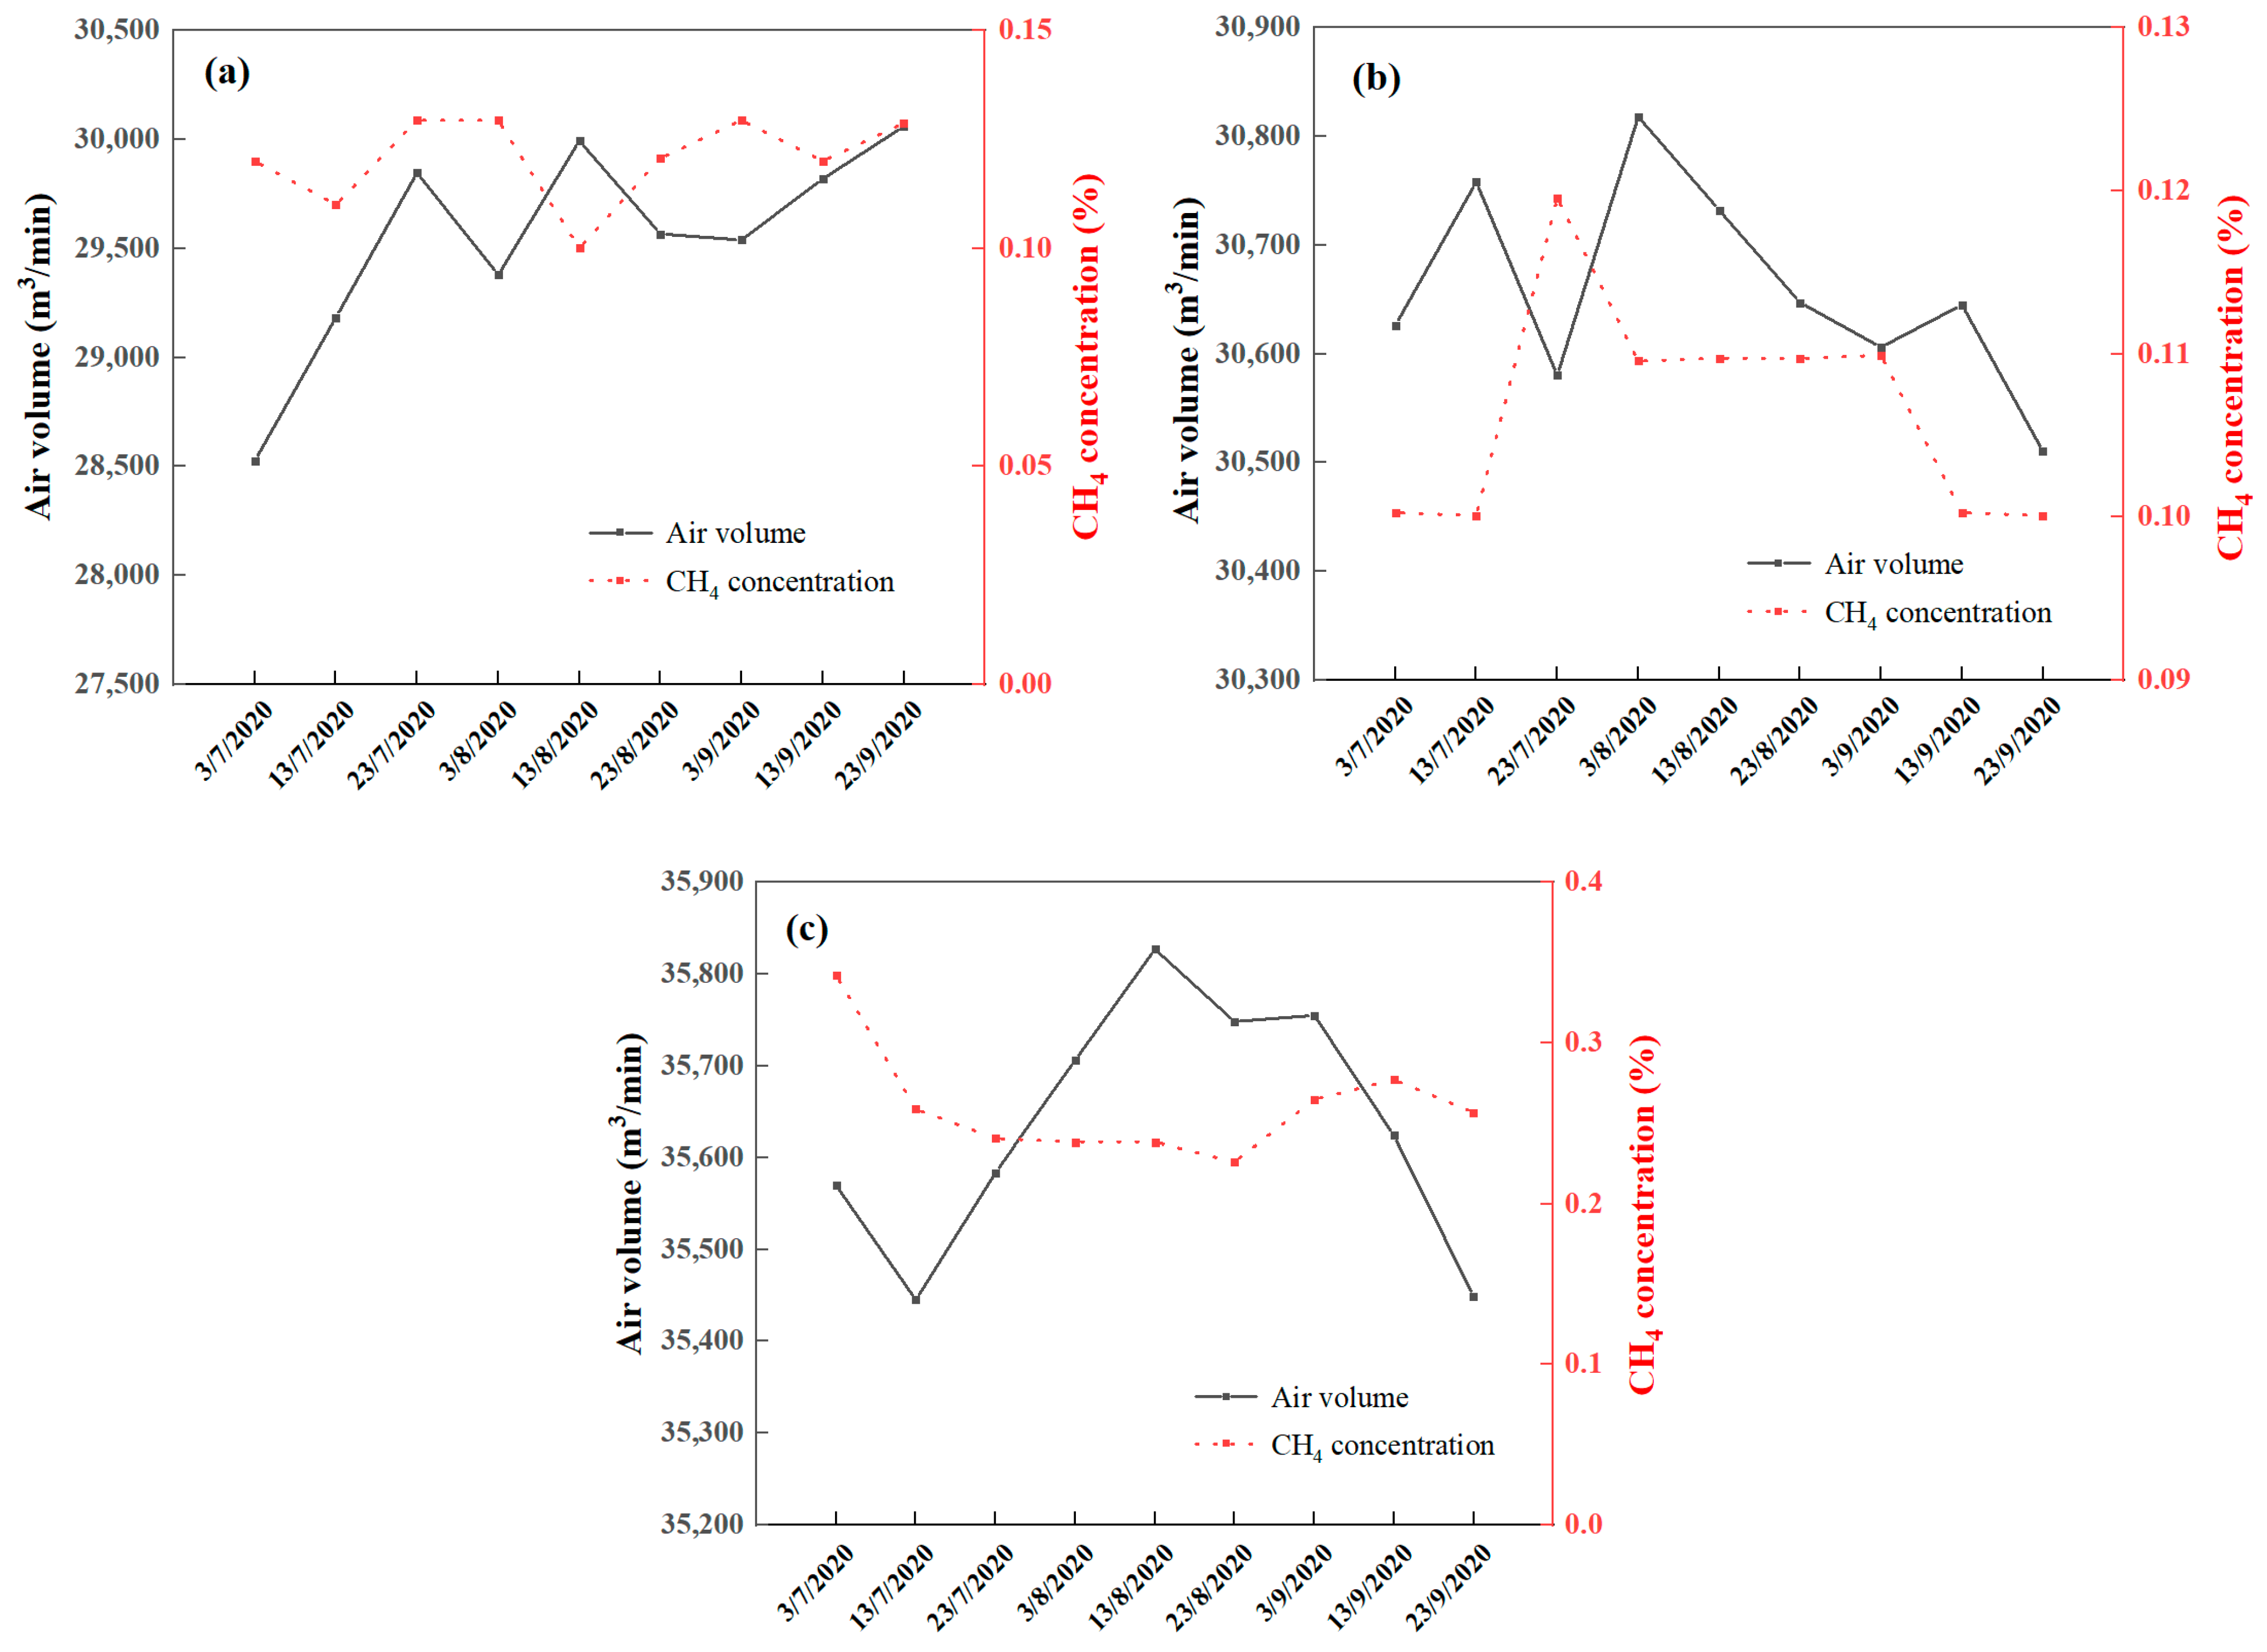
Mine A has three operating ventilation shafts, and the ventilation rates and methane concentrations of the three shafts are shown in Figure 7. According to the trend of ventilation rates and methane concentrations in the figure, it can be seen that when the methane concentration is high, the ventilation rate will increase accordingly to ensure that the methane concentration is maintained at a relatively low and stable level. Although the methane concentrations of the three ventilation shafts in mine A are all changing, the overall VAM concentration remains relatively stable. From July to September 2020, the VAM concentration varied between 0.23% and 0.34% (with an average concentration of 0.26%), and the average flow rate of methane in the ventilation air was 93.45 m3/min. Shaft C has a relatively higher VAM concentration and a larger ventilation rate. The estimated annual methane emissions directly into the atmosphere are about 49.11 million m3/y. Compared to shaft C, shafts A and B have lower VAM concentrations and ventilation rates. The VAM concentration range of shaft A is between 0.10% and 0.13% (with an average concentration of 0.12%), and the average flow rate of methane in the ventilation air is 35.77 m3/min. The VAM concentration of shaft B ranges from 0.10% to 0.12% (with an average concentration of 0.11%), and the average flow rate of methane in the ventilation air is 32.71 m3/min. The estimated annual methane emissions directly into the atmosphere for shafts A and B are 18.8 million m3/y and 17.19 million m3/y, respectively. Based on the data collected for three months, the total methane emissions from mine A to the atmosphere are estimated to be approximately 85.11 million m3/y.
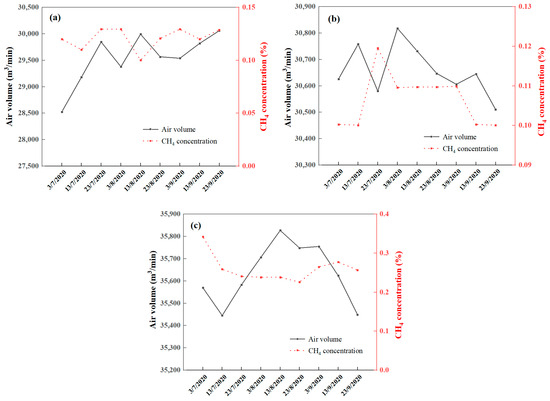
Figure 7.
Air volume and CH4 concentration in (a) ventilation shaft a, (b) ventilation shaft b and (c) ventilation shaft c in coal mine A.
The ventilation shaft of mine B is in operation, and there is only one, located in the west of the mine. According to Figure 8, it can be inferred that the air volume of the ventilation shaft in mine B is significantly smaller than that of mine A, suggesting that the methane content in the coal seam being extracted in mine B is relatively low. From July to September 2020, the VAM concentration in the west shaft ranged from 0.26% to 0.28%, with an average concentration of 0.29%. The average pure methane flow rate is 23.10 m3/min. Mine B is estimated to emit approximately 12.14 million m3/y of VAM into the atmosphere.
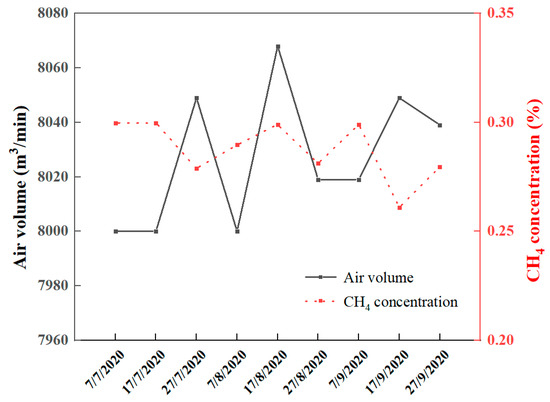
Figure 8.
Air volume and CH4 concentration in west ventilation shaft in coal mine B.
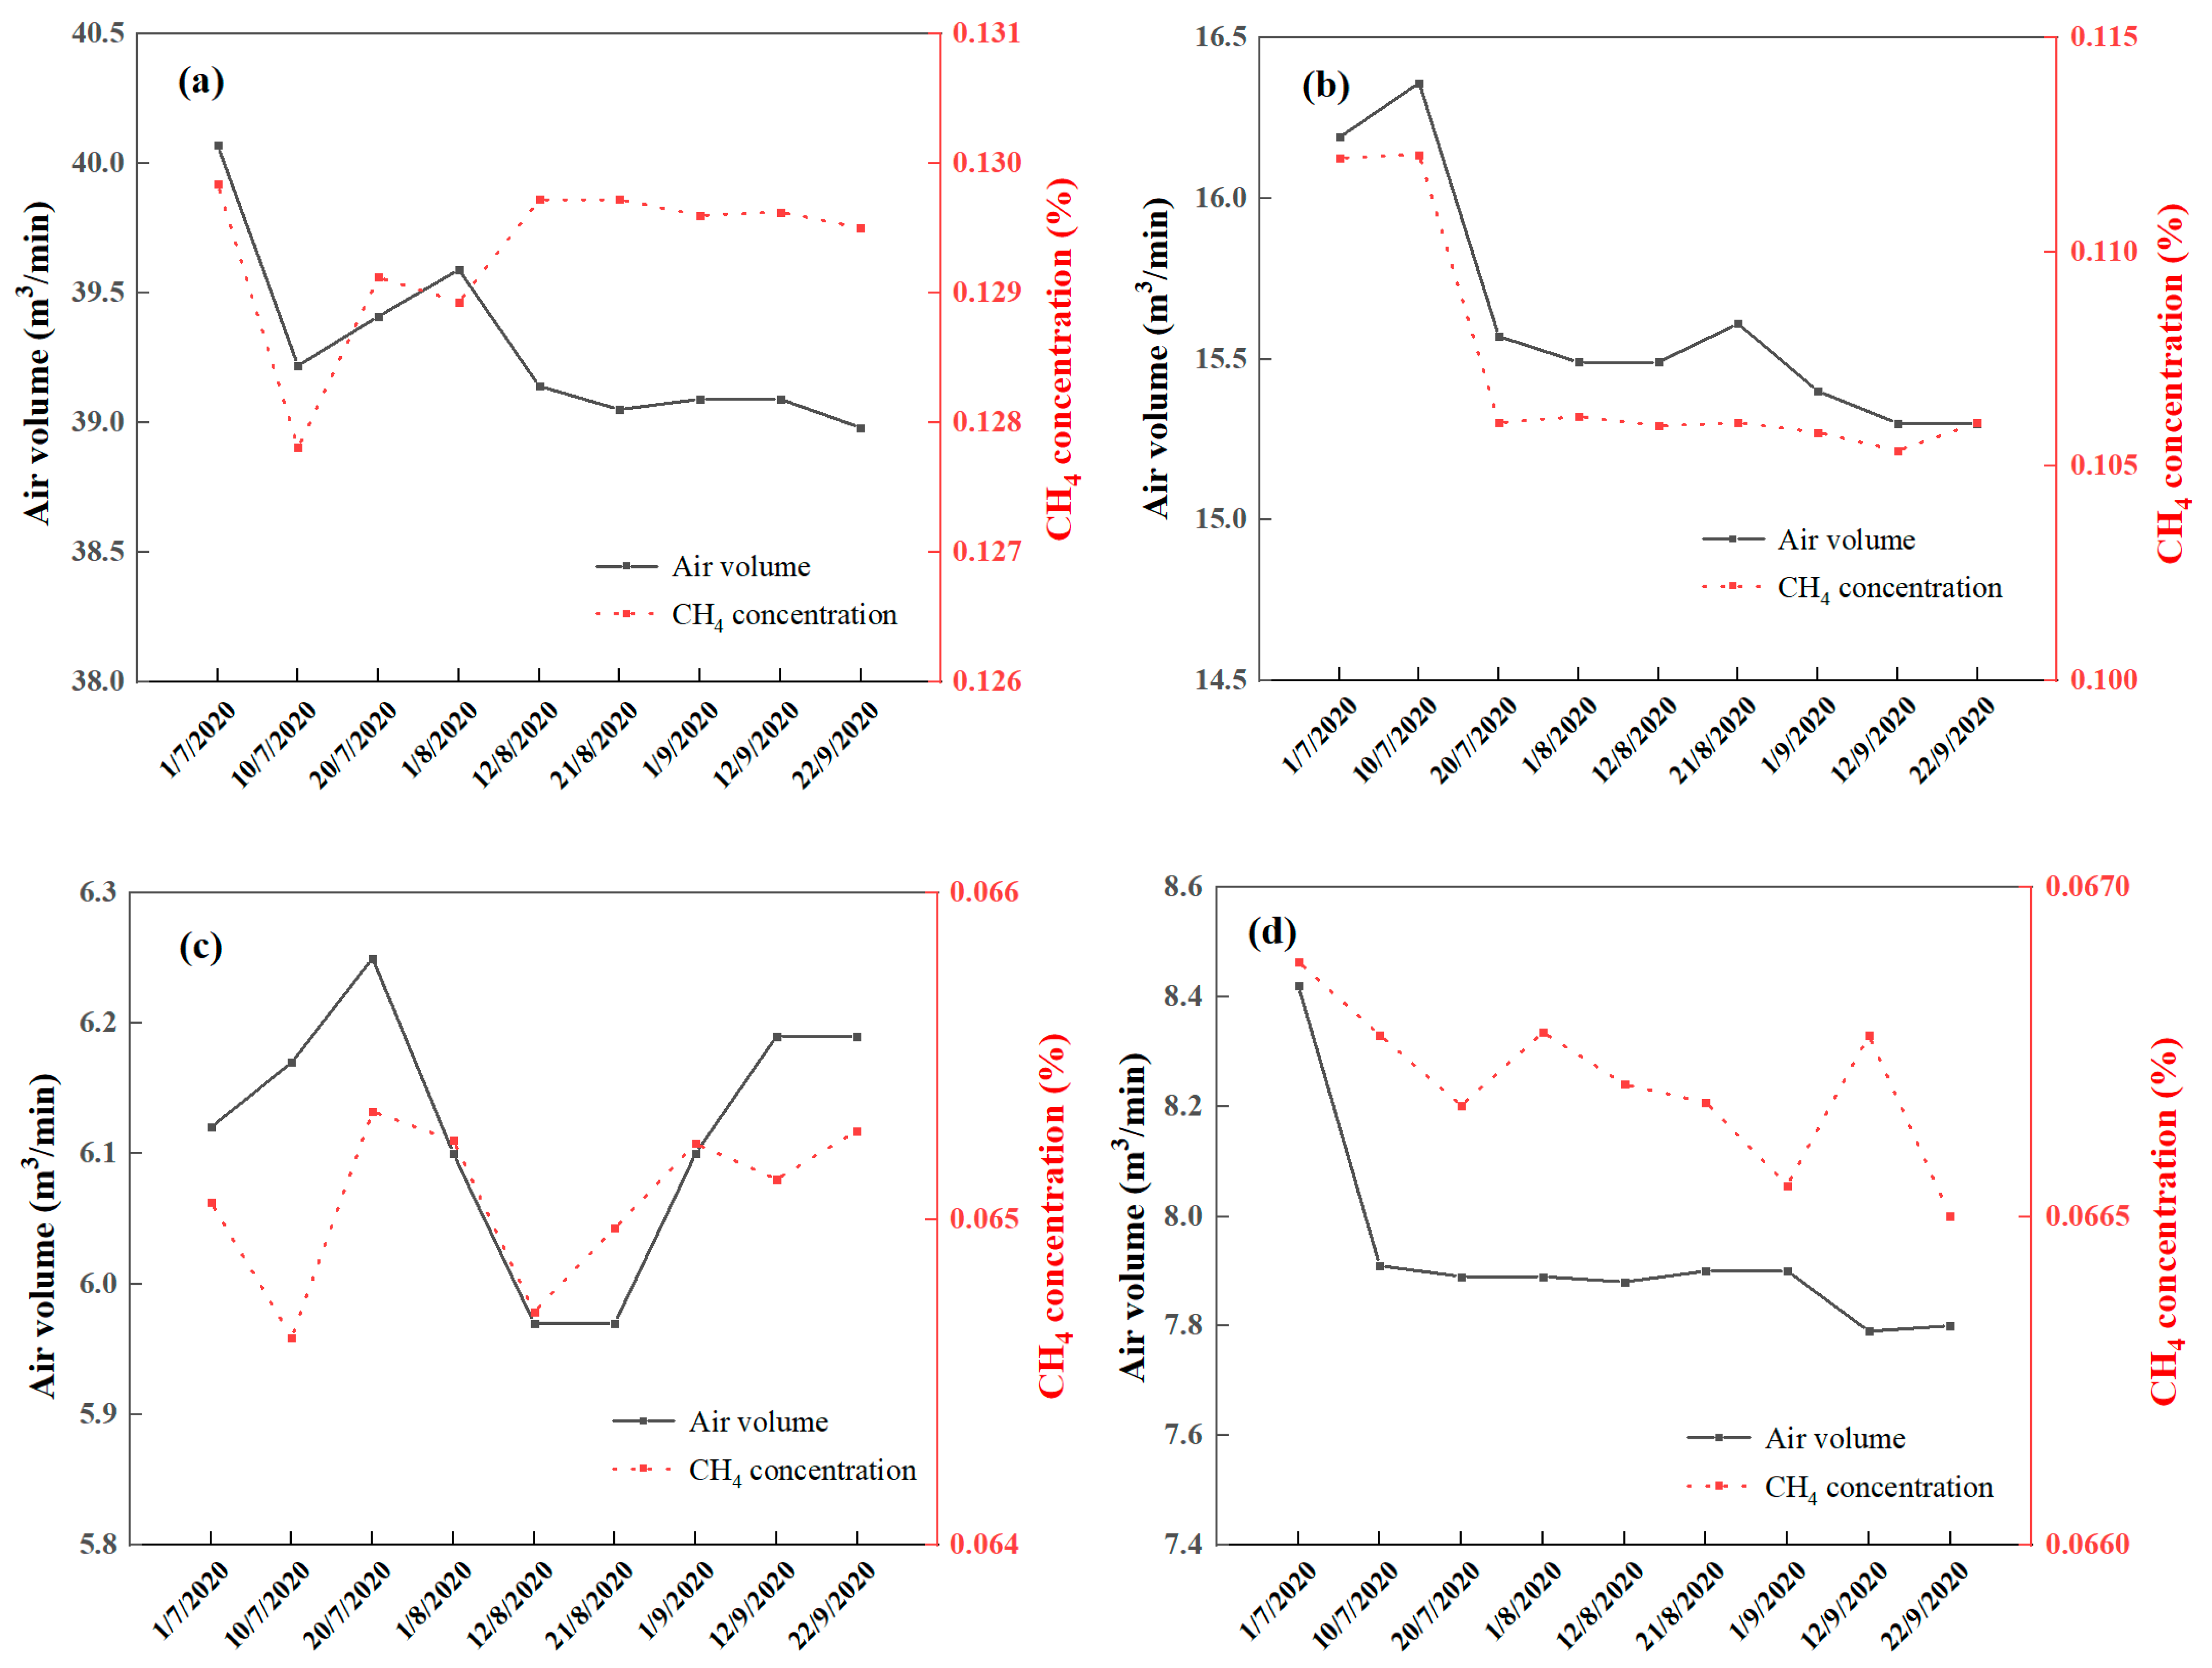
Mine C has four ventilation shafts, and the methane flow rate and concentration of the four ventilation shafts are shown in Figure 9. From July to September 2020, the methane concentration in the four ventilation shafts remained relatively stable with small fluctuations, and the methane flow rate gradually decreased from July to September. From July to September 2020, the VAM concentration in ventilation shaft D ranged from 0.128% to 0.130% (with an average concentration of 0.129%), and the average VAM flow rate was 39.304 m3/min. As shown in the figure below, the methane concentration and methane flow rate of ventilation shaft E showed a consistent trend. The average VAM concentration in ventilation shaft E was 0.107%, ranging from 0.105% to 0.112%, and the average VAM flow rate in the ventilation air was 15.634 m3/min. Ventilation shafts F and G had lower methane concentrations than ventilation shafts D and E. The VAM concentration in ventilation shaft F remained relatively stable at 0.065%, and the average pure methane flow rate in the ventilation air was 6.123 m3/min. The VAM concentration in ventilation shaft G also remained relatively stable at 0.067%, and the average pure methane flow rate in the ventilation air was 7.937 m3/min. The estimated methane emissions directly released into the atmosphere from the four ventilation shafts in C mine C are approximately 20.66 million, 8.22 million, 3.22 million, and 4.17 million m3/year, totaling 36.27 million m3/year.
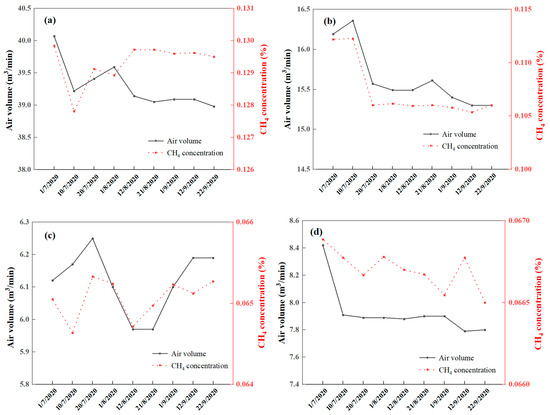
Figure 9.
Air volume and CH4 concentration in (a) ventilation shaft a, (b) ventilation shaft b, (c) ventilation shaft c and (d) ventilation shaft d in coal mine C.
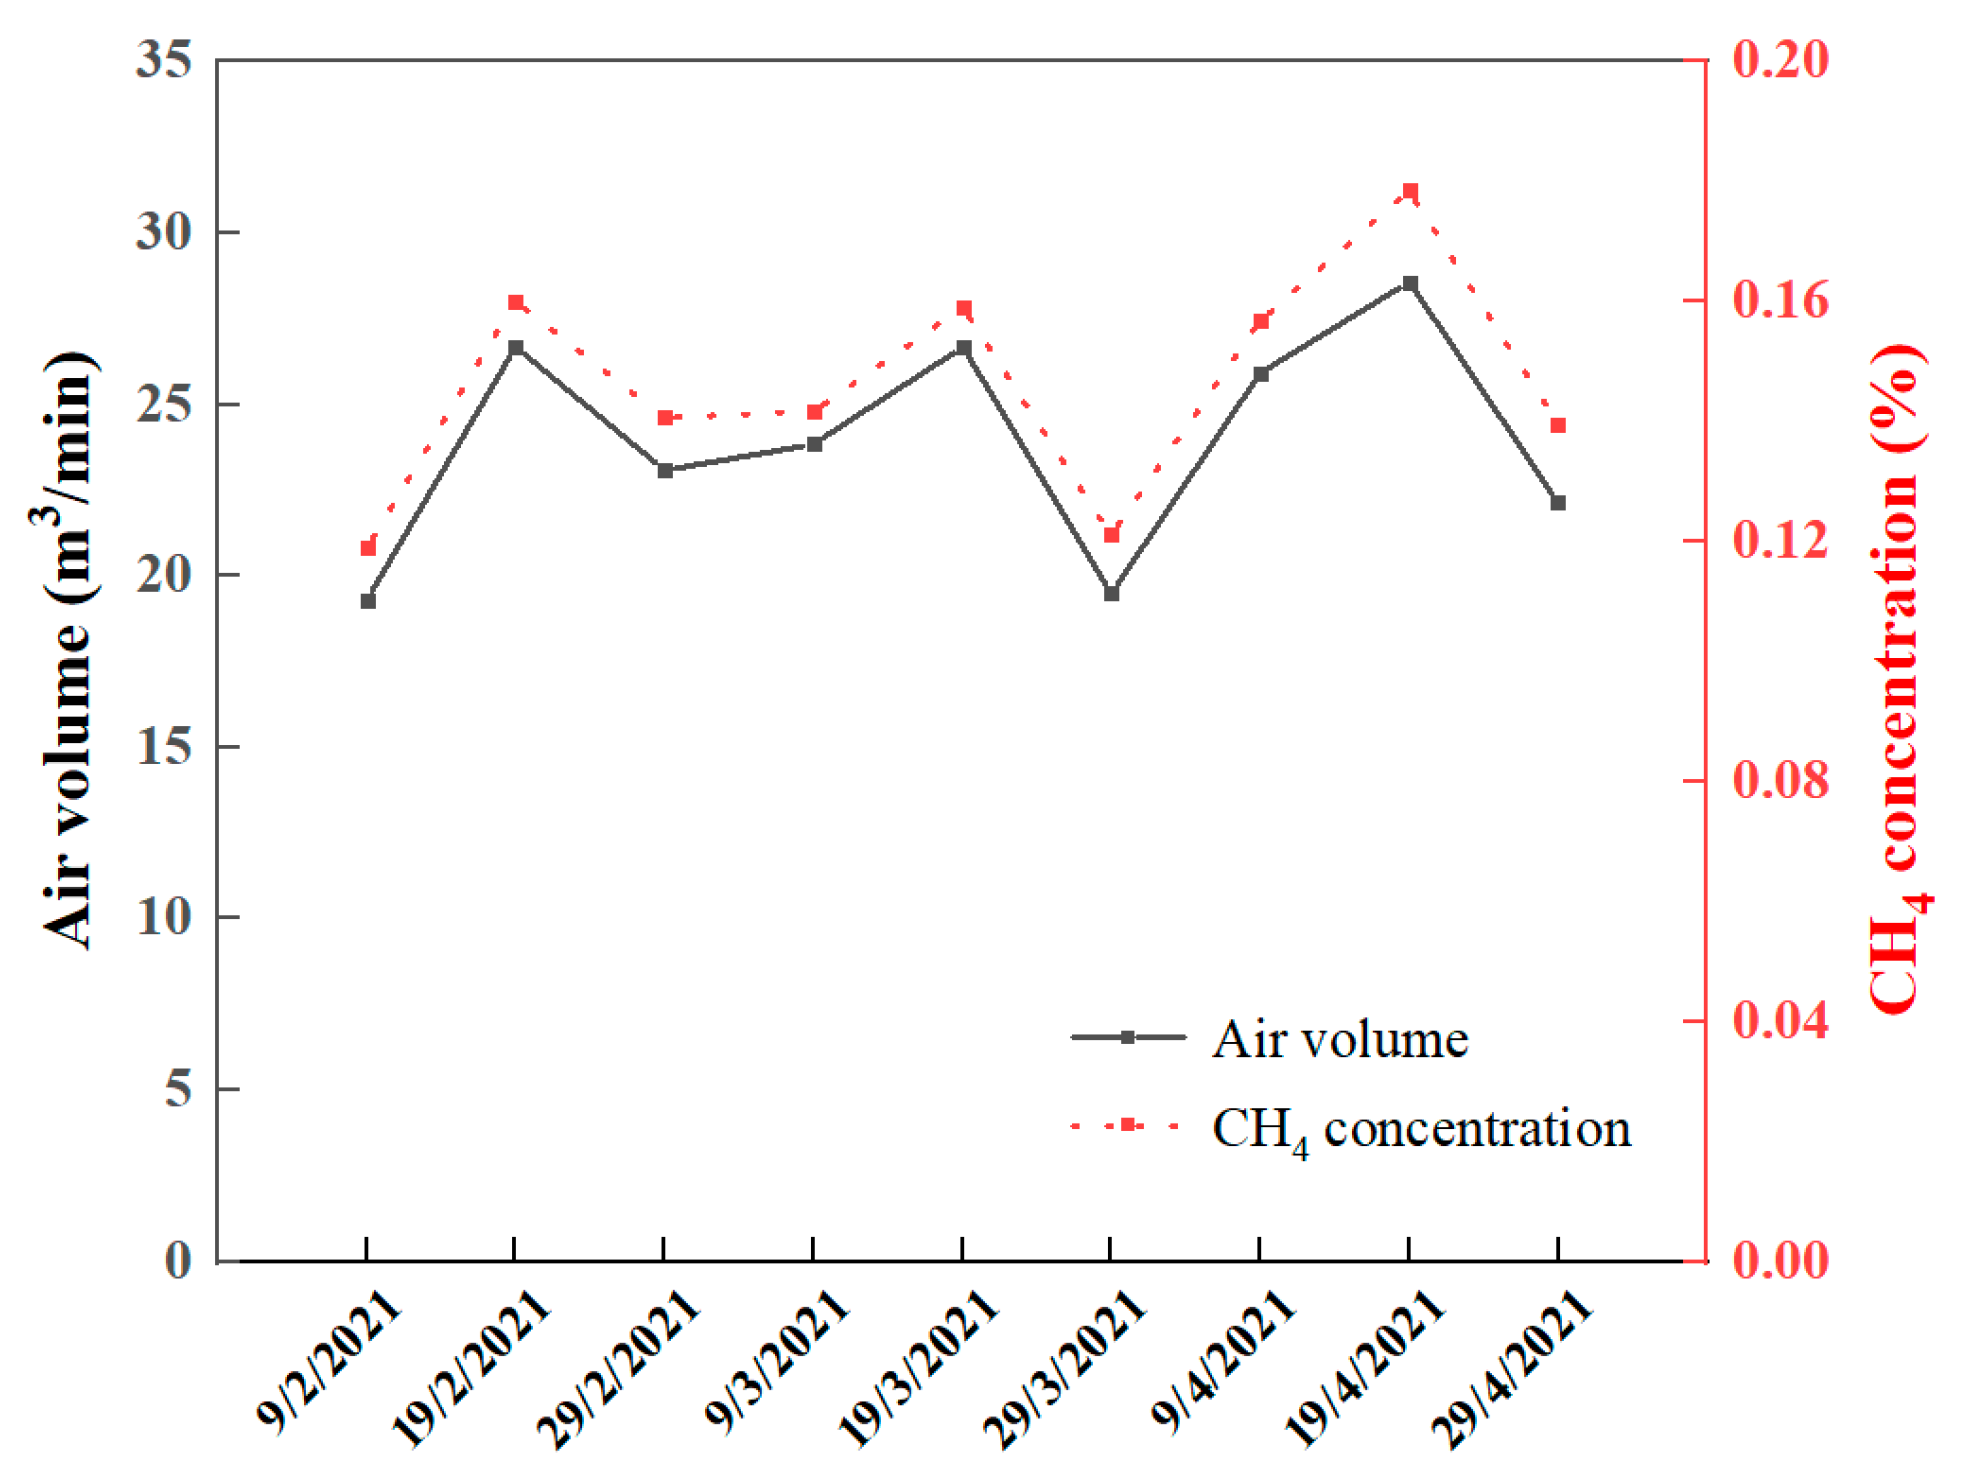
Mine G is a coal and gas outburst mine with only one operating ventilation shaft. Compared to mine C, the total methane emitted by the G mine’s ventilation air is relatively low. Figure 10 shows the trend of methane emissions and methane concentration variations is quite consistent. From February to April 2021, the VAM concentration in the ventilation air ranged from 0.12% to 0.18%, with an average concentration of 0.15%. The average pure methane flow rate is 24.07 m3/min. The G mine is estimated to emit approximately 12.65 million m3/y of VAM into the atmosphere.
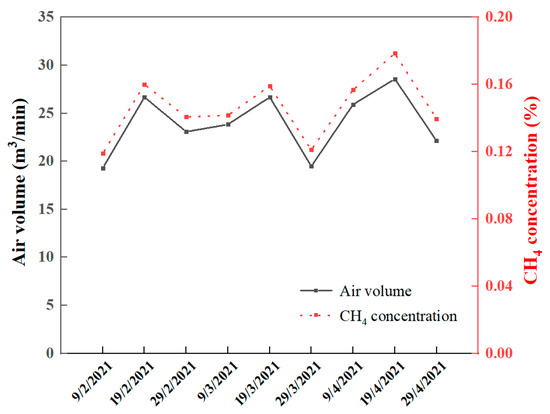
Figure 10.
Air volume and CH4 concentration in ventilation shaft in coal mine G.
The total amount of methane extracted and released to the atmosphere from the four coal mines was summarized with a methane density of 0.675 kg/m3. Mine A emits approximately 60,800 tons of pure methane annually into the atmosphere, equivalent to 1.52 million tons per year of carbon dioxide equivalents. Mine B releases around 9800 tons of methane annually, equivalent to 0.25 million tons of carbon dioxide equivalents per year. Mine C emits approximately 27,500 tons of methane annually, equivalent to 0.69 million tons of carbon dioxide equivalents per year. Mine G releases about 9500 tons of methane annually, equivalent to 0.24 million tons of carbon dioxide equivalents per year. It is evident that when converted to carbon dioxide equivalents, methane emissions have a relatively high global warming potential. Therefore, efforts should be made to increase the utilization of methane recovery in coal mines. Additionally, controlling non-carbon dioxide greenhouse gases such as methane has the advantages of low emission reduction costs, fast response speed, and significant synergistic benefits. Reducing methane emissions from coal mines is significant in mitigating climate change.
3.3.3. Key Coal Mine Methane Emissions Factor Correction
This study investigated nine mines, with mines A–E from the Lu’an mining area, mine F from the Jincheng mining area, mines G and I from the Liuliuhua mining area, and mine H from the Huozhou mining area. Mines A–F are located in Region I. Mines G and I are located in Region II. Mine H is located in Region V. Based on the calculation method of coal mine methane emission factors, specific methane emission factors for certain coal mines were calculated using the collected offline measured data, as shown in Table 6.
Table 6.
Summary of methane emission factors for surveyed coal mines.
The results of calculating the coal mine methane emission factors are shown in Table 7 using Formulas (2)–(4). It can be observed that there is a relatively significant change before and after the correction. Calculating the coal mine methane emission factors using the corrected formula facilitates a more accurate estimation of underground coal mine methane emissions. It also allows for the determination of the specific contribution of underground coal mine methane emissions, which provides a reference for formulating industry-wide methane control and emission reduction policies.
Table 7.
Summary of revised methane emission factors for surveyed coal mines.
3.4. Prediction of Coal Mine Methane Emissions
Numerous factors affect the methane emission factor of coal mines. The coal mining type, underground geological structure, and coal quality generally do not vary significantly in the short term for a specific mine. However, the methane emission factor variation in coal mines depends more on the depth of coal seam burial, mining methods, and methane utilization technology. Through previous scholars’ research on the calculated methane emission factor data of Shanxi coal mines, the Metabolic GM(1, 1) model was used to predict the methane emission factors of Shanxi Province coal mines from 2016 to 2025 [25,26,27]. According to the official website of the National Bureau of Statistics, the coal production in Shanxi Province in 2018 was 893.4 million tons. Using an approximate formula for the coal production factor, the 2018 coal mine methane emission factor is roughly 8.955 m3/t. Based on these data, adjustments were made to the prediction of the GM(1, 1) model for metabolic analysis, and the results are shown in Table 8. The table shows that the methane emission factor of Shanxi coal mines is steadily increasing in the coming years. There are multiple factors that affect methane emission factors in coal mines, and the interaction between these factors is complex, making accurate prediction difficult. Based on the analysis of the factors influencing methane emission factors in coal mines, as coal production continues to increase and mining depths continue to deepen, this leads to an increase in methane emissions per ton of coal extracted.
Table 8.
Prediction and revised results of coal mine methane emission factors in Shanxi.
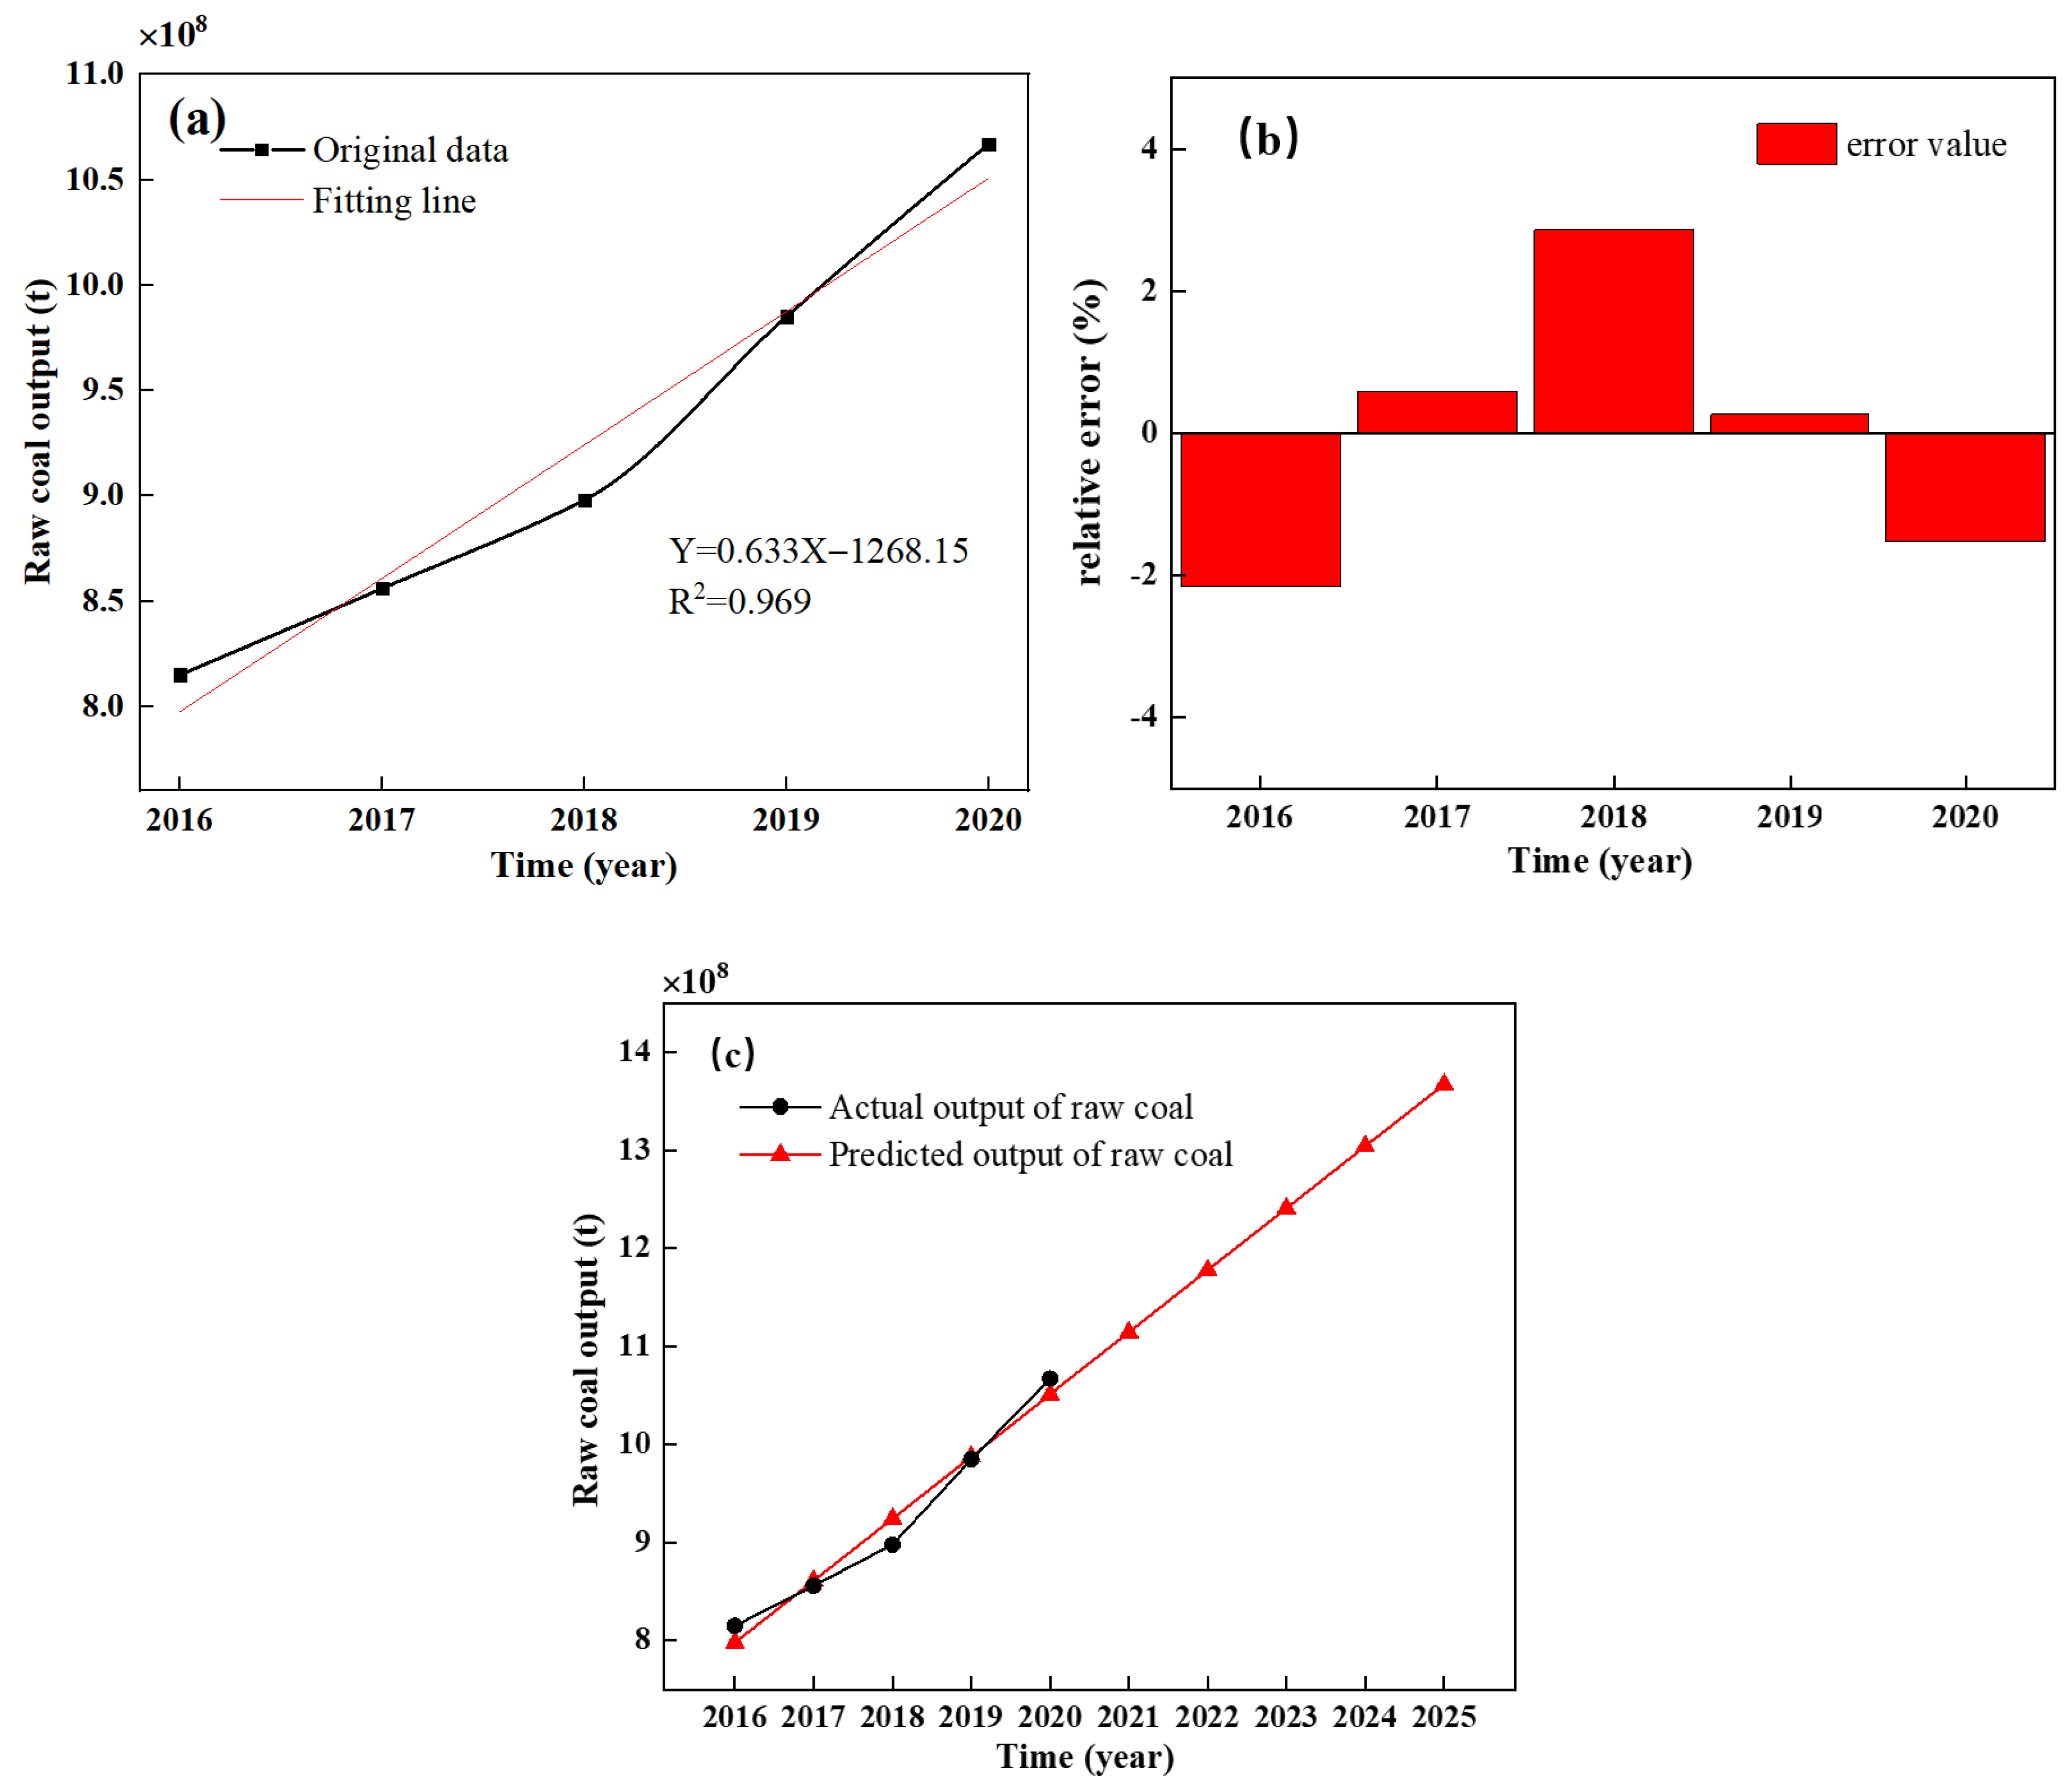
In order to further predict the methane emissions from coal mines in Shanxi Province, the trend of coal production over time was forecasted based on the collected coal production data from 2016 to 2020 in Shanxi Province. Considering the linear characteristics of the time series data of coal production and based on previous studies and fitting accuracy, a linear fitting model was selected to establish the prediction model for coal production in Shanxi Province. The fitting graph of coal production and the corresponding error are shown in Figure 11. It can be seen from the graph that the fitting equation for coal production is Y = 0.633X − 1268.15, with an error within 3%, indicating that the linear model has a good fitting effect. Based on the established linear fitting model, the coal production from 2016 to 2025 was predicted, and the coal production forecast graph is shown in Figure 11c. It can be seen from the graph that the growth rate of coal production from 2019 to 2020 is twice that of the period from 2016 to 2018. At the same time, according to the prediction results, the average growth rate of coal production in Shanxi Province is 4.85%, and coal production is predicted to reach 1.347 billion tons in 2025.
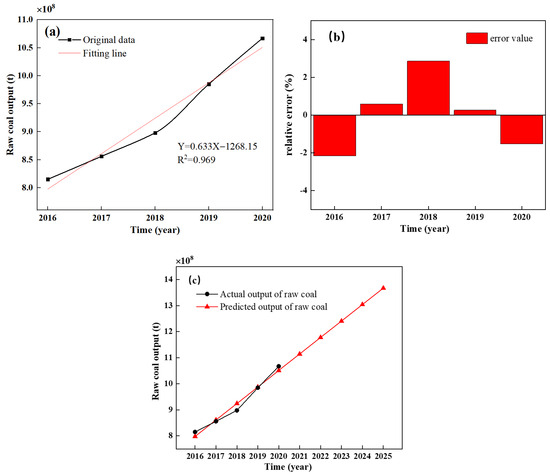
Figure 11.
(a) Fitting diagram, (b) error diagram and (c) prediction diagram of raw coal output.
According to the linear regression prediction model for raw coal production and the GM (1, 1) metabolic model for methane emission factor in coal mines, a prediction model for methane emission in coal mines is established, which can estimate and predict the methane emission in Shanxi Province by multiplying the predicted values of the two models using the method of raw coal production. According to the results of the prediction model and the methane emission in coal mines in Shanxi Province from 2016 to 2025, as shown in Table 9, the total methane emissions in coal mines will reach 9.6 billion m3 in 2020, equivalent to 6.38 Tg (assuming a density of 0.675 kg/m3). By 2025, the methane emissions in coal mines will reach 12.3 billion m3, which is equivalent to 8.43 Tg, and a large amount of methane will be emitted into the atmosphere, wasting resources and accelerating the process of global warming. Figure 12 shows the predicted methane emissions and uncertainty analysis of coal mines in Shanxi Province, from which it can be seen that methane emissions and methane growth rate increase year by year. Monte Carlo model calculations show that methane emissions conform to a normal distribution, indicating that the calculation method has some accuracy.
Table 9.
Table of estimated and predicted methane emissions from coal mines in Shanxi.
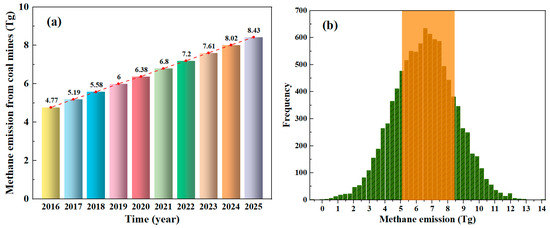
Figure 12.
(a) Prediction of methane emission and (b) uncertainty analysis (Yellow areas are within the predicted values) from coal mines in Shanxi Province.
4. Conclusions
This study combines the geological laws of methane and divides the region based on the methane geological map of Shanxi Province. The methane emissions from coal mines in the province are analyzed and calculated by region and dimension. The formula model for methane emission factors in coal mines is modified and supplemented, and the methane emissions from key coal mines are calculated. At the same time, based on the regional emission factor and the original coal production method, a prediction model is established to predict methane emissions from coal mines in Shanxi Province. The results show that the number of high-gas and coal and gas outburst mines in Region I of Shanxi Province is significantly higher than in other regions, and the coal seam predicted reserve abundance is also the highest. Methane extraction is mainly emitted through surface extraction, and the magnitude of the total methane extraction is not directly related to the choice of extraction method. There is not much difference in methane extraction between high-gas mines and coal and gas outburst mines in Shanxi, but at the average concentration level of methane extraction, coal and gas outburst mines are twice as high as high-gas mines, with average concentrations of methane extraction of 22.52% and 10.68%, respectively. The methane emission from coal and gas outburst mines accounts for about 64% of the total net methane emission, while high-gas mines account for 36%. The predicted methane emission factor from Shanxi coal mines has increased from 8.859 m3/t in 2016 to 9.136 m3/t in 2025. Based on the development trend in recent years, the methane emission factor from Shanxi coal mines is expected to maintain steady growth in the next five years, and the methane emission from Shanxi coal mines will reach 8.43 Tg in 2025. Because of the characteristics of methane emissions, technological innovation should be encouraged, and research on the use of low-concentration coal mine methane should be supported through industrial funds, science and technology special funds, and other means to improve scientific research inputs; enterprises should be encouraged to generate coal mine methane power for self-consumption, and preferential policies should be implemented to reduce the cost of energy saving and emission reduction; local standards for methane emission control in the coal industry should be designated, and the target of methane emission reduction in the coal mines should be quantitatively defined; finally, the monitoring system for methane emission by enterprises should be improved, and an inventory of the data of methane emission in the energy industry should be set up.
Author Contributions
Conceptualization, X.Z.(Xueli Zhang) and T.Z.; investigation, X.Z. (Xueli Zhang) and T.Z.; writing—original draft preparation, X.Z. (Xueli Zhang) and N.Y.; writing—review and editing, X.Z. (Xueli Zhang), T.Z., B.Y., C.L., Z.Z., Z.Y. and X.Z.(Xing Zhang). All authors have read and agreed to the published version of the manuscript.
Funding
This work was financially supported by the National Natural Science Foundation of China (No. 52270114), the Natural Resources Defense Council (NRDC), the College Students’ Innovation and Entrepreneurship Training Program (202303001), and the China University of Mining and Technology (Beijing) Top-notch Innovative Talents Training Fund for Doctoral Students (No. BBJ2023035).
Institutional Review Board Statement
Not applicable.
Informed Consent Statement
Not applicable.
Data Availability Statement
The datasets supporting the conclusions of this article are included within the article and its additional file.
Conflicts of Interest
The authors declare no conflict of interest.
References
- Zhang, S.; Ma, J.; Zhang, X.; Guo, C. Atmospheric remote sensing for anthropogenic methane emissions: Applications and research opportunities. Sci. Total Environ. 2023, 893, 164701. [Google Scholar] [CrossRef] [PubMed]
- Zhang, J.; Lin, H.; Li, S.; Yang, E.; Ding, Y.; Bai, Y.; Zhou, Y. Accurate gas extraction (AGE) under the dual-carbon background: Green low-carbon development pathway and prospect. J. Clean. Prod. 2022, 377, 134372. [Google Scholar] [CrossRef]
- Sadavarte, P.; Pandey, S.; Maasakkers, J.D.; Lorente, A.; Borsdorff, T.; van der Gon, H.D.; Houweling, S.; Aben, I. Methane Emissions from Superemitting Coal Mines in Australia Quantified Using TROPOMI Satellite Observations. Environ. Sci. Technol. 2021, 55, 16573–16580. [Google Scholar] [CrossRef]
- Commissions, E. Global Methane Pledge Ministerial at COP27. 2022. Available online: https://ec.europa.eu/commission/presscorner/detail/en/SPEECH_22_6995 (accessed on 1 April 2023).
- Chai, X.; Tonjes, D.J.; Mahajan, D. Methane emissions as energy reservoir: Context, scope, causes and mitigation strategies. Prog. Energy Combust. Sci. 2016, 56, 33–70. [Google Scholar] [CrossRef]
- Saint-Vincent, P.M.B.; Pekney, N.J. Beyond-the-Meter: Unaccounted Sources of Methane Emissions in the Natural Gas Distribution Sector. Environ. Sci. Technol 2019, 54, 39–49. [Google Scholar] [CrossRef] [PubMed]
- EPA, U. Importance of Methane. 2016. Available online: https://www.epa.gov/gmi/importance-methane (accessed on 1 April 2023).
- Montzka, S.A.; Dlugokencky, E.J.; Butler, J.H. Non-CO2 greenhouse gases and climate change. Nature 2011, 476, 43–50. [Google Scholar] [CrossRef] [PubMed]
- Saunois, M.; Stavert, A.R.; Poulter, B.; Bousquet, P.; Canadell, J.G. The Global Methane Budget 2000–2017. Earth Syst. Sci. Data 2020, 12, 1561–1623. [Google Scholar] [CrossRef]
- Derwent, R.G. Global Warming Potential (GWP) for Methane: Monte Carlo Analysis of the Uncertainties in Global Tropospheric Model Predictions. Atmosphere 2020, 11, 486. [Google Scholar] [CrossRef]
- Pörtner, H.O.; Roberts, D.C.; Tignor, M.M.B.; Poloczanska, E.S.; Mintenbeck, K. Climate Change 2022: Impacts, Adaptation and Vulnerability. Available online: https://www.ipcc.ch/report/ar6/wg2/resources/press/press-release/ (accessed on 1 April 2023).
- Karacan, C.O. Predicting methane emissions and developing reduction strategies for a Central Appalachian Basin, USA, longwall mine through analysis and modeling of geology and degasification system performance. Int. J. Coal Geol. 2023, 270, 104234. [Google Scholar] [CrossRef]
- Magdalena Tutak, J.B. Forecasting Methane Emissions from Hard Coal Mines Including the Methane Drainage Process. Energies 2019, 12, 3840. [Google Scholar] [CrossRef]
- Sławomir Kędzior, M.D. Methane occurrence, emissions and hazards in the Upper Silesian Coal Basin, Poland. Int. J. Coal Geol. 2019, 211, 103226. [Google Scholar] [CrossRef]
- Yu, J.; Peng, S.; Chang, J.; Ciais, P.; Dumas, P.; Lin, X.; Piao, S. Inventory of methane emissions from livestock in China from 1980 to 2013. Atmos. Environ. 2018, 184, 69–76. [Google Scholar] [CrossRef]
- Natiaonal Bureau of Statistics of China. China Statistical Yearbook, 2015–2022. Available online: http://www.stats.gov.cn/sj/ndsj/2022/indexch.htm (accessed on 1 April 2023).
- Cao, X. Policy and regulatory responses to coalmine closure and coal resources consolidation for sustainability in Shanxi, China. J. Clean. Prod. 2017, 145, 199–208. [Google Scholar] [CrossRef]
- Qian, Z.; Yang, Y.; Li, P.; Wang, J.; Rodrigues, A.E. An improved vacuum pressure swing adsorption process with the simulated moving bed operation mode for CH4/N2 separation to produce high-purity methane. Chem. Eng. J. 2021, 419, 129657. [Google Scholar] [CrossRef]
- Ursueguía, D.; Díaz, E.; Ordóñez, S. Adsorbents selection for the enrichment of low-grade methane coal mine emissions by temperature and pressure swing adsorption technologies. J. Nat. Gas Sci. Eng. 2022, 105, 104721. [Google Scholar] [CrossRef]
- Bo Lan, Y.L. Numerical study on thermal oxidation of lean coal mine methane in a thermal flow-reversal reactor. Chem. Eng. J. 2018, 351, 922–929. [Google Scholar] [CrossRef]
- Pengfei Guo, X.G. Experimental Research on the Thermal Oxidation of Ventilation Air Methane in a Thermal Reverse Flow Reactor. ACS Omega 2019, 4, 14886–14894. [Google Scholar] [CrossRef]
- Wang, Y.; Wang, S.; Bai, J.; Zhang, L.; Zhao, S.; Deng, J.; Tang, X.; Duan, E. Structural evolution in LaCoO3 by polyol treatment: Highly active and resistant Co3O4/La2O2CO3/LaCoO3 heterostructure catalysts for CH4 oxidation. Appl. Catal. B Environ. 2023, 338, 123079. [Google Scholar] [CrossRef]
- Yang, Z.; Zhang, L.; Zhang, Y.; Bai, M.; Zhang, Y.; Yue, Z.; Duan, E. Effects of apparent activation energy in pyrolytic carbonization on the synthesis of MOFs-carbon involving thermal analysis kinetics and decomposition mechanism. Chem. Eng. J. 2020, 395, 124980. [Google Scholar] [CrossRef]
- Wang, S.; Chu, P.; Liu, J.; Wang, C.; Duan, E.; Deng, J.; Hou, L. Amino acid-deep eutectic solvents/LaCoO3 mutualism system:Forming La-Co-C-O hybrid for low temperature methane catalytic oxidation. Fuel 2022, 316, 123358. [Google Scholar] [CrossRef]
- Sheng, J.; Song, S.; Zhang, Y.; Prinn, R.G.; Janssens-Maenhout, G. Bottom-Up Estimates of Coal Mine Methane Emissions in China: A Gridded Inventory, Emission Factors, and Trends. Environ. Sci. Technol. Lett. 2019, 6, 473–478. [Google Scholar] [CrossRef]
- Wei, C.; Xu, M.; Sun, J.; Li, X.; Ji, C. Coal Mine Gas Emission Gray Dynamic Prediction. Procedia Eng. 2011, 26, 1157–1167. [Google Scholar]
- Wang, W.; Peng, L.; Wang, X. Prediction of Coal Mine Gas Emission Quantity Based on Grey-Gas Geologic Method. Math. Probl. Eng. 2018, 17, 4397237. [Google Scholar]


Disclaimer/Publisher’s Note: The statements, opinions and data contained in all publications are solely those of the individual author(s) and contributor(s) and not of MDPI and/or the editor(s). MDPI and/or the editor(s) disclaim responsibility for any injury to people or property resulting from any ideas, methods, instructions or products referred to in the content. |
© 2023 by the authors. Licensee MDPI, Basel, Switzerland. This article is an open access article distributed under the terms and conditions of the Creative Commons Attribution (CC BY) license (https://creativecommons.org/licenses/by/4.0/).