
Regional Climate Simulation Ensembles within CORDEX-EA Framework over the Loess Plateau: Evaluation and Future Projections
Abstract
:1. Introduction
2. Data and Methods
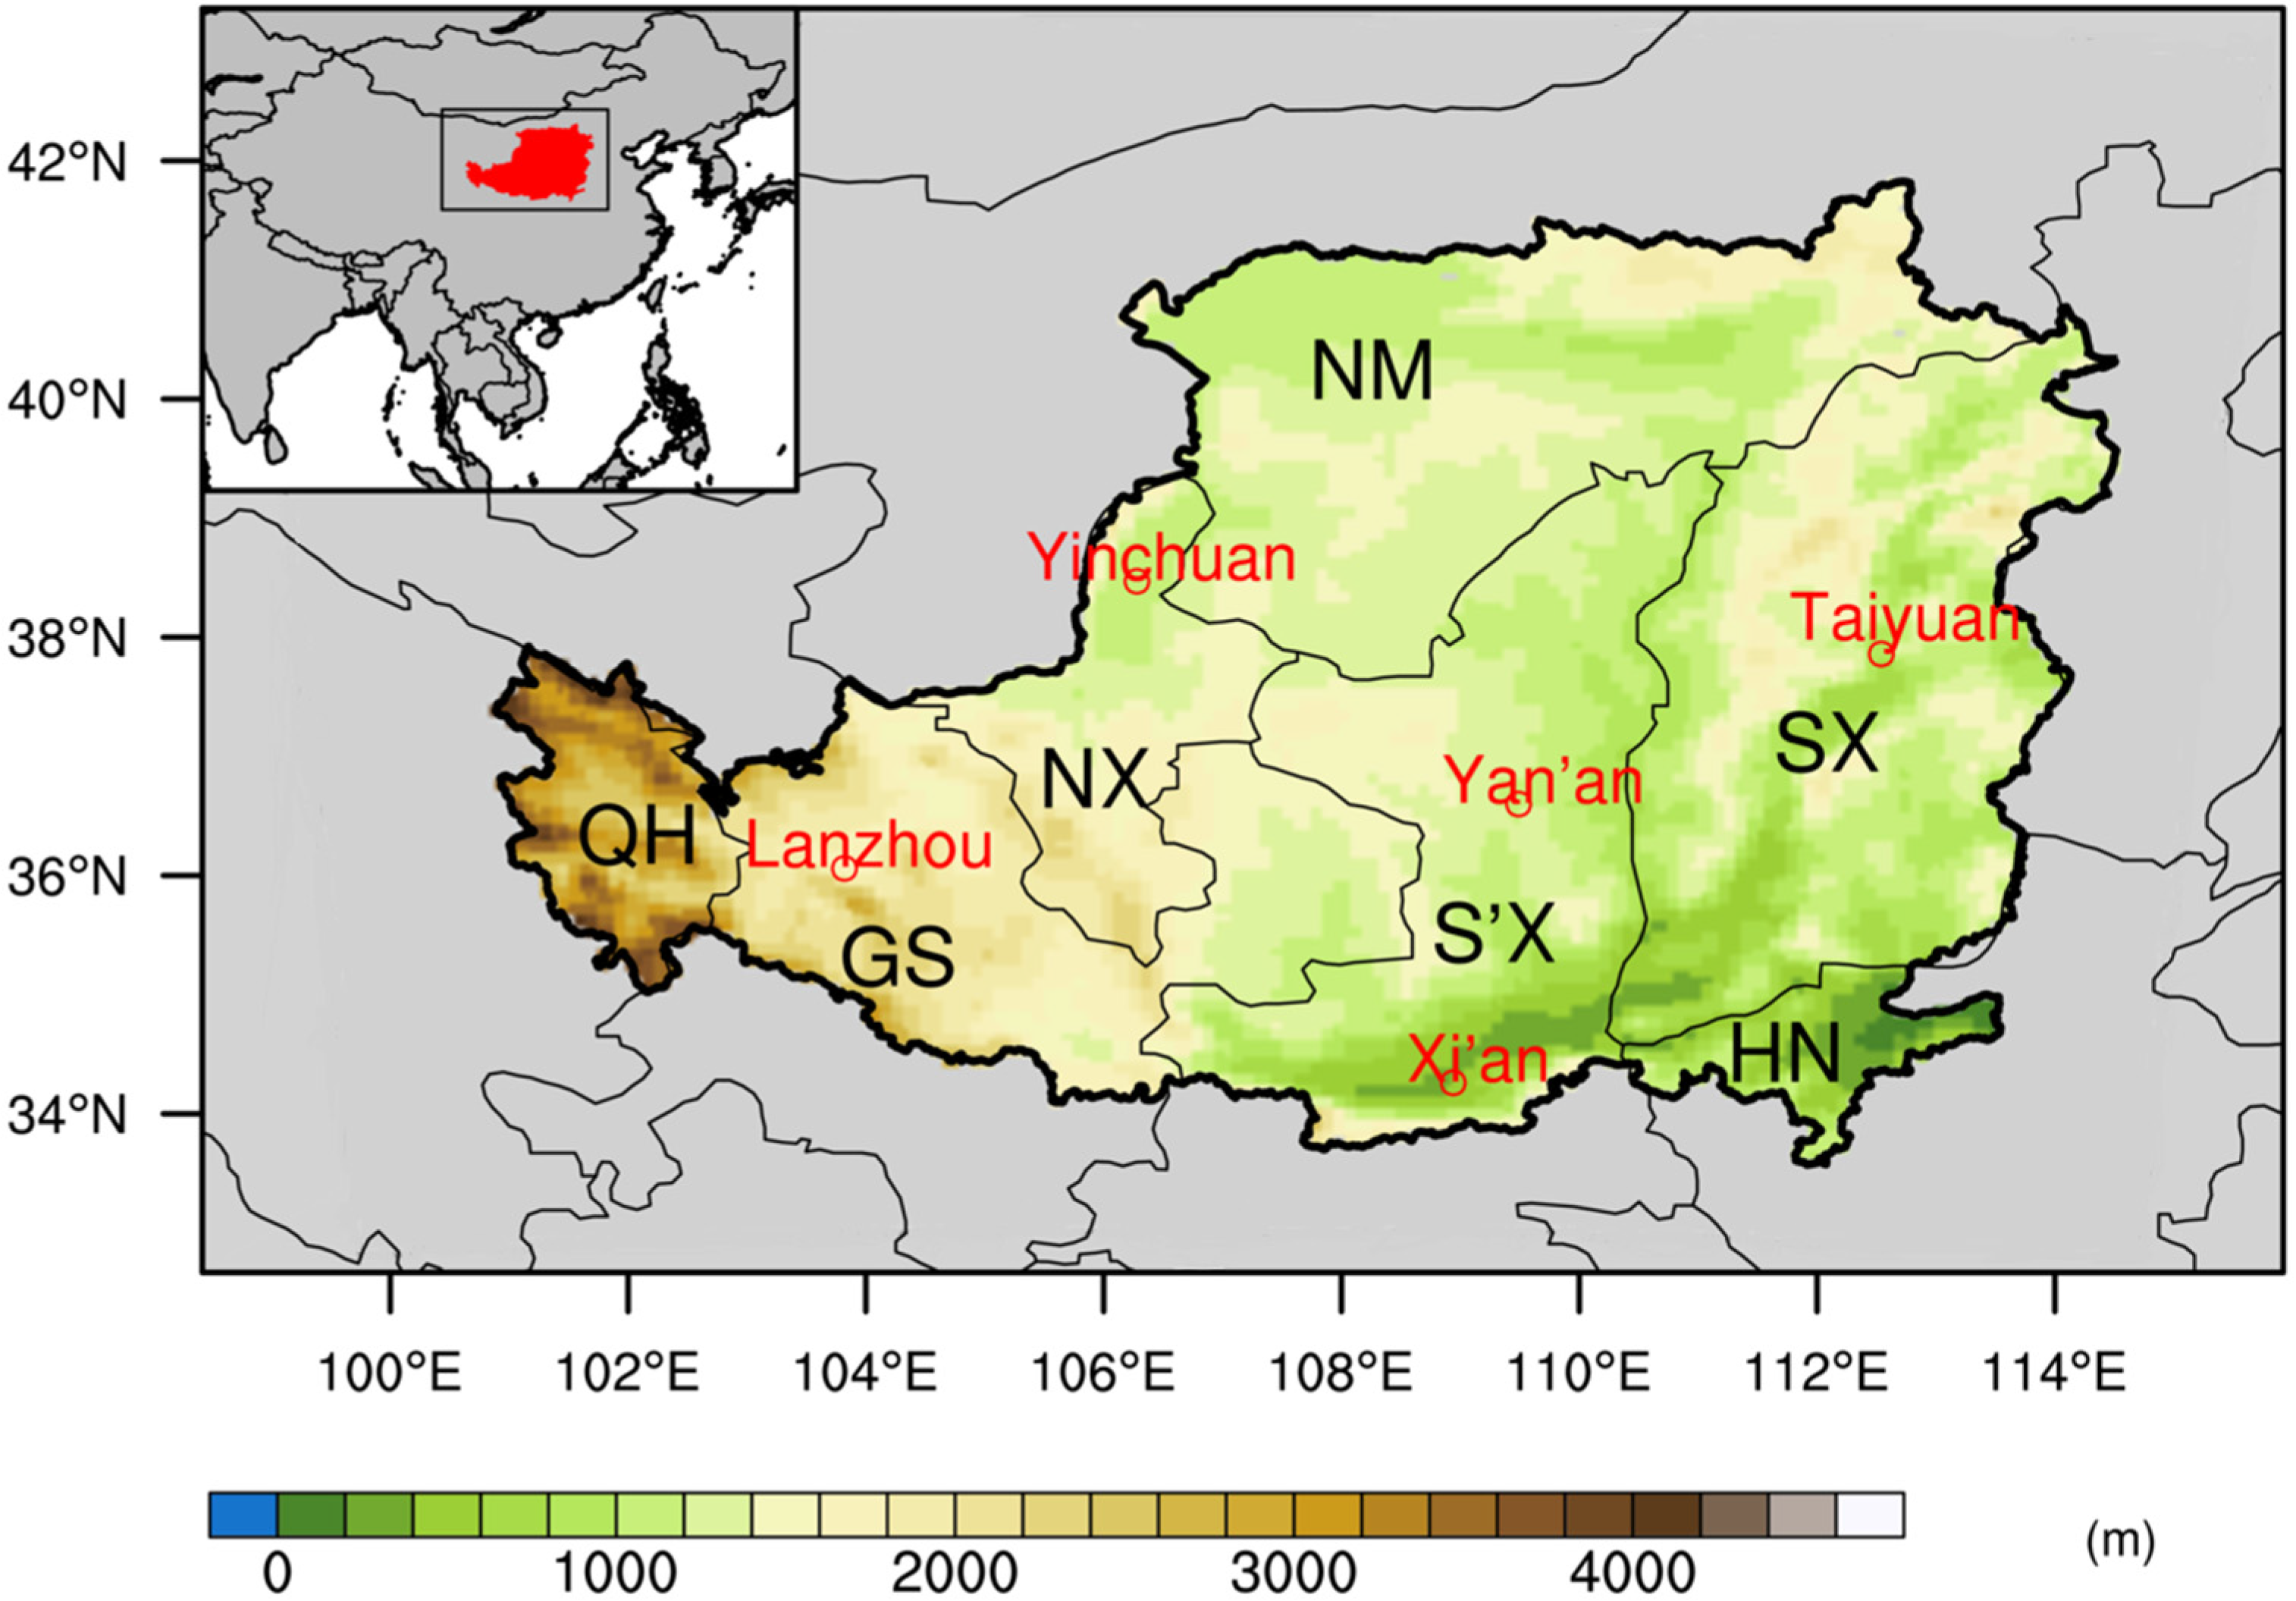
2.1. Study Area
2.2. RCP Scenarios
2.3. CORDEX-EA
2.4. CMFD Gridded Dataset
2.5. Evaluation Metrics
3. Results
3.1. Evaluation of Historical Experiments
3.1.1. Temperature
3.1.2. Precipitation
3.2. Projections of Future Changes
3.2.1. Temperature
3.2.2. Precipitation
4. Discussion
5. Conclusions
- (1)
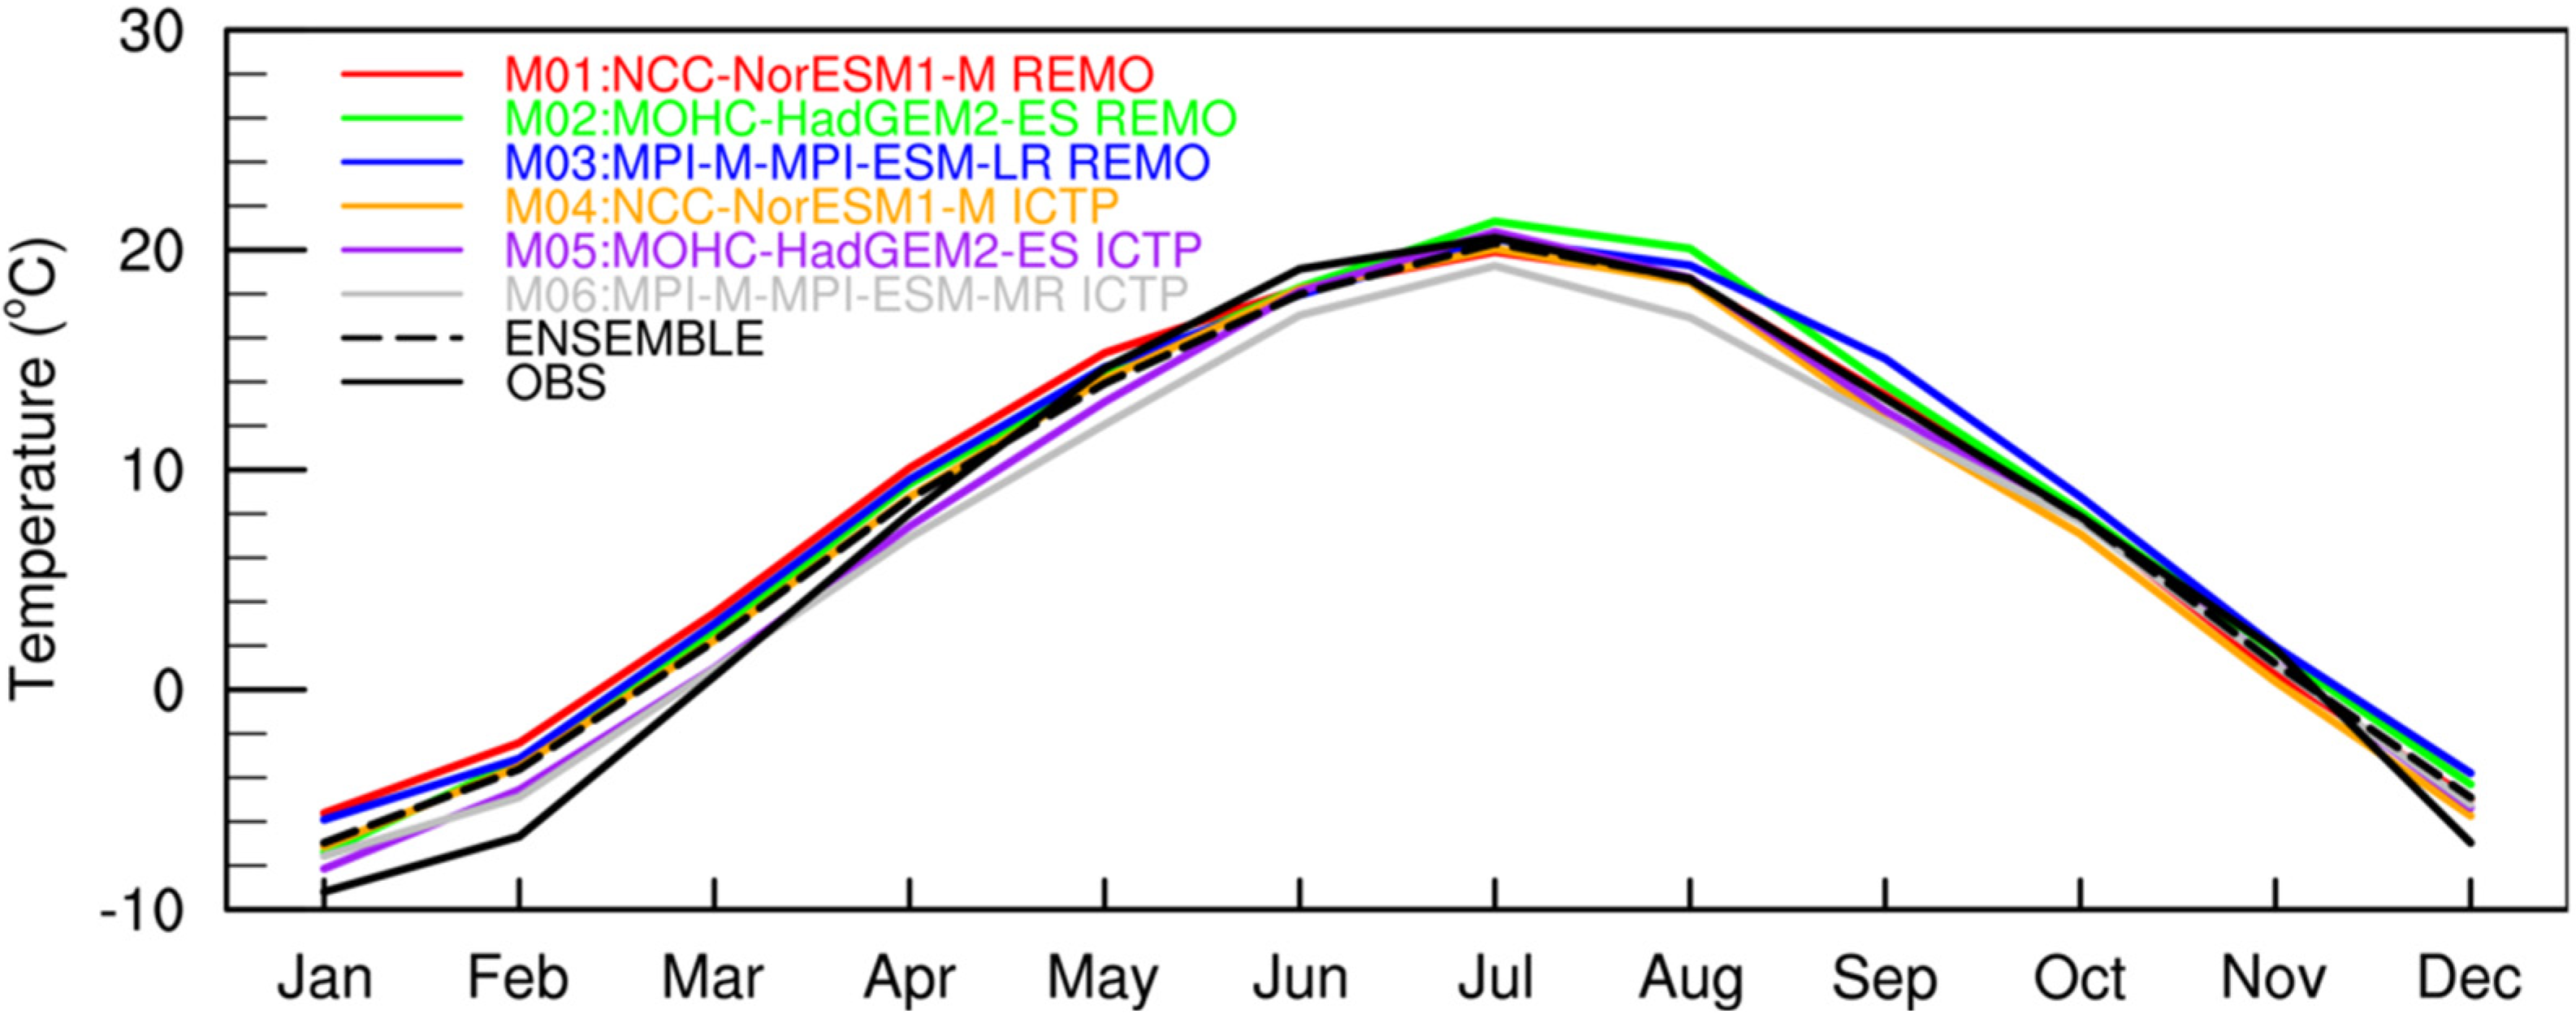
- CORDEX-EA experiments reproduce well the spatial distribution of 2m temperature for each season. Warm biases can be identified in most areas in DJF, while cold biases exist over almost the whole plateau in JJA. In addition, these experiments generate a good reproduction of observed monthly variation. The observation is within the range of model spread from March to November, while it is lower than all model simulations from December to February, which yield a warm bias of 0.93 °C for the ensemble mean in DJF.
- (2)
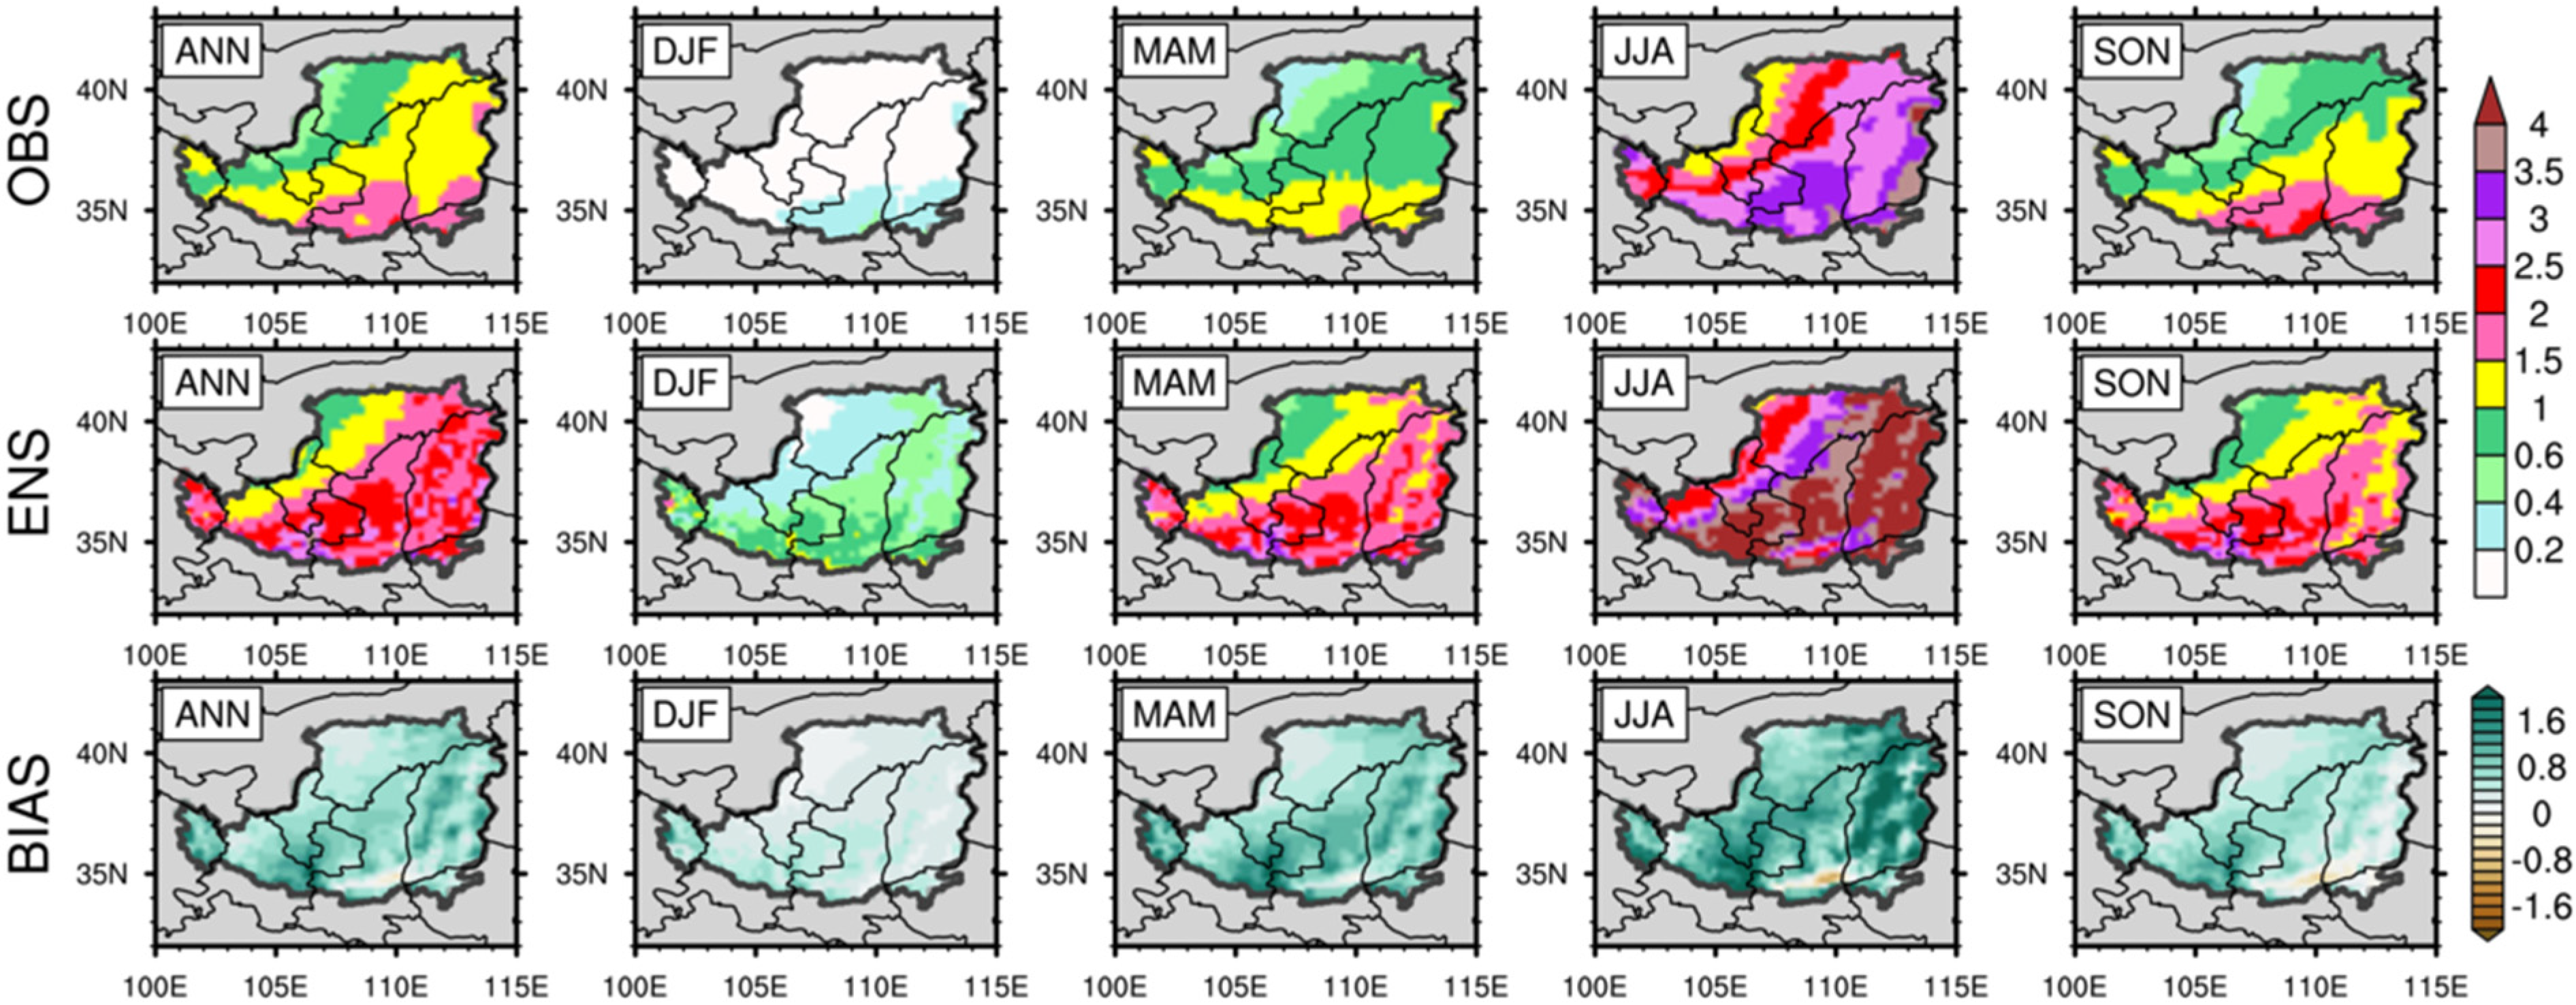
- RCMs generally reasonably reproduce the spatial pattern of precipitation. The gradient from southeast to northwest can be identified for the four seasons, particularly in summer. In all seasons, precipitation is overestimated over almost the whole plateau except for a small part along the southern edge. Although the timing of rainfall rise (May-July), peak-reaching (July), and fall (July–October) is correctly captured by most experiments, there is still prominent bias and large inter-model variance.
- (3)
- In the future, for both RCP2.6 and RCP8.5, the temperature rise is unevenly distributed and more prominent in elevated areas. The area-averaged magnitude of change is 1.3 °C, 2.7 °C, and 4.5 °C under RCP8.5 compared with 1.1 °C, 1.4 °C, and 1.4 °C under RCP2.6 for the early, middle, and late periods, respectively. Overall, for each of the three periods, the temperature augmentation magnitude of RCP8.5 is larger than the corresponding one of RCP2.6. Under RCP2.6, in most months (except June and July) the magnitude rises from the early to middle future, reaches its maximum, and then falls in the late future. The case is different for RCP8.5, in which the magnitude augments monotonously from the early to middle future until the late future.
- (4)
- Annual mean area-averaged precipitation increases at the magnitudes of 4.2%, 6.3%, and 2.1% under RCP2.6 and 0.8%, 6.0%, and 9.5% under RCP8.5 for the early, middle, and late periods, respectively. For both RCPs, rainfall augments for most areas during winter and spring during the three future periods. Rainfall decrease can be found in part of the domain in summer and autumn during the middle and late periods for RCP2.6 and during all three periods for RCP8.5.
Supplementary Materials
Funding
Acknowledgments
Conflicts of Interest
References
- Rummukainen, M. State-of-the-art with regional climate models. WIREs Clim. Chang. 2010, 1, 82–96. [Google Scholar] [CrossRef]
- Soares, P.M.M.; Cardoso, R.M.; Miranda, P.M.A.; Viterbo, P.; Belo-Pereira, M. Assessment of the ENSEMBLES regional climate models in the representation of precipitation variability and extremes over Portugal. J. Geophys. Res. Atmos. 2012, 117, D07114. [Google Scholar] [CrossRef]
- Giorgi, F.; Bi, X. A study of internal variability of a regional climate model. J. Geophys. Res. Atmos. 2000, 105, 29503–29521. [Google Scholar] [CrossRef]
- Feser, F.; Rockel, B.; von Storch, H.; Winterfeldt, J.; Zahn, M. Regional climate models add value to global model data: A review and selected examples. Bull. Am. Meteorol. Soc. 2011, 92, 1181–1192. [Google Scholar] [CrossRef]
- Giorgi, F.; Jones, C.; Asrar, G. Addressing climate information needs at the regional level: The CORDEX framework. WMO Bull. 2008, 53, 175. [Google Scholar]
- Hong, S.-Y.; Kanamitsu, M. Dynamical downscaling: Fundamental issues from an NWP point of view and recommendations. Asia-Pac. J. Atmos. Sci. 2014, 50, 83–104. [Google Scholar] [CrossRef]
- Nikulin, G.; Jones, C.; Giorgi, F.; Asrar, G.; Büchner, M.; Cerezo-Mota, R.; Christensen, O.B.; Déqué, M.; Fernandez, J.; Hänsler, A.; et al. Precipitation Climatology in an Ensemble of CORDEX-Africa Regional Climate Simulations. J. Clim. 2012, 25, 6057–6078. [Google Scholar] [CrossRef]
- Nikulin, G.; Lennard, C.; Dosio, A.; Kjellström, E.; Chen, Y.; Hänsler, A.; Kupiainen, M.; Laprise, R.; Mariotti, L.; Maule, C.F.; et al. The effects of 1.5 and 2 degrees of global warming on Africa in the CORDEX ensemble. Environ. Res. Lett. 2018, 13, 065003. [Google Scholar] [CrossRef]
- Jacob, D.; Petersen, J.; Eggert, B.; Alias, A.; Christensen, O.B.; Bouwer, L.M.; Braun, A.; Colette, A.; Déqué, M.; Georgievski, G.; et al. EURO-CORDEX: New high-resolution climate change projections for European impact research. Reg. Environ. Chang. 2014, 14, 563–578. [Google Scholar] [CrossRef]
- Kotlarski, S.; Keuler, K.; Christensen, O.B.; Colette, A.; Déqué, M.; Gobiet, A.; Goergen, K.; Jacob, D.; Lüthi, D.; van Meijgaard, E.; et al. Regional climate modeling on European scales: A joint standard evaluation of the EURO-CORDEX RCM ensemble. Geosci. Model Dev. 2014, 7, 1297–1333. [Google Scholar] [CrossRef]
- Ruti, P.M.; Somot, S.; Giorgi, F.; Dubois, C.; Flaounas, E.; Obermann, A.; Dell’Aquila, A.; Pisacane, G.; Harzallah, A.; Lombardi, E.; et al. Med-CORDEX Initiative for Mediterranean Climate Studies. Bull. Am. Meteorol. Soc. 2016, 97, 1187–1208. [Google Scholar] [CrossRef]
- Šeparović, L.; Alexandru, A.; Laprise, R.; Martynov, A.; Sushama, L.; Winger, K.; Tete, K.; Valin, M. Present climate and climate change over North America as simulated by the fifth-generation Canadian regional climate model. Clim. Dyn. 2013, 41, 3167–3201. [Google Scholar] [CrossRef]
- Kim, G.; Cha, D.-H.; Park, C.; Jin, C.-S.; Lee, D.-K.; Suh, M.-S.; Oh, S.-G.; Hong, S.-Y.; Ahn, J.-B.; Min, S.-K.; et al. Evaluation and Projection of Regional Climate over East Asia in CORDEX-East Asia Phase I Experiment. Asia-Pac. J. Atmos. Sci. 2021, 57, 119–134. [Google Scholar] [CrossRef]
- Diaconescu, E.P.; Gachon, P.; Laprise, R.; Scinocca, J.F. Evaluation of Precipitation Indices over North America from Various Configurations of Regional Climate Models. Atmos. Ocean 2016, 54, 418–439. [Google Scholar] [CrossRef]
- Tang, J.P.; Wang, S.Y.; Niu, X.R.; Hui, P.H.; Zong, P.S.; Wang, X.Y. Impact of spectral nudging on regional climate simulation over CORDEX East Asia using WRF. Clim. Dyn. 2017, 48, 2339–2357. [Google Scholar] [CrossRef]
- Tang, J.; Xiao, Y.; Hui, P.; Lu, Y.; Yu, K. Reanalysis-driven multi-RCM high-resolution simulation of precipitation within CORDEX East Asia Phase II. Int. J. Climatol. 2022, 42, 6332–6350. [Google Scholar] [CrossRef]
- Liu, W.; Sang, T. Potential productivity of the Miscanthus energy crop in the Loess Plateau of China under climate change. Environ. Res. Lett. 2013, 8, 044003. [Google Scholar] [CrossRef]
- Zheng, H.; Miao, C.; Kong, D.; Wu, J.; Zhou, R. Changes in maximum daily runoff depth and suspended sediment yield on the Loess Plateau, China. J. Hydrol. 2020, 583, 124611. [Google Scholar] [CrossRef]
- Deng, Y.; Wang, X.; Wang, K.; Ciais, P.; Tang, S.; Jin, L.; Li, L.; Piao, S. Responses of vegetation greenness and carbon cycle to extreme droughts in China. Agric. For. Meteorol. 2021, 298–299, 108307. [Google Scholar] [CrossRef]
- Liu, Y.-F.; Liu, Y.; Shi, Z.-H.; López-Vicente, M.; Wu, G.-L. Effectiveness of re-vegetated forest and grassland on soil erosion control in the semi-arid Loess Plateau. CATENA 2020, 195, 104787. [Google Scholar] [CrossRef]
- Zhang, J.; Gao, G.; Fu, B.; Wang, C.; Gupta, H.V.; Zhang, X.; Li, R. A universal multifractal approach to assessment of spatiotemporal extreme precipitation over the Loess Plateau of China. Hydrol. Earth Syst. Sci. 2020, 24, 809–826. [Google Scholar] [CrossRef]
- Zou, L.W.; Zhou, T.J.; Peng, D.D. Dynamical downscaling of historical climate over CORDEX East Asia domain: A comparison of regional ocean-atmosphere coupled model to stand-alone RCM simulations. J. Geophys. Res.-Atmos. 2016, 121, 1442–1458. [Google Scholar] [CrossRef]
- Park, C.; Min, S.K.; Lee, D.; Cha, D.H.; Suh, M.S.; Kang, H.S.; Hong, S.Y.; Lee, D.K.; Baek, H.J.; Boo, K.O.; et al. Evaluation of multiple regional climate models for summer climate extremes over East Asia. Clim. Dyn. 2016, 46, 2469–2486. [Google Scholar] [CrossRef]
- Jin, C.S.; Cha, D.H.; Lee, D.K.; Suh, M.S.; Hong, S.Y.; Kang, H.S.; Ho, C.H. Evaluation of climatological tropical cyclone activity over the western North Pacific in the CORDEX-East Asia multi-RCM simulations. Clim. Dyn. 2016, 47, 765–778. [Google Scholar] [CrossRef]
- Cha, D.H.; Jin, C.S.; Moon, J.H.; Lee, D.K. Improvement of regional climate simulation of East Asian summer monsoon by coupled air-sea interaction and large-scale nudging. Int. J. Climatol. 2016, 36, 334–345. [Google Scholar] [CrossRef]
- Um, M.J.; Kim, Y.; Kim, J. Evaluating historical drought characteristics simulated in CORDEX East Asia against observations. Int. J. Climatol. 2017, 37, 4643–4655. [Google Scholar] [CrossRef]
- Tang, J.; Li, Q.; Wang, S.; Lee, D.-K.; Hui, P.; Niu, X.; Gutowski, W.J., Jr.; Dairaku, K.; McGregor, J.; Katzfey, J.; et al. Building Asian climate change scenario by multi-regional climate models ensemble. Part I: Surface air temperature. Int. J. Climatol. 2016, 36, 4241–4252. [Google Scholar] [CrossRef]
- Niu, X.; Tang, J.; Wang, S.; Fu, C.; Chen, D. On the sensitivity of seasonal and diurnal precipitation to cumulus parameterization over CORDEX-EA-II. Clim. Dyn. 2020, 54, 373–393. [Google Scholar] [CrossRef]
- Lee, J.W.; Hong, S.Y.; Chang, E.C.; Suh, M.S.; Kang, H.S. Assessment of future climate change over East Asia due to the RCP scenarios downscaled by GRIMs-RMP. Clim. Dyn. 2014, 42, 733–747. [Google Scholar] [CrossRef]
- Gu, H.; Yu, Z.; Yang, C.; Ju, Q.; Yang, T.; Zhang, D. High-resolution ensemble projections and uncertainty assessment of regional climate change over China in CORDEX East Asia. Hydrol. Earth Syst. Sci. 2018, 22, 3087–3103. [Google Scholar] [CrossRef]
- Gao, X.; Shi, Y.; Song, R.; Giorgi, F.; Wang, Y.; Zhang, D. Reduction of future monsoon precipitation over China: Comparison between a high resolution RCM simulation and the driving GCM. Meteorol. Atmos. Phys. 2008, 100, 73–86. [Google Scholar] [CrossRef]
- Shi, Y.; Wang, G.; Gao, X. Role of resolution in regional climate change projections over China. Clim. Dyn. 2018, 51, 2375–2396. [Google Scholar] [CrossRef]
- Gao, X.J.; Shi, Y.; Giorgi, F. Comparison of convective parameterizations in RegCM4 experiments over China with CLM as the land surface model. Atmos. Ocean. Sci. Lett. 2016, 9, 246–254. [Google Scholar] [CrossRef]
- Gu, H.H.; Yu, Z.B.; Wang, J.G.; Wang, G.L.; Yang, T.; Ju, Q.; Yang, C.G.; Xu, F.; Fan, C.H. Assessing CMIP5 general circulation model simulations of precipitation and temperature over China. Int. J. Climatol. 2015, 35, 2431–2440. [Google Scholar] [CrossRef]
- Epstein, E.S. Stochastic dynamic prediction. Tellus 1969, 21, 739–759. [Google Scholar] [CrossRef]
- Leith, C.E. Theoretical Skill of Monte Carlo Forecasts. Mon. Weather Rev. 1974, 102, 409–418. [Google Scholar] [CrossRef]
- Moss, R.H.; Edmonds, J.A.; Hibbard, K.A.; Manning, M.R.; Rose, S.K.; van Vuuren, D.P.; Carter, T.R.; Emori, S.; Kainuma, M.; Kram, T.; et al. The next generation of scenarios for climate change research and assessment. Nature 2010, 463, 747–756. [Google Scholar] [CrossRef]
- van Vuuren, D.P.; Stehfest, E.; den Elzen, M.G.J.; Kram, T.; van Vliet, J.; Deetman, S.; Isaac, M.; Klein Goldewijk, K.; Hof, A.; Mendoza Beltran, A.; et al. RCP2.6: Exploring the possibility to keep global mean temperature increase below 2 °C. Clim. Chang. 2011, 109, 95. [Google Scholar] [CrossRef]
- Riahi, K.; Rao, S.; Krey, V.; Cho, C.; Chirkov, V.; Fischer, G.; Kindermann, G.; Nakicenovic, N.; Rafaj, P. RCP 8.5—A scenario of comparatively high greenhouse gas emissions. Clim. Chang. 2011, 109, 33. [Google Scholar] [CrossRef]
- Teichmann, C.; Jacob, D.; Remedio, A.R.; Remke, T.; Buntemeyer, L.; Hoffmann, P.; Kriegsmann, A.; Lierhammer, L.; Bülow, K.; Weber, T.; et al. Assessing mean climate change signals in the global CORDEX-CORE ensemble. Clim. Dyn. 2021, 57, 1269–1292. [Google Scholar] [CrossRef]
- Remedio, A.R.; Teichmann, C.; Buntemeyer, L.; Sieck, K.; Weber, T.; Rechid, D.; Hoffmann, P.; Nam, C.; Kotova, L.; Jacob, D. Evaluation of New CORDEX Simulations Using an Updated Köppen–Trewartha Climate Classification. Atmosphere 2019, 10, 726. [Google Scholar] [CrossRef]
- Giorgi, F.; Coppola, E.; Solmon, F.; Mariotti, L.; Sylla, M.B.; Bi, X.; Elguindi, N.; Diro, G.T.; Nair, V.; Giuliani, G.; et al. RegCM4: Model description and preliminary tests over multiple CORDEX domains. Clim. Res. 2012, 52, 7–29. [Google Scholar] [CrossRef]
- Palmer, T.N.; Alessandri, A.; Andersen, U.; Cantelaube, P.; Davey, M.; Délécluse, P.; Déqué, M.; Díez, E.; Doblas-Reyes, F.J.; Feddersen, H.; et al. Development of a European multi-model ensemble system. For seasonal to interannual prediction (DEMETER). Bull. Am. Meteorol. Soc. 2004, 85, 853–872. [Google Scholar] [CrossRef]
- Krishnamurti, T.N.; Kishtawal, C.M.; Zhang, Z.; Larow, T.; Bachiochi, D.; Williford, E.; Gadgil, S.; Surendran, S. Multimodel Ensemble Forecasts for Weather and Seasonal Climate. J. Clim. 2000, 13, 4196–4216. [Google Scholar] [CrossRef]
- Filippo, G.; Mearns Linda, O. Calculation of Average, Uncertainty Range, and Reliability of Regional Climate Changes from AOGCM Simulations via the “Reliability Ensemble Averaging” (REA) Method. J. Clim. 2002, 15, 1141–1158. [Google Scholar]
- Teutschbein, C.; Seibert, J. Bias correction of regional climate model simulations for hydrological climate-change impact studies: Review and evaluation of different methods. J. Hydrol. 2012, 456–457, 12–29. [Google Scholar] [CrossRef]
- Teutschbein, C.; Seibert, J. Is bias correction of regional climate model (RCM) simulations possible for non-stationary conditions? Hydrol. Earth Syst. Sci. 2013, 17, 5061–5077. [Google Scholar] [CrossRef]
- He, J.; Yang, K.; Tang, W.; Lu, H.; Qin, J.; Chen, Y.; Li, X. The first high-resolution meteorological forcing dataset for land process studies over China. Sci. Data 2020, 7, 25. [Google Scholar] [CrossRef]
- Taylor, K.E. Summarizing multiple aspects of model performance in a single diagram. J. Geophys. Res.-Atmos. 2001, 106, 7183–7192. [Google Scholar] [CrossRef]
- Yu, E.; Liu, D.; Yang, J.; Sun, J.; Yu, L.; King, M.P. Future climate change for major agricultural zones in China as projected by CORDEX-EA-II, CMIP5 and CMIP6 ensembles. Atmos. Res. 2023, 288, 106731. [Google Scholar] [CrossRef]
- Zhang, D.; Gao, X. Climate change of the 21st century over China from the ensemble of RegCM4 simulations. Chin. Sci. Bull. 2020, 65, 2516–2526. [Google Scholar] [CrossRef]
- Yu, K.; Hui, P.; Zhou, W.; Tang, J. Evaluation of multi-RCM high-resolution hindcast over the CORDEX East Asia Phase II region: Mean, annual cycle and interannual variations. Int. J. Climatol. 2020, 40, 2134–2152. [Google Scholar] [CrossRef]
- Wu, J.; Gao, X.J. A gridded daily observation dataset over China region and comparison with the other datasets. Chin. J. Geophys.-Chin. Ed. 2013, 56, 1102–1111. [Google Scholar]
- Yatagai, A.; Kamiguchi, K.; Arakawa, O.; Hamada, A.; Yasutomi, N.; Kitoh, A. APHRODITE Constructing a Long-Term Daily Gridded Precipitation Dataset for Asia Based on a Dense Network of Rain Gauges. Bull. Am. Meteorol. Soc. 2012, 93, 1401–1415. [Google Scholar] [CrossRef]
- Wang, X.; Chen, D.; Pang, G.; Gou, X.; Yang, M. Historical and future climates over the upper and middle reaches of the Yellow River Basin simulated by a regional climate model in CORDEX. Clim. Dyn. 2021, 56, 2749–2771. [Google Scholar] [CrossRef]
- Pang, G.; Wang, X.; Chen, D.; Yang, M.; Liu, L. Evaluation of a climate simulation over the Yellow River Basin based on a regional climate model (REMO) within the CORDEX. Atmos. Res. 2021, 254, 105522. [Google Scholar] [CrossRef]
- Liu, L.-Y.; Wang, X.-J.; Gou, X.-H.; Yang, M.-X.; Zhang, Z.-H. Projections of surface air temperature and precipitation in the 21st century in the Qilian Mountains, Northwest China, using REMO in the CORDEX. Adv. Clim. Change Res. 2022, 13, 344–358. [Google Scholar] [CrossRef]
- Masson-Delmotte, V.Z.P.; Pirani, A.; Connors, S.; Péan, C.; Berger, S.; Caud, N.; Chen, Y.; Goldfarb, L.; Gomis, M.; Huang, M.; et al. Climate Change 2021: The Physical Science Basis. In Contribution of Working Group I to the Sixth Assessment Report of the Intergovernmental Panel on Climate Change; Technical Report; IPCC: Geneva, Switzerland, 2021. [Google Scholar]


| Ensemble Member | Institute | GCM | RCM | Experiments |
|---|---|---|---|---|
| M01 | GERICS | NCC-NorESM1-M | REMO2015 | historical, rcp2.6, rcp8.5 |
| M02 | GERICS | MOHC-HadGEM2-ES | REMO2015 | historical, rcp2.6, rcp8.5 |
| M03 | GERICS | MPI-M-MPI-ESM-LR | REMO2015 | historical, rcp2.6, rcp8.5 |
| M04 | ICTP | NCC-NorESM1-M | RegCM4-7 | historical, rcp2.6, rcp8.5 |
| M05 | ICTP | MOHC-HadGEM2-ES | RegCM4-7 | historical, rcp2.6, rcp8.5 |
| M06 | ICTP | MPI-M-MPI-ESM-MR | RegCM4-7 | historical, rcp2.6, rcp8.5 |
Disclaimer/Publisher’s Note: The statements, opinions and data contained in all publications are solely those of the individual author(s) and contributor(s) and not of MDPI and/or the editor(s). MDPI and/or the editor(s) disclaim responsibility for any injury to people or property resulting from any ideas, methods, instructions or products referred to in the content. |
© 2023 by the author. Licensee MDPI, Basel, Switzerland. This article is an open access article distributed under the terms and conditions of the Creative Commons Attribution (CC BY) license (https://creativecommons.org/licenses/by/4.0/).
Share and Cite
Liu, S. Regional Climate Simulation Ensembles within CORDEX-EA Framework over the Loess Plateau: Evaluation and Future Projections. Atmosphere 2023, 14, 1435. https://doi.org/10.3390/atmos14091435
Liu S. Regional Climate Simulation Ensembles within CORDEX-EA Framework over the Loess Plateau: Evaluation and Future Projections. Atmosphere. 2023; 14(9):1435. https://doi.org/10.3390/atmos14091435
Chicago/Turabian StyleLiu, Siliang. 2023. "Regional Climate Simulation Ensembles within CORDEX-EA Framework over the Loess Plateau: Evaluation and Future Projections" Atmosphere 14, no. 9: 1435. https://doi.org/10.3390/atmos14091435