Article

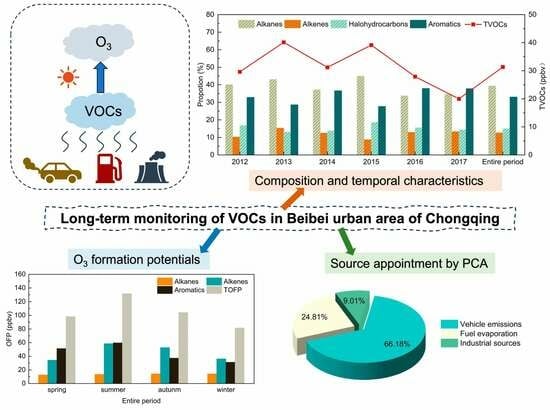
Composition Characteristics of VOCs in the Atmosphere of the Beibei Urban District of Chongqing: Insights from Long-Term Monitoring

1
Key Laboratory of Eco-Environments in Three Gorges Reservoir Region (Ministry of Education), College of Resources and Environment, Southwest University, Chongqing 401120, China
2
Department of Environmental Science and Engineering, Beijing University of Chemical Technology, Beijing 100029, China
*
Authors to whom correspondence should be addressed.
Atmosphere 2023, 14(9), 1452; https://doi.org/10.3390/atmos14091452
Submission received: 10 August 2023 / Revised: 10 September 2023 / Accepted: 12 September 2023 / Published: 18 September 2023

Abstract

:
Reducing anthropogenic volatile organic compounds (VOCs) is the most effective way to mitigate O3 pollution, which has increased over the past decades in China. From 2012 to 2017, special stainless-steel cylinders were used to collect ambient air samples from the urban area of Beibei district, Chongqing. Three-step pre-concentration gas chromatography–mass spectrometry was used to detect the collected air samples. The composition, concentration, photochemical reactivity, and sources of VOCs in Beibei were analyzed. During the observation period, the annual average VOC concentration was 31.3 ppbv, which was at an intermediate range compared to other cities in China. Alkanes (36.8%) and aromatics (35.6%) were the most abundant VOC groups, followed by halo-hydrocarbons (14.4%) and alkenes (12.6%). The overall trend of seasonal distribution of VOC concentration was high in summer and autumn, and low in winter and spring, with a statistically significant difference between summer and winter concentrations. The ozone formation potential (OFP) showed that alkenes were the most active species, followed by aromatics and alkanes, and summer was the season with the highest OFP (131.6 ppbv). Three major emission sources were identified through principal component analysis (PCA), i.e., vehicle exhaust emissions (66.2%), fuel oil evaporation (24.8%), and industrial sources (9.0%). To ameliorate the air quality within the study area, concerted efforts should be directed towards curtailing traffic emissions and mitigating the release of alkenes, particularly emphasizing more stringent interventions during the summer season.

Graphical Abstract

1. Introduction

Volatile Organic Compounds (VOCs), ubiquitous and essential chemical components in the atmosphere, consist mainly of hydrocarbons and substituted hydrocarbons with heteroatoms, including alkanes, alkenes, aromatics, halo-hydrocarbons, etc. Most of them are mutagenic, carcinogenic, and teratogenic, with potential chronic and acute adverse effects on public health [1]. VOCs display photochemical activity and can participate in a series of complex chemical reactions with oxidants such as hydroxyl (-OH) and nitrogen oxides (NOx), ultimately producing a powerful oxidant gas, ozone (O3) [2], which can have a negative impact on human health and crop yields [3]. Over the past decade, China’s air quality has improved significantly, with reductions in sulfur dioxide, nitrogen oxides, and particulate matter, but O3 has still shown an increasing trend. Similar to most industrialized countries, China is now shifting from SO2-dominated to O3-dominated air pollution [4]. The reduction in anthropogenic VOCs reduction is the most efficient way to mitigate O3 pollution [5,6]. Accurate observations of VOCs can provide information to better predict the formation of O3.
VOC concentration levels vary with time and space [6]. In terms of diurnal variation, the total volatile organic compounds (TVOCs) concentrations are usually higher in the early morning and at night, which is closely related to peak vehicle use, while high temperatures and intense solar radiation enhance photochemical reactions and the depletion of reactive VOCs, resulting in a lower concentration at midday [7]. Seasonally, VOC concentrations typically exhibit elevation during colder seasons, attributable to the comparatively diminished photochemical degradation and reduced pollutant dispersion stemming from a lower atmospheric mixing layer [8,9,10]. VOCs in the atmospheric environment originate from both biogenic and anthropogenic emissions, and there are significant geographical differences in source emissions. Biogenic sources mainly come from vegetation, marine environments, and soil [11]. Anthropogenic sources mainly include motor vehicle emissions and various industrial activities [12]. Of the various industrial activities, industrial coatings, printing, chemical production, petrol storage and transportation, and oil refining are the top five largest VOC emitters [13,14]. Although biogenic sources dominate overall global VOC emissions, anthropogenic sources are the main source of VOC emissions in urban areas due to high human activity [8,15]. Additionally, human activity can lead to generally higher VOC concentrations in cities than in rural areas and background locations [11]. The current ratio of biogenic to anthropogenic VOC emissions is about 9:1 globally (1000 and 110 Tg Cyear−1, respectively), but it is about 1.7:1 in China (53.5 and 31.0 Tg Cyear−1, respectively) [8]. VOC emissions from anthropogenic sources in China were 28.5 Mt in 2017, according to the estimation of the Chinese Academy of Environmental Sciences, and the emission of VOCs will increase by approximately 30% by 2030 compared to 2017 [16]. Therefore, it is necessary to study the composition, variation, photochemical activity, and sources of VOCs, further developing effective measures for air pollution prevention and control.
Chongqing, as an old heavy industry city, a pivotal transportation hub, and one of the four municipalities directly controlled by the Central Government of China, has grappled with formidable atmospheric pollution, which is manifested as serious O3 pollution in summer and haze pollution in winter. Moreover, Chongqing’s distinctive foggy and humid climate zone, along with its intricate mountainous terrain, impedes the dispersion of air pollutants and thus serves to intensify the complexities of air pollution in the region [17]. Current research in China on atmospheric VOCs as an important precursor substance of O3 has mainly focused on the Northern Plain [18,19], the Yangtze River Delta [20,21], and the Pearl River Delta [22,23,24]. Relatively few studies have been conducted in southwest China, particularly in Chongqing. Although many studies on VOCs have been conducted in China, there are significant differences in their results due to the short duration of measurements, the small number of species detected, and the high spatiotemporal variation characteristics of VOCs [6]. Long-term measurements of VOCs have been neglected in China, and there is currently little exploration of the interannual variability of VOCs across Chinese cities over several years. To date, there is insufficient research information and data on atmospheric VOCs in Chongqing due to the lack of long-term measurements. In order to provide data support for improving local air quality, this study analyzed the concentration, composition characteristics, seasonal and annual variation, and the photochemical characteristics of VOCs from 2012 to 2017 by regularly collecting atmospheric samples in Chongqing.

2. Method

2.1. Sampling Site and Sampling Method

This study was conducted in the urban area of the Beibei district, one of the nine main districts of Chongqing, China. The monitoring station needed to be located in an unobstructed and elevated area that is evenly influenced by the emission sources. This was to guarantee that the data obtained can accurately reflect the air pollution situation in the broader region. Therefore, the sampling site chosen for this study was the rooftop of the College of Resources and Environment, Southwest University (106°24′ E, 29°48′ N, 35 m above ground level). The study area had a subtropical monsoon humid climate, with maximum and minimum temperatures occurring in August and January, respectively, and an annual mean temperature of 18.3 °C. The sampling location was situated on flat terrain and minimally influenced by local circulation. The surrounding 5 km area was mainly composed of cultural and educational, administrative, and residential areas, with no tall buildings or obvious local emission sources, and the air quality of the site was mainly influenced by nearby traffic and residential emissions. Consequently, the site was deemed representative of VOC pollution levels in Beibei.
Sampling was conducted using an oil-free pressure/vacuum sampling pump. The gas sample was pumped into a special inner surface silanized stainless steel 1 L sampling cylinder via a Teflon gas production tube, which had an inner diameter of 6.35 mm. When the pressure reached 300 kPa, the cylinder and the air pump were closed sequentially. Meteorological factors, including weather conditions, temperature, and humidity, were concurrently recorded. Sampling was conducted between 14:00 and 14:30 every Wednesday.

2.2. VOCs Analysis Method

The air samples were measured using the TO-14 method recommended by US EPA (https://www.epa.gov/technical-air-pollution-resources, accessed on 1 November 2011). The cryogenic enrichment auxiliary system (Entech7100) was used for sample pre-concentration. The samples were separated and detected using gas chromatography–mass spectrometry (GC-MS, HP-5890 fGC, HP-5972 MS) for qualitative and quantitative analysis.
Before sample analysis, a 500 mL gas sample was injected into a three-step preconcentration injection system (Entech 7100). Water, N2, and O2 in the gas sample were passed through the system while VOCs were retained in Module 1 at −165 °C. Subsequently, VOCs in the sample were enriched and concentrated using a Tenax adsorption trap in Module 2 at −50 °C to remove Ar, CH4, CO2, and trace water. Finally, the sample was frozen in Module 3 at −160 °C, and then rapidly heated to obtain a high concentration of VOCs. Driven by helium carrier gas, the concentrated gas sample was carried into the capillary column of chromatography (GC) and then into the mass spectrometry detector (MSD) for detection.
A DB-5 column (60 m × 0.25 mm (ID)) was selected for the GC column. The GC column temperature first stayed at −15 °C for 5 min, and was then raised to 100 °C at 8 °C·min−1 and stayed there for 1 min; finally it was increased to 250 °C at 15 °C·min−1.
The ion source temperature was 2000 °C for mass spectrometry (MS). The ionization energy was 70 eV, the electronic multiplier voltage was 1100 V (self-tuning), and the scan range was 20–200 u.
Qualitative analysis was performed using a standard MS library (NIST98, https://www.nist.gov/, accessed on accessed on 1 November 2011) and standard material retention time (RT). Under the same experimental conditions, the mixed standard gas was analyzed 5 times, and the average retention time of the single compound in the standard gas was less than 10 s from the target compound in the actual sample. In this method, the target compound could be accurately characterized under dual conditions.
The external standard method was used for the quantitative analysis. The TO-14 with a concentration of 100 ppbC (carbon unit volume ratio, the same as below) and the alkene standard gas were diluted with high-purity nitrogen. The working calibration gas with 8 concentrations of 2, 4, 6, 8, 10, 20, 40, and 80 ppbC was prepared using the static gas distribution method. The concentrations of all VOCs in the actual atmospheric samples were calculated using the standard curve equation.
During the observation period from 2012 to 2017, a total of 215 atmospheric samples were collected and analyzed, revealing the presence of 82 distinct VOC species. Among these, 26 were classified as alkanes, 17 as alkenes, 21 as halo-hydrocarbons, and 18 as aromatics. However, low-carbon substances with fewer than two carbon atoms (C2) were not detected owing to the limitation of the method in this study. Therefore, TVOCs reported in this study only encompassed hydrocarbons with a carbon number greater than 3.

2.3. Photochemical Reactivity Analysis Method

OFP (ozone formation potential) can be employed to estimate the contribution of VOCs to ozone in the atmospheric environment and to screen out dominant VOC species for ozone formation. The maximum increment reactivity (MIR) was used in this study [25]. The calculation formula is as follows:
OFPi = MIRi [VOCi]
where OFPi is the OFP value of VOC species i; MIRi is the ozone formation coefficient for VOC species i (obtained by Carter Smokehouse Simulation Laboratory Institute); and [VOCi] is the atmospheric concentration of VOC species i.

2.4. PCA

Principal component analysis (PCA) is a statistical method that explains most of the variables in the original data by reducing the dimensionality and using several independent principal components. The process consists of three steps: singular value decomposition, dimensionality selection, and rotation [26].
First, the data are standardized, as shown in Equation (2):
Z ik = C ik - C i σ i   ( i = 1 ,   2   , ,   m ;   k = 1 ,   2   , ,   n )
where Zik is a normalized measured concentration; Cik is a measured concentration for compound i in k-th observation; Ci is an arithmetic mean concentration; and σi is a standard deviation for compound i. The basic formula of the PCA method is shown as follows:
Z ik = j = 1 P W ij P jk ( i = 1 ,   2 ,   ,   p ;   k = 1 ,   2 ,   ,   n )
where Wij is the factor load (dimensionless), i.e., the correlation coefficient between compound i and factor j obtained from principal component analysis; and Pjk is the factor score (dimensionless).

2.5. Statistical Analysis

Figures and tables were drawn using Microsoft Excel 2016 and Origin 8.5. Statistical analyses were performed with SPSS 21.0 (SPSS Inc., Chicago, IL, USA). Significance tests were analyzed using one-way ANOVA, and correlations and differences in statistical analysis were considered significant if p < 0.05.

3. Results

3.1. Characteristics of VOCs

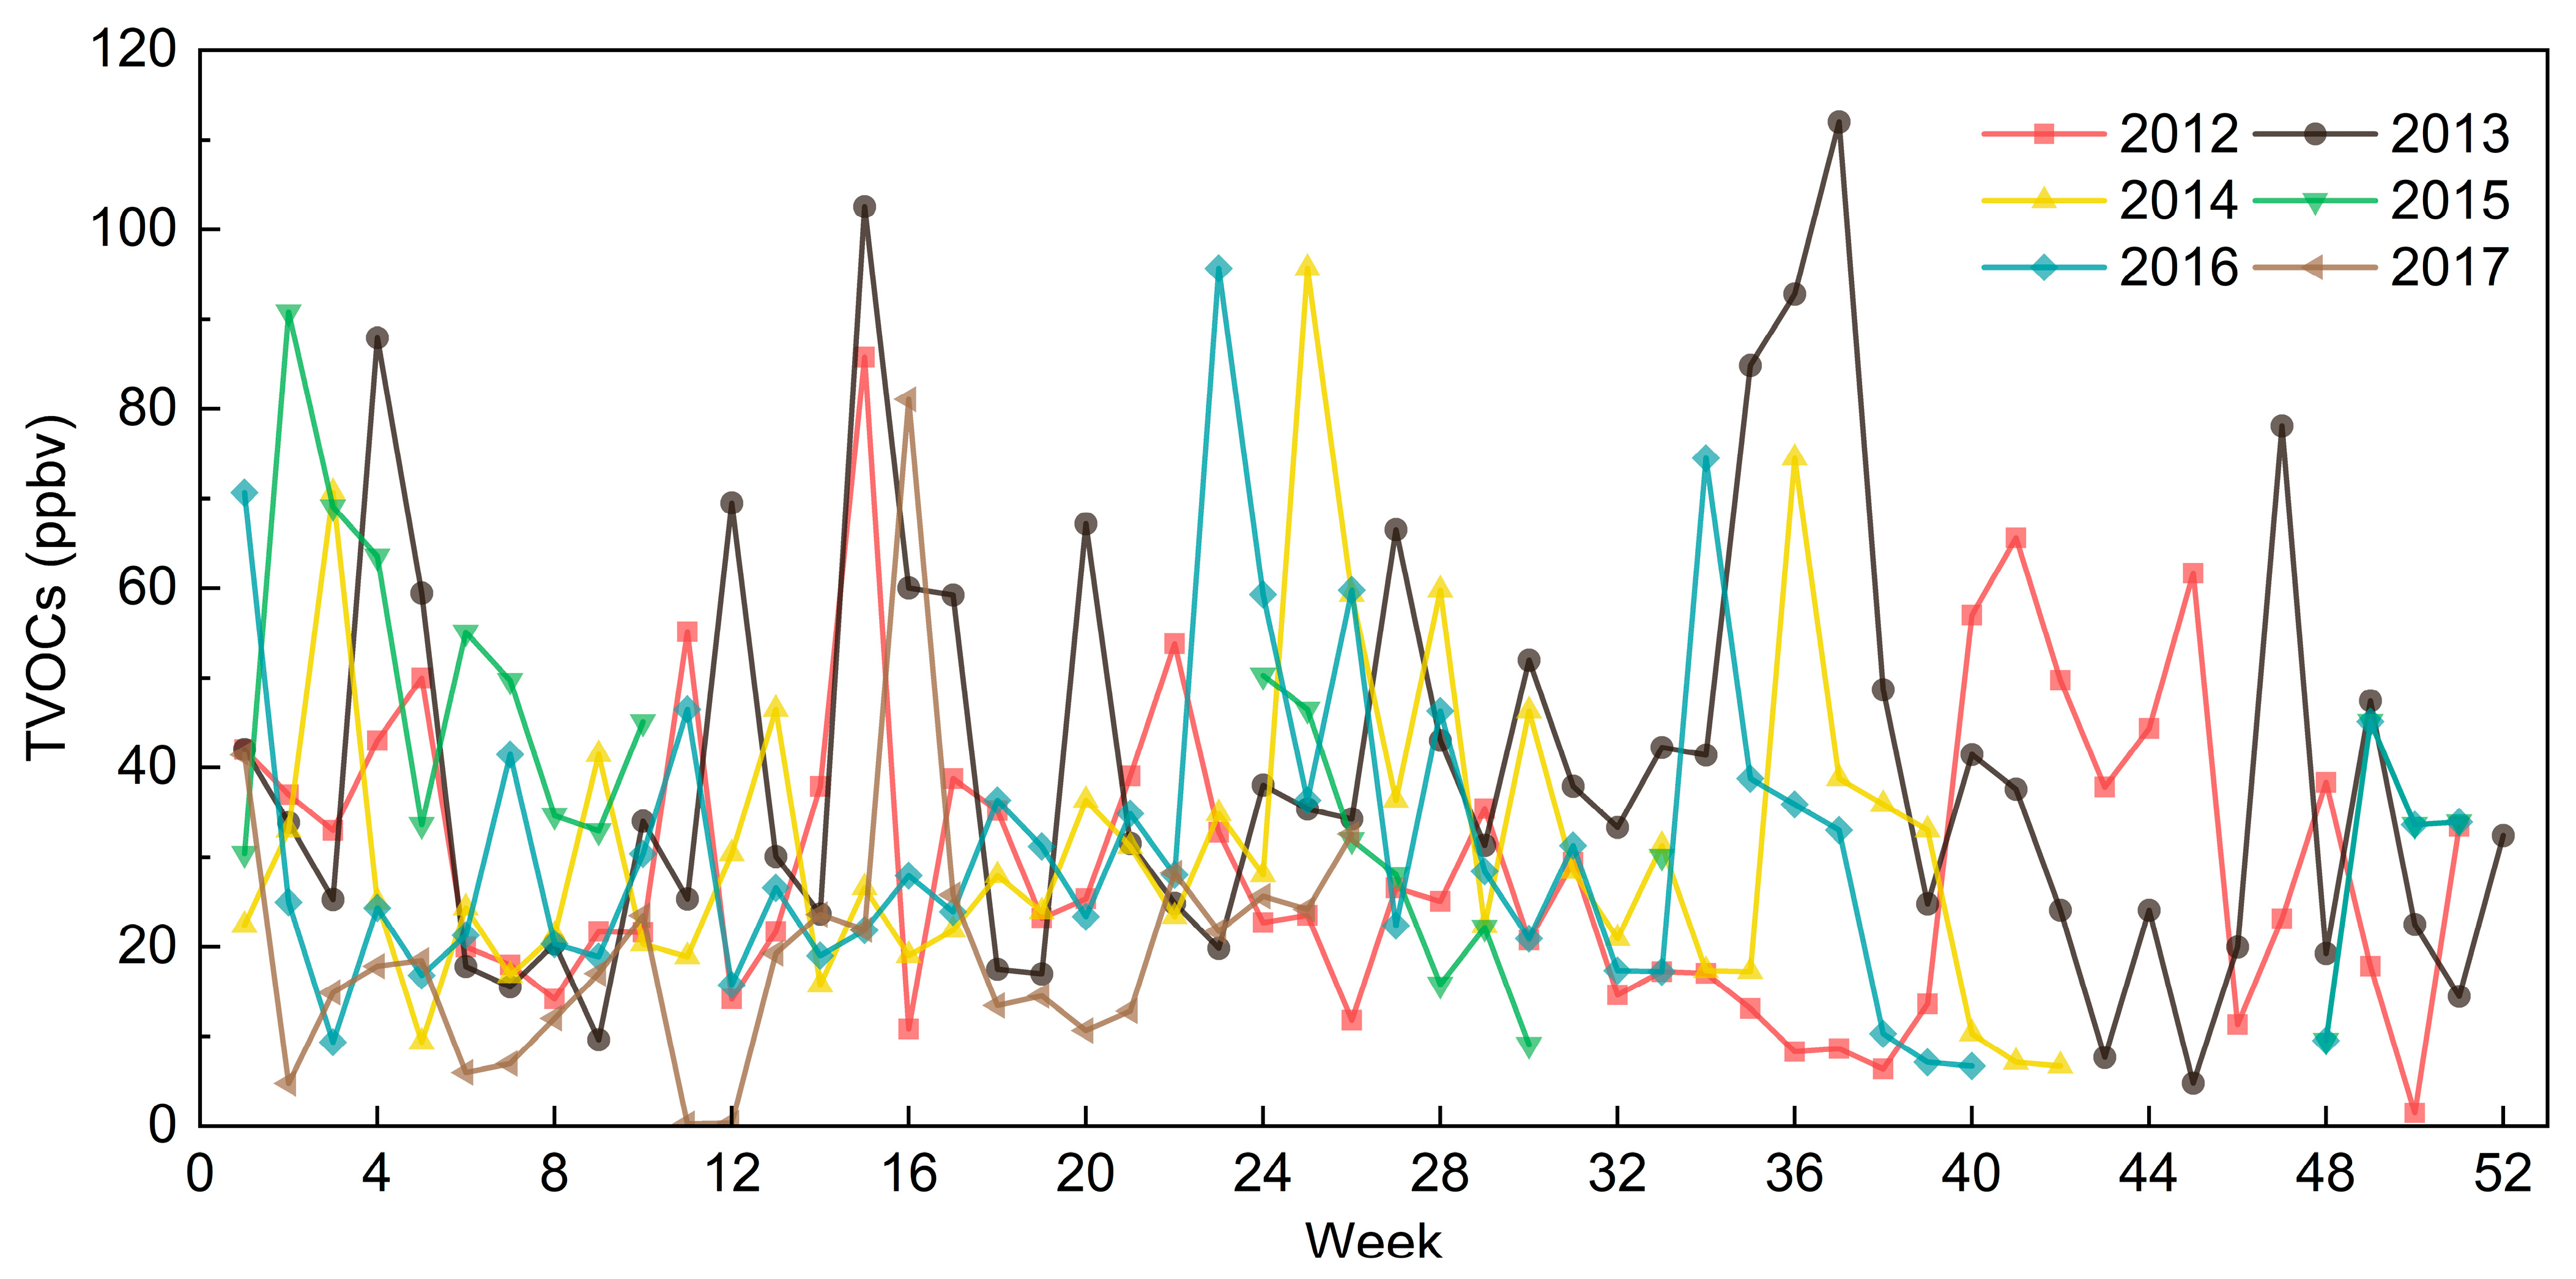
3.1.1. Concentration Levels and Temporal Variations

The minimum, maximum, mean values, and standard deviations of TVOC concentration (volume fraction, the same as below) from 2012 to 2017 are listed in Table 1. Owing to instrumentation malfunction, the data in 2015 were incomplete and inadequately reflective of the entire annual time, consequently necessitating their exclusion from the analytical process. The recorded TVOC concentrations ranged from 0.25 ppbv to 112.0 ppbv throughout the observation period, with the highest and lowest values occurring in September 2013 and March 2017, respectively, and the arithmetic mean value was 31.33 ± 19.97 ppbv. The aggregate annual mean TVOC concentrations over the observation period showed a trend of first increasing and then decreasing from 2012 to 2017. VOC concentration had a significant increase from 2012 to 2013 (p < 0.05), and the lowest mean value in 2017 was significantly lower compared to the preceding years (p < 0.05). The temporal variation in TVOCs during the observation period is shown in Figure 1. Overall, the variational trend in TVOC concentrations in the Beibei urban area of Chongqing displayed a comparable course during the years 2012, 2013, and 2017. Similarly, the trend of variation in the remaining triad of years, specifically 2014, 2015, and 2016, and the variational trend in the other three years, i.e., 2014, 2015, and 2016, exhibited a comparable pattern.
The seasonal distribution of TVOC concentrations is shown in Figure 2. According to meteorological criteria, seasons were divided into spring from March to May, summer from June to August, autumn from September to November, and winter from December to the next February. The data from 2012 to 2014 and 2016 were chosen for the focus of the analysis, as the data pertaining to 2015 and 2017 were incomplete. The results showed that the peak TVOC concentrations were observed during summer in both 2014 and 2016, whereas in 2012 and 2013 the highest concentrations occurred during spring and autumn, respectively. However, an overarching analysis of the observation period revealed that TVOC concentrations were highest in summer (36.0 ppbv), lowest in winter (26.9 ppbv), and demonstrated approximate parity in autumn (32.1 ppbv) and spring (32.0 ppbv). The disparity in mean TVOC concentration between summer and winter amounted to 9.1 ppbv, accounting for approximately 29.1% of the aggregate mean TVOC concentration, with significant seasonal fluctuations (p < 0.05).
The top 10 VOC species with the highest concentrations in each year are summarized in Table 2. Isopentane (1.39–2.9 ppbv), butane (1.56–2.4 ppbv), and pentane (0.70–1.49 ppbv) emerged as the species exhibiting the most heightened concentrations among the alkanes. Benzene (0.92–2.1 ppbv) and toluene (1.20–2.1 ppbv) were the most abundant species among the aromatics. Chlorobenzene (0.95–1.70 ppbv) and styrene (1.59–2.2 ppbv) assumed predominance in halo-hydrocarbons and alkenes, respectively.

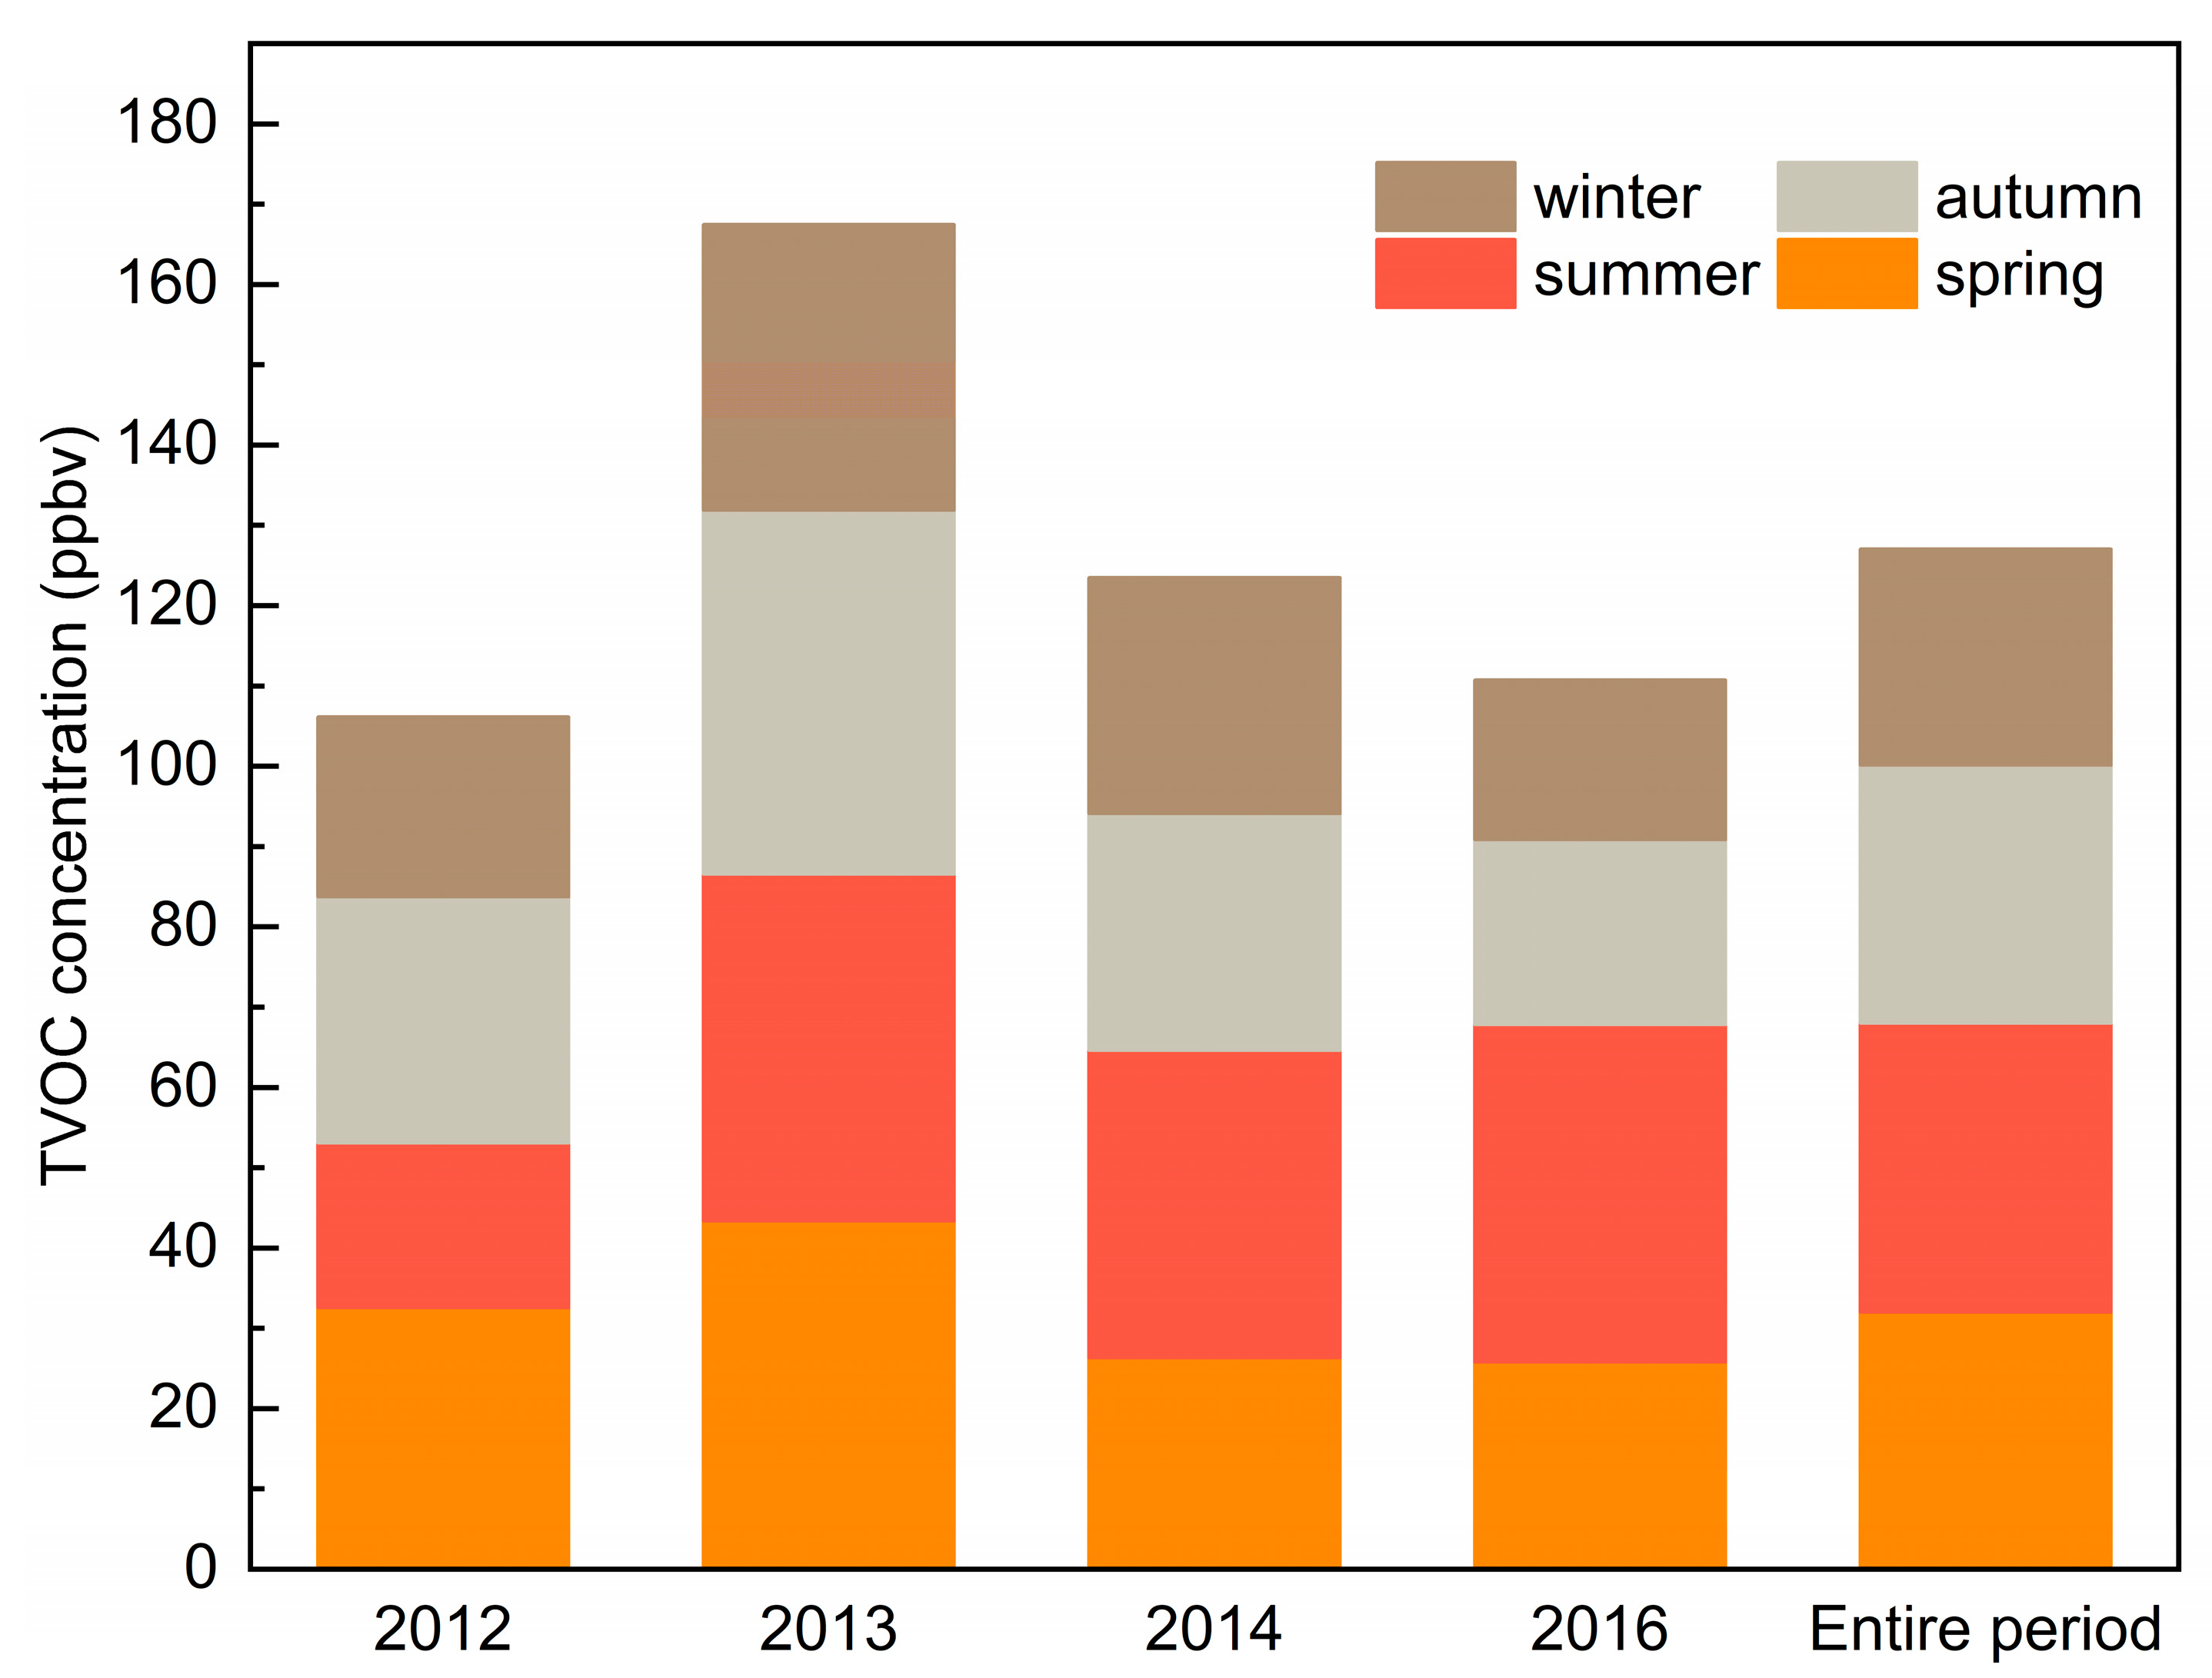
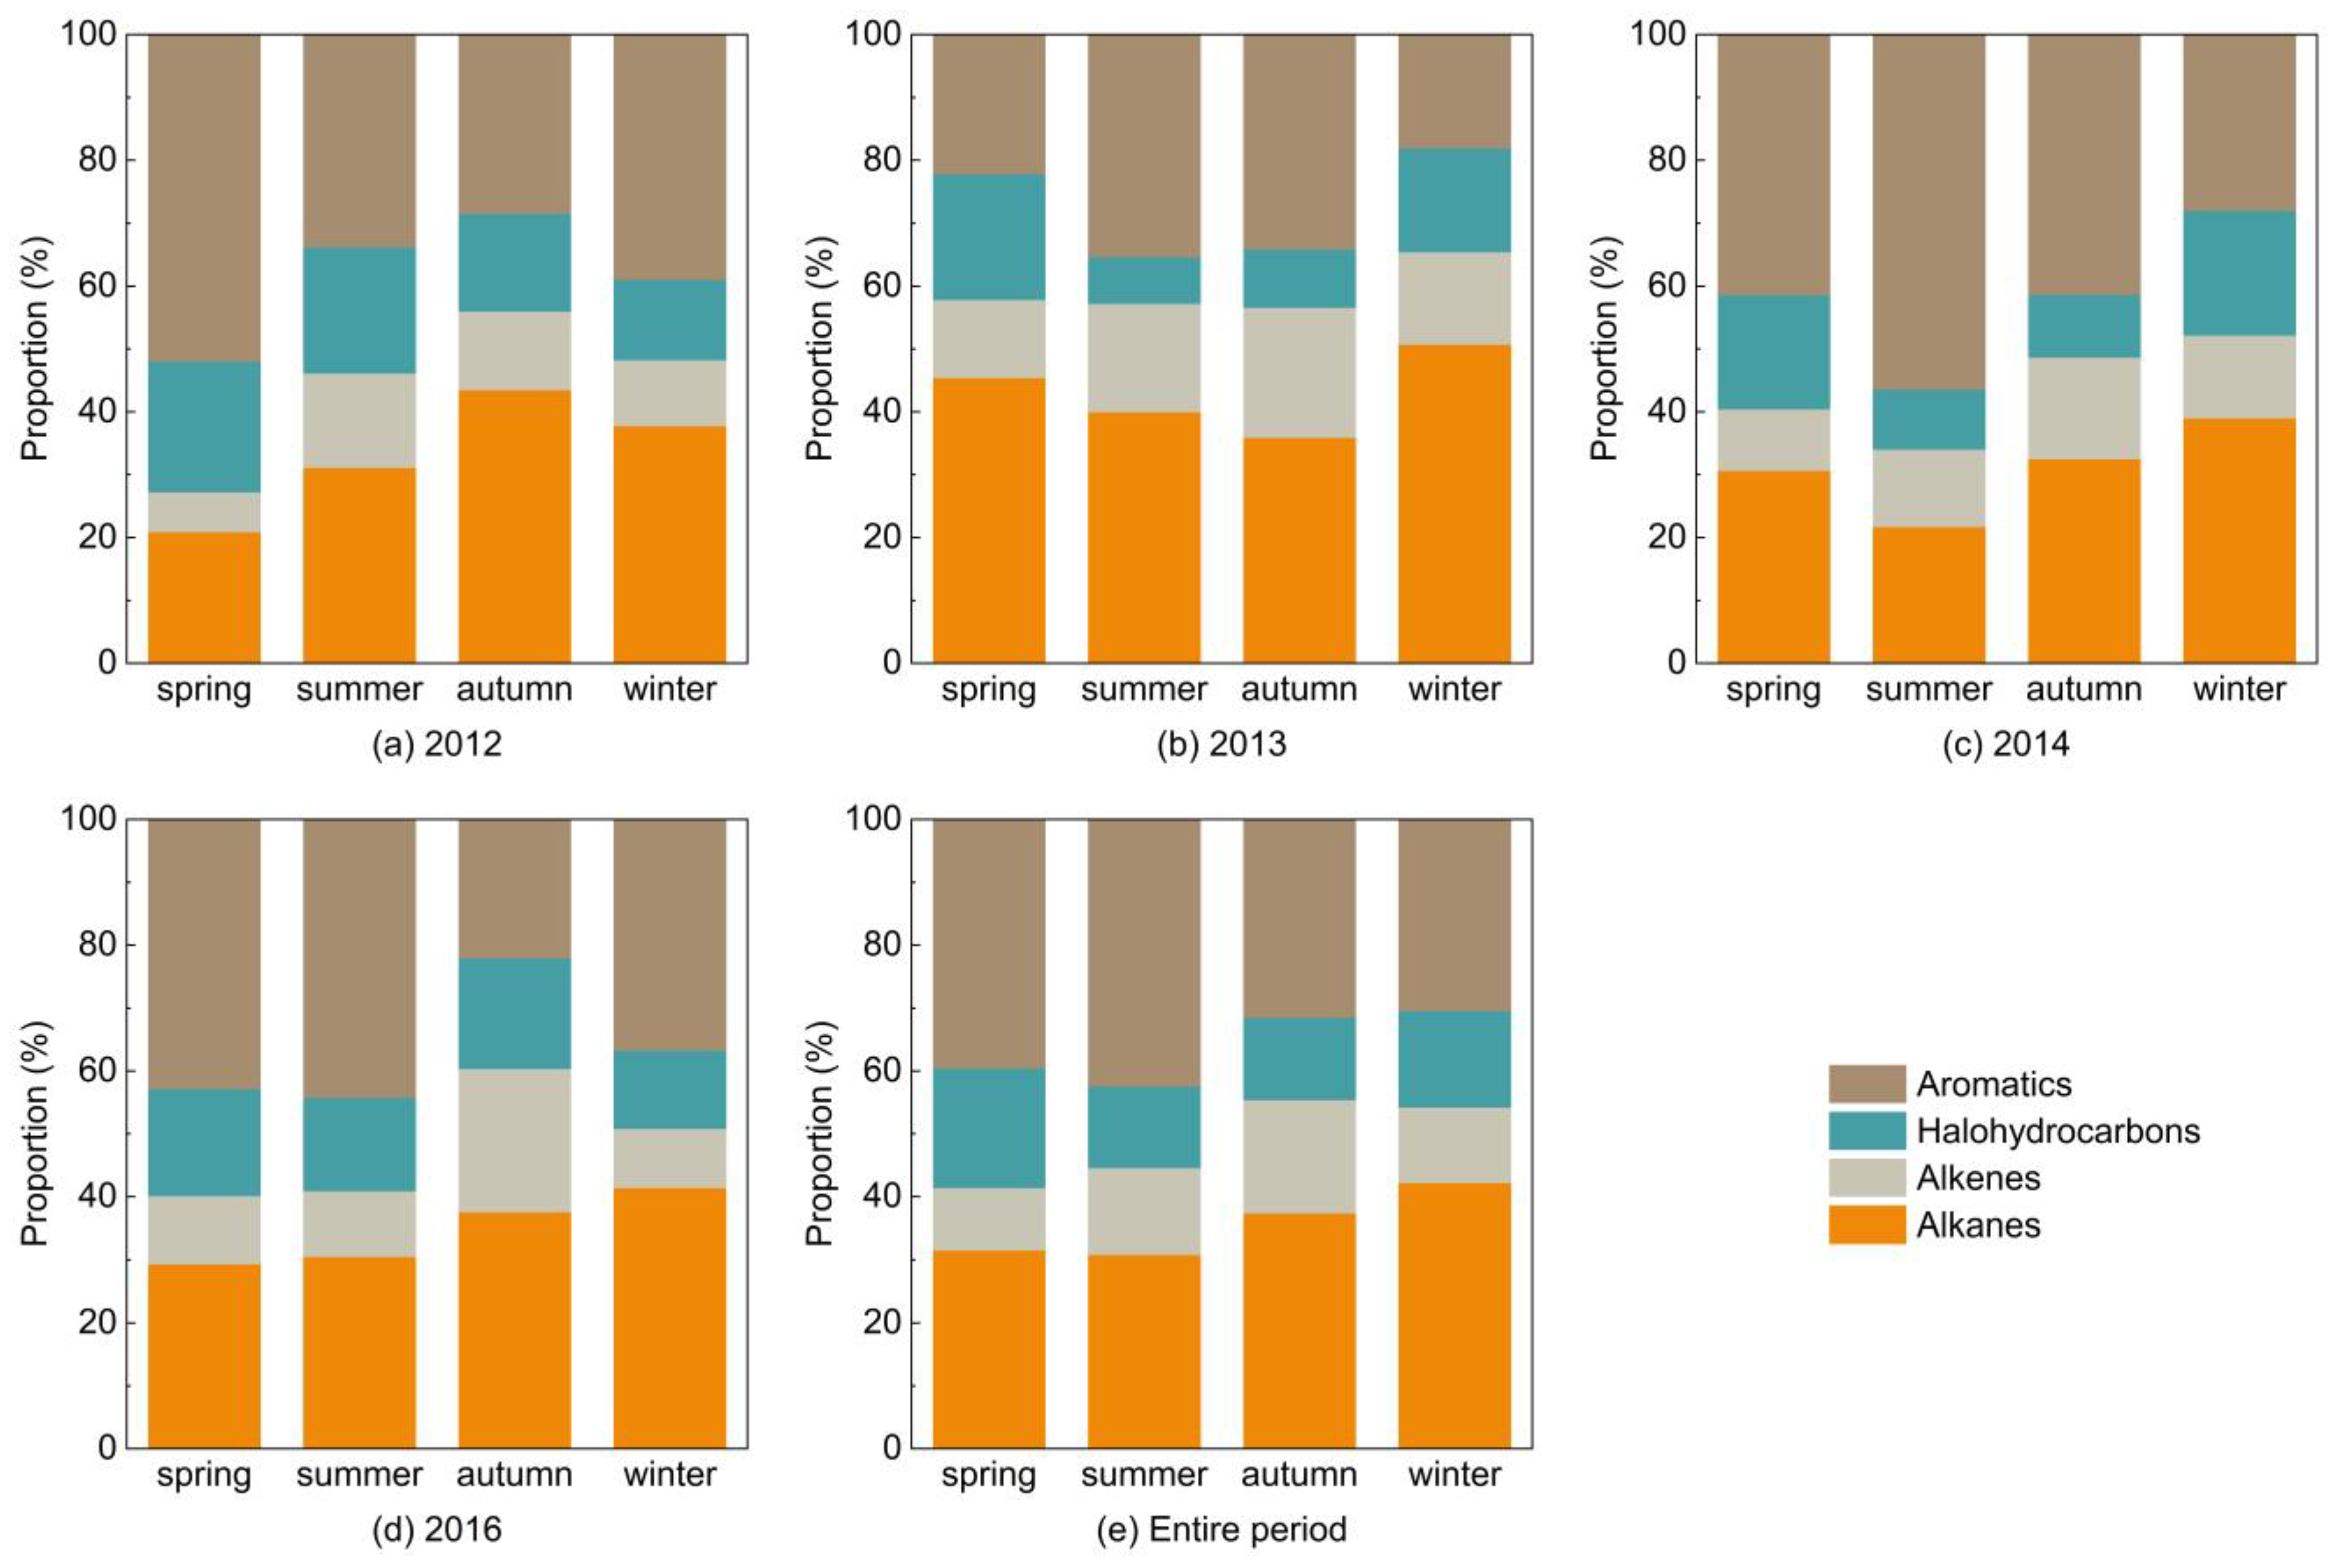
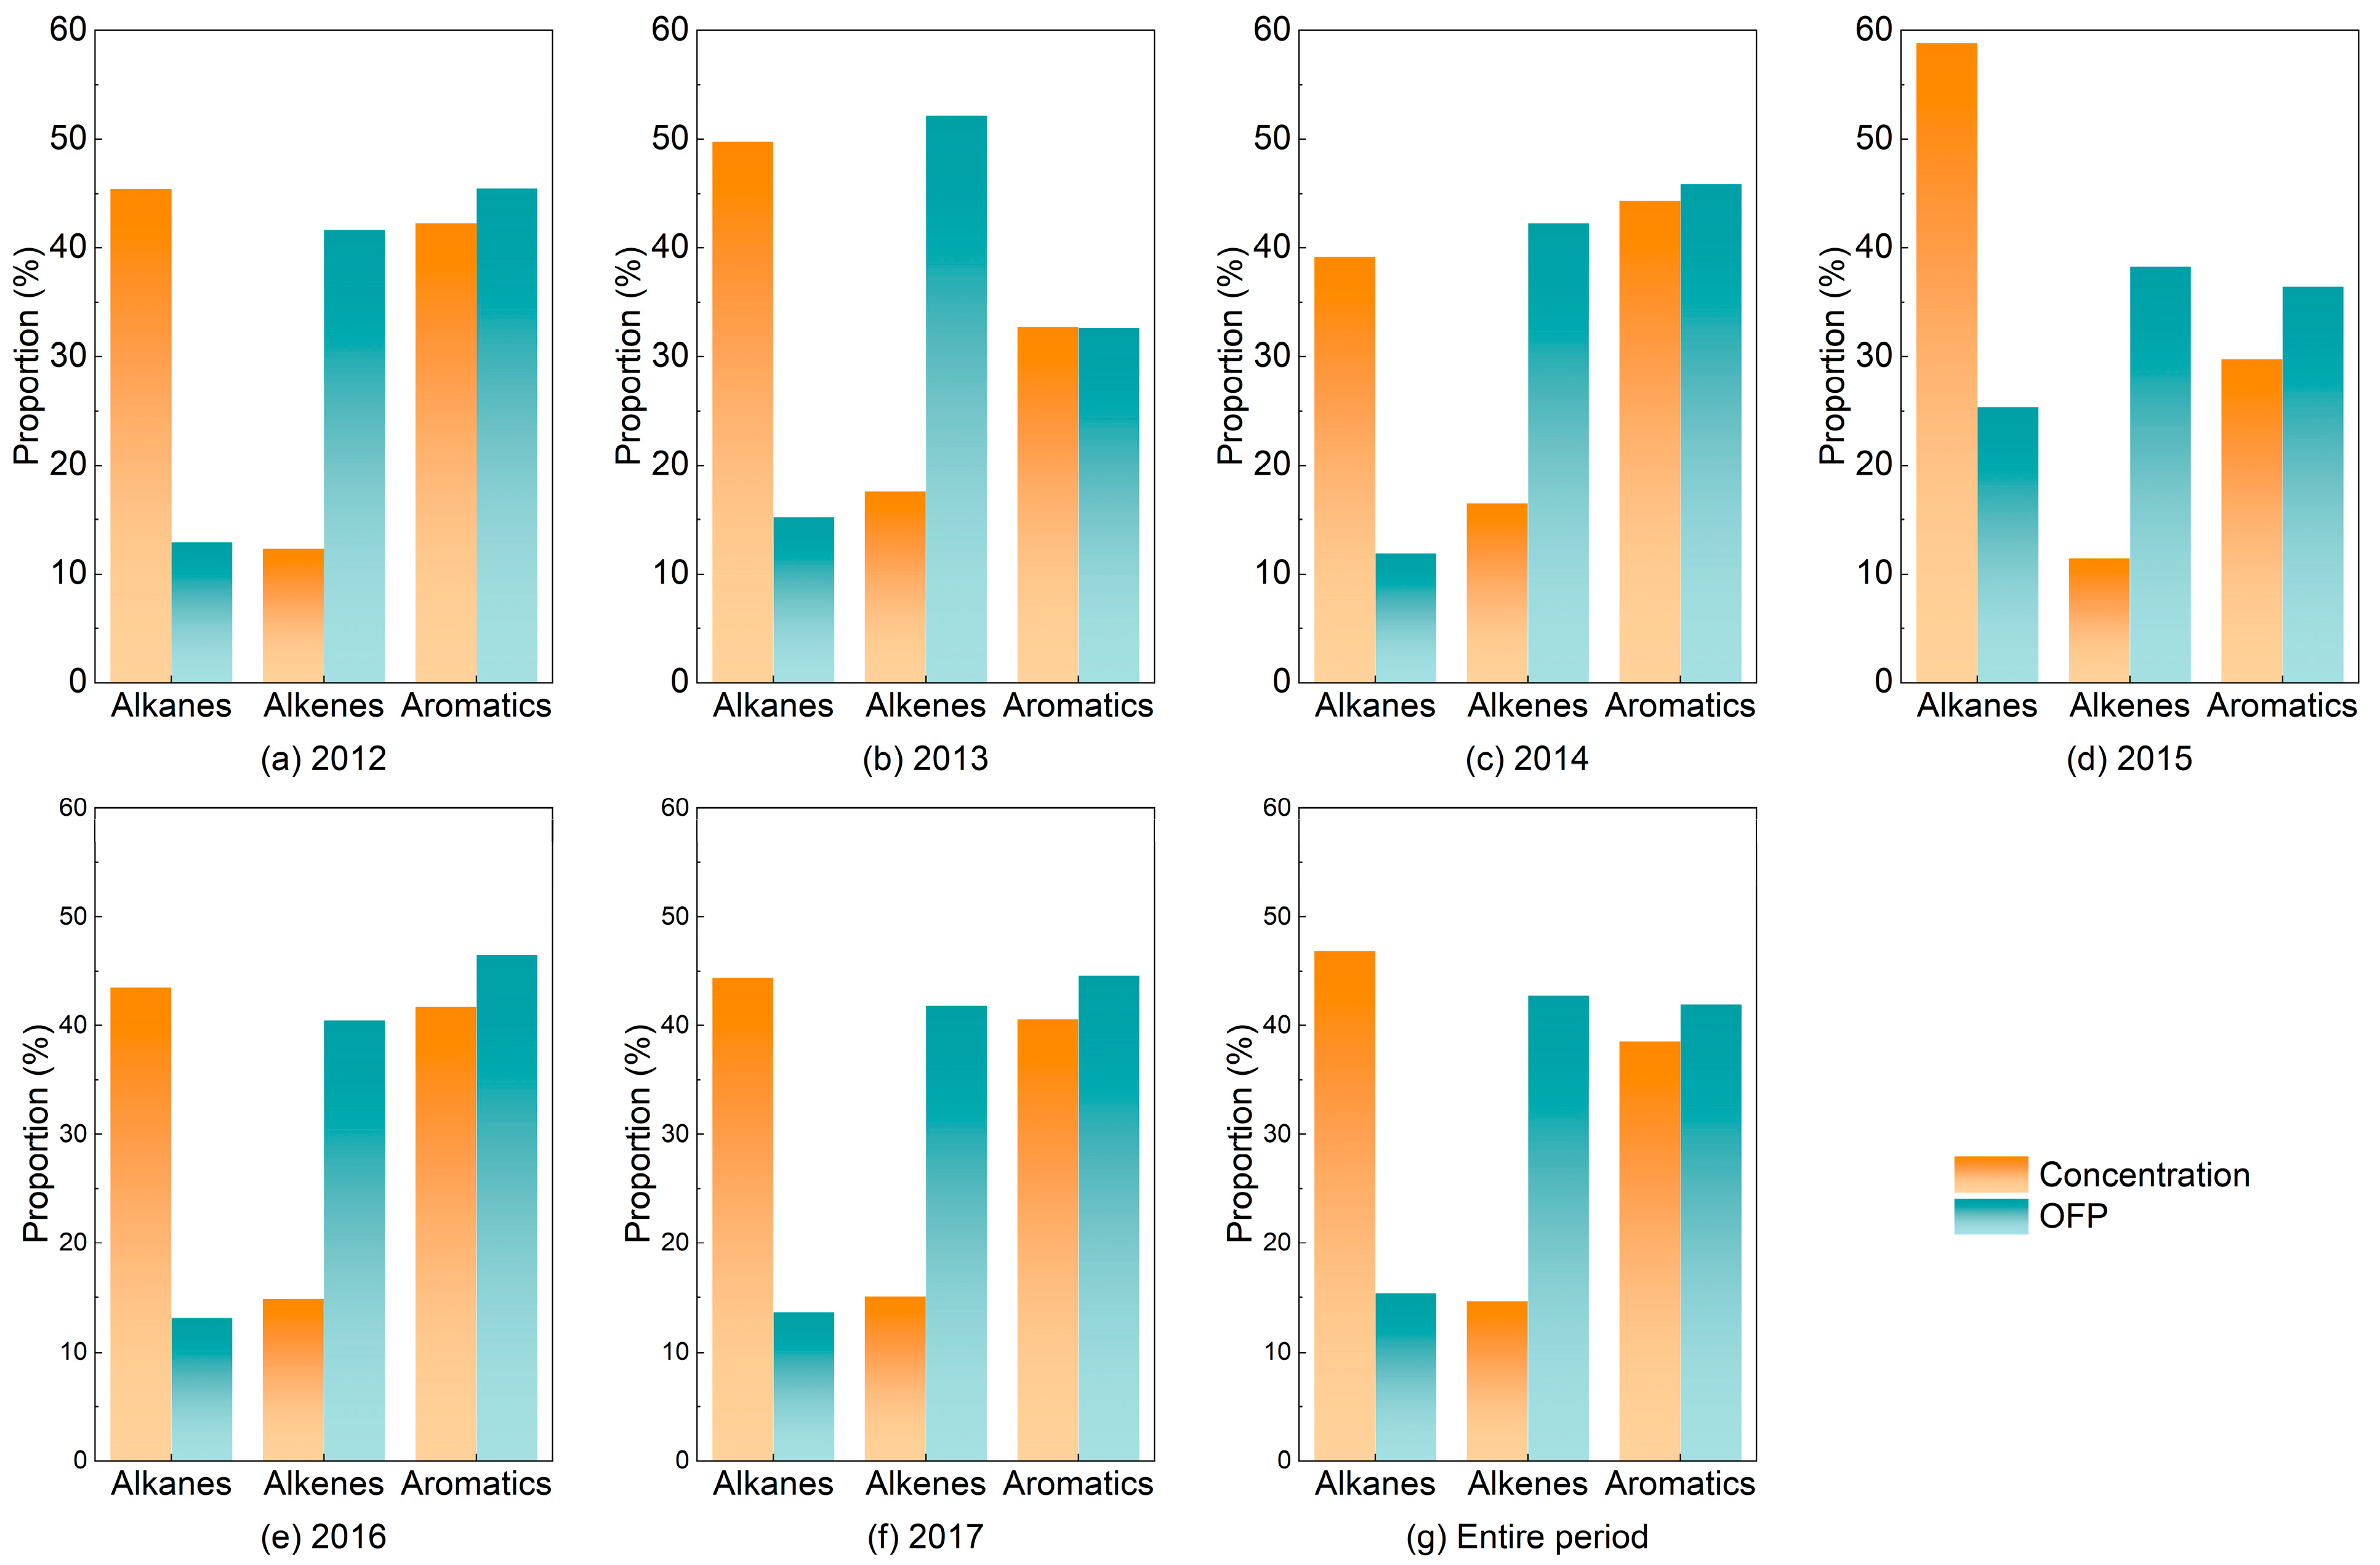
3.1.2. Composition and Seasonal Distribution
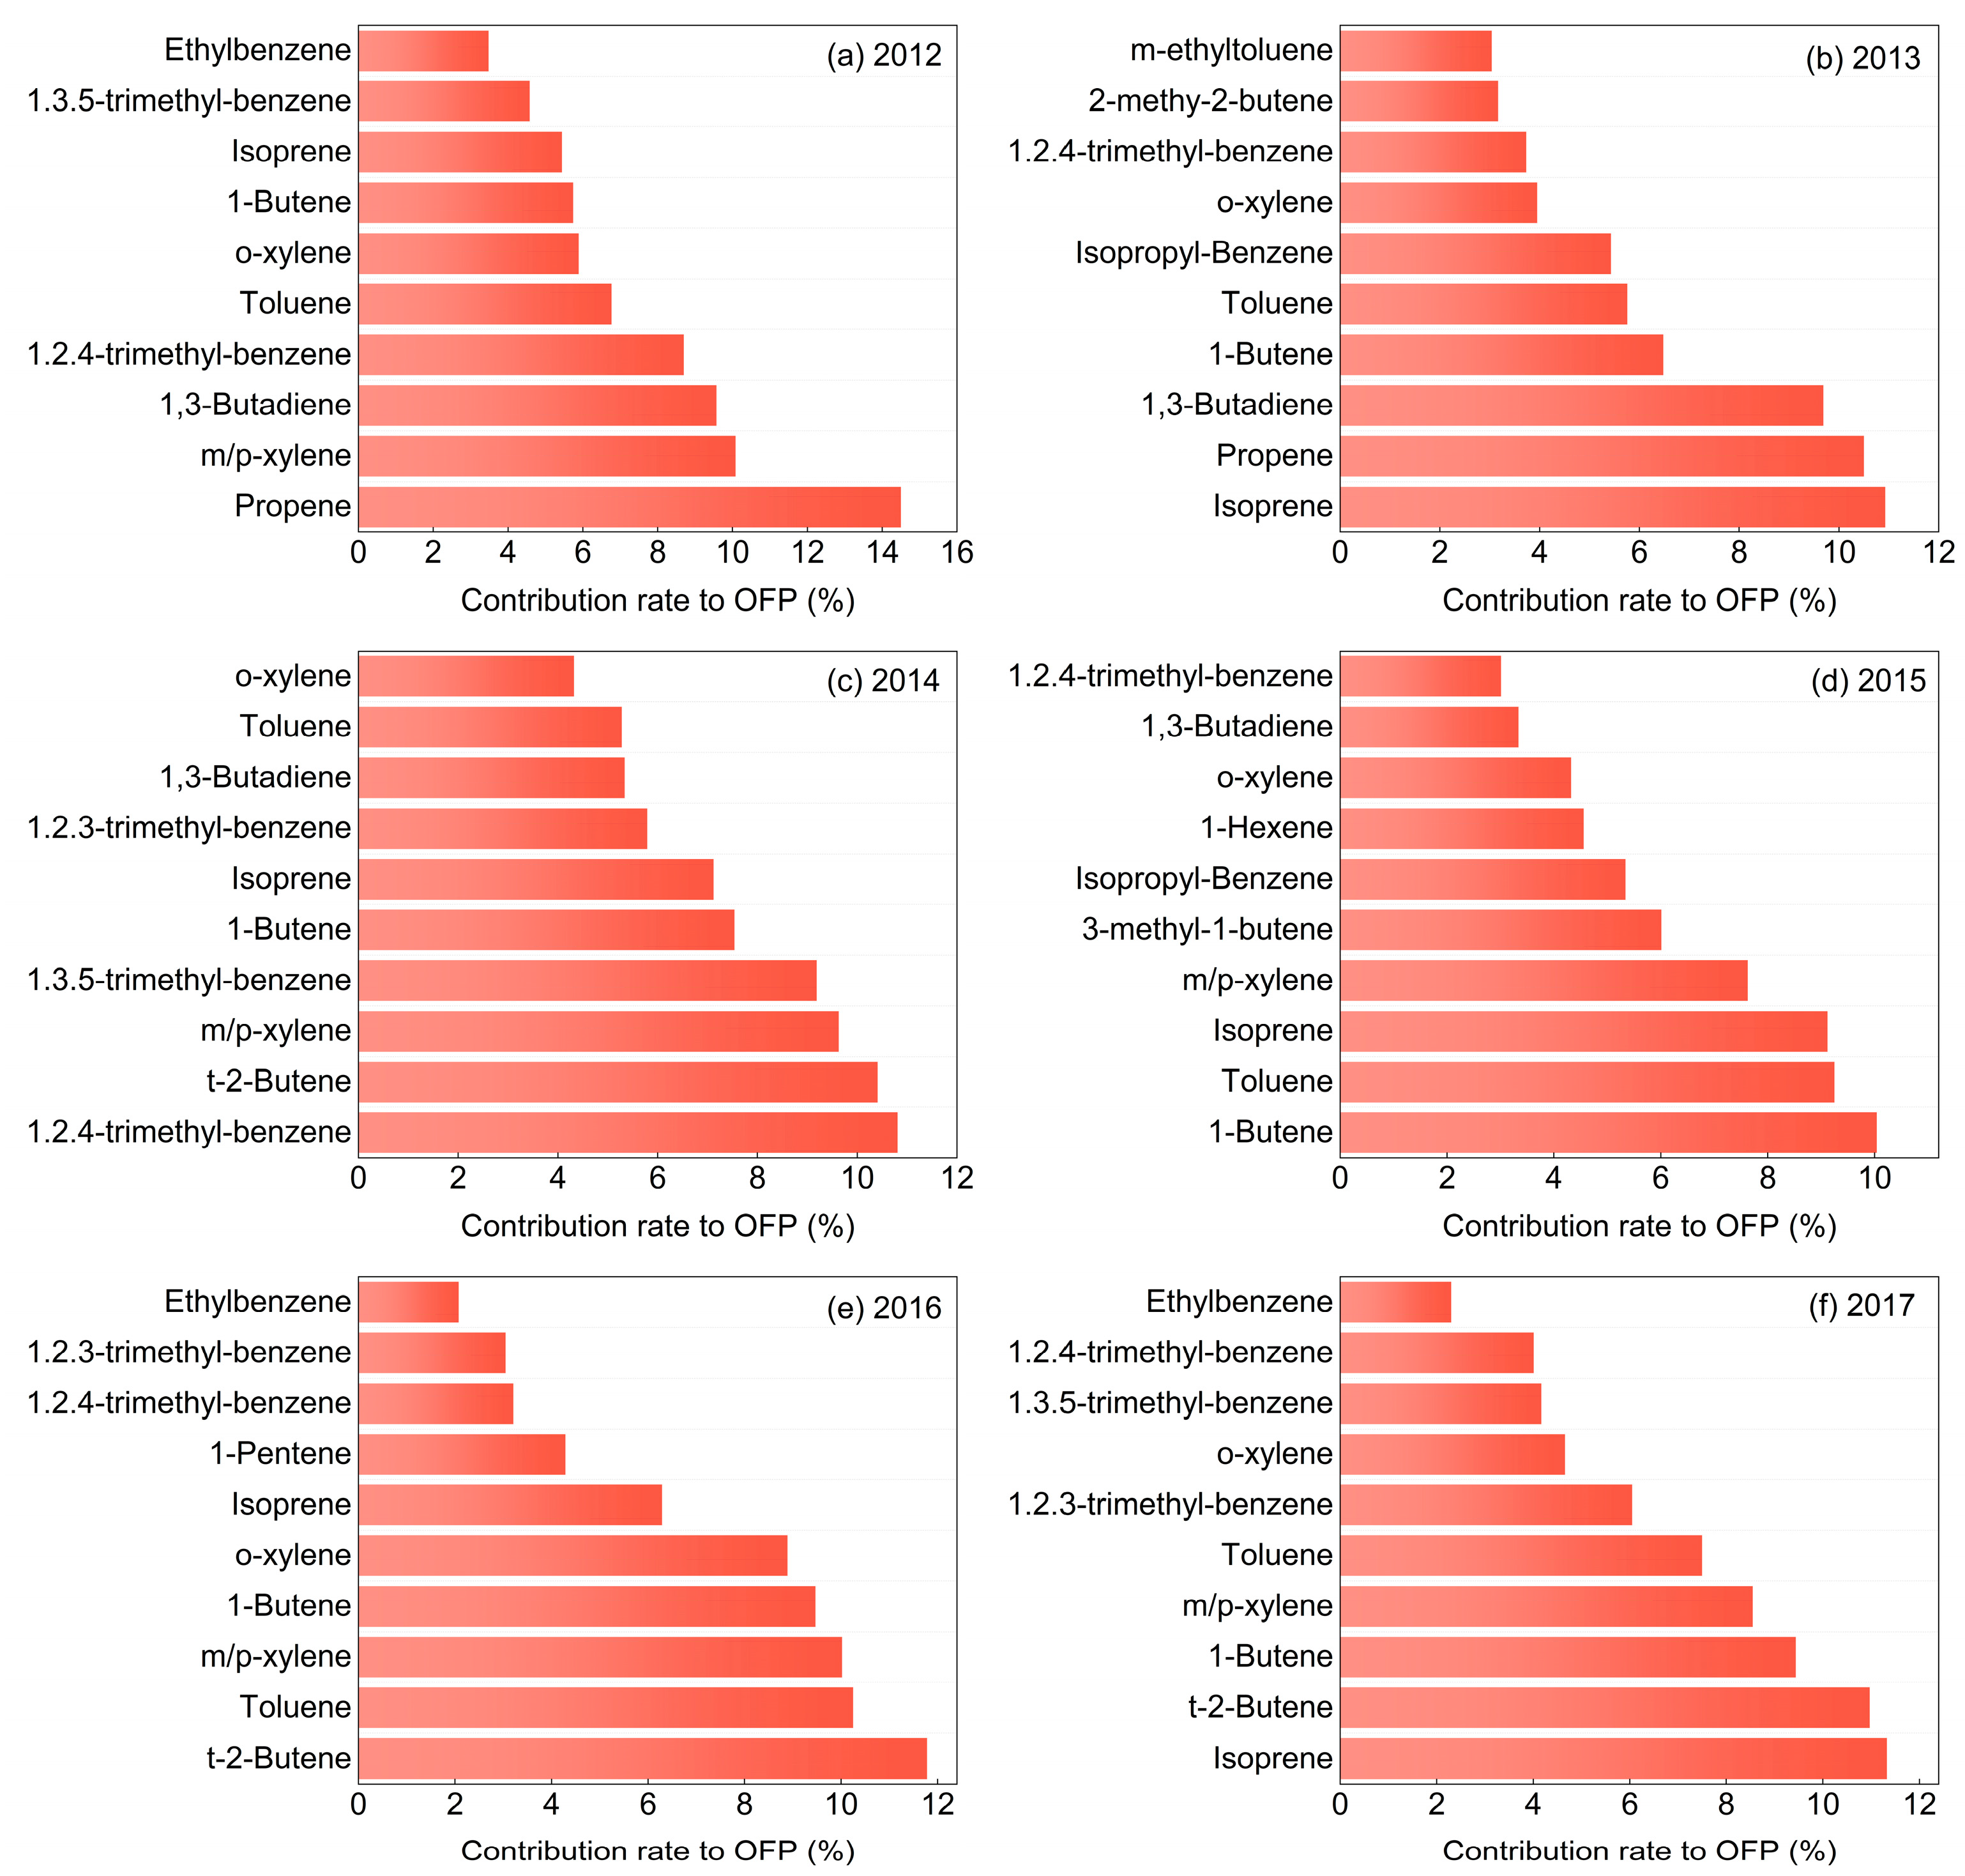
Figure 3 graphically illustrates the composition ratios of TVOCs in Chongqing. Alkanes (33.7~43.1%) and aromatics (27.7~37.9%) commanded a relatively heightened share of TVOCs, whereas halo-hydrocarbons (13.1~18.6%) and alkenes (8.7~15.3%) occupied a comparably diminished portion. Over the entire course of the observation period, the composition of TVOCs was characterized by alkanes (36.8%) > aromatics (35.6%) > halo-hydrocarbons (14.4%) > alkenes (12.6%).
Figure 4 shows the proportion of each VOC species in different seasons within each year. The seasonal variation in aromatics concentrations was the same as the variation in TVOC concentration throughout the observation period, with the highest proportion in summer (42.4%) and lowest in winter (30.4%), and the former was, significantly, 12.0% higher than the latter (p < 0.01). On the other hand, the alkane concentrations displayed a converse pattern, being highest in winter (42.3%) and lowest in summer (30.9%) with a difference of 11.37% (p < 0.05). The alkene concentrations were highest in autumn (18.04%) and lowest in spring (9.8%), with a notable discrepancy of 8.2% (p < 0.01). The halo-hydrocarbon concentrations were highest in spring (19.0%) and lowest in summer (13.0%), with a difference of 6.0% (p < 0.01). However, whether considering the complete observation period or individual years, aromatics consistently emerged as the predominant species during spring and summer, subsequently followed by alkanes. In contrast, during autumn and winter, alkanes took precedence as the most abundant species, followed by aromatics.

3.2. OFP

The contribution of atmospheric VOCs to the OFP in Chongqing from 2012 to 2017 and the OFP for different VOC species was calculated based on the MIR values. However, the analysis herein omits the discussion of the OFP of halo-hydrocarbons, attributable to both the overall low photochemical activity and incomplete MIR values of halo-hydrocarbons.
The compositions and OFP contributions of alkanes, alkenes, and aromatics during the observation period are illustrated in Figure 5. The results showed that alkanes constituted the most substantial volumetric proportion of atmospheric VOCs in Chongqing (39.2–58.8%), while contributing the least to OFP (10.9~25.3%). In contrast, alkenes accounted for the smallest volumetric share of VOCs (11.4–17.6%) but contributed the most to OFP (38.2–52.2%), and the volume fraction of aromatics (29.8–44.3%) was similar to their contribution to OFP (32.6–49.8%). During the whole observation period, alkanes, alkenes, and aromatics among VOCs accounted for 46.8%, 14.6%, and 38.6%, while contributing 15.3%, 42.8%, and 41.9% to the OFP, respectively.
The top 10 VOC species contributing to the annual OFP from 2012 to 2017 are displayed in Figure 6. Although there were some differences among the top 10 VOC species each year, the total proportion of VOCs in the top 10 was similar, ranging from 62.6% to 75.4%, with an average proportion of 69.0%. Overall, the top 10 VOC species contributing most to OFP each year are largely similar in category, i.e., alkenes (30.4~44.8%) and aromatics (18.0~45.0%).
Figure 7 shows the seasonal variations in OFP in the Beibei urban area. Except for 2012, OFP values were highest in summer (maximum: 170.7 ppbv), followed by autumn and spring, and lowest in winter (minimum: 62.5 ppbv). On a comprehensive scale, seasonal OFP during the whole observation period followed the trend of summer (131.6 ppbv) > autumn (104.2 ppbv) > spring (98.2 ppbv) > winter (81.5 ppbv), and the OFP in summer significantly outstripped that in winter (p < 0.05).

3.3. T/B Ratio and PCA

3.3.1. T/B Ratio

Assessing the relative ratios among diverse aromatic compounds offers a valuable approach to identifying the origins of VOC emissions. Specifically, atmospheric toluene is mainly derived from solvent volatilization and motor vehicle emissions, and the toluene-to-benzene ratio (T/B ratio) serves as a diagnostic tool for appraising the influence of motor vehicle emissions on the atmosphere. A T/B ratio lower than 2.0 generally signifies a substantial influence of emissions from transportation sources on the atmosphere. Conversely, a T/B ratio exceeding 2.0 suggests the coexistence of another source or sources of toluene, such as industrial activities involving solvent volatilization [23,27]. During the course of this investigation, the T/B ratios in the Beibei urban area were computed for the years 2012 to 2017, yielding values of 0.76, 1.33, 1.30, 0.96, 2.1, and 0.69, respectively, with an average T/B ratio of 1.18. Remarkably, except for 2016, all annual T/B ratios consistently remained below the pivotal threshold of 2. These findings collectively point towards motor vehicle emissions as the primary contributor to VOCs in the Beibei urban area.

3.3.2. PCA

In this study, the PCA model was utilized to analyze the sources of VOCs and the relative contribution of each source in the Beibei urban area. According to the previous study [26], reliable PCA outcomes can be obtained when n ≥ m + 50 (n represents the number of samples and m represents the number of pollutants to be analyzed). In this study, 72, 79, 79, 76, 80, and 80 substances were analyzed in the VOC samples for each year from 2012 to 2017, respectively. The number of data samples met the aforementioned criteria, 33 typical VOC species were selected each year for the dimensionality reduction factor analysis, and the principle of eigenvalue larger than 1 was used in the factor extraction process (Kaiser Standard). The percentage variance of the first principal component for each year ranged from 32.7% to 61.7%, and the cumulative variance contribution of the principal components ranged from 81.7% to 95.6%. Nonetheless, the results of the analysis revealed little variation in the principal component factors from year to year, so only the overall PCA results for the entire observation period were discussed in this paper. The cumulative variance in the first six principal component factors for the entire observation period was 84.5%, while the variance in the first principal component reached 36.1% (Table 3).
Factor 1 had high factor loadings for aromatics, such as 1,2,4-trimethylbenzene, o-xylene, benzene, methyl toluene, and 1,3,5-trimethylbenzene, which are typical VOCs in motor vehicle exhaust [7,28,29], and the lower T/B value (1.18) further proves that motor vehicle exhaust emissions were the main source of atmospheric VOCs in the Beibei urban area. Therefore, Factor 1 can be delineated as motor vehicle exhaust emissions and contributed 42.7% to TVOCs. The main substances in factor 2 were alkanes from C4 to C6 (isopentane, pentane, isobutane, etc.). Isopentane and pentane are indicators of gasoline evaporation, and isobutane is the main component of liquefied petroleum gas (LPG) [30]. Therefore, Factor 2 can be classified as fuel evaporation, with a contribution of 24.8%. Factor 3 prominently featured trans-2-butene and decane as its primary constituents. Trans-2-butene is present in gasoline vehicle exhaust and decane is present in diesel vehicle exhaust [31]. In a parallel vein, the inclusion of 1-Butene within Factor 5 emerges as a potent tracer of vehicle emissions [32]. Therefore, both Factor 3 and Factor 5 can be ascribed to motor vehicle exhaust emissions, with a contribution of 11.1% and 6.8%, respectively. Factor 4 had a high factor loading of trichloromethane, which originates from various chemical processes, encompassing industrial activities such as those within the rubber sector [33,34]. Therefore, factor 4 can be classified as industrial production emissions with a contribution ratio of 9.0%. Isoprene is the prominent substance in Factor 6 and is a tracer of emissions from plant sources [31]. However, isoprene can also be considered a product of motor vehicle fuel combustion in urban areas [6,7]. In particular, there was a good correlation between isoprene and 1,3-butadiene when atmospheric samples are taken from the roadside [35]. In this study, a significant linear correlation (p < 0.05) was found between isoprene and 1,3-butadiene, indicating that the main source of isoprene is motor vehicle emissions. Consequently, Factor 6 was classified as motor vehicle emissions with a contribution of 5.5%.
In recapitulation, the main source of VOC emission in Beibei District, Chongqing, is motor vehicle emissions (66.2%), followed by fuel evaporation (24.8%) and various industrial activities (9.0%).

4. Discussion

4.1. Characteristics of VOCs

4.1.1. Analysis of the Concentration Levels and Temporal Variations

Throughout the observation period, 2013 was the year with the highest VOC concentrations. Motor vehicle ownership in Chongqing rose sharply from 1.57 million in 2012 to 1.91 million in 2013 (http://tjj.cq.gov.cn/, accessed on 1 August 2023). Coinciding with this period, Chongqing experienced its first continuous O3 pollution problem, and as a result the community gradually began to pay attention to the precursors of O3 pollution: VOCs. The Chongqing municipal government initiated a targeted endeavor to address air pollution and implemented a suite of policies to fortify the management of VOC pollution (https://sthjj.cq.gov.cn/, accessed on 1 February 2023). Over the ensuing years, diverse VOC abatement initiatives were executed in several industrial domains, comprising transportation equipment production, active pharmaceutical ingredient (API) manufacturing, printing, packaging, and chemical manufacturing. Additionally, the “leak detection and repair” technological innovation was implemented in the petrochemical sector, whereas oil and gas recovery methods were carried out for petrol stations, oil storage depots, tanker trucks, and completed oil terminals across the city [12]. VOCs emission standards were also introduced and implemented for key industries such as automobile and motorbike parts, automobile maintenance, printing, and packaging in Chongqing, which is rare in Chinese cities. Consequently, there has been a progressive reduction in the TVOC concentrations over successive years, culminating in 2017, a year in which the TVOC concentrations exhibited a notable decline in comparison to the preceding years. This outcome served as a clear indication of the efficacy of the implemented air pollution control measures.
VOC emissions were influenced by the major urban industrial types, energy structures, and vehicle owners in different cities. The variabilities stemming from discrepancies in the sampling period, sampling site, sampling method, and measured species may make a certain impact on the final results, as well [7]. In comparison to long-term observations of VOCs in other cities in China, the annual average concentration of TVOCs in the Beibei urban area was at an intermediate range. Additionally, the TVOC concentration in the Beibei urban area was higher than that at the background site, Jinyun Mountain, but lower than that in other urban areas when compared to prior VOC-related research in Chongqing (Table 4).
During the entire observation period, the concentration of TVOCs was significantly higher during the summer months in comparison to the winter period, agreeing with the previous research conducted in the urban area of Chongqing in 2011, which obtained similar results [36]. However, this finding contrasted with the reports from numerous previous studies conducted in other cities, which revealed lower TVOC concentrations in summer and higher TVOC concentrations in winter [7,23,37,38]. But it is worth noting that, in this study, the sampling site was adjacent to the national natural scenic reserve Jinyun Mountain, which is a well-known summer resort in Chongqing and a national beauty reserve. The main emission source of VOC could undergo a transformation in correspondence with the prevailing tourist season [10,39]. In instances of the winter season, characterized by a lull in tourism activities, a state of tourism depression may precipitate a discernible decrease in emission sources, consequently contributing to a reduction in the overall VOC concentration levels. The sampling site was about 50 m away from Beiqing Road, the main traffic artery of Beibei, and about 800 m to the south was a highway intersection with two gas stations along the road. In summer, due to the heavy traffic flow caused by the peak tourist season, VOC emissions could be promoted to a certain extent [23,38]. In addition, due to its unique geographic setting and weather patterns, Chongqing—also known as the “Stove City”—had China’s highest summer temperatures. While higher summertime temperatures facilitated more photochemical reactions, they also encouraged VOCs from solvent, fuel, and other sources to evaporate into the atmosphere [28]. Finally, it is worth noting that unlike some cities in northern China, Chongqing does not have winter heating activities of burning coal, natural gas, and biomass, so its VOCs emissions in Chongqing were lower in winter [12,40].
Characteristic components in VOCs can be used as identifiers of emission sources. Among the top 10 VOC species with the highest annual concentrations mentioned above, butane is a typical emission of liquefied petroleum gas (LPG) mopes, gasoline vehicles, and diesel vehicles [6]. Toluene and benzene are the common VOCs in motorcycle exhaust emissions, and pentane and isopentane are the prevalent compounds in gasoline evaporation [41]. The high concentrations of all these substances further reflect the fact that the atmospheric concentrations of VOCs in Chongqing were strongly influenced by vehicle exhaust emissions and fuel volatilization.

4.1.2. Analysis of the Composition and Seasonal Distribution

Alkanes and aromatics accounted for the majority of the VOCs in the Beibei urban area of Chongqing, while alkenes and halo-hydrocarbons contributed less to the concentration of TVOCs. Therefore, the strategic imperative of curbing VOC emissions ought to be directed towards alkane and aromatics in the Beibei urban area. This result is consistent with the relevant research results in the North China Plain, the Yangtze River Delta, and the Pearl River Delta, as well as in some other regions in China [40,42]. The relative persistence of alkanes in the atmosphere may account for their abundance. In addition, alkanes and aromatics were the main VOCs in the exhaust of light gasoline vehicles, with an average weight percentage of 36.4% and 33.1%, respectively [43]. Benzene series were closely related to the use of solvents, architectural coatings, fuel volatilization, and various industrial processes. This implied that the heightened VOC emissions in Beibei may mainly be ascribed to the discharge of vehicle exhausts, fuel evaporation, and industrial activities.

4.2. Photochemical Activity Analysis of VOCs

The photochemical activity of VOCs is related to the concentration of each component and free radicals in the atmosphere, as well as the photochemical reaction kinetics. The presence of various VOC species in the atmosphere has been observed to have different photochemical reactivity levels, and their contribution to O3 also has a large gap. It is very important to calculate the OFP of VOCs and study the seasonal variation in OFP for formulating effective and targeted emission control strategies.
In this study, alkenes were found to be the most photochemically active VOC species in the atmosphere of Beibei, Chongqing, while alkanes were the least photochemically active. Therefore, controlling aromatics and alkenes in the atmosphere is critical to reducing atmospheric O3 concentration in Chongqing. This result was consistent with some studies in other cities in China, including but not limited to Wuhan [7], Chengdu [44], Jinan [45], Xi’an [46], and Nanjing [47].
Consistent with previous studies conducted in Beijing [48] and Guilin [49], the top 10 atmospheric VOC species contributing most to the OFP each year in the Beibei urban area were largely similar in category, i.e., alkenes and aromatics. Among them, discernible contributors to OFP encompass 1-butene, trans-2-butene, 1,3-butadiene, isoprene, M/P-xylene, toluene, and 1,2,4-trimethyl-benzene, which were identified as important contributors to OFP. 1-butene, trans-2-butene, and 1,3-butadiene, a family of short-chained alkenes, primarily originate from road mobile sources, industrial processes, and biomass combustion [7,50]. In addition to their volatilization from industrial solvents, m/p-xylene and toluene are also released into the atmosphere through vehicle exhaust emissions [48,51]; 1,2,4-trimethylbenzene is mainly attributed to road mobile sources, such as petrol vehicles, motorcycles, and diesel vehicles [52]. Isoprene is an indicator of biogenic emissions such as plant emissions, while motor vehicle exhaust is also a significant source of isoprene in urban areas [7]. Moreover, in the past VOC studies in Chongqing, ethylene, characterized by chemical production, also contributed a lot to OFP [36,53,54]. Unfortunately, due to the limitations of the method in this study, no VOCs below C2 were detected in the atmospheric samples, so the corresponding OFP value could not be calculated, which may cause some deviation in the analysis results.
Throughout the observation period, the OFP values were much higher in summer than in winter. High temperatures and strong radiation in summer could strengthen the photochemical reaction of VOCs, thus promoting ozone formation. Additionally, during the summer months, as a result of increased plant growth, more isoprene is released from the abundant vegetation and the isoprene OFP is relatively high, while in winter, the defoliation of vegetation leaves due to the cold temperatures, resulting in a lower TOFP [39].

4.3. Source Appointment of VOCs

Motor vehicle emissions stand as a principal contributor to VOCs in urban areas of Chinese cities. However, compared with analogous urban centers like Wuhan (24.42%) [7], Beijing (39.95%) [55], Shanghai (40.00%) [56], and Chengdu (22%) [57], the present investigation revealed a notably elevated proportion of VOC emissions attributed to motor vehicle sources in Chongqing (66.2%). This distinctive situation in Chongqing can be attributed to its exceptional status as the only mega-city in China where the usage of motorbikes remains unrestricted. Chongqing also assumes the role of the largest motorbike manufacturing hub in China, and due to its special and intricate mountainous terrain, motorbike usage is a widespread norm. At the same time, Chongqing ranks third in the nation for motor vehicle prevalence. During the observation period of this study, motor vehicle ownership in Chongqing rose from 1.57 million in 2012 to 3.71 million in 2017, growing rapidly at an annual rate of about 17 per cent [35]. VOC concentrations are closely related to the number of vehicles on the road. As traffic increases, so do VOC emissions from vehicles, including exhaust emissions and fuel evaporation. As a result, VOCs in Chongqing’s atmosphere are particularly affected by motor vehicle emissions. Therefore, based on the source analysis results of VOCs, the control and management of VOCs in Chongqing should focus on the transportation sector. Alongside this, pivotal efforts must be directed towards technological enhancements targeting fuel-related volatilization and leakage, while concurrently pinpointing key polluting enterprises to facilitate comprehensive and efficacious pollution control measures.

5. Conclusions

In this study, weekly observations were conducted on the atmospheric environment of Chongqing from 2012 to 2017, and the concentration levels and variation characteristics of VOCs were analyzed. The OFP of VOCs was calculated by combining the MIR coefficient, and their photochemical properties were analyzed. The main sources of VOCs were determined using PCA. The findings demonstrate that the VOC concentration in Chongqing was at a medium level compared to other cities in China. In terms of annual changes, VOC concentrations showed a gradual decline after 2013 and reached the lowest value in 2017. Among the various species of VOCs, alkanes were the most abundant, followed by aromatics, halo-hydrocarbons, and alkenes. The relatively abundant VOC species were isopentane, butane, pentane, benzene, toluene, chlorobenzene, and styrene. Moreover, the VOC concentration was found to be higher in summer than in winter, contrary to the observations of seasonal variations in VOCs in most other cities in China. The OFP results show that although alkenes had the lowest composition, they contributed the most to O3 production. Alkanes, on the other hand, had the highest composition but contributed much less to O3 production than alkenes and aromatics. 1-butene, trans-2-butene, 1,3-butadiene, isoprene, M/P-xylene, Toluene, and 1,2,4-Trimethyl-benzene were at high levels of active species of OFP. The average OFP values were higher in summer than in winter throughout the observation period. The mean value of T/B ratio was 1.18, indicating that motor vehicle exhaust had a significant effect on VOCs in the urban area of Beibei, Chongqing. The PCA results identified three sources of atmospheric VOCs: motor vehicle emissions, fuel evaporation, and industrial emissions, of which motor vehicle emissions accounted for the highest share of 66.2%, which was consistent with the T/B ratio results. Therefore, prioritizing the reduction in transport emissions is essential to improve air quality in the study area.

Author Contributions

S.L.: Methodology, Data Curation, Visualization, Writing—Original Draft. Q.H.: Investigation, Data curation, Visualization. Z.X.: Project administration, Writing—Review and Editing, Funding acquisition. G.Z.: Methodology, Investigation, Conceptualization. Z.L.: Data Curation, Investigation. Y.G.: Data Curation, Formal analysis. X.W.: Formal analysis, Visualization. F.C.: Investigation. Y.H.: Investigation. C.J.: Supervision, Project administration, Writing—Review and Editing, Funding acquisition. All authors have read and agreed to the published version of the manuscript.

Funding

This research was supported by the National Natural Science Foundation of China (41977186) and the Chongqing Research Program of Basic Research and Frontier Technology (cstc2019jcyj-msxmX0425).

Institutional Review Board Statement

Not applicable.

Informed Consent Statement

Not applicable.

Data Availability Statement

The datasets used and/or analyzed during the current study are available from the corresponding author on reasonable request.

Acknowledgments

This work was jointly supported by the National Natural Science Foundation of China (41977186) and the Chongqing Research Program of Basic Research and Frontier Technology (cstc2019jcyj-msxmX0425). The authors are also grateful to Chensheng Lu for his linguistic assistance during the preparation of this manuscript.

Conflicts of Interest

The authors declare no conflict of interest.

References

  1. Bari, A.; Kindzierski, W.B. Ambient volatile organic compounds (VOCs) in Calgary, Alberta: Sources and screening health risk assessment. Sci. Total Environ. 2018, 631–632, 627–640. [Google Scholar] [CrossRef] [PubMed]
  2. Liu, Z.; Doherty, R.M.; Wild, O.; Hollaway, M.; O’connor, F.M. Contrasting chemical environments in summertime for atmospheric ozone across major Chinese industrial regions: The effectiveness of emission control strategies. Atmos. Meas. Technol. 2021, 21, 10689–10706. [Google Scholar] [CrossRef]
  3. Feng, Z.; De Marco, A.; Anav, A.; Gualtieri, M.; Sicard, P.; Tian, H.; Fornasier, F.; Tao, F.; Guo, A.; Paoletti, E. Economic losses due to ozone impacts on human health, forest productivity and crop yield across China. Environ. Int. 2019, 131, 104966. [Google Scholar] [CrossRef] [PubMed]
  4. Zeng, Y.; Cao, Y.; Qiao, X.; Seyler, B.C.; Tang, Y. Air Pollution Reduction in China: Recent Success but Great Challenge for the Future. Sci. Total Environ. 2019, 663, 329–337. [Google Scholar] [CrossRef] [PubMed]
  5. Tan, Z.; Lu, K.; Jiang, M.; Su, R.; Dong, H.; Zeng, L.; Xie, S.; Tan, Q.; Zhang, Y. Exploring ozone pollution in Chengdu, southwestern China: A case study from radical chemistry to O3-VOC-NOx sensitivity. Sci. Total Environ. 2018, 636, 775–786. [Google Scholar] [CrossRef]
  6. Lyu, X.; Chen, N.; Guo, H.; Zhang, W.; Wang, N.; Wang, Y.; Liu, M. Ambient volatile organic compounds and their effect on ozone production in Wuhan, central China. Sci. Total Environ. 2016, 541, 200–209. [Google Scholar] [CrossRef]
  7. Hui, L.; Liu, X.; Tan, Q.; Feng, M.; An, J.; Qu, Y.; Zhang, Y.; Jiang, M. Characteristics, source apportionment and contribution of VOCs to ozone formation in Wuhan, Central China. Atmos. Environ. 2018, 192, 55–71. [Google Scholar] [CrossRef]
  8. Mozaffar, A.; Zhang, Y.-L.; Fan, M.; Cao, F.; Lin, Y.-C. Characteristics of summertime ambient VOCs and their contributions to O3 and SOA formation in a suburban area of Nanjing, China. Atmos. Res. 2020, 240, 104923. [Google Scholar] [CrossRef]
  9. Hao, G.; Chen, K.; Wang, P.; Hu, L.; Ying, Q.; Gao, A.; Zhang, H. Simulation of Summer Ozone and Its Sensitivity to Emission Changes in China. Atmos. Pollut. Res. 2019, 10, 1543–1552. [Google Scholar] [CrossRef]
  10. Zhang, J.; Sun, Y.; Wu, F.; Sun, J.; Wang, Y. The characteristics, seasonal variation and source apportionment of VOCs at Gongga Mountain, China. Atmos. Environ. 2014, 88, 297–305. [Google Scholar] [CrossRef]
  11. Barletta, B.; Meinardi, S.; Rowland, F.S.; Chan, C.-Y.; Wang, X.; Zou, S.; Chan, L.Y.; Blake, D.R. Volatile organic compounds in 43 Chinese cities. Atmos. Environ. 2005, 39, 5979–5990. [Google Scholar] [CrossRef]
  12. Liu, Y.; Kong, L.; Liu, X.; Zhang, Y.; Li, C.; Zhang, Y.; Zhang, C.; Qu, Y.; An, J.; Ma, D.; et al. Characteristics, secondary transformation, and health risk assessment of ambient volatile organic compounds (VOCs) in urban Beijing, China. Atmos. Pollut. Res. 2021, 12, 33–46. [Google Scholar] [CrossRef]
  13. Liu, Y.; Shao, M.; Fu, L.; Lu, S.; Zeng, L.; Tang, D. Source profiles of volatile organic compounds (VOCs) measured in China: Part I. Atmos. Environ. 2008, 42, 6247–6260. [Google Scholar] [CrossRef]
  14. Liang, X.; Sun, X.; Xu, J.; Ye, D. Improved emissions inventory and VOCs speciation for industrial OFP estimation in China. Sci. Total Environ. 2020, 745, 140838. [Google Scholar] [CrossRef] [PubMed]
  15. Li, J.; Li, L.Y.; Wu, R.R.; Li, Y.Q.; Bo, Y.; Xie, S.D. Inventory of highly resolved temporal and spatial volatile organic compounds emission in China. WIT Trans. Ecol. Environ. 2016, 207, 79–86. [Google Scholar] [CrossRef]
  16. Yao, S.; Fan, F.; Zhang, J.; Wang, Q. Characteristics of summertime ambient volatile organic compounds in Beijing: Composition, source apportionment, and chemical reactivity. Atmos. Pollut. Res. 2023, 14, 101725. [Google Scholar] [CrossRef]
  17. Chen, Y.; Xie, S.-D.; Luo, B.; Zhai, C.-Z. Particulate pollution in urban Chongqing of southwest China: Historical trends of variation, chemical characteristics and source apportionment. Sci. Total Environ. 2017, 584–585, 523–534. [Google Scholar] [CrossRef]
  18. Yang, Y.; Ji, D.; Sun, J.; Yao, D.; Zhao, S.; Yu, X.; Zeng, L.; Zhang, R.; Zhang, H.; Wang, Y.; et al. Ambient volatile organic compounds in a suburban site between Beijing and Tianjin: Concentration levels, source apportionment and health risk assessment. Sci. Total Environ. 2019, 695, 133889. [Google Scholar] [CrossRef] [PubMed]
  19. Liu, B.; Liang, D.; Yang, J.; Dai, Q.; Bi, X.; Feng, Y.; Yuan, J.; Xiao, Z.; Zhang, Y.; Xu, H. Characterization and source apportionment of volatile organic compounds based on 1-year of observational data in Tianjin, China. Environ. Pollut. 2016, 218, 757–769. [Google Scholar] [CrossRef]
  20. An, J.; Zhu, B.; Wang, H.; Li, Y.; Lin, X.; Yang, H. Characteristics and source apportionment of VOCs measured in an industrial area of Nanjing, Yangtze River Delta, China. Atmos. Environ. 2014, 97, 206–214. [Google Scholar] [CrossRef]
  21. Xu, Z.; Huang, X.; Nie, W.; Chi, X.; Xu, Z.; Zheng, L.; Sun, P.; Ding, A. Influence of synoptic condition and holiday effects on VOCs and ozone production in the Yangtze River Delta region, China. Atmos. Environ. 2017, 168, 112–124. [Google Scholar] [CrossRef]
  22. Louie, P.K.; Ho, J.W.; Tsang, R.C.; Blake, D.R.; Lau, A.K.; Yu, J.Z.; Yuan, Z.; Wang, X.; Shao, M.; Zhong, L. VOCs and OVOCs distribution and control policy implications in Pearl River Delta region, China. Atmos. Environ. 2012, 76, 125–135. [Google Scholar] [CrossRef]
  23. Ho, K.; Lee, S.; Guo, H.; Tsai, W. Seasonal and diurnal variations of volatile organic compounds (VOCs) in the atmosphere of Hong Kong. Sci. Total Environ. 2004, 322, 155–166. [Google Scholar] [CrossRef] [PubMed]
  24. Ou, J.; Guo, H.; Zheng, J.; Cheung, K.; Louie, P.K.; Ling, Z.; Wang, D. Concentrations and sources of non-methane hydrocarbons (NMHCs) from 2005 to 2013 in Hong Kong: A multi-year real-time data analysis. Atmos. Environ. 2015, 103, 196–206. [Google Scholar] [CrossRef]
  25. Carter, W.P.L. Development of Ozone Reactivity Scales for Volatile Organic Compounds. Air Waste 1994, 44, 881–899. [Google Scholar] [CrossRef]
  26. Thurston, G.D.; Spengler, J.D. A quantitative assessment of source contributions to inhalable particulate matter pollution in metropolitan Boston. Atmos. Environ. 1985, 19, 9–25. [Google Scholar] [CrossRef]
  27. Garzón, J.P.; Huertas, J.I.; Magaña, M.; Huertas, M.E.; Cárdenas, B.; Watanabe, T.; Maeda, T.; Wakamatsu, S.; Blanco, S. Volatile organic compounds in the atmosphere of Mexico City. Atmos. Environ. 2015, 119, 415–429. [Google Scholar] [CrossRef]
  28. Dumanoglu, Y.; Kara, M.; Altiok, H.; Odabasi, M.; Elbir, T.; Bayram, A. Spatial and seasonal variation and source apportionment of volatile organic compounds (VOCs) in a heavily industrialized region. Atmos. Environ. 2014, 98, 168–178. [Google Scholar] [CrossRef]
  29. Ling, Z.; Guo, H.; Cheng, H.; Yu, Y. Sources of ambient volatile organic compounds and their contributions to photochemical ozone formation at a site in the Pearl River Delta, southern China. Environ. Pollut. 2011, 159, 2310–2319. [Google Scholar] [CrossRef] [PubMed]
  30. Yao, S.; Wang, Q.; Zhang, J.; Zhang, R.; Gao, Y.; Zhang, H.; Li, J.; Zhou, Z. Ambient volatile organic compounds in a heavy industrial city: Concentration, ozone formation potential, sources, and health risk assessment. Atmos. Pollut. Res. 2021, 12, 101053. [Google Scholar] [CrossRef]
  31. Hui, L.; Liu, X.; Tan, Q.; Feng, M.; An, J.; Qu, Y.; Zhang, Y.; Deng, Y.; Zhai, R.; Wang, Z. VOC characteristics, chemical reactivity and sources in urban Wuhan, central China. Atmos. Environ. 2020, 224, 117340. [Google Scholar] [CrossRef]
  32. Li, J.; Zhai, C.; Yu, J.; Liu, R.; Li, Y.; Zeng, L.; Xie, S. Spatiotemporal variations of ambient volatile organic compounds and their sources in Chongqing, a mountainous megacity in China. Sci. Total Environ. 2018, 627, 1442–1452. [Google Scholar] [CrossRef] [PubMed]
  33. Zhang, Y.; Li, R.; Fu, H.; Zhou, D.; Chen, J. Observation and analysis of atmospheric volatile organic compounds in a typical petrochemical area in Yangtze River Delta, China. J. Environ. Sci. 2018, 71, 233–248. [Google Scholar] [CrossRef] [PubMed]
  34. Mo, Z.; Shao, M.; Lu, S. Compilation of a source profile database for hydrocarbon and OVOC emissions in China. Atmos. Environ. 2016, 143, 209–217. [Google Scholar] [CrossRef]
  35. Qi, X.; Hao, Q.-J.; Ji, D.-S.; Zhang, J.-K.; Liu, Z.-R.; Hu, B.; Wang, Y.-S.; Jiang, C.-S. Composition characteristics of atmospheric volatile organic compounds in the urban area of Beibei District, Chongqing. Huan Jing Ke Xue Huanjing Kexue 2014, 35, 3293–3301. [Google Scholar]
  36. Qu, C.-Z.; Liu, R.-L.; Xu, J.-Y.; Liu, P.; Li, L. The Variation of VOCs Concentration and Ozone Formation Potential in the Urban Area of Chongqing. Environ. Impact Assess. 2013, 6, 45–49+53. (In Chinese) [Google Scholar] [CrossRef]
  37. Wang, M.; Qin, W.; Chen, W.; Zhang, L.; Zhang, Y.; Zhang, X.; Xie, X. Seasonal variability of VOCs in Nanjing, Yangtze River delta: Implications for emission sources and photochemistry. Atmos. Environ. 2019, 223, 117254. [Google Scholar] [CrossRef]
  38. Tong, L.; Liao, X.; Chen, J.; Xiao, H.; Xu, L.; Zhang, F.; Niu, Z.; Yu, J. Pollution characteristics of ambient volatile organic compounds (VOCs) in the southeast coastal cities of China. Environ. Sci. Pollut. Res. 2012, 20, 2603–2615. [Google Scholar] [CrossRef]
  39. Wu, F.; Yu, Y.; Sun, J.; Zhang, J.; Wang, J.; Tang, G.; Wang, Y. Characteristics, source apportionment and reactivity of ambient volatile organic compounds at Dinghu Mountain in Guangdong Province, China. Sci. Total Environ. 2016, 548–549, 347–359. [Google Scholar] [CrossRef]
  40. Wang, G.; Zhao, N.; Zhang, H.; Li, G.; Xin, G. Spatiotemporal Distributions of Ambient Volatile Organic Compounds in China: Characteristics and Sources. Aerosol Air Qual. Res. 2022, 22, 210379. [Google Scholar] [CrossRef]
  41. Tsai, J.-H.; Huang, P.-H.; Chiang, H.-L. Characteristics of volatile organic compounds from motorcycle exhaust emission during real-world driving. Atmos. Environ. 2014, 99, 215–226. [Google Scholar] [CrossRef]
  42. Guo, H.; Ling, Z.H.; Cheng, H.R.; Simpson, I.J.; Lyu, X.P.; Wang, X.M.; Shao, M.; Lu, H.X.; Ayoko, G.; Zhang, Y.L.; et al. Tropospheric volatile organic compounds in China. Sci. Total Environ. 2017, 574, 1021–1043. [Google Scholar] [CrossRef] [PubMed]
  43. Cao, X.; Yao, Z.; Shen, X.; Ye, Y.; Jiang, X. On-road emission characteristics of VOCs from light-duty gasoline vehicles in Beijing, China. Atmos. Environ. 2016, 124, 146–155. [Google Scholar] [CrossRef]
  44. Song, M.; Tan, Q.; Feng, M.; Qu, Y.; Liu, X.; An, J.; Zhang, Y. Source Apportionment and Secondary Transformation of Atmospheric Nonmethane Hydrocarbons in Chengdu, Southwest China. J. Geophys. Res. Atmos. 2018, 123, 9741–9763. [Google Scholar] [CrossRef]
  45. Wang, N.; Li, N.; Liu, Z.; Evans, E. Investigation of chemical reactivity and active components of ambient VOCs in Jinan, China. Air Qual. Atmos. Health 2015, 9, 785–793. [Google Scholar] [CrossRef]
  46. Song, M.; Li, X.; Yang, S.; Yu, X.; Zhou, S.; Yang, Y.; Chen, S.; Dong, H.; Liao, K.; Chen, Q.; et al. Spatiotemporal variation, sources, and secondary transformation potential of volatile organic compounds in Xi’an, China. Atmos. Meas. Technol. 2021, 21, 4939–4958. [Google Scholar] [CrossRef]
  47. Shao, P.; An, J.; Xin, J.; Wu, F.; Wang, J.; Ji, D.; Wang, Y.S. Source apportionment of VOCs and the contribution to photochemical ozone formation during summer in the typical industrial area in the Yangtze River Delta, China. Atmos. Res. 2016, 176–177, 64–74. [Google Scholar] [CrossRef]
  48. Zhang, L.; Li, H.; Wu, Z.; Zhang, W.; Liu, K.; Cheng, X.; Zhang, Y.; Li, B.; Chen, Y. Characteristics of atmospheric volatile organic compounds in urban area of Beijing: Variations, photochemical reactivity and source apportionment. J. Environ. Sci. 2020, 95, 190–200. [Google Scholar] [CrossRef]
  49. Zhang, X.; Yin, Y.; Wen, J.; Huang, S.; Han, D.; Chen, X.; Cheng, J. Characteristics, reactivity and source apportionment of ambient volatile organic compounds (VOCs) in a typical tourist city. Atmos. Environ. 2019, 215, 116898. [Google Scholar] [CrossRef]
  50. Liu, Y.; Qiu, P.; Xu, K.; Li, C.; Yin, S.; Zhang, Y.; Ding, Y.; Zhang, C.; Wang, Z.; Zhai, R.; et al. Analysis of VOC emissions and O3 control strategies in the Fenhe Plain cities, China. J. Environ. Manag. 2023, 325, 116534. [Google Scholar] [CrossRef]
  51. Wang, L.; Slowik, J.G.; Tong, Y.; Duan, J.; Gu, Y.; Rai, P.; Qi, L.; Stefenelli, G.; Baltensperger, U.; Huang, R.-J.; et al. Characteristics of wintertime VOCs in urban Beijing: Composition and source apportionment. Atmos. Environ. X 2020, 9, 100100. [Google Scholar] [CrossRef]
  52. Ou, J.; Zheng, J.; Li, R.; Huang, X.; Zhong, Z.; Zhong, L.; Lin, H. Speciated OVOC and VOC emission inventories and their implications for reactivity-based ozone control strategy in the Pearl River Delta region, China. Sci. Total Environ. 2015, 530–531, 393–402. [Google Scholar] [CrossRef] [PubMed]
  53. Liu, R.L.; Zhai, C.Z.; Li, L.; Yu, C.Z.; Liu, M.; Xu, C.Z.; Feng, N. Concentration Characteristics and Source Analysis of Ambient VOCs in Summer and Autumn in the Urban Area of Chongqing. Acta Sci. Circums. 2017, 37, 1260–1267. (In Chinese) [Google Scholar] [CrossRef]
  54. Xu, J.-Y.; Liu, J.-G.; Qin, H.; Qian, Z.-Y.; Zhou, Y.; Chen, Z.-L. Analysis of Volatile Organic Compound Characteristics and Sources During the Typical Ozone Pollution Process in Jiangjin District of Chongqing. Geochimica 2021, 5, 503–512. (In Chinese) [Google Scholar] [CrossRef]
  55. Li, C.; Liu, Y.; Cheng, B.; Zhang, Y.; Liu, X.; Qu, Y.; An, J.; Kong, L.; Zhang, Y.; Zhang, C.; et al. A comprehensive investigation on volatile organic compounds (VOCs) in 2018 in Beijing, China: Characteristics, sources and behaviours in response to O3 formation. Sci. Total Environ. 2021, 806, 150247. [Google Scholar] [CrossRef] [PubMed]
  56. Cai, C.; Geng, F.; Tie, X.; Yu, Q.; An, J. Characteristics and source apportionment of VOCs measured in Shanghai, China. Atmos. Environ. 2010, 44, 5005–5014. [Google Scholar] [CrossRef]
  57. Tan, Q.; Liu, H.; Xie, S.; Zhou, L.; Song, T.; Shi, G.; Jiang, W.; Yang, F.; Wei, F. Temporal and spatial distribution characteristics and source origins of volatile organic compounds in a megacity of Sichuan Basin, China. Environ. Res. 2020, 185, 109478. [Google Scholar] [CrossRef]
Figure 1. Temporal fluctuations in TVOC concentrations in the Beibei urban area of Chongqing from 2012 to 2017.
Atmosphere 14 01452 g001
Figure 2. The seasonal distribution of TVOC concentrations in each year during the observation period.
Atmosphere 14 01452 g002
Figure 3. Changes in different VOC species throughout the observation period.
Atmosphere 14 01452 g003
Figure 4. Concentration ratios of different VOC species in different seasons in Beibei urban area, Chongqing, during the observation period.
Atmosphere 14 01452 g004
Figure 5. Concentration proportions of different VOCs species and their contribution ratios of OFP (the ozone formation potential) in the urban area of Beibei, Chongqing, in each year of the observation period.
Atmosphere 14 01452 g005
Figure 6. The 10 VOC species with the highest contributions to OFP in each year from 2012 to 2017.
Atmosphere 14 01452 g006
Figure 7. Seasonal variations in OFP for different VOCs species in the Beibei urban area, Chongqing. Different lowercase letters indicate significant differences between different seasons for each species (p < 0.05). Differences with one of the same labelled letters are considered non-significant, while differences with different labelled letters are considered significant.
Atmosphere 14 01452 g007
Table 1. TVOC (the total volatile organic compounds) concentrations in the urban area of Beibei, Chongqing, for each year of the observation period (Min: minimum value; Max: maximum value; Mean: average value; SD: standard deviation).
YearMin (ppbv)Max (ppbv)Mean (ppbv)SD (ppbv)
20121.585.829.617.9
20134.8112.040.124.8
20146.795.731.118.5
201612.076.427.915.2
20170.2581.120.015.8
Entire period0.25112.031.320.0
Table 2. The top 10 VOC (volatile organic compounds) species with the highest concentrations in each year.
201220132014
SpeciesConcentration (ppbv)Percentage (%)SpeciesConcentration (ppbv)Percentage (%)SpeciesConcentration (ppbv)Percentage (%)
Benzene1.90 ± 1.417.2Propyl benzene3.4 ± 5.88.51,2-diethyl-benzene Benzene2.7 ± 5.48.6
Styrene1.59 ± 2.446.1Isopentane2.9 ± 4.67.3Styrene2.2 ± 1.927.1
m/p-Xylene1.54 ± 1.875.8Chloroform2.4 ± 3.26.0Isopentane1.64 ± 1.995.2
Toluene1.44 ± 1.445.5Propane2.4 ± 2.35.9Butane1.57 ± 1.475.1
Isopentane1.39 ± 1.055.3Toluene1.84 ± 1.814.6Chloroform1.35 ± 1.014.3
Ethyl benzene0.97 ± 0.933.7Nonane1.79 ± 3.74.5Isobutane1.25 ± 1.354.0
Propane0.95 ± 0.903.6Butane1.56 ± 2.13.9Toluene1.20 ± 1.043.9
1,2,4-trimethylbenzene trimethylbenzenetrimethylbenzene0.93 ± 0.713.5Pentane1.49 ± 2.13.7Decane1.01 ± 0.623.2
Isopropyl benzene0.93 ± 1.103.5Benzene1.39 ± 1.23.5Chlorobenzene0.95 ± 0.583.1
3-methylpentane0.79 ± 1.513.0Isoprene1.32 ± 1.93.3Benzene0.93 ± 0.683.0
201520162017
SpeciesConcentration (ppbv)Percentage (%)SpeciesConcentration (ppbv)Percentage (%)SpeciesConcentration (ppbv)Percentage (%)
Isopentane2.9 ± 2.57.4Butane2.0 ± 1.797.3Benzene1.74 ± 1.808.7
Butane2.4 ± 1.826.2Toluene1.88 ± 1.446.8Butane1.60 ± 1.298.0
Benzene2.1 ± 1.545.4Styrene1.87 ± 2.16.7Isopentane1.47 ± 1.507.3
2 chlorotoluene2.1 ± 2.15.4Isopentane1.63 ± 0.975.9Isobutane1.21 ± 0.976.1
Toluene2.1 ± 1.805.2Chlorobenzene1.45 ± 0.925.2Toluene1.21 ± 1.376.0
Methyl pentane1.95 ± 1.355.0Isobutane1.26 ± 1.424.6Chlorobenzene0.97 ± 0.584.9
Dimethyl pentane1.74 ± 1.054.5Pentane1.15 ± 1.944.2m/p-Xylene0.71 ± 0.823.5
Chlorobenzene1.70 ± 1.074.4Ethyl benzene benzene1.15 ± 1.264.1Pentane0.70 ± 1.203.5
Isobutane1.61 ± 1.274.1m/p-Xylene1.05 ± 1.213.8Isoprene0.69 ± 1.613.4
Pentane1.49 ± 1.483.8Benzene0.92 ± 0.643.3Butene0.62 ± 0.393.1
Table 3. PCA (principal component analysis) of VOCs in the urban area of Beibei district, Chongqing, during the whole observation period.
VOCsMain Factors
Factor 1Factor 2Factor 3Factor 4Factor 5Factor 6
Isobutane0.3290.546
Butane0.4650.504
Isopentane0.4390.638
Pentane0.4180.633
2-Methylpentane0.4130.482
n-Hexane0.3390.329 0.4990.409
Heptane
Decane 0.393
1-Butene0.5810.3650.302 0.552
1,3-Butadiene0.372 0.381 0.346
trans-2-butene0.428 0.461
Isoprene 0.3160.367 0.660
F12 0.426
Chloromethane 0.419
Trichloromethane 0.591
Benzene0.8210.335
Toluene0.7050.344
Ethylbenzene0.692
m/p-xylene0.661
Styrene0.354
o-xylene0.861
Isopropylbenzene 0.326 0.415
1,2-Dichloro-Benzene0.580
1,2,3-Trimethylbenzene0.723
m-Ethyltoluene0.746 0.362 0.335
p-Ethyltoluene0.702 0.334 0.383
1,2-Diethylbenzene0.313
1,4-Diethylbenzene0.535
1,3,5-Trimethylbenzene0.721 0.371
1,2,4-Trimethylbenzene0.883
Initial eigenvalues11.7416.6303.3562.1311.6181.303
Initial variance36.07720.9669.4157.6105.7784.655
Cumulative variance36.07757.04266.45774.06879.84684.501
Contribution ratio (%)42.69424.81111.1429.0066.8385.508
Table 4. Comparison of VOC concentrations (ppbv) in Chongqing with other urban cities in China and former studies measured in different areas of Chongqing.
CityLocationSampling PeriodSpecies NumberTVOCsReference
ChongqingUrban2012.1–2017.78231.3This study
BeijingUrban2016.1–2017.109944.00 [11]
ChengduUrban2016.10–2017.105541.8 [34]
GuangzhouUrban2011.6–2012.55642.7 [35]
WuhanUrban2016.9–2017.810234.65 [7]
ShanghaiUrban2007.1–2010.33232.4 [36]
TianjinUrban2014.11–2015.105828.68 [18]
JinanUrban2010.6–2012.55525.29 [37]
ChongqingSuburban2015.8–2015.99623.0 [31]
ChongqingBackground site2015.8–2015.99634.1 [31]
ChongqingUrban2015.8–2015.99641.2 [31]
Disclaimer/Publisher’s Note: The statements, opinions and data contained in all publications are solely those of the individual author(s) and contributor(s) and not of MDPI and/or the editor(s). MDPI and/or the editor(s) disclaim responsibility for any injury to people or property resulting from any ideas, methods, instructions or products referred to in the content.

