Article

The Drawback of Optimizing Air Cleaner Filters for the Adsorption of Formaldehyde

Institut für Umwelt & Energie, Technik & Analytik e.V. (IUTA), 47229 Duisburg, Germany
*
Author to whom correspondence should be addressed.
Atmosphere 2024, 15(1), 109; https://doi.org/10.3390/atmos15010109
Submission received: 11 December 2023 / Revised: 12 January 2024 / Accepted: 13 January 2024 / Published: 16 January 2024

Abstract

:
Air cleaners with activated carbon (AC) filters for the adsorption of gaseous pollutants are often used to improve indoor air quality. As formaldehyde is a common and health-relevant indoor air pollutant, many testing standards for air cleaners, such as GB/T 18801:2015, require the cleaning efficacy to be tested with this substance. This often persuades manufacturers to optimize the employed filters specifically for formaldehyde. However, in regions where indoor formaldehyde levels are far below the guideline values, other gaseous pollutants might be more relevant. Thus, the question arises of whether the optimization for formaldehyde can have a negative impact on the adsorption of other gases. To address this question, the clean air delivery rate (CADR) of an air cleaner was determined for different test gases with either a standard AC filter or an AC filter modified for improved formaldehyde adsorption. Although the modified AC filter performed substantially better for formaldehyde, a strong reduction in the CADR was observed for toluene and nitrogen dioxide. This is a drawback for situations in which these gases are more problematic than formaldehyde. The findings suggest using either specialized filters for different applications or blends of different adsorbants to find the best compromise for the most relevant pollutants.

1. Introduction

Exposure to gaseous air pollutants is known to adversely affect human health [1,2]. Among the large spectrum of relevant gases, special attention is paid to volatile organic compounds (VOCs), which are common contributors to poor indoor air quality, as they can originate from various indoor and outdoor sources. As modern buildings become increasingly airtight to improve energy efficiency, high VOC concentrations are expected to become more common in residences if no additional measures are applied [3]. Among the VOCs, formaldehyde (IUPAC nomenclature methanal, HCHO) is one of the most studied compounds because of its ubiquity and well-established human health significance [4]. Formaldehyde is classified as a group 1 carcinogen according to the World Health Organization (WHO) International Agency for Research on Cancer (IARC) [5]. Furthermore, it can cause irritation of the eyes, upper airways, and skin [6]. Prolonged formaldehyde exposure has been associated with reduced pulmonary function [7] and asthma [8]. Primary formaldehyde emitters are paints, wood-based materials such as laminate and furniture [9], textiles, and consumer products [10]. Moreover, formaldehyde can result from smoking or incomplete combustion associated with gas stoves or wood-burning fireplaces [11]. Besides residential homes, workplaces can also be a relevant environment for exposure to formaldehyde [12,13]. For US residences, formaldehyde has been estimated to have the fourth highest chronic health impact of air pollutants after particulate matter with an aerodynamic diameter of <2.5 µm (PM2.5), second-hand smoke, and radon [14]. Globally, among the gaseous pollutants, formaldehyde causes the highest loss of disability-adjusted life years (DALYs), which is a common metric to quantify and rank the burden of household air pollution [15].
Consequently, the WHO has established an indoor quality guideline for the formaldehyde concentration of 80 ppb (0.1 mg m−3 at 1013.25 hPa and 25 °C), which applies to all 30 min periods lifelong [16]. If this recommendation cannot be met, there is the option to either mitigate the sources or reduce the airborne concentration by diluting with clean air or by applying gas-cleaning technologies. Where natural ventilation is not possible and no ventilation systems are installed, air cleaners offer an alternative. These mobile devices have a fan that draws in the room air, passes it through one or more filters, and releases the cleaned air back into the room [17]. Air cleaners have become increasingly popular in recent years, as they are known to reduce the concentration of infectious aerosols [18,19,20,21]. However, many air cleaners are also equipped with activated carbon (AC) filters to reduce the concentration of gaseous pollutants [22,23,24].
Adsorption by AC is a common technology for removing gaseous pollutants because it is easy to operate and relatively inexpensive. However, although AC exhibits a high adsorption capacity for most gaseous pollutants, it cannot efficiently adsorb formaldehyde [25]. One reason is that the low boiling point of formaldehyde of 254 K hinders pore condensation even within highly porous adsorbents [26]. Moreover, the polarity of formaldehyde reduces the chemical interaction with the non-polar AC [25]. To improve the adsorption efficiency, surface modifications of the AC are often employed. Especially, the introduction of nitrogen groups was found to increase the formaldehyde adsorption efficiency [27,28]. The addition of nitrogen-containing functional groups can. for example, be efficiently achieved by impregnation with amines [29,30,31,32]. A different approach to increase the overall adsorption efficiency is to blend the AC in the filter with other adsorbants, which have previously been shown to be efficient for formaldehyde, such as zeolites, mesoporous silica, or metal–organic frameworks [33,34].
Although various studies have shown the positive effect of such modifications on formaldehyde adsorption, the extent to which this optimization might negatively affect the adsorption of other gases has not yet been investigated. If there were such detrimental effects, this would be an important finding since air cleaners are expected not to adsorb only a single gas but a variety of gaseous pollutants. For example, a study in more than 600 German households showed that the formaldehyde limit values were exceeded in only 0.1% of the cases [35]. Furthermore, formaldehyde concentrations have shown a decreasing trend over the years in European and Chinese residences [3,36]. By contrast, other VOCs are still present at high concentrations [37].
Another typical indoor gaseous air pollutant is toluene (IUPAC nomenclature: methylbenzene, C7H8). Toluene is one of the most abundant VOCs in indoor environments [38,39], as it is widely used in industry and in a number of commercial products, such as cosmetics, inks, adhesives, paints, and glues [40]. Therefore, and because it is a less hazardous model compound for benzene, toluene is prescribed as a test substance in testing standards for adsorptive indoor air purification, such as ISO 10121-2:2013 [41]. It is a well-known neurotoxicant [42] and mainly affects the central nervous system, causing fatigue, headache, eye irritation, or memory impairment [43]. A recent study reviewing different international occupational exposure limit values recommended an 8 h time-weighted average value of 20 ppm and a 15 min short-term exposure limit of 100 ppm [44].
Besides VOCs, inorganic gases, such as nitrogen dioxide (NO2), can also have a high relevance for indoor air quality. NO2 can either infiltrate from the outdoor air, where it is mainly generated from fossil fuel combustion, or result from indoor combustion processes, such as gas cooking, candles, or smoking [45]. A review of cohort studies found positive associations between long-term concentrations of NO2 and mortality [46]. Furthermore, epidemiological studies have revealed that exposure to NO2 in early life may lead to allergic diseases, including asthma, and have long-term effects on lung function [47]. Consequently, in 2021, the WHO lowered its guideline value for the annual mean concentration to 10 µg m−3 [48]. Because of its importance as a pollutant, NO2 is also specified as a test gas in ISO 10121-2:2013 [41].
To reveal in an exemplary case whether the optimization for formaldehyde can be a drawback for other gases, this study compared two different filters in the same air cleaner, one with pristine AC and one with the same AC filter modified for improved adsorption of formaldehyde. The cleaning performances for formaldehyde, toluene, and NO2 were compared to draw conclusions on possible side effects of the optimization.

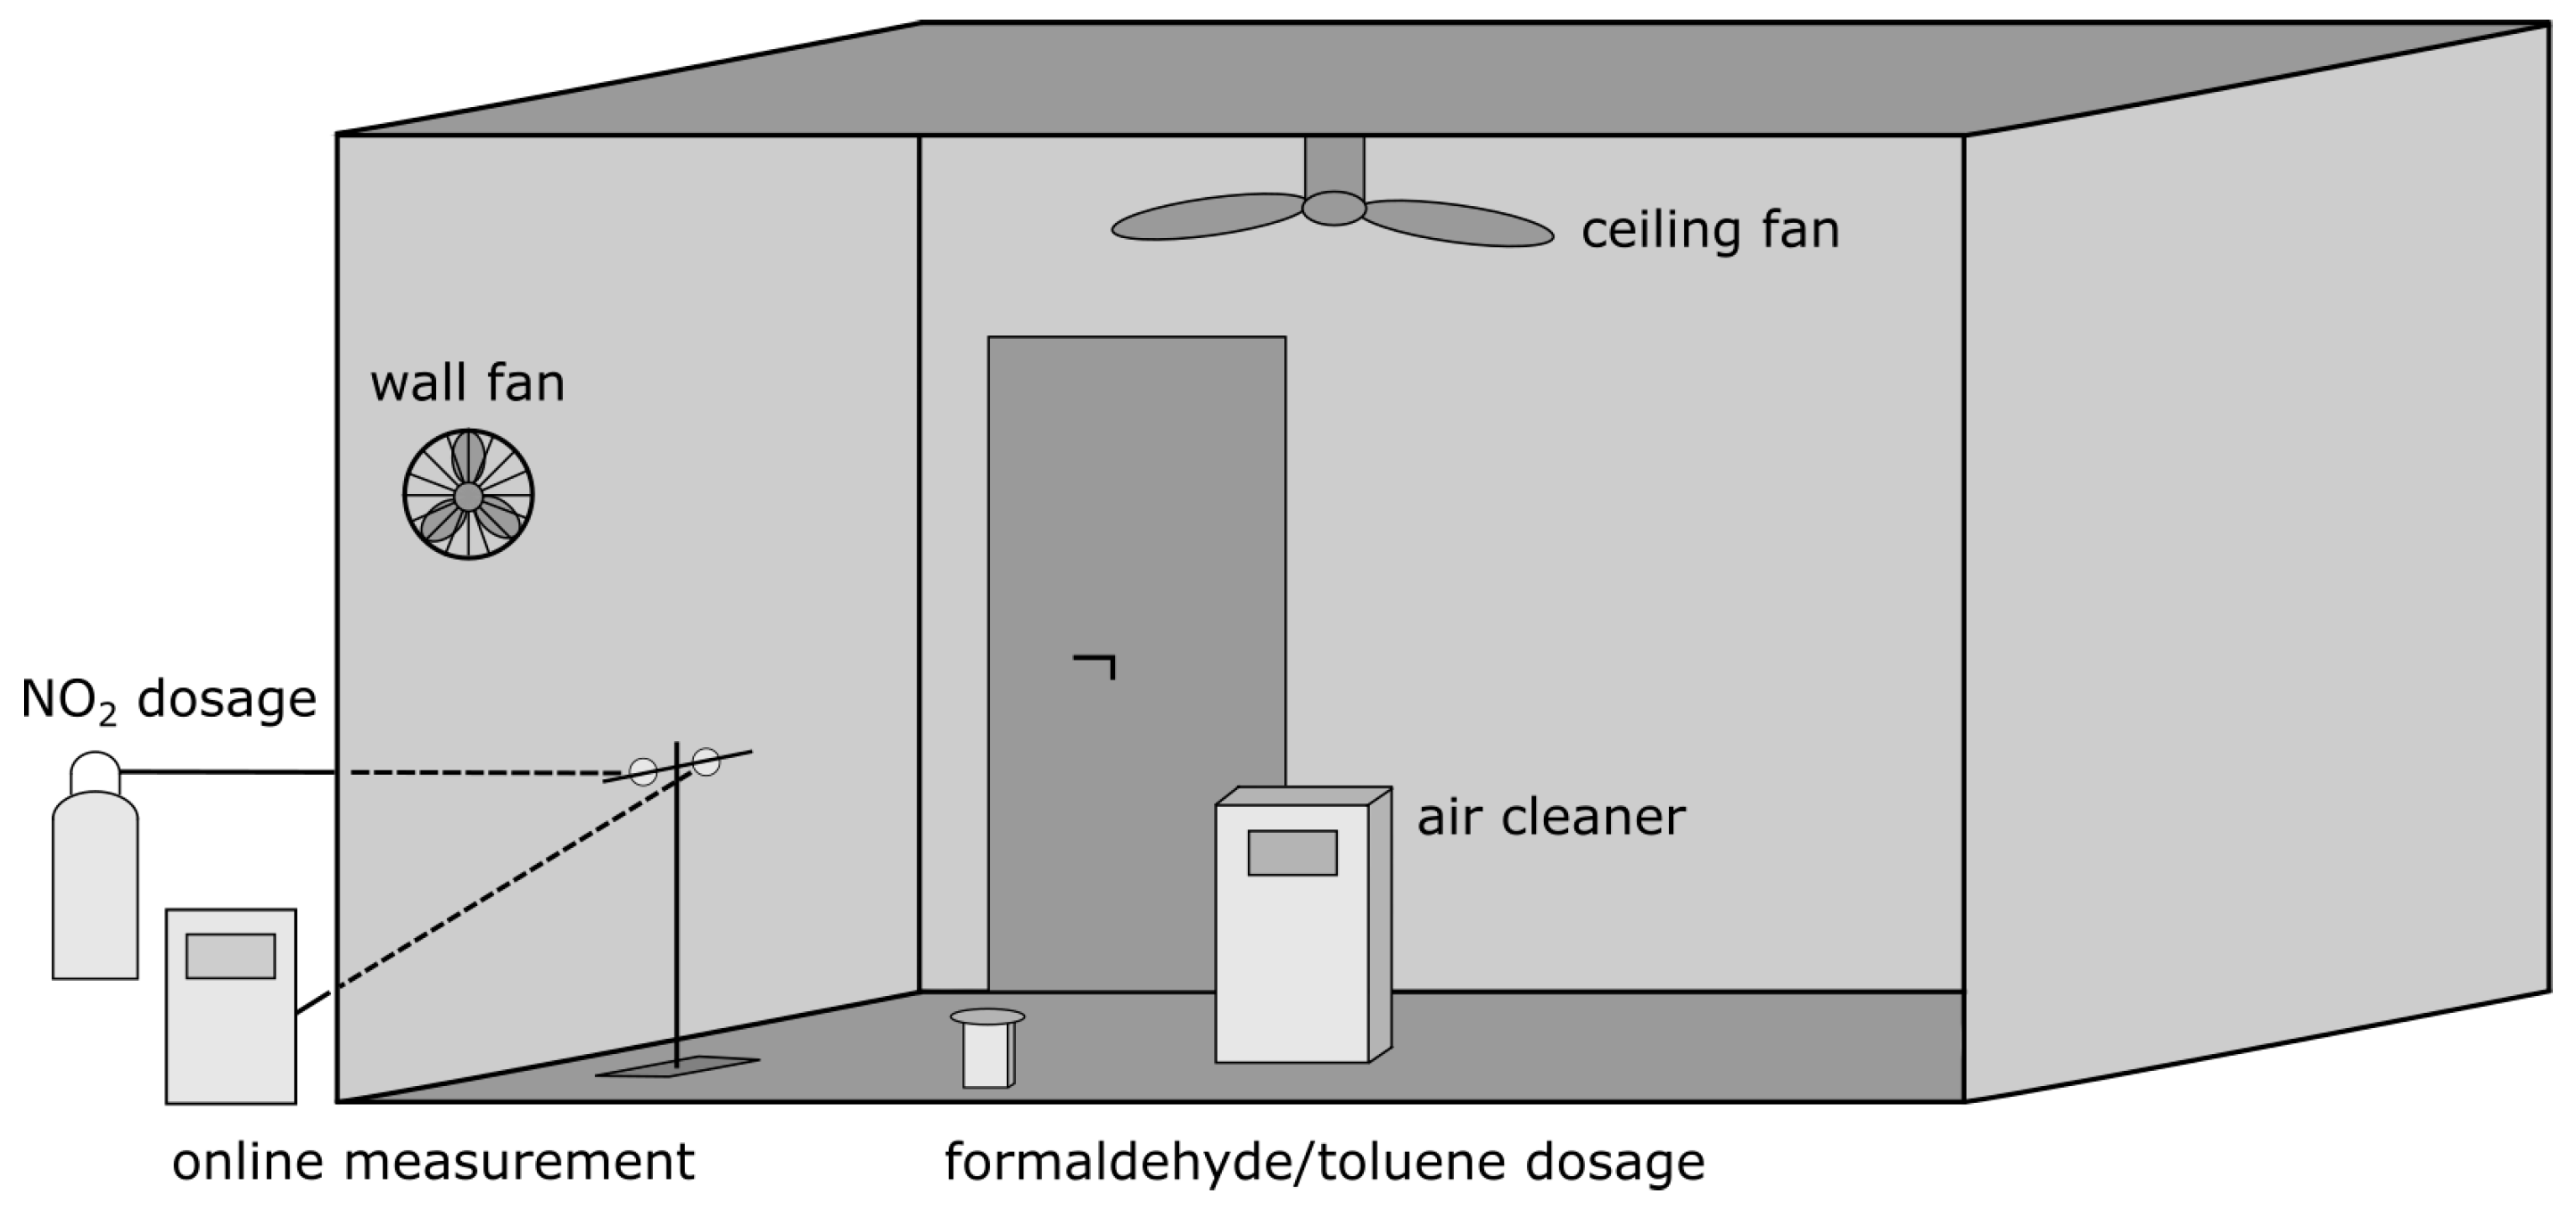
2. Materials and Methods

As a measure of the cleaning efficacy, the clean air delivery rate (CADR) defined in GB/T 18801:2015 [49] and other standards, such as ANSI/AHAM AC-1:2020 [50] and IEC 63086-1:2020 [51], was used. The CADR indicates the volume of cleaned air provided by the air per time unit and ideally corresponds to the product of filter efficiency and flow rate. To determine the CADR, a test gas is introduced to a sealed test chamber until a certain starting concentration is reached. After homogeneous mixing is achieved, the exponential decrease in concentration:
C t = C 0 e k t
is measured over time with the air cleaner running. A decay curve of the gas concentration without the air cleaner serves as a reference to separate the natural decay from that caused by the air cleaner. The CADR is calculated as the product of the difference between the two decay rates with and without the air cleaner ( k t o t k n a t ) and the volume V of the test chamber:
CADR = ( k t o t k n a t ) · V
The CADR measurements were performed in a test chamber according to GB/T 18801:2015 [49], which is schematically shown in Figure 1. The internal dimensions of the chamber were 3.45 m × 3.40 m × 2.50 m, corresponding to a volume of 29.3 m³. To reduce the concentration of gaseous pollutants prior to the test, an air cleaner with a known high efficiency for all test pollutants was initially operated. Prior to each test, the temperature was set to (25 ± 3) °C with a wall-mounted air conditioner, and the relative humidity was set to (50 ± 10)%rh with a portable humidifier. These values, defined in GB/T 18801:2015 [49], can be regarded as representative of a typical indoor situation. However, we note that the following findings might slightly depend on the chosen relative humidity. For example, it is known that the adsorption capacity for toluene is reduced at a higher relative humidity [52], while the effect is less pronounced for NO2 [53]. For formaldehyde, either positive or negative effects of increased relative humidity on the adsorption capacity were found depending on the details of the AC [26,54]. These complex dependencies can lead to relative shifts between the adsorption efficiencies of different adsorbates. However, it was beyond the scope of this work to investigate the effects as a function of relative humidity.
During the actual measurements, the additional air cleaner, the air conditioner, and the humidifier were turned off. A wall fan at a height of 1.50 m and a distance of 0.40 m from the wall was operated during the whole test to mix the air in the chamber. While feeding the gas to the chamber, a centrally-mounted ceiling fan was also operated. The use of the mixing and ceiling fan allowed for reproducible testing conditions. However, it was previously demonstrated that such standardized tests are also representative of most typical real indoor environments without active ventilation [55,56]. The expanded uncertainty of the measurement method was estimated at ±10% in accordance with ISO/IEC 17025:2017 [57]. Sampling was performed by extracting a small flow from the chamber to the measuring instruments. The sampling point was located 0.50 m from the wall and 1.20 m above the floor.
The device under testing was a commercial air cleaner (model Philips AC 2939/10, Amsterdam, The Netherlands). It contained a cylindrical filter (model Philips FY 2122, Amsterdam, The Netherlands) consisting of a pleated fibrous filter medium for particle filtration with integrated AC grains for gas adsorption. According to the datasheet, the nominal CADR of formaldehyde is 220 m³/h. Besides the original filter, which contains an additive to optimize the performance for formaldehyde, the manufacturer provided a derived sample filter that did not contain the chemical modification. For confidentiality reasons, it is not known to the authors what chemical modification was applied to the filter to improve the formaldehyde adsorption. In the following, the two filter types are denoted as “pristine” and “modified” filters.
To exclude effects from adsorption or desorption of water during the tests, all filters were first dried in a climate cabinet at 60 °C for 24 h and conditioned afterward for 24 h at 25 °C and 50%rh. For the tests, the air cleaner was placed in the center of the test chamber on the floor and at the highest continuous operation mode (level 3) at a constant input voltage of 230 V using a stabilized power supply.
For the three test gases, the following methods for dosing and measuring the concentration were applied. The initial concentrations were chosen according to GB/T 18801:2015 [49], which defines them as (10 ± 2)-times the Chinese limit values for indoor air specified in GB/T 18883:2002 [58].
  • The initial formaldehyde concentration of about 815 ppb (1.0 mg m−3 at 1013.25 hPa and 25 °C) was generated by the sublimation of paraformaldehyde (>95% purity) at 200 °C. The concentration was measured with a continuous formaldehyde monitor (model AeroLaser AL 4021). The detection was based on the fluorescence of the product formed in the reaction of gaseous formaldehyde trapped in an aqueous solution with different liquids (Hantzsch reaction).
  • The initial toluene concentration of about 530 ppb (2.0 mg m−3 at 1013.25 hPa and 25 °C) was generated by the evaporation of liquid toluene (99.8 % purity) on a glass tray at an ambient temperature of 25 °C. The concentration was measured with a compact proton-transfer-reaction mass spectrometer with a quadrupole mass analyzer (PTR-MS, model IONICON Compact PTR-MS).
  • The initial NO2 concentration of about 1280 ppb (2.4 mg m−3 at 1013.25 hPa and 25 °C) was generated by feeding NO2 from a gas cylinder (10,000 ppm NO2 in nitrogen 5.0) into the test chamber. NO2 was measured with a chemiluminescence detector (CLD, model Environnement AC 32M). Besides NO2, the CLD detector also measures the concentration of nitrogen monoxide (NO).
After the initial concentration was reached, the air was mixed for another 10 min to achieve homogeneous mixing. After that, either the natural decay was recorded for 60 min or the air cleaner was switched on to measure the total decay for 60 min. The data were exponentially fitted according to Equation (1) to derive the decay rates and CADR.
In addition to the CADR tests with gases, CADR tests with cigarette smoke particles in the size range of 0.3 µm to 10 µm were also performed in accordance with GB/T 18801:2015 [49] to estimate the flow rate of the air cleaner. The details of the test method are described in Ref. [17].

3. Results

3.1. Reference Measurements with Cigarette Smoke Particles

Taking into account that the filter has a particle filtration efficiency close to 100% (99.97% for 0.003 µm NaCl particles, according to the datasheet), the CADR for particles can serve as an estimate for the flow rate of the appliance. For the pristine filter, a CADR of 341 m3h−1 was determined with cigarette smoke particles, while the modified filter revealed a CADR of 355 m3h−1. As the difference was within the uncertainty of the test method, it can be assumed that the modification did not cause significant macroscopic changes to the filter material, which would alter the pressure drop and thus also the CADR via the flow rate. Therefore, it is a reasonable assumption that the following tests with gases were performed at approximately the same flow rate for both filters.

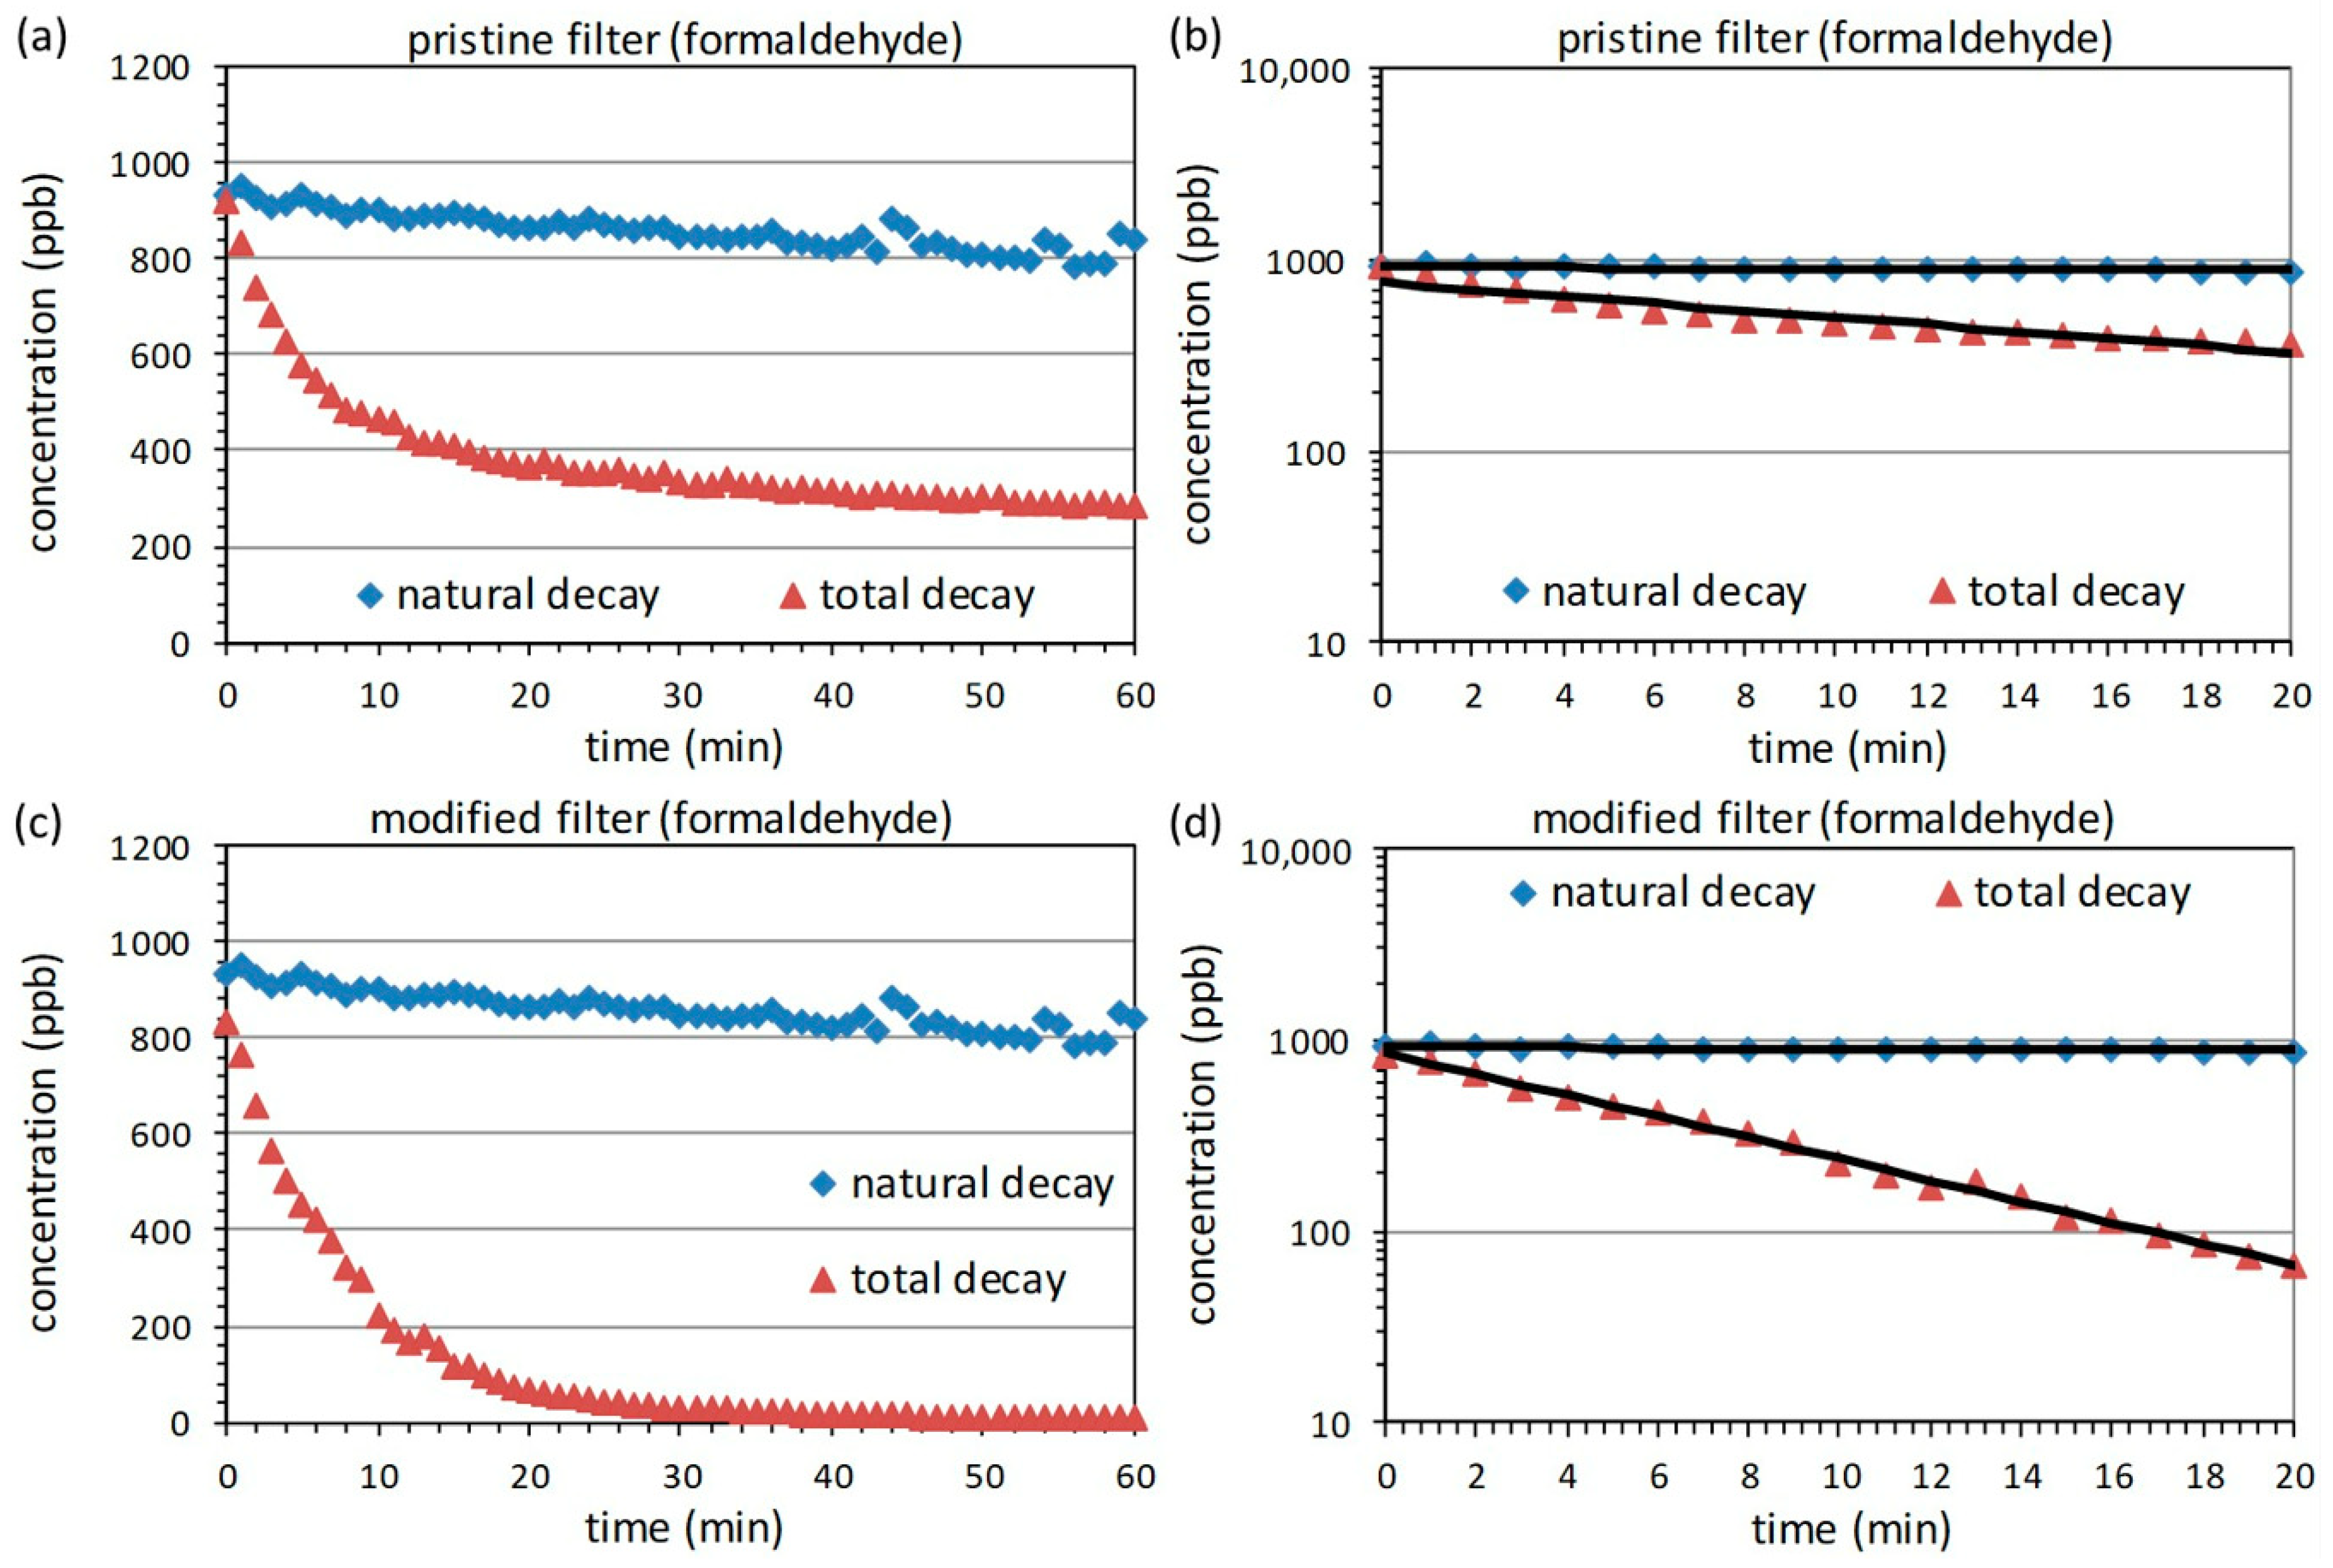
3.2. Measurements with Formaldehyde

Figure 2 shows the decay curves measured with formaldehyde for the two filter types. The top and bottom rows show the data for the pristine and modified filters. The whole measurement time of 60 min is presented on the left side. The natural decay curve without the air cleaner is marked in blue, whereas the total decay curve with the air cleaner switched on at t = 0 is marked in red.
On the right side of Figure 2, the first 20 min of the data are shown in a logarithmic representation. Only those were considered for fitting since the decay curves started to deviate from the simple exponential approach in Equation (1) for longer measurement times. This was especially obvious for the pristine filter, for which the formaldehyde concentration did not approach zero but a stable equilibrium state between about 200 ppb and 300 ppb. This confirmed that the removal of formaldehyde by the pristine AC was due to a relatively weak physisorption. However, for the first 20 min, the decay curves followed the exponential model to a good approximation. as can be seen by comparing the black lines with the data points. The values for the correlation coefficient R2 fulfilled the minimum requirement of 0.90 of GB/T 18801:2015 [49] in all cases.
The derived values for the natural decay rate, the total decay rate, the correlation coefficient of the total decay rate, and the CADR calculated according to Equation (2) are listed in Table 1. Additionally, the adsorption efficiency was estimated on the basis of the estimated flow rates determined in the previous chapter. The natural decay rate was identical in both cases, as the same reference measurement was used. The data show that the CADR for formaldehyde increased from 71 m3h−1 for the pristine filter to 219 m3h−1 for the modified filter, which is close to the value of 220 m3h−1 given by the manufacturer. This is a relative change in the CADR of more than 200%, which verifies that the modification had a substantial positive effect on the adsorption of formaldehyde.

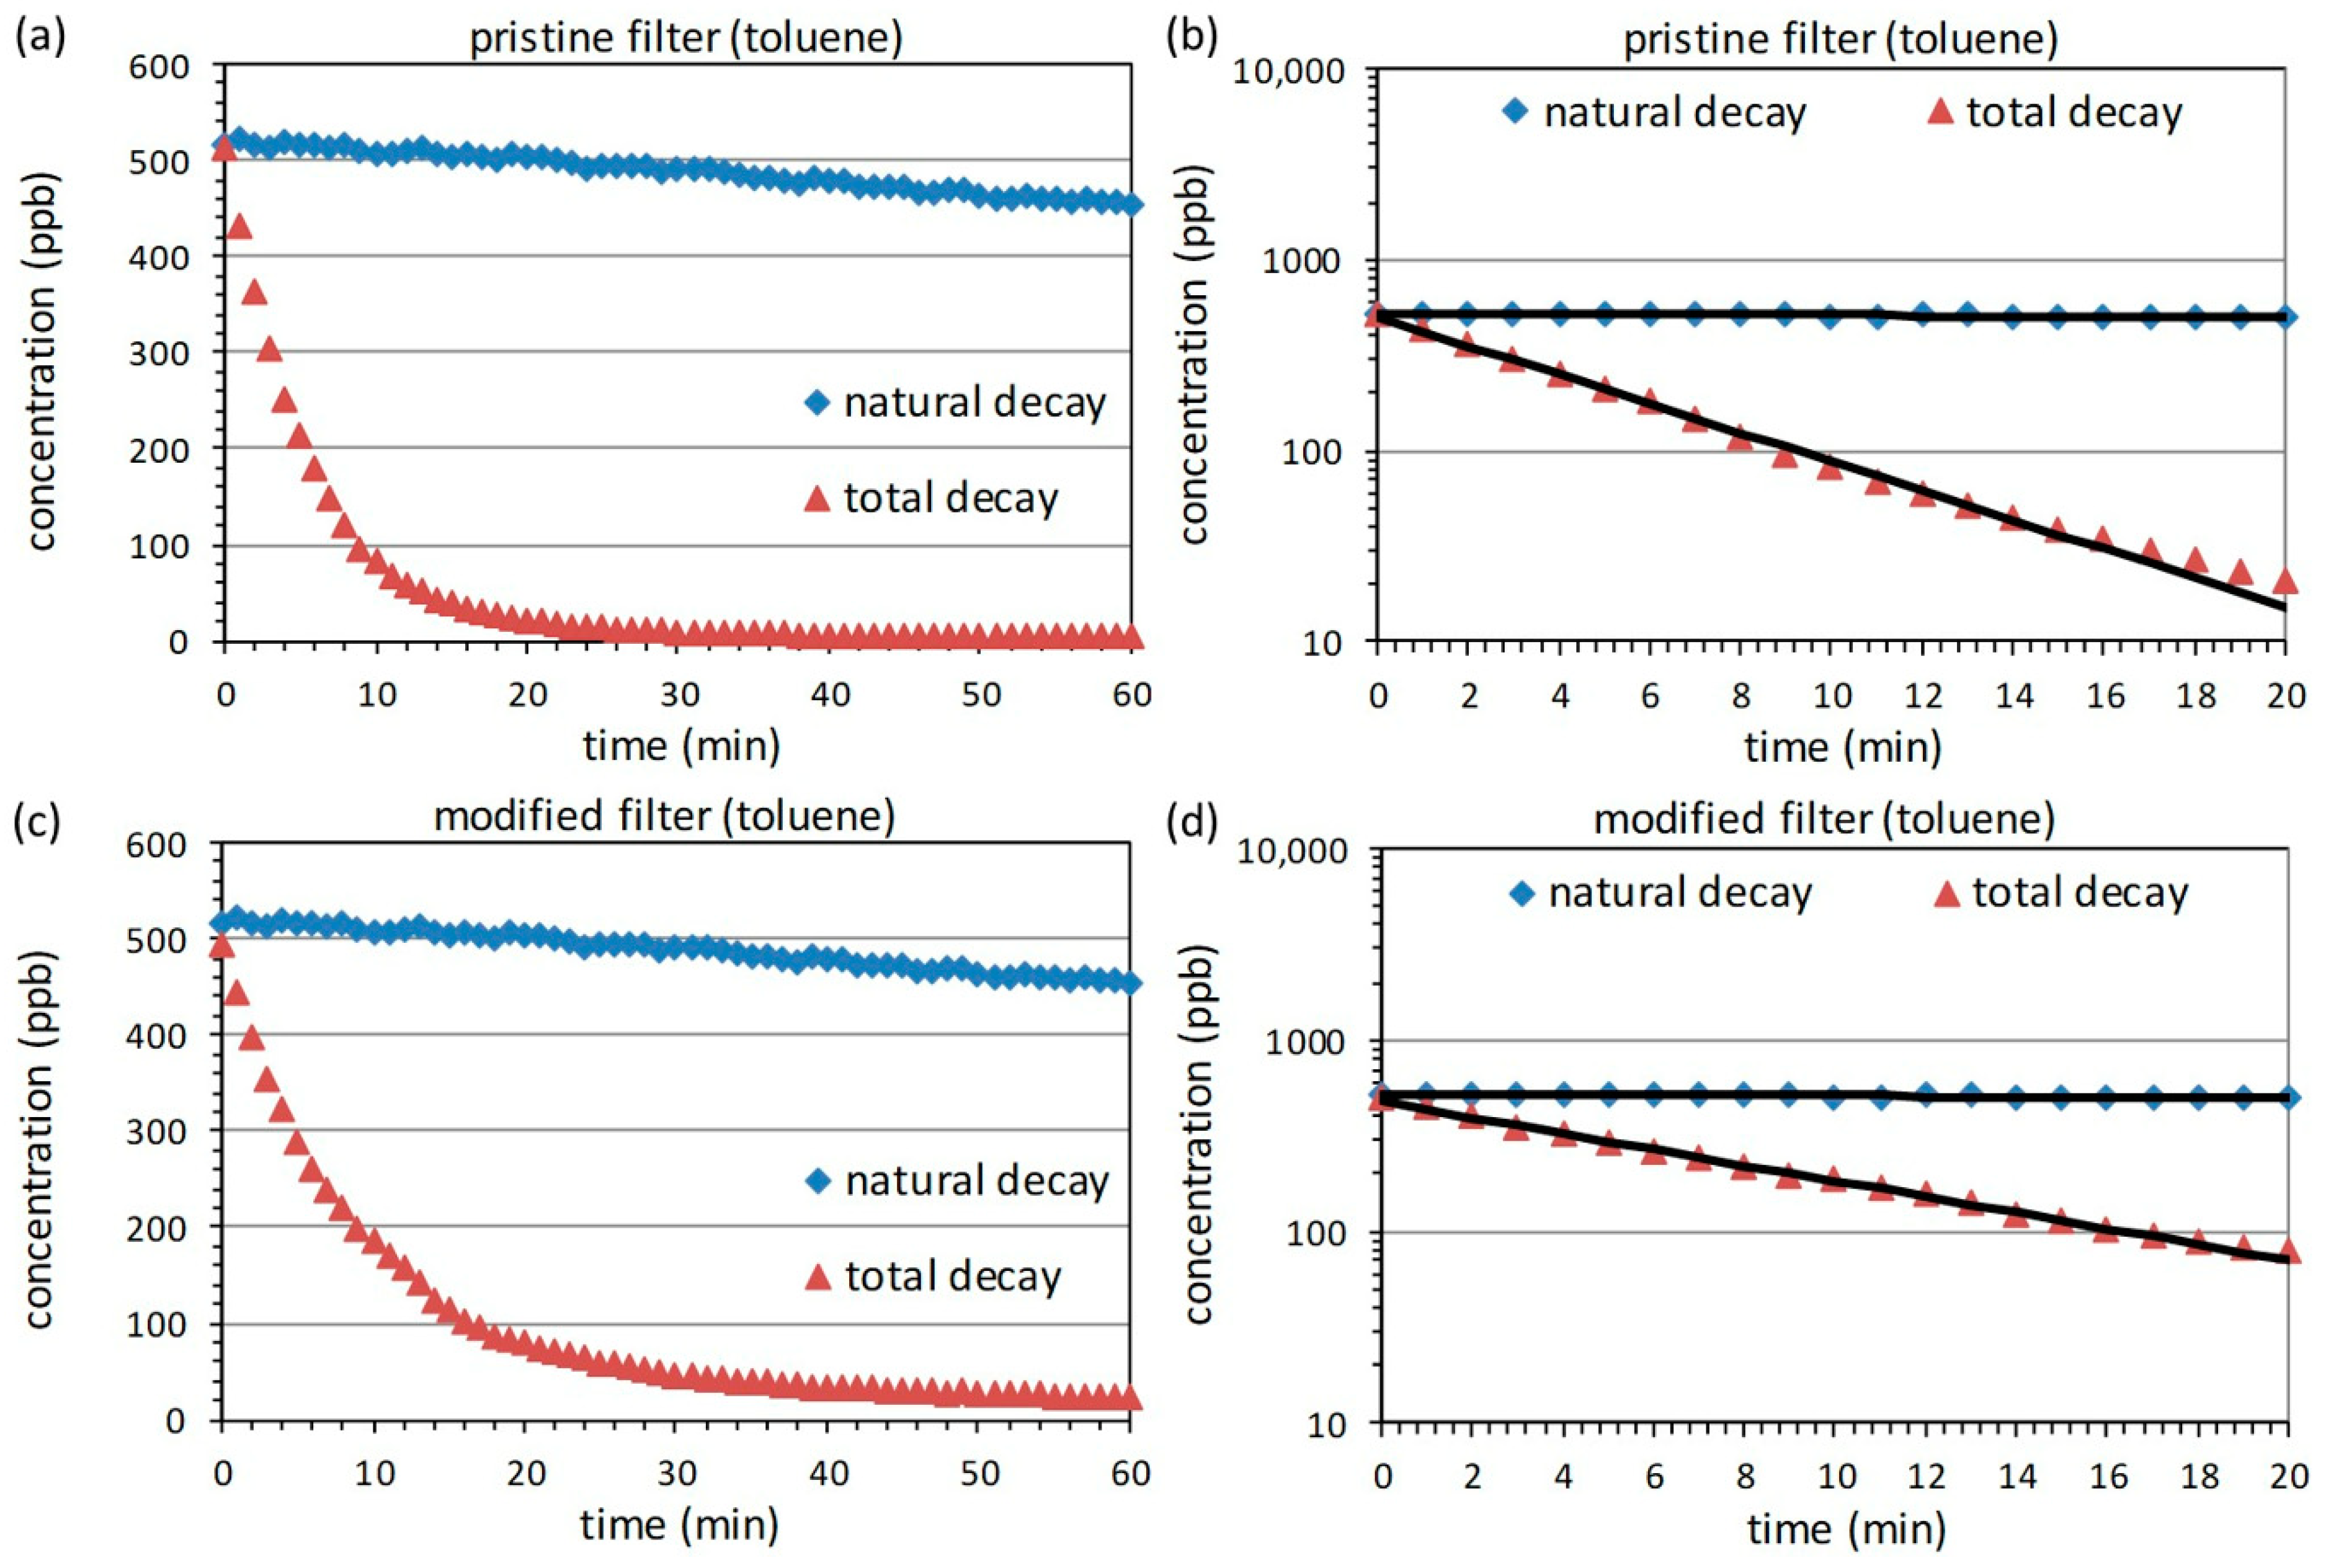
3.3. Measurements with Toluene

Figure 3 shows the decay curves measured with toluene for the pristine and modified filter in the same style as Figure 2 for formaldehyde. Again, a good agreement between the exponential fits and the measured data points was found for the first 20 min. The derived fit parameters and CADR values are listed in Table 2. In contrast to the previously found improvement for formaldehyde, a substantial decrease in the CADR from 289 m3h−1 to 165 m3h−1 was observed in the case of toluene. This corresponds to a relative reduction of 42%. Obviously, the positive effect for formaldehyde was accompanied by a negative effect for toluene.

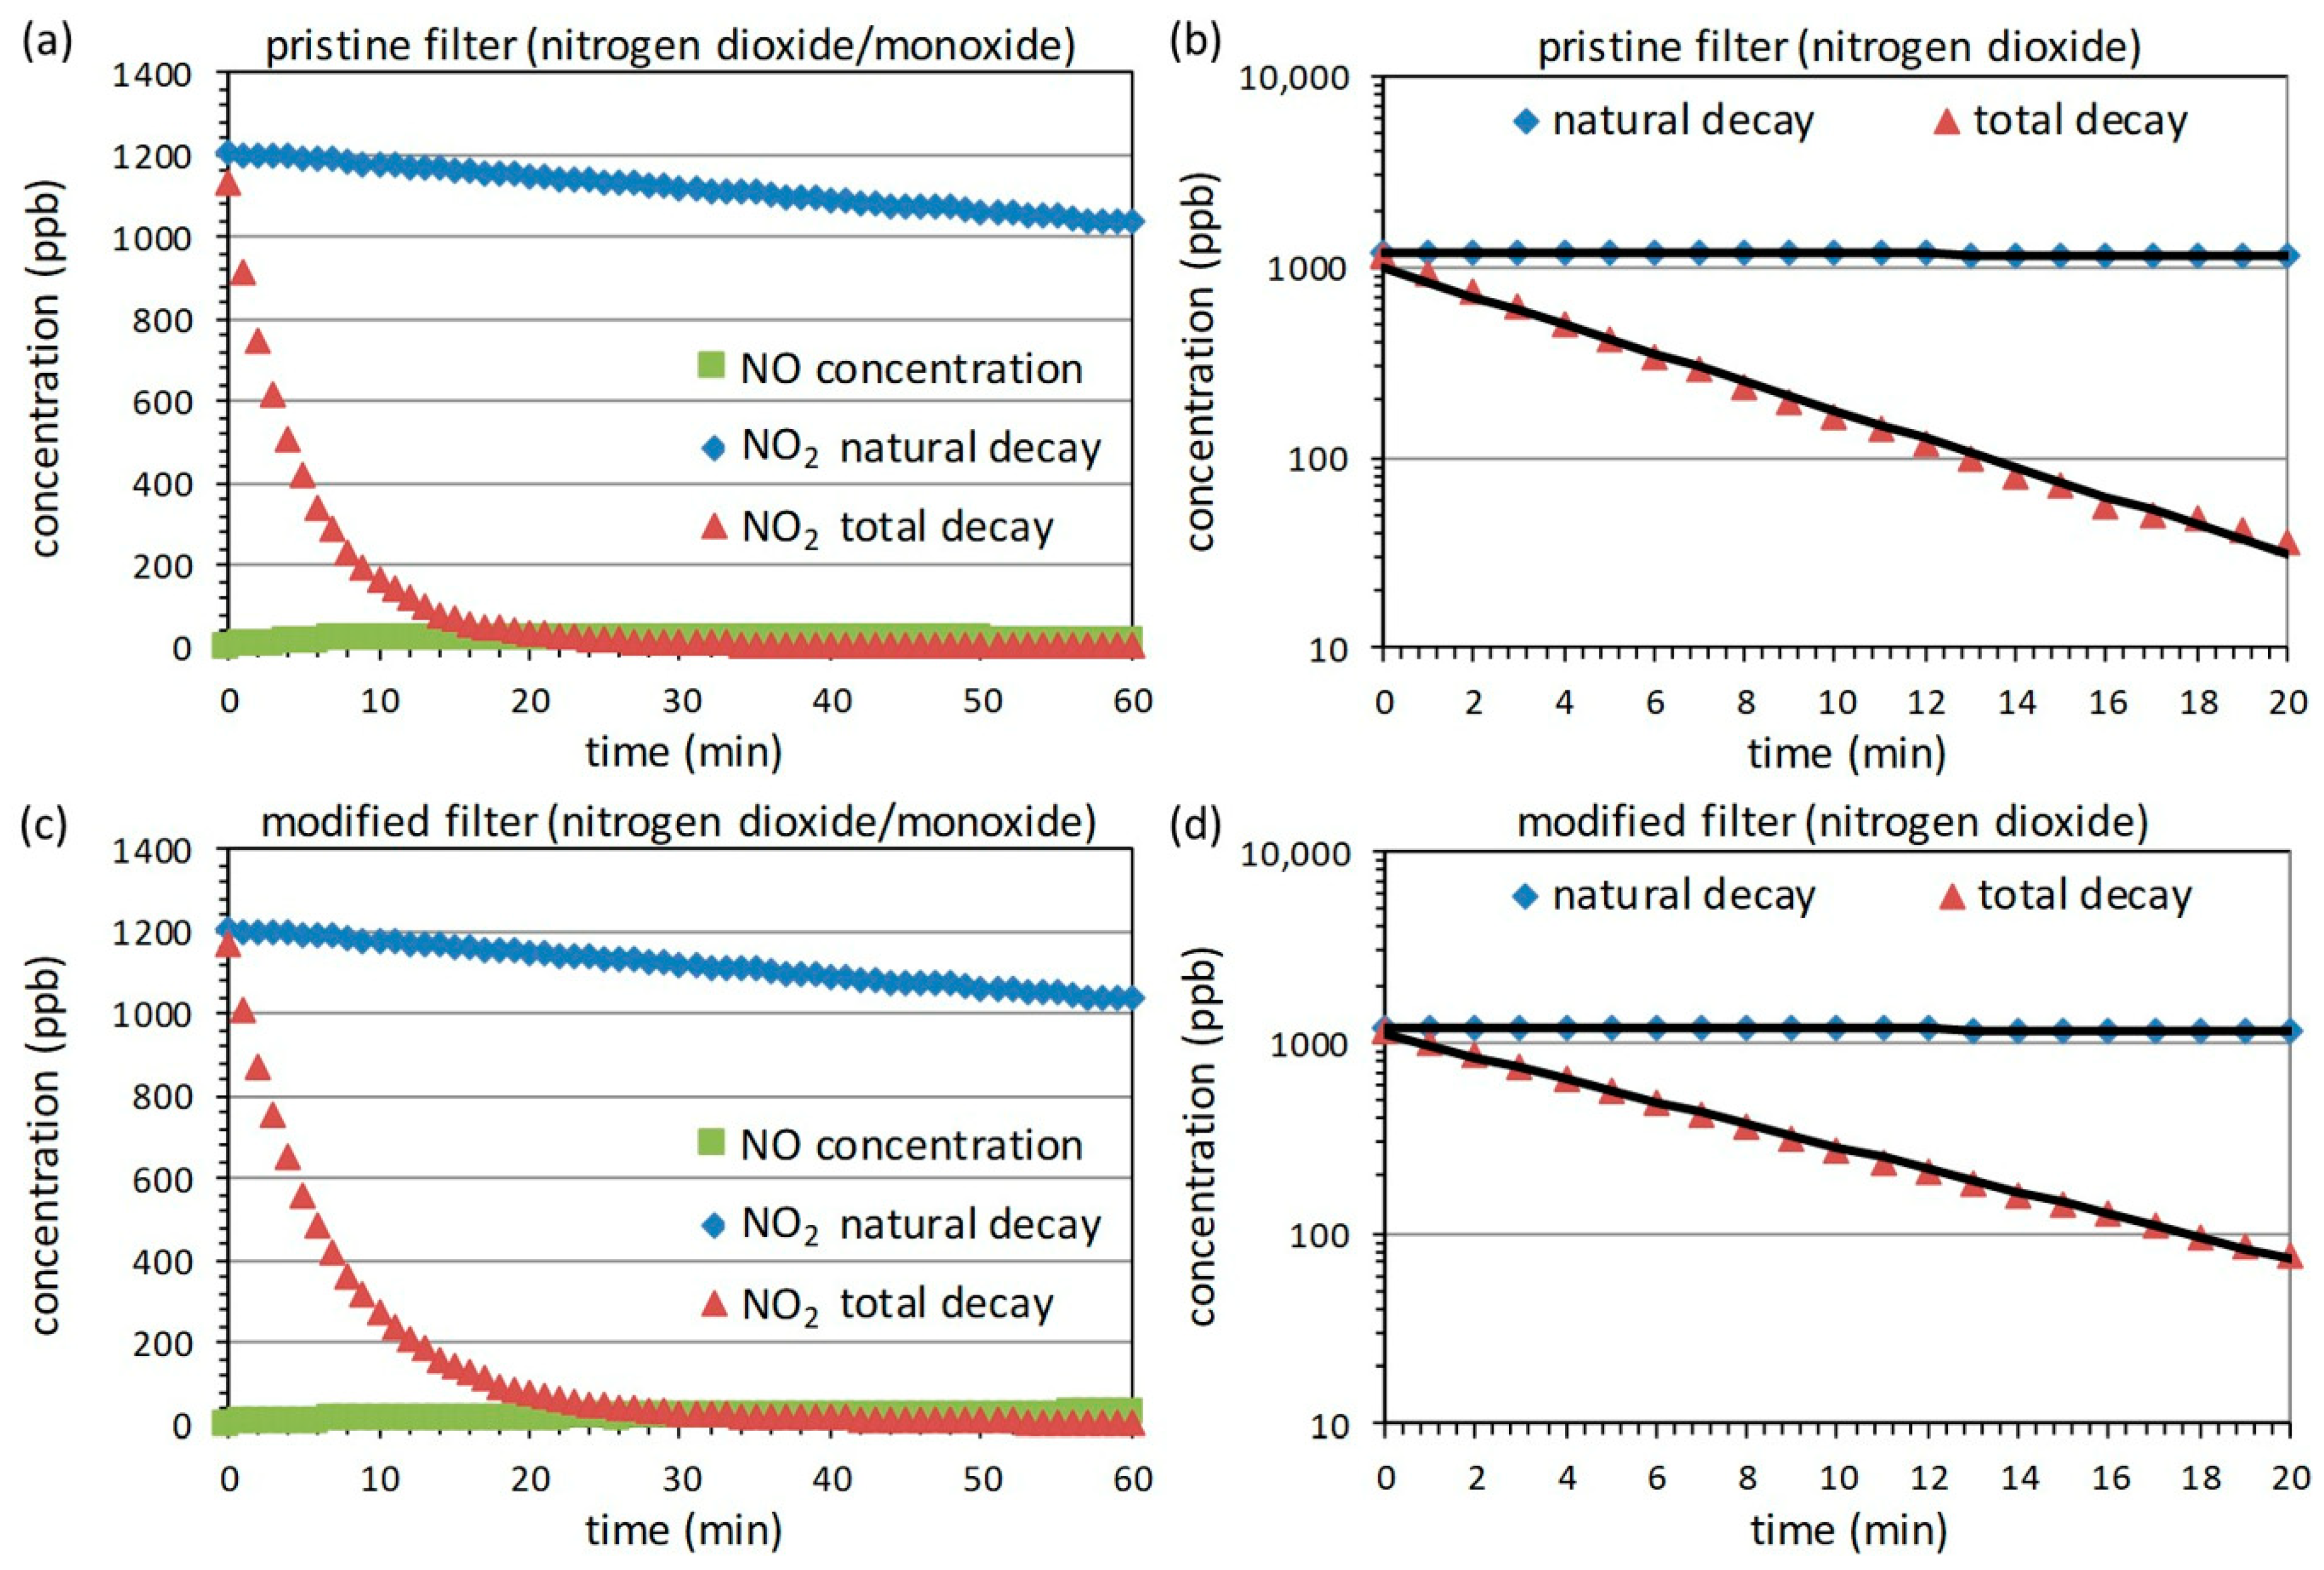
3.4. Measurements with Nitrogen Dioxide

To complete the picture, Figure 4 shows the decay curves measured with NO2 for both filter types in the same style as the previous figures. We note that during the measurements, a slight increase in the NO concentration in the chamber of about 20 ppb within 60 min was observed. That indicates that NO2 was not only adsorbed by the AC but also partially catalytically reduced to NO, which is a well-known effect [59,60,61]. Therefore, the derived CADR is a slight overestimation of the real cleaning effect, as the NO can later oxidize back to NO2. The NO2 decay curves of both filters followed the exponential model over the first 20 min so that the parameters listed in Table 3 could be derived. As with toluene, a reduction in the CADR from 308 m3h−1 to 239 m3h−1 by the optimization was found with NO2. However, the relative effect of a 22% reduction was less pronounced than that in the case of toluene.

4. Discussion

The results of the measurements with three different gases on two different filters are summarized in Table 4. The data show that the strong improvement in the CADR for formaldehyde was accompanied by a reduction for toluene and nitrogen dioxide. As the type of modification of the AC is not known for confidentiality reasons, the exact cause for this competing effect could not be identified. Nevertheless, we discuss several potential explanations below that might be transferrable to other cases in which filters are optimized for the removal of formaldehyde.
The first potential explanation is that a change in the chemical surface properties induced by the modification could lead to a reduced efficiency for toluene and NO2. For example, increasing the polarity of AC is known to decrease the performance for non-polar VOCs, such as benzene, toluene, ethylbenzene, and xylene (BTEX) [62]. However, the impregnation with amines typically used to improve formaldehyde adsorption is also known to lead to better adsorption of NO2 [63,64]. As this is in contradiction to the findings here, a change in the chemical surface properties does not seem to be the dominant effect.
Second, it is known that the impregnation of AC can also have a negative influence on the physical properties, such as the Brunauer–Emmett–Teller (BET) surface area as well as the pore volume and size distribution [65]. If this had been the case here, it would in principle lead to a reduced adsorption efficiency for all three adsorbates [66]. However, if the reduction can be overcompensated by the improved chemical surface properties for the adsorption of formaldehyde, it is plausible that a reduction in the CADR is only observed for toluene and NO2.
A third potential explanation is that the AC is partially replaced by another adsorbant. For example, blends or composites of AC with zeolites [67,68], mesoporous silica [69], silica aerogels [70], or metal oxides [71] have been used in the past to optimize the adsorption efficiency for specific gas mixtures. However, if the added adsorbant is more efficient for formaldehyde but less efficient for toluene and NO2 than the original AC, the degradation for the latter gases could be simply explained by a lower amount of AC integrated into the filter.

5. Conclusions

The results show that, for an exemplary air cleaner, the optimization for formaldehyde by the modification of the AC filter can have detrimental effects on the adsorption of other gases, such as toluene or NO2. This leads to the conclusion that testing standards for air cleaners should not only consider formaldehyde but also other gases to reveal such potential negative side effects. This concept was recently followed in the latest revision of GB/T 18801:2015 [49] to GB/T 18801:2022 [72], which now also provides a measurement with a gas mixture of formaldehyde, toluene, butyl acetate, and styrene as an option. Similarly, the recently published US testing standard AHAM AC-4:2022 [73] suggested tests with formaldehyde, ammonia, toluene, n-heptane, and d-limonene. In addition, the new international testing standard IEC 63086-2-2 [74], which is currently under development, plans to make more than a single gas mandatory for testing.
Should such an extended test program reveal drawbacks of optimization, a possible solution could be to use blends of different adsorbants that complement each other with the aim of finding the best compromise for a typical composition of indoor air pollutants. Alternatively, novel approaches for surface modifications to AC, e.g., by the integration of specific nanoparticles [75,76,77], might show less negative impacts on the adsorption of other gases. However, this needs to be demonstrated in future studies.

Author Contributions

Conceptualization, S.S.; methodology, S.S. and K.S.; validation, S.S. and K.S.; formal analysis, S.S. and K.S.; investigation, A.C. and U.S. (Ute Schneiderwind); writing—original draft preparation, S.S.; writing—review and editing, K.S. and U.S. (Uta Sager); supervision, C.A. All authors have read and agreed to the published version of the manuscript.

Funding

This research received no external funding.

Institutional Review Board Statement

Not applicable.

Informed Consent Statement

Not applicable.

Data Availability Statement

The data presented in this study are openly available in Zenodo at https://doi.org/10.5281/zenodo.10496682 (accessed on 11 January 2024).

Acknowledgments

The authors acknowledge Versuni for providing the tested air cleaner and filters. Tim van der Graaf is acknowledged for his useful discussions.

Conflicts of Interest

The authors declare no conflict of interest.

References

  1. Jones, A.P. Indoor air quality and health. Atmos. Environ. 1999, 33, 4535–4564. [Google Scholar] [CrossRef]
  2. Bernstein, J.A.; Alexis, N.; Bacchus, H.; Bernstein, I.L.; Fritz, P.; Horner, E.; Li, N.; Mason, S.; Nel, A.; Oullette, J.; et al. The health effects of nonindustrial indoor air pollution. J. Allergy Clin. Immunol. 2008, 121, 585–591. [Google Scholar] [CrossRef] [PubMed]
  3. Halios, C.H.; Landeg-Cox, C.; Lowther, S.D.; Middleton, A.; Marczylo, T.; Dimitroulopoulou, S. Chemicals in European residences—Part I: A review of emissions, concentrations and health effects of volatile organic compounds (VOCs). Sci. Total Environ. 2022, 839, 156201. [Google Scholar] [CrossRef] [PubMed]
  4. Salthammer, T.; Mentese, S.; Marutzky, R. Formaldehyde in the indoor environment. Chem. Rev. 2010, 110, 2536–2572. [Google Scholar] [CrossRef] [PubMed]
  5. Nielsen, G.D.; Wolkoff, P. Cancer effects of formaldehyde: A proposal for an indoor air guideline value. Arch. Toxicol. 2010, 84, 423–446. [Google Scholar] [CrossRef]
  6. Kang, Y.J.; Jo, H.K.; Jang, M.H.; Ma, X.; Jeon, Y.; Oh, K.; Park, J.I. A brief review of formaldehyde removal through AC adsorption. Appl. Sci. 2022, 12, 5025. [Google Scholar] [CrossRef]
  7. Thompson, C.M.; Subramaniam, R.P.; Grafström, R.C. Mechanistic and dose considerations for supporting adverse pulmonary physiology in response to formaldehyde. Toxicol. Appl. Pharmacol. 2008, 233, 355–359. [Google Scholar] [CrossRef] [PubMed]
  8. McGwin, G., Jr.; Lienert, J.; Kennedy, J.I., Jr. Formaldehyde exposure and asthma in children: A systematic review. Environ. Health Perspect. 2010, 118, 313–317. [Google Scholar] [CrossRef]
  9. Salthammer, T. The reliability of models for converting formaldehyde emissions from wood-based materials to different environmental conditions. Build. Environ. 2023, 247, 111041. [Google Scholar] [CrossRef]
  10. Salthammer, T. Formaldehyde sources, formaldehyde concentrations and air exchange rates in European housings. Build. Environ. 2019, 150, 219–232. [Google Scholar] [CrossRef]
  11. Carter, E.M.; Katz, L.E.; Speitel, G.E., Jr.; Ramirez, D. Gas-phase formaldehyde adsorption isotherm studies on activated carbon: Correlations of adsorption capacity to surface functional group density. Environ. Sci. Technol. 2011, 45, 6498–6503. [Google Scholar] [CrossRef]
  12. Cavalcante, R.M.; Seyffert, B.H.; D’Oca, M.G.M.; Nascimento, R.F.; Campelo, C.S.; Pinto, I.S.; Anjos, F.B.; Costa, A.H. Exposure assessment for formaldehyde and acetaldehyde in the workplace. Indoor Built Environ. 2005, 14, 165–172. [Google Scholar] [CrossRef]
  13. Cammalleri, V.; Pocino, R.N.; Marotta, D.; Protano, C.; Sinibaldi, F.; Simonazzi, S.; Petyx, M.; Iavicoli, S.; Vitali, M. Occupational scenarios and exposure assessment to formaldehyde: A systematic review. Indoor Air 2022, 32, e12949. [Google Scholar] [CrossRef] [PubMed]
  14. Morantes, G.; Jones, B.; Sherman, M.; Molina, C. A preliminary assessment of the health impacts of indoor air contaminants determined using the DALY metric. Int. J. Vent. 2023, 22, 307–316. [Google Scholar] [CrossRef]
  15. Logue, J.M.; Price, P.N.; Sherman, M.H.; Singer, B.C. A method to estimate the chronic health impact of air pollutants in US residences. Environ. Health Perspect. 2012, 120, 216–222. [Google Scholar] [CrossRef] [PubMed]
  16. Nielsen, G.D.; Larsen, S.T.; Wolkoff, P. Re-evaluation of the WHO (2010) formaldehyde indoor air quality guideline for cancer risk assessment. Arch. Toxicol. 2017, 91, 35–61. [Google Scholar] [CrossRef]
  17. Schumacher, S.; Spiegelhoff, D.; Schneiderwind, U.; Finger, H.; Asbach, C. Performance of new and artificially aged electret filters in indoor air cleaners. Chem. Eng. Technol. 2018, 41, 27–34. [Google Scholar] [CrossRef]
  18. Morawska, L.; Tang, J.; Bahnfleth, W.; Bluyssen, P.; Boerstra, A.; Buonanno, G.; Cao, J.; Dancer, S.; Floto, A.; Franchimon, F.; et al. How can airborne transmission of COVID-19 indoors be minimised? Environ. Int. 2020, 142, 105832. [Google Scholar] [CrossRef]
  19. Curtius, J.; Granzin, M.; Schrod, J. Testing mobile air cleaners in a school classroom: Reducing the airborne transmission risk for SARS-CoV-2. Aerosol Sci. Technol. 2021, 55, 586–599. [Google Scholar] [CrossRef]
  20. Schumacher, S.; Schmid, H.-J.; Asbach, C. Effektivität von Luftreinigern zur Reduzierung des COVID-19-Infektionsrisikos. Gefahrstoffe Reinh. Luft 2021, 81, 16–28. [Google Scholar] [CrossRef]
  21. Schumacher, S.; Banda Sanchez, A.; Caspari, A.; Staack, K.; Asbach, C. Testing filter-based air cleaners with surrogate particles for viruses and exhaled droplets. Atmosphere 2022, 13, 1538. [Google Scholar] [CrossRef]
  22. Siegel, J.A. Primary and secondary consequences of indoor air cleaners. Indoor Air 2016, 26, 88–96. [Google Scholar] [CrossRef]
  23. Zhu, X.; Lv, M.; Yang, X. Performance of sorption-based portable air cleaners in formaldehyde removal: Laboratory tests and field verification. Build. Environ. 2018, 136, 177–184. [Google Scholar] [CrossRef]
  24. Sørensen, S.B.; Feilberg, A.; Kristensen, K. Removal of volatile organic compounds by mobile air cleaners: Dynamics, limitations, and possible side effects. Build. Environ. 2023, 242, 110541. [Google Scholar] [CrossRef]
  25. An, K.; Wang, Z.; Yang, X.; Qu, Z.; Sun, F.; Zhou, W.; Zhao, H. Reasons of low formaldehyde adsorption capacity on activated carbon: Multi-scale simulation of dynamic interaction between pore size and functional groups. J. Environ. Chem. Eng. 2022, 10, 108723. [Google Scholar] [CrossRef]
  26. Pei, J.; Zhang, J.S. On the performance and mechanisms of formaldehyde removal by chemi-sorbents. Chem. Eng. J. 2011, 167, 59–66. [Google Scholar] [CrossRef]
  27. de Falco, G.; Li, W.; Cimino, S.; Bandosz, T.J. Role of sulfur and nitrogen surface groups in adsorption of formaldehyde on nanoporous carbons. Carbon 2018, 138, 283–291. [Google Scholar] [CrossRef]
  28. Lee, K.J.; Miyawaki, J.; Shiratori, N.; Yoon, S.H.; Jang, J. Toward an effective adsorbent for polar pollutants: Formaldehyde adsorption by activated carbon. J. Hazard. Mater. 2013, 260, 82–88. [Google Scholar] [CrossRef]
  29. Tanada, S.; Kawasaki, N.; Nakamura, T.; Araki, M.; Isomura, M. Removal of formaldehyde by activated carbons containing amino groups. J. Colloid Interface Sci. 1999, 214, 106–108. [Google Scholar] [CrossRef]
  30. Kim, D.I.; Park, J.H.; Do Kim, S.; Lee, J.Y.; Yim, J.H.; Jeon, J.K.; Park, S.H.; Park, Y.K. Comparison of removal ability of indoor formaldehyde over different materials functionalized with various amine groups. J. Ind. Eng. Chem. 2011, 17, 1–5. [Google Scholar] [CrossRef]
  31. Ma, C.; Li, X.; Zhu, T. Removal of low-concentration formaldehyde in air by adsorption on activated carbon modified by hexamethylene diamine. Carbon 2011, 49, 2873–2875. [Google Scholar] [CrossRef]
  32. Baur, G.B.; Spring, J.; Kiwi-Minsker, L. Amine functionalized activated carbon fibers as effective structured adsorbents for formaldehyde removal. Adsorption 2018, 24, 725–732. [Google Scholar] [CrossRef]
  33. Bellat, J.P.; Bezverkhyy, I.; Weber, G.; Royer, S.; Averlant, R.; Giraudon, J.M.; Lamonier, J.F. Capture of formaldehyde by adsorption on nanoporous materials. J. Hazard. Mater. 2015, 300, 711–717. [Google Scholar] [CrossRef]
  34. Lara-Ibeas, I.; Megías-Sayago, C.; Louis, B.; Le Calvé, S. Adsorptive removal of gaseous formaldehyde at realistic concentrations. J. Environ. Chem. Eng. 2020, 8, 103986. [Google Scholar] [CrossRef]
  35. Birmili, W.; Daniels, A.; Bethke, R.; Schechner, N.; Brasse, G.; Conrad, A.; Kolossa-Gehring, M.; Debiak, M.; Hurraß, J.; Uhde, E.; et al. Formaldehyde, aliphatic aldehydes (C2–C11), furfural, and benzaldehyde in the residential indoor air of children and adolescents during the German Environmental Survey 2014–2017 (GerES V). Indoor Air 2022, 32, e12927. [Google Scholar] [CrossRef] [PubMed]
  36. Fang, L.; Liu, N.; Liu, W.; Mo, J.; Zhao, Z.; Kan, H.; Deng, F.; Huang, C.; Zhao, B.; Zeng, X.; et al. Indoor formaldehyde levels in residences, schools, and offices in China in the past 30 years: A systematic review. Indoor Air 2022, 32, e13141. [Google Scholar] [CrossRef] [PubMed]
  37. Tsai, W.T. An overview of health hazards of volatile organic compounds regulated as indoor air pollutants. Environ. Health Rev. 2019, 34, 81–89. [Google Scholar] [CrossRef] [PubMed]
  38. Sarigiannis, D.A.; Karakitsios, S.P.; Gotti, A.; Liakos, I.L.; Katsoyiannis, A. Exposure to major volatile organic compounds and carbonyls in European indoor environments and associated health risk. Environ. Int. 2011, 37, 743–765. [Google Scholar] [CrossRef] [PubMed]
  39. Vardoulakis, S.; Giagloglou, E.; Steinle, S.; Davis, A.; Sleeuwenhoek, A.; Galea, K.S.; Dixon, K.; Crawford, J.O. Indoor exposure to selected air pollutants in the home environment: A systematic review. Int. J. Environ. Res. Public Health 2020, 17, 8972. [Google Scholar] [CrossRef]
  40. Win-Shwe, T.T.; Fujimaki, H. Neurotoxicity of toluene. Toxicol. Lett. 2010, 198, 93–99. [Google Scholar] [CrossRef]
  41. ISO 10121-2; Test Methods for Assessing the Performance of Gas-Phase Air Cleaning Media and Devices for General Ventilation Part 2: Gas-Phase Air Cleaning Media. International Organization for Standardization: Geneva, Switzerland, 2013.
  42. Echeverria, D.; Fine, L.; Langolf, G.; Schork, T.; Sampaio, C. Acute behavioural comparisons of toluene and ethanol in human subjects. Occup. Environ. Med. 1991, 48, 750–761. [Google Scholar] [CrossRef] [PubMed]
  43. Filley, C.M.; Halliday, W.; Kleinschmidt-DeMasters, B.K. The effects of toluene on the central nervous system. J. Neuropathol. Exp. Neurol. 2004, 63, 1–12. [Google Scholar] [CrossRef]
  44. Rooseboom, M.; Kocabas, N.A.; North, C.; Radcliffe, R.J.; Segal, L. Recommendation for an occupational exposure limit for toluene. Regul. Toxicol. Pharmacol. 2023, 141, 105387. [Google Scholar] [CrossRef]
  45. Hu, Y.; Zhao, B. Relationship between indoor and outdoor NO2: A review. Build. Environ. 2020, 180, 106909. [Google Scholar] [CrossRef]
  46. Huangfu, P.; Atkinson, R. Long-term exposure to NO2 and O3 and all-cause and respiratory mortality: A systematic review and meta-analysis. Environ. Int. 2020, 144, 105998. [Google Scholar] [CrossRef] [PubMed]
  47. Salonen, H.; Salthammer, T.; Morawska, L. Human exposure to NO2 in school and office indoor environments. Environ. Int. 2019, 130, 104887. [Google Scholar] [CrossRef] [PubMed]
  48. World Health Organization. WHO Global Air Quality Guidelines: Particulate Matter (PM2.5 and PM10), Ozone, Nitrogen Dioxide, Sulfur Dioxide and Carbon Monoxide; World Health Organization: Geneva, Switzerland, 2021. [Google Scholar]
  49. GB/T 18801; Air Cleaner. Standardization Administration of China: Beijing, China, 2015.
  50. ANSI/AHAM AC-1; Method for Measuring Performance of Portable Household Electric Room Air Cleaners. Association of Home Appliance Manufacturers: Washington, DC, USA, 2020.
  51. IEC 63086-1; Household and Similar Electrical Air Cleaning Appliances—Methods for Measuring the Performance—Part 1: General Requirements. International Electrotechnical Commission: Geneva, Switzerland, 2020.
  52. Laskar, I.I.; Hashisho, Z.; Phillips, J.H.; Anderson, J.E.; Nichols, M. Modeling the effect of relative humidity on adsorption dynamics of volatile organic compound onto activated carbon. Environ. Sci. Technol. 2019, 53, 2647–2659. [Google Scholar] [CrossRef]
  53. Sager, U.; Schmidt, F. Adsorption of nitrogen oxides, water vapour and ozone onto activated carbon. Adsorpt. Sci. Technol. 2009, 27, 135–145. [Google Scholar] [CrossRef]
  54. Li, J.; Li, Z.; Liu, B.; Xia, Q.; Xi, H. Effect of relative humidity on adsorption of formaldehyde on modified activated carbons. Chin. J. Chem. Eng. 2008, 16, 871–875. [Google Scholar] [CrossRef]
  55. Küpper, M.; Asbach, C.; Schneiderwind, U.; Finger, H.; Spiegelhoff, D.; Schumacher, S. Testing of an indoor air cleaner for particulate pollutants under realistic conditions in an office room. Aerosol Air Qual. Res. 2019, 19, 1655–1665. [Google Scholar] [CrossRef]
  56. Quintero, F.; Nagarajan, V.; Schumacher, S.; Todea, A.M.; Lindermann, J.; Asbach, C.; Luzzato, C.M.A.; Jilesen, J. Reducing Particle Exposure and SARS-CoV-2 Risk in Built Environments through Accurate Virtual Twins and Computational Fluid Dynamics. Atmosphere 2022, 13, 2032. [Google Scholar] [CrossRef]
  57. ISO/IEC 17025; General Requirements for the Competence of Testing and Calibration Laboratories. International Organization for Standardization: Geneva, Switzerland, 2017.
  58. GB/T 18883; Indoor Air Quality Standard. Standardization Administration of China: Beijing, China, 2002.
  59. Zhang, W.J.; Bagreev, A.; Rasouli, F. Reaction of NO2 with activated carbon at ambient temperature. Ind. Eng. Chem. Res. 2008, 47, 4358–4362. [Google Scholar] [CrossRef]
  60. Gao, X.; Liu, S.; Zhang, Y.; Luo, Z.; Ni, M.; Cen, K. Adsorption and reduction of NO2 over activated carbon at low temperature. Fuel Process. Technol. 2011, 92, 139–146. [Google Scholar] [CrossRef]
  61. Daifullah, A.A.M.; Girgis, B.S. Impact of surface characteristics of activated carbon on adsorption of BTEX. Colloids Surf. A Physicochem. Eng. Asp. 2003, 214, 181–193. [Google Scholar] [CrossRef]
  62. Deliyanni, E.; Bandosz, T.J. Effect of carbon surface modification with dimethylamine on reactive adsorption of NOx. Langmuir 2011, 27, 1837–1843. [Google Scholar] [CrossRef]
  63. Zhu, X.; Zhang, L.; Zhang, M.; Ma, C. Effect of N-doping on NO2 adsorption and reduction over activated carbon: An experimental and computational study. Fuel 2019, 258, 116109. [Google Scholar] [CrossRef]
  64. Yin, C.Y.; Aroua, M.K.; Daud, W.M.A.W. Review of modifications of activated carbon for enhancing contaminant uptakes from aqueous solutions. Sep. Purif. Technol. 2007, 52, 403–415. [Google Scholar] [CrossRef]
  65. Yin, C.Y.; Aroua, M.K.; Daud, W.M.A.W. Polyethyleneimine impregnation on activated carbon: Effects of impregnation amount and molecular number on textural characteristics and metal adsorption capacities. Mater. Chem. Phys. 2008, 112, 417–422. [Google Scholar] [CrossRef]
  66. Zhang, R.; Zeng, L.; Wang, F.; Li, X.; Li, Z. Influence of pore volume and surface area on benzene adsorption capacity of activated carbons in indoor environments. Build. Environ. 2022, 216, 109011. [Google Scholar] [CrossRef]
  67. Jin, M.; Kurniawan, W.; Hinode, H. Development of zeolite/carbon composite adsorbent. J. Chem. Eng. Jpn. 2006, 39, 154–161. [Google Scholar] [CrossRef]
  68. Foo, K.Y.; Hameed, B.H. The environmental applications of activated carbon/zeolite composite materials. Adv. Colloid Interface Sci. 2011, 162, 22–28. [Google Scholar] [CrossRef] [PubMed]
  69. Glover, T.G.; Dunne, K.I.; Davis, R.J.; LeVan, M.D. Carbon–silica composite adsorbent: Characterization and adsorption of light gases. Microporous Mesoporous Mater. 2008, 111, 1–11. [Google Scholar] [CrossRef]
  70. Mohammadi, A.; Moghaddas, J. Synthesis, adsorption and regeneration of nanoporous silica aerogel and silica aerogel-activated carbon composites. Chem. Eng. Res. Des. 2015, 94, 475–484. [Google Scholar] [CrossRef]
  71. Kim, W.K.; Vikrant, K.; Younis, S.A.; Kim, K.H.; Heynderickx, P.M. Metal oxide/activated carbon composites for the reactive adsorption and catalytic oxidation of formaldehyde and toluene in air. J. Clean. Prod. 2023, 387, 135925. [Google Scholar] [CrossRef]
  72. GB/T 18801; Air Cleaner. Standardization Administration of China: Beijing, China, 2022.
  73. AHAM AC-4; Method of Assessing the Reduction Rate of Chemical Gases by a Room Air Cleaner. Association of Home Appliance Manufacturers: Washington, DC, USA, 2022.
  74. IEC/CD 63086-2-2; Household and Similar Electrical Air Cleaning Appliances Methods for Measuring the Performance—Part 2-2: Particular Requirements for Determination of Gas-Phase Pollutant Reduction. International Electrotechnical Commission: Geneva, Switzerland, 2023.
  75. Rengga, W.D.P.; Chafidz, A.; Sudibandriyo, M.; Nasikin, M.; Abasaeed, A.E. Silver nano-particles deposited on bamboo-based activated carbon for removal of formaldehyde. J. Environ. Chem. Eng. 2017, 5, 1657–1665. [Google Scholar] [CrossRef]
  76. Chang, S.M.; Hu, S.C.; Shiue, A.; Lee, P.Y.; Leggett, G. Adsorption of silver nano-particles modified activated carbon filter media for indoor formaldehyde removal. Chem. Phys. Lett. 2020, 757, 137864. [Google Scholar] [CrossRef]
  77. Khaleghi, H.; Esmaeili, H.; Jaafarzadeh, N.; Ramavandi, B. Date seed activated carbon decorated with CaO and Fe3O4 nanoparticles as a reusable sorbent for removal of formaldehyde. Korean J. Chem. Eng. 2022, 39, 146–160. [Google Scholar] [CrossRef]
Figure 1. Schematic of the CADR test chamber.
Atmosphere 15 00109 g001
Figure 2. Natural (blue) and total (red) decay curves measured with formaldehyde for the pristine (a,b) and modified (c,d) filters. The whole measurement over 60 min is shown in the linear representation on the left side (a,c), whereas the first 20 min used for fitting are shown in the logarithmic representation on the right side (b,d). Black lines are exponential fits to the data points.
Atmosphere 15 00109 g002
Figure 3. Natural (blue) and total (red) decay curves measured with toluene for the pristine (a,b) and modified (c,d) filters. The whole measurement over 60 min is shown in a linear representation on the left side (a,c), whereas the first 20 min used for fitting are shown in a logarithmic representation on the right side (b,d). Black lines are exponential fits to the data points.
Atmosphere 15 00109 g003
Figure 4. Natural (blue) and total (red) decay curves measured with NO2 for the pristine (a,b) and modified (c,d) filters. Additionally, the measured NO concentration is shown in green for both filters. The whole measurement over 60 min is shown in the linear representation on the left side (a,c), whereas the first 20 min used for fitting are shown in the logarithmic representation on the right side (b,d). Black lines are exponential fits to the data points.
Atmosphere 15 00109 g004
Table 1. Natural and total decay rates, correlation coefficient for the total decay, derived CADR, and estimated adsorption efficiency for the two investigated filter types measured with formaldehyde.
Filter k n a t ( m i n 1 ) k t o t ( m i n 1 ) R t o t 2 C A D R ( m 3 h 1 ) Adsorption Efficiency
Pristine0.00370.04380.908171~21%
Modified0.00370.12800.9915219~62%
Table 2. Natural and total decay rates, correlation coefficient for the total decay, derived CADR, and estimated adsorption efficiency for the two investigated filter types measured with toluene.
Filter k n a t ( m i n 1 ) k t o t ( m i n 1 ) R t o t 2 C A D R ( m 3 h 1 ) Adsorption Efficiency
Pristine0.00160.16610.9924289~85%
Modified0.00160.09560.9952165~46%
Table 3. Natural and total decay rates, correlation coefficient for the total decay, derived CADR, and estimated adsorption efficiency for the two investigated filter types measured with NO2.
Filter k n a t ( m i n 1 ) k t o t ( m i n 1 ) R t o t 2 C A D R ( m 3 h 1 ) Adsorption Efficiency
Pristine0.00240.17730.9958308~90%
Modified0.00240.13820.9987239~67%
Table 4. CADR of the two investigated filter types for three different gases.
ParameterFormaldehydeTolueneNitrogen Dioxide
CADR pristine filter71 m3h−1289 m3h−1308 m3h−1
CADR modified filter219 m3h−1165 m3h−1239 m3h−1
Change with modification+208%−42%−22%
Disclaimer/Publisher’s Note: The statements, opinions and data contained in all publications are solely those of the individual author(s) and contributor(s) and not of MDPI and/or the editor(s). MDPI and/or the editor(s) disclaim responsibility for any injury to people or property resulting from any ideas, methods, instructions or products referred to in the content.

