Article

Factors Influencing Radon Variability and Measurement Protocol Optimization in Romanian Educational Buildings Using Integrated and Continuous Measurements

by
Gabriel-Cristian Dobrei
1,
Mircea-Claudiu Moldovan
1,*,
Tiberius Dicu
1,
Ștefan Florică
1,2,
Alexandru-Iulian Lupulescu
1,
Ancuța-Cristina Țenter
1 and
Alexandra Cucoș
1
1
“Constantin Cosma” Radon Laboratory—LiRaCC, Faculty of Environmental Science and Engineering, Babes-Bolyai University of Cluj–Napoca, 400294 Cluj–Napoca, Romania
2
S.C. RADON CONTROL S.A., 400294 Cluj–Napoca, Romania
*
Author to whom correspondence should be addressed.
Atmosphere 2024, 15(10), 1154; https://doi.org/10.3390/atmos15101154
Submission received: 1 August 2024 / Revised: 19 September 2024 / Accepted: 25 September 2024 / Published: 26 September 2024

Abstract

:
Due to the higher susceptibility of children to ionizing radiation, it is imperative to evaluate the radon activity concentration (RAC) in educational buildings, conduct additional investigations to identify radon entry routes, and implement remedial measures to minimize exposure to this radioactive gas. In Romania, educational buildings are a category of public buildings where it is mandatory to perform RAC measurements. The present study examines data obtained from 41 Romanian educational buildings, where initial and additional radon investigations were performed. The first objective was to identify the factors influencing the variability of the RAC inside the buildings. The second objective was to emphasize the importance of short-term (a few days), continuous measurements in identifying buildings with RAC exceeding the reference level. High RAC values were associated with the classrooms located on the ground floor of the building compared to the administrative ones. The multiple linear regression led to a coefficient of determination of 0.11, the relative humidity and the amount of precipitation being the main variables with a significant impact, kept in the model, the lack of a significant association between the indoor RAC and the radon potential in the soil being obtained. Comparison of the radon long-term integrated measurements with continuous, short-term, led to the suggestion of three different scenarios for the measurement work protocol. By following the suggested modifications, it is possible to accelerate the procedure in situations where the time needed to plan renovations and radon remedial measures is shorter than the time needed to conduct integrated measurements.

1. Introduction

Radon (Rn-222) is a heavy radioactive noble gas that occurs in the natural decay series of Uranium (U-238), which is present in all types of soil and rocks, in varying concentrations [1]. The outdoor radon concentration is generally low; the annual average values depending on the geographical area and the height above the ground. In general, radon in outdoor air does not represent a health risk to the population. However, when radon enters buildings, as a result of accumulation, it can reach high values representing a significant health issue [2]. In 1988, the International Agency for Research on Cancer designated radon as a carcinogen due to the findings of multiple epidemiological studies that revealed a link between radon exposure and health issues. Additionally, the World Health Organization considers that exposure to radon is the second leading cause of lung cancer after smoking [3]. The increasing number of radon-related lung cancer cases has prompted political decision makers to prioritize protection against radiation by reducing potential exposure to radon in buildings. As such, the EC Directive 2013/59 emphasizes increased attention to both residential and public radon exposure by implementing regulations and reference levels in European countries [4].
From the perspective of radon exposure in public buildings, international organizations emphasize that attention should be directed towards buildings where children and young individuals spend significant amounts of time. The International Commission on Radiological Protection (ICRP) highlights that the risk coefficient for lung cancer due to radon exposure is significantly higher for children and youth compared to adults [5]. For children, school is often the second most common place of exposure to radon after home because they typically spend between 4 and 10 h per day at school for most of the year. Studies have shown that children are more susceptible to ionizing radiation due to their smaller lung volumes and higher respiratory rates compared to adults, making them more sensitive to radiation exposure [5]. Numerous studies and radon measurements worldwide have focused on assessing the risk of exposure in children, educational staff, and auxiliary staff in schools [6,7,8,9,10,11].
Given the heightened susceptibility of children to ionizing radiation, it is imperative that rigorous actions be taken to identify radon sources and then to mitigate radon exposure in educational buildings. This calls for continuous monitoring, rigorous testing, and timely interventions to minimize radon levels and protect the vulnerable populations who frequent these spaces.
In Romania, the legislation was aligned with European regulations through the adoption of the norm HG No. 526/25 July 2018, establishing a reference level (RL) of 300 Bq/m3 for all types of buildings. The legislation was further revised in July 2023 by the Order of the President of the National Commission for Nuclear Activities Control (CNCAN) No. 153/27 July 2023 related to the methodology for determining radon activity concentration (RAC) in indoor air of buildings and workplaces. For buildings with high occupancy levels, such as educational buildings, this normative act mandates nationwide long-term, integrated measurements for initial investigation [12]. If the RAC is higher than the RL in at least one room with a high occupancy rate (at least 5 h/week), additional investigation is mandatory to identify the sources of radon and the entry routes, as well as transfer pathways inside the building. Subsequently, based on all the obtained results, the proposed remedial technique is implemented, followed by subsequent repetitive measurements that aim to evaluate the effectiveness of the applied techniques. Therefore, the initial investigation plays a crucial role in identifying buildings from the perspective of radon exposure. The minimum duration for integrated measurements is 3 months, with the recommendation to perform the measurements in the winter season. Despite these recommendations provided by national legislation, from a practical point of view they are not exactly feasible. Thus, in certain situations (renovation works), it is necessary to carry out short-term measurements (order of days), respectively, in a different season than winter. The Romanian legislation concerning indoor radon exposure does not provide remedies for these increasingly common situations. To tackle this problem, in Switzerland for example, the Federal Office for Public Health (FOPH) recommends performing continuous measurements for a period of at least 120 h under certain conditions to maximize the survey of radon behavior inside, as well as the chances of radon entering the building. A detailed description of this scenario is provided by Rey et al. [13].
By comparing continuous, short-term measurements with long-term integrated ones, it is possible to assess the practicality of adopting the recommendation made by FOPH in cases where there is insufficient time to conduct long-term integrated measurements for buildings undergoing renovation. In this context, the current study focused on 41 educational buildings. These buildings were selected based on the initial investigation, which identified at least one room with an RAC value higher than the RL. This finding prompted additional investigations and the subsequent short-term measurements.
As such, one objective of the present study was to emphasize the importance of short-term continuous measurements in identifying areas with the RAC exceeding the RL. Another objective was to assess the influence of the floor level where the monitored room is situated, as well as the type of room on the RAC. An assessment was also conducted on the influence of meteorological conditions on the RAC.

2. Materials and Methods

2.1. Study Parameters and Characteristics of Buildings

The current study analyzes the data from 41 educational buildings (31 schools, 9 kindergartens, and 1 nursery), in Cluj and Constanţa, where initial and additional investigations were conducted to identify the sources, entry routes, and transfer pathways of radon. Previous indoor radon surveys performed in both dwellings and workplaces in Cluj County [7,14] indicated that 19% of the monitored rooms exceeded the RL. Cluj–Napoca metropolitan area qualifies as a Radon Priority Area in Romania regarding all buildings—residential and public buildings—according to the algorithm for identifying a Radon Priority Area, which states that a minimum of 10% of the surveyed structures surpass the RL [12].
Geographically, 20 buildings are situated in Cluj County, while the remaining are in Constanţa. Architecturally, two of the buildings consist of only ground floor, five have both ground floor and first floor, and the remaining 34 buildings have a ground floor and two or more additional stories. The building footprints ranged widely from 165 m2 to 3400 m2, with a median footprint of 900 m2.
The additional investigations were required to identify the source, entry routes, and transfer pathways by which radon entered and migrated to the occupied spaces where the RAC exceeded the RL [12]. These measurements were carried out as a result of the financing provided by the local authorities, in accordance with the technical regulations in force to which the public buildings that are to be rehabilitated and modernized are subjected [15]. The measurements were carried out by the “Constantin Cosma” Radon Testing Laboratory (LiRaCC), an ISO:17025 certified laboratory by CNCAN.

2.2. Work Protocol

All 41 buildings from this study were subjected to initial and additional investigations, in accordance with ISO:11655 series of standards and the most recent updates in force of these standards as well as legislative requirements. The main measurements carried out are briefly described below.
Initial investigation using long-term integrated measurements
Indoor radon measurements were conducted by using CR-39 nuclear track detectors, RSKS type, provided by Radosys Ltd., Budapest, Hungary. In total, 343 detectors were exposed in high occupancy rooms (classrooms and administration offices) from the 41 buildings. The detectors were exposed in different periods between September and May, mostly during the winter season in line with national legislation (HG No. 526/25 July 2018). The number of CR-39 detectors exposed per building varied from 2 to 31, with a median of 6 detectors per building, based on the building surfaces and the technical measurement requirements of the norms in force in Romania. Detectors were placed on multiple stories, but the vast majority were on the ground floor.
After the exposure period, the processing, reading, and computation of the annual mean value of RACs, using temporal correction factors, were conducted in LiRaCC. The work protocol used for integrated radon measurements has been described in detail elsewhere [14,16].
Additional investigation
The measurements undertaken were in accordance with the ISO 11665-8:2019 standard and the specific procedures used by LiRaCC [17]. The additional measurements were focused, but not limited, on rooms where the RAC exceeded 300 Bq/m3 but also on the neighboring rooms. In total, additional measurements were taken in 178 rooms from the 41 buildings.
These investigations required the collection of further information such as building characteristics (the layout and construction style) and the occupancy level, but it also meant taking more measurements inside and outside of the buildings. A brief description of all investigations carried out is given below.
Building mapping
Mapping provides a snapshot of the RAC in the building and is based on the long-term, integrated measurements as well as on building characteristics. For this stage of the investigation, appropriate technical drawings and building characteristics are important as they provide crucial information to the LiRaCC research team.
At this stage, the investigation plan was established, including the locations where continuous and spot monitoring devices were installed.
To pinpoint radon sources and entry points, one or more of the measurement methods listed below were used. The selection of measurement techniques and the frequency of planned measurements varied depending on the specific circumstances at hand.
Continuous radon measurement
Continuous radon measurements provide an image of the time variations of the RAC in the studied rooms. International standards and protocols recommend these measurements cover at least one day and one night of occupancy [18]. The median duration for the measuring period in the 178 examined rooms was 7 days, with 5 days of regular occupation and 2 days of accumulation, primarily occurring over the weekend. Measurements under normal conditions of occupancy gave an insight into the influence of the anthropogenic factor on RACs, while testing for accumulation gave insights into potential entry paths and transfer between rooms. These measurements were carried out with Sarad Radon Scout radon monitor, Sarad GmbH, Dresden, Germany.
Measurement of air leakages in cracks and ducts
This type of measurement complements continuous monitoring and can swiftly confirm or refute suspicions regarding radon leakages and infiltration in the room.
The most utilized method for measuring the RAC in the air near visible cracks is spot measurement. This involves collecting air samples from potential radon sources like visible cracks in the slab, the interface between the floor and walls or at pipe openings. Measurements from cracks were performed in 225 rooms. Determinations were carried out according to the ISO 11665-6:2020 standard, using an RM-2 Radon detector from Radon v.o.s, Praha, Czech Republic [19].
Estimating the exhalation rate of radon from the surface
The exhalation rate from the surface allows the quantification of radon emitted by a given surface per unit of time. This method involves placing a special device called a “radon chamber” on the surface in question and measuring the rate at which radon is exhaled [20]. In total, it was applied in 37 rooms, using an RTM 1688-2—Radon and thoron monitor, Sarad GmbH, Dresden, Germany and a Rad7 Radon Detector, Durridge, MA, USA.
Radon in soil
The assessment of radon potential in the soil is the only measurement conducted outside the building. LiRaCC employs Neznal’s method [21] and an RM-2 device in conjunction with a Radon Jok for permeability. The radon potential (RP) was converted into the radon index (RI), which quantifies the level of radon risk associated with the bedrock. Neznal et al. [21] developed a classification of the RI based on the RP of the building site, as outlined below: the value of the RI is considered low when the RP is less than 10. It is classified as medium when the RP is between 10 and 35, and it is considered high when the RP is greater than 35. The method and the equipment were widely used in studies and extensively described elsewhere [22]. Overall, measurements of radon concentrations in soil were performed in 37 out of the 41 buildings. For 4 buildings, the presence of snow and the frozen soil did not allow measurements to be taken. In cases where limited free soil was available around the building perimeter, adjustments were made to reduce the number of probing points for radon. Recent studies have demonstrated that this reduction in probing points can be implemented without substantially impacting the accuracy of radon potential computation [23].
Meteorological factors
Meteorological conditions (temperature, humidity, atmospheric pressure, precipitation and wind speed) were collected from the stations in Cluj–Napoca and Constanța for all the periods in which the additional investigations were performed. The data was used in the statistical analysis of the results to evaluate the degree of association between RACs and meteorological conditions.
Statistical analysis of data
For the statistical analysis, IBM SPSS 24 (IBM Corp., Armonk, NY, USA) and OriginPro 2024 (OriginLab Corporation, Northampton, MA, USA) software were used. The normality of the data distribution was evaluated using the Shapiro–Wilk test. When the data distribution was log-normal, parametric statistical tests were applied to the log-transformed data. Alternatively, non-parametric statistical tests were used, namely the Mann–Whitney (MW) test for comparing two samples and the Kruskal–Wallis (KW) test for comparing three or more samples. A two-way ANOVA test was employed to evaluate the effect of two independent factors on RACs. The degree of association between variables was assessed using Spearman’s correlation coefficient. The level of agreement between the two methods was evaluated using Lin’s concordance correlation coefficient. Multivariate data analysis was performed using the log-transformed values for RACs as the dependent variable and the monitored physical and meteorological factors as independent variables. The Stepwise method was selected, retaining variables in the model that had a significant influence (p < α) on the dependent variable. The significance level α was set at 0.05.

3. Results

3.1. Initial Investigation Using Long-Term Integrated Measurements

Table 1 presents the statistical analysis of the annual radon activity concentration (ARAC) according to the building level of the monitored rooms. The ARAC was determined using the integrated data obtained from CR-39 nuclear track detectors, with the application of seasonal correction factors as stipulated by the current national regulations. Among the 343 monitored rooms, 71% were situated at the ground level, approximately one quarter were on the first floor, while only 10 rooms were monitored in the basement. The overall analysis of the monitored rooms shows ARAC values ranging from 14 to 1495 Bq/m3, with an arithmetic mean of 251 Bq/m3, a median of 168 Bq/m3, and a geometric mean of 172 Bq/m3. The percentage of rooms where the ARAC exceeds the reference level is 29%. The central tendency indicators of the ARAC are significantly higher compared to the national average reported by Cosma et al. [24] for residential buildings (AM = 126 Bq/m3 and GM = 84 Bq/m3). The reason for this significant difference, in addition to the type of the investigated building, is that the constructions included in the present study were specifically chosen based on the criterion that they have at least one room with an ARAC exceeding the RL.
An increase in the floor level of the analyzed rooms is associated with a decrease in the ARAC. The measurements made in the basement yielded a geometric mean of 342 Bq/m3, a value of 212 Bq/m3 being computed for the ground floor, while on the first floor the geometric value dropped to 89 Bq/m3. When data were analyzed globally, they did not follow a log-normal distribution, being at the significance threshold (p = 0.046). However, when data were analyzed according to the building level, a log-normal distribution was obtained only for measurements made on the first floor (p = 0.12). The MW statistical test was employed to compare the data collected at the ground level and on the first floor. The radon measurements carried out in the basement were neglected due to the small number (10). The median ARAC value at the ground level was significantly higher than that on the first floor (p < 0.001). Ivanova et al. reported a comparable decrease in the RAC as the floor level increased in their study, which aimed to monitor the RAC in 331 rooms from 16 schools in Bulgaria [11].
Table 2 shows the statistical analysis of ARACs categorized by the room type. Out of the total 343 detectors, around one-third were mounted in classrooms, 27% in administrative rooms (offices, secretariats, and staff rooms), 14% in laboratories (informatics, chemistry, physics, engineering, and biology), and 28% in other types of rooms (technical spaces, kitchens, storage rooms, sports halls, etc.). The highest ARAC was recorded in a classroom (1495 Bq/m3). In fact, the arithmetic mean (326 Bq/m3), geometric mean (224 Bq/m3), and median (257 Bq/m3) values were greatest for classrooms compared to the other types of investigated rooms. A statistically significant difference was observed between the medians of ARACs according to the room type (K = 19.27, p < 0.001). The results of Dunn’s test revealed that classrooms had considerably higher values compared to administrative rooms (p = 0.02) and the other types of rooms (p < 0.01). The predominant type of flooring in the examined rooms is parquet. For laboratory-type rooms, particularly those used for chemistry and physics, in addition to parquet flooring, tile or tarkett flooring options are also observed. The flooring in kitchens consists of tiles. The absence of a notable disparity in floor types according to the room destination suggests that the discrepancy in ARACs between classrooms and administrative rooms is most likely attributable to variations in occupancy schedules and ventilation practices.
The impact of room types and floor levels on RACs was analyzed using a two-way ANOVA test. The overall effect is significant (p < 0.001), attributable to the effect of the room type (p < 0.01), the floor level (p < 0.001), and the interaction between the room type and the floor level (p = 0.02) (Figure 1).

3.2. Additional Investigation

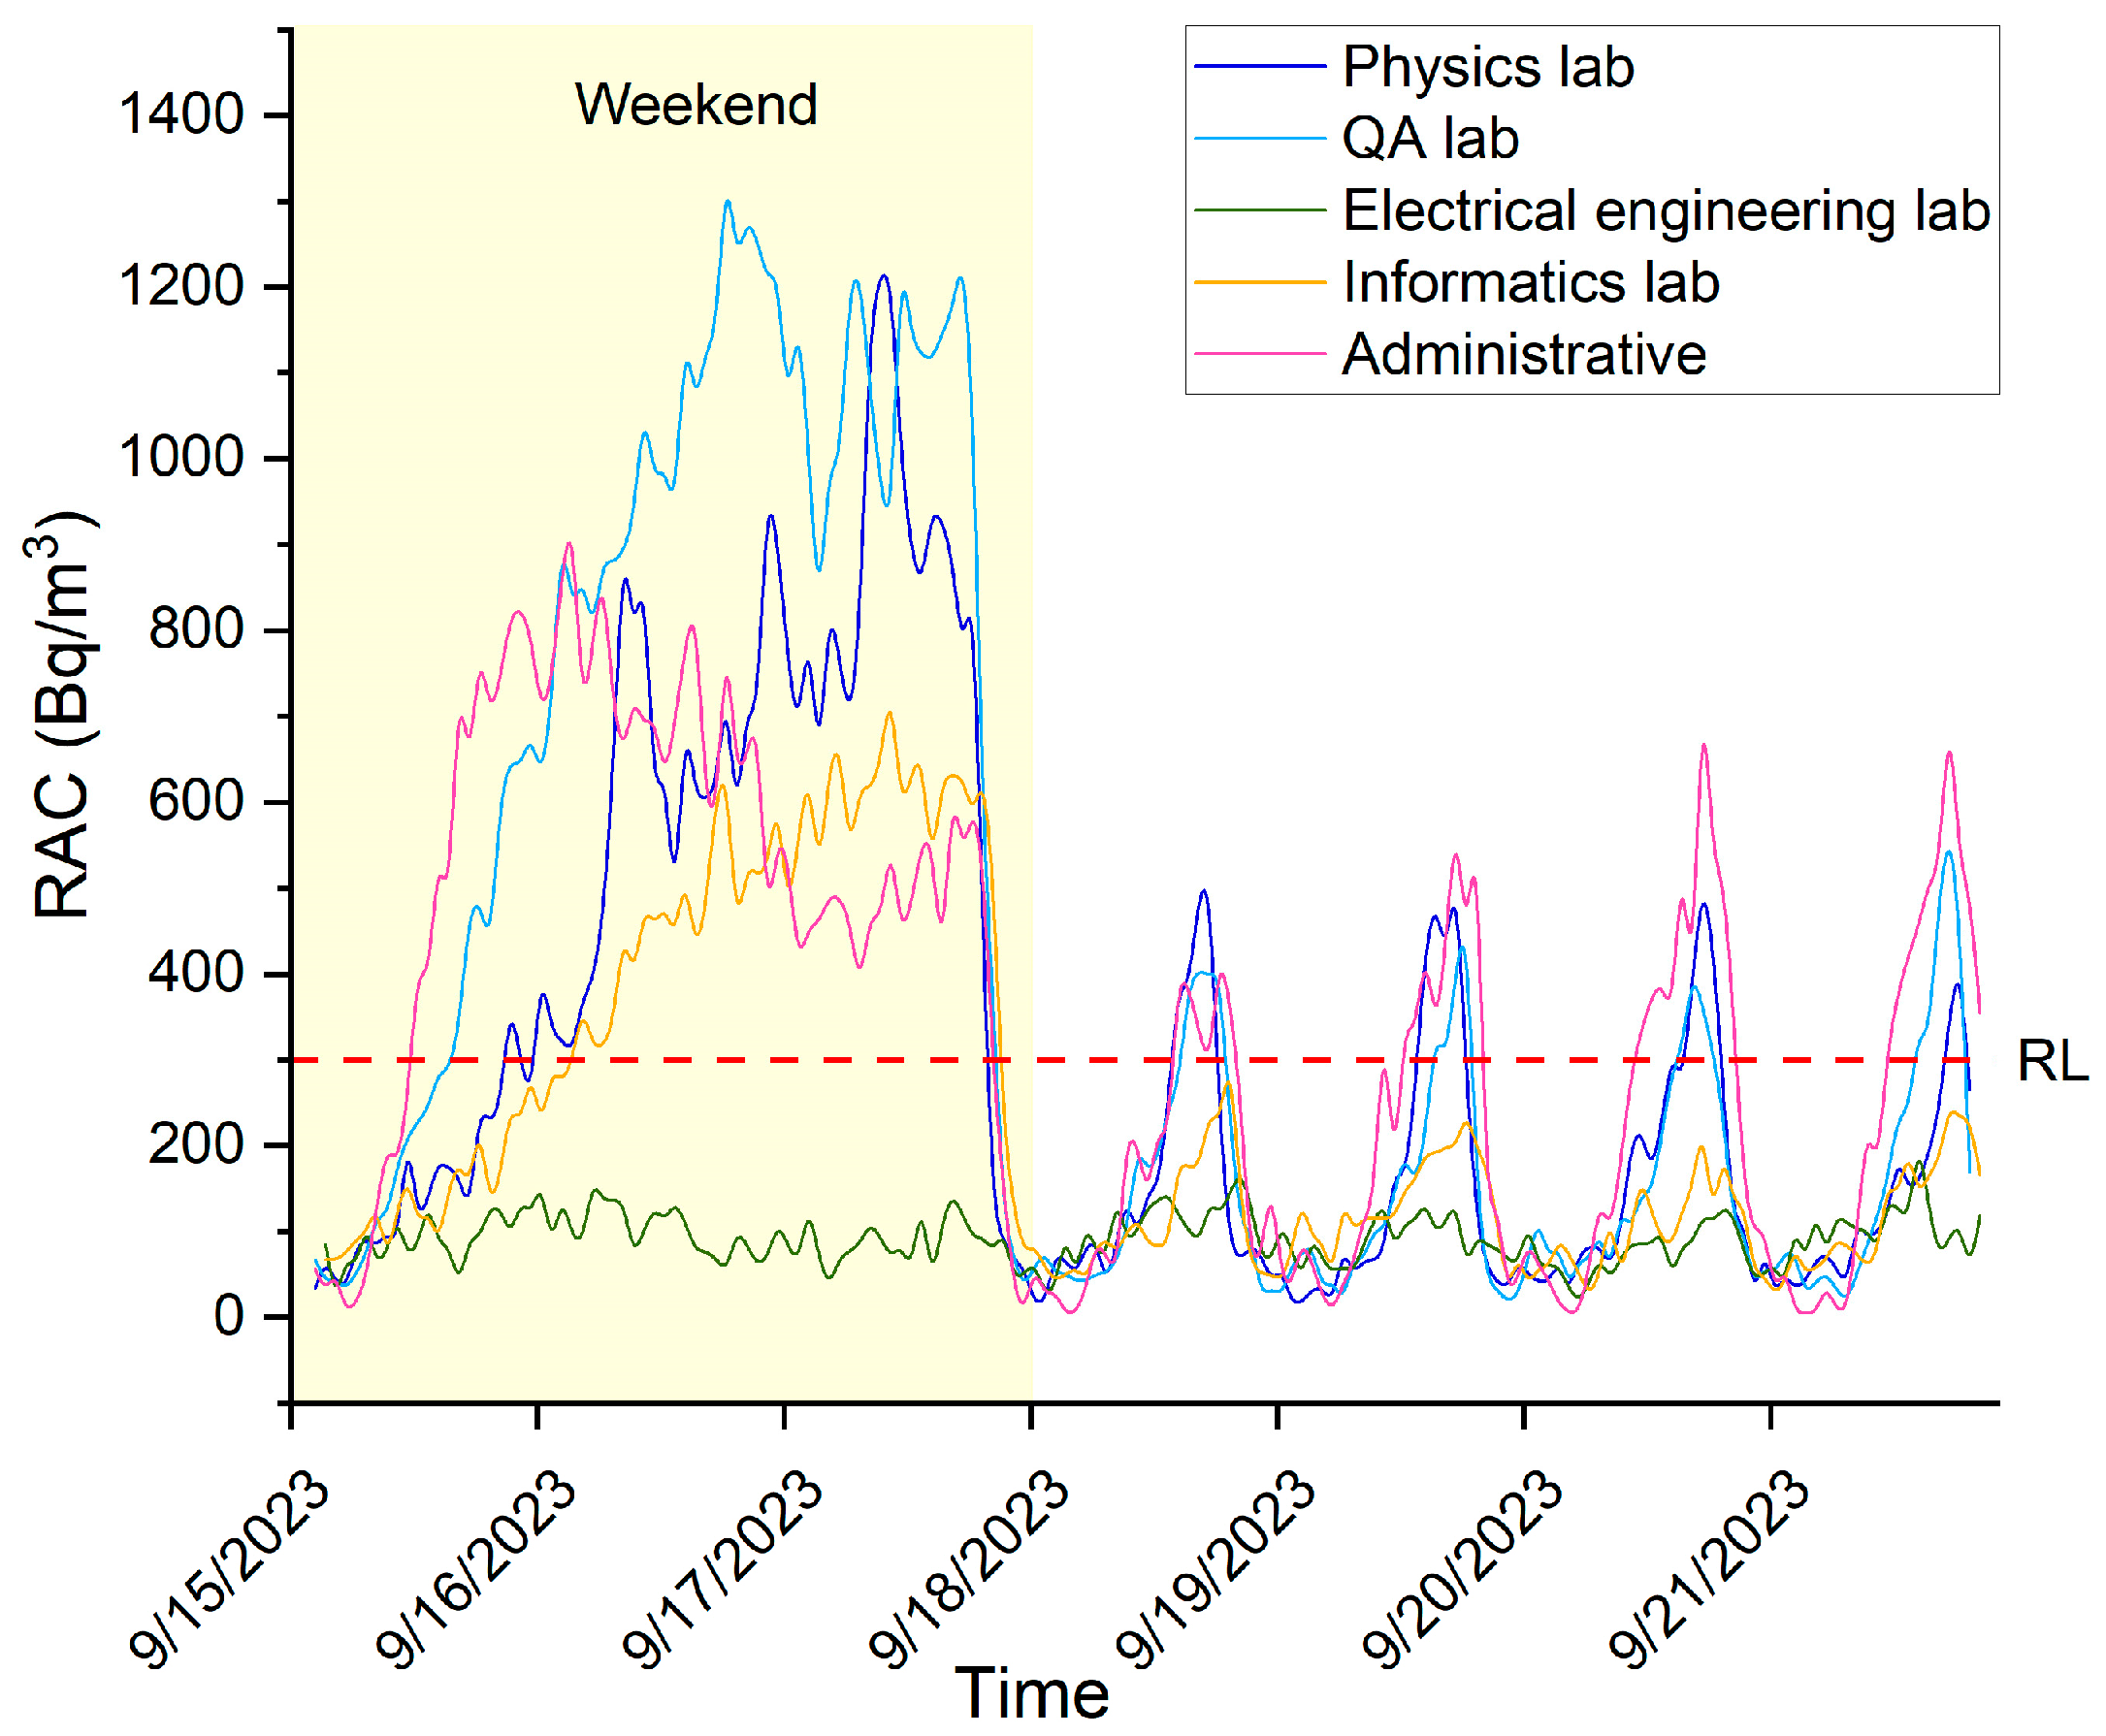
As a result of the findings obtained through long-term, integrated measurements, further measurements were conducted to identify the source and entry routes of radon into indoor spaces. In this regard, 178 rooms were monitored using continuous measurements, some of which were previously measured using CR-39 detectors (134 rooms), while the rest were investigated due to high occupancy factors and to evaluate the spatial distribution of radon within the building. The duration of the measuring period varied from 4 to 14 days, with a median of 7 days. The majority of the buildings under investigation (70%) had a measurement period between 6 and 8 days. Throughout the measuring period, an attempt was made to capture both the day-to-day activities and the accumulation that occurred over the weekend. A typical example of RAC variation in the monitored rooms with the continuous measurement method is shown in Figure 2. An increase in radon levels can be detected over the weekend, with average values ranging from one to five times greater than those found during the workdays, depending on the specific room being monitored. The variations observed in RAC measurements at the room level can mostly be attributable to the flooring type, with tiles in the electrical engineering laboratory and laminate flooring with significant degradation in the other monitoring rooms.
Table 3 displays the descriptive statistics of the RAC based on the measurement method for the 134 rooms. These rooms had long-term, integrated measurements during the initial investigation and continuous measurements during the additional investigation.
When analyzing measurements performed over several days using the continuous measurement method and measurements over several months with CR-39 detectors, the integrated method consistently produces higher RAC levels (AM = 425 Bq/m3) compared to the continuous method (AM = 377 Bq/m3), with a statistically significant difference (p < 0.001). The Relative Percent Difference (RPD) between measurements from the two methods had an average of 36%, ranging from 0.3% to 144%. Both the Pearson correlation coefficient (r = 0.71, p < 0.01) and Spearman’s rank correlation coefficient (rS = 0.63, p < 0.01) indicate a moderate level of association between the two methods. Similarly, a value of 0.69 was obtained for Lin’s concordance correlation coefficient (CCC), suggesting a poor agreement between the results provided by the two methods. When the measured concentrations are transformed into binary values form relative to the RL, although McNemar’s test did not reveal a significant difference (p = 0.09) in how RACs are labeled into one of the two categories (below or above the RL) based on the measurement method, approximately 25% of the measurements are placed in the wrong category. Among these, 34% overestimate exposure, while 66% underestimate exposure in comparison with the integrated method.
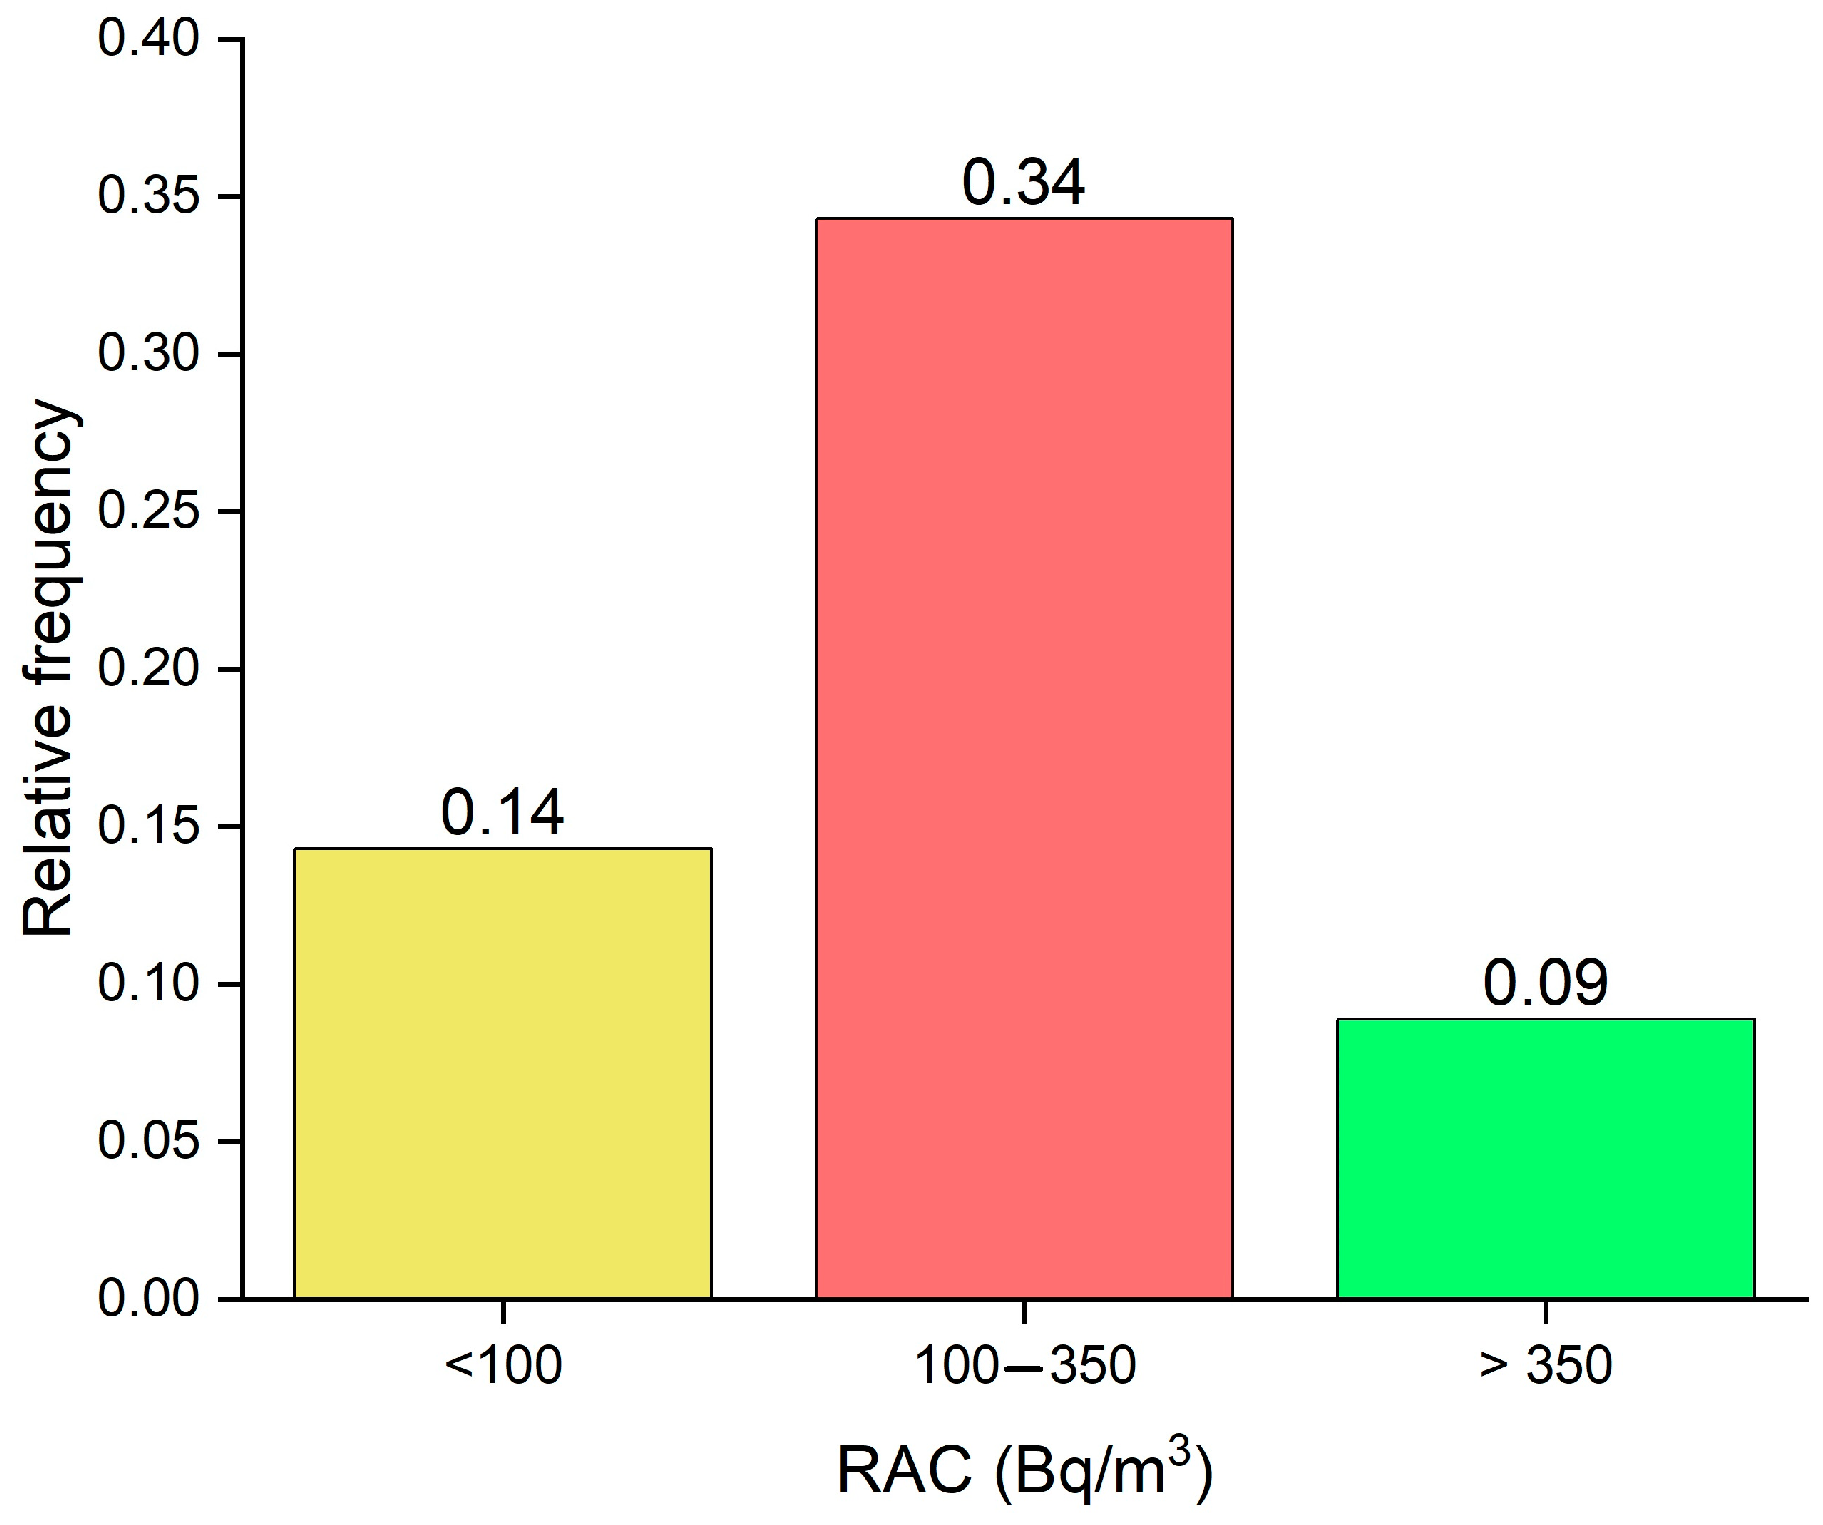
From the perspective of incorrect labeling relative to the RL based on RACs measured with the continuous method, 14% of classifications are inaccurate for RACs below 100 Bq/m3. For concentrations above 350 Bq/m3, the percentage of the incorrect classifications is less than 10%. For the 100–350 Bq/m3 RAC class, 24 out of 70 measurements (34%) were incorrectly labeled concerning the RL (Figure 3).
To evaluate the routes by which radon enters indoor spaces, a total of 225 radon samples were collected from identified floor cracks and leakages and from the area between the floor and walls. Additionally, 37 measurements were conducted to assess the exhalation rate. The data shown in Table 4 reveal a high dispersion (0.2 to 35.6 kBq/m3) of the results obtained for the leakage measurements, with an overall average value of 2.7 kBq/m3. There was also significant variability in the exhalation rate, with an arithmetic mean of 29.63 Bq/m2·h and values ranging from 0.2 to 143.8 Bq/m2·h. The mean values for both RACs in leakages and the exhalation rate are comparable to those documented by Sferle et al. in a study investigating a residential complex involving six houses [25].
The computation of Spearman’s correlation coefficient indicates a weak association between the indoor RAC measured with continuous methods and radon from leakage (rS = 0.25, p < 0.01, n = 146) and an acceptable one with the exhalation rate (rS = 0.38, p = 0.02, n = 36). A moderate correlation (rS = 0.55, p < 0.01, n = 36) was identified between radon from leakage and the exhalation rate from the floor. The moderate correlation between radon levels in cracks and the exhalation rate can be explained by the fact that the exhalation measurement was generally conducted above visible cracks. This measurement primarily indicates the amount of radon that seeps into the interior space from the soil, rather than the material composition of the floor.
Measurements of radon from the gas sample extracted from soil, as well as permeability in soil gas were conducted for 90% (37) of the buildings under investigation. Table 5 displays the descriptive data for RACs in these samples, alongside the radon potential.
The RAC in soil gas showed an average value of 25.9 kBq/m3 with limits ranging between 5.5 and 83.9 kBq/m3. The measured values, associated with soil permeability, led to RP values ranging from 5 to 75. Therefore, 81% (30) of the analyzed lands exhibited a medium radon index, while 14% (5) showed a high radon index, and 5% (2) had a low radon index. The correlation study revealed no statistically significant relationships between radon in soil gas or RP and the exhalation rate from the floor or radon from leakages. There was no notable link seen between the indoor RAC and either radon in soil or RP.
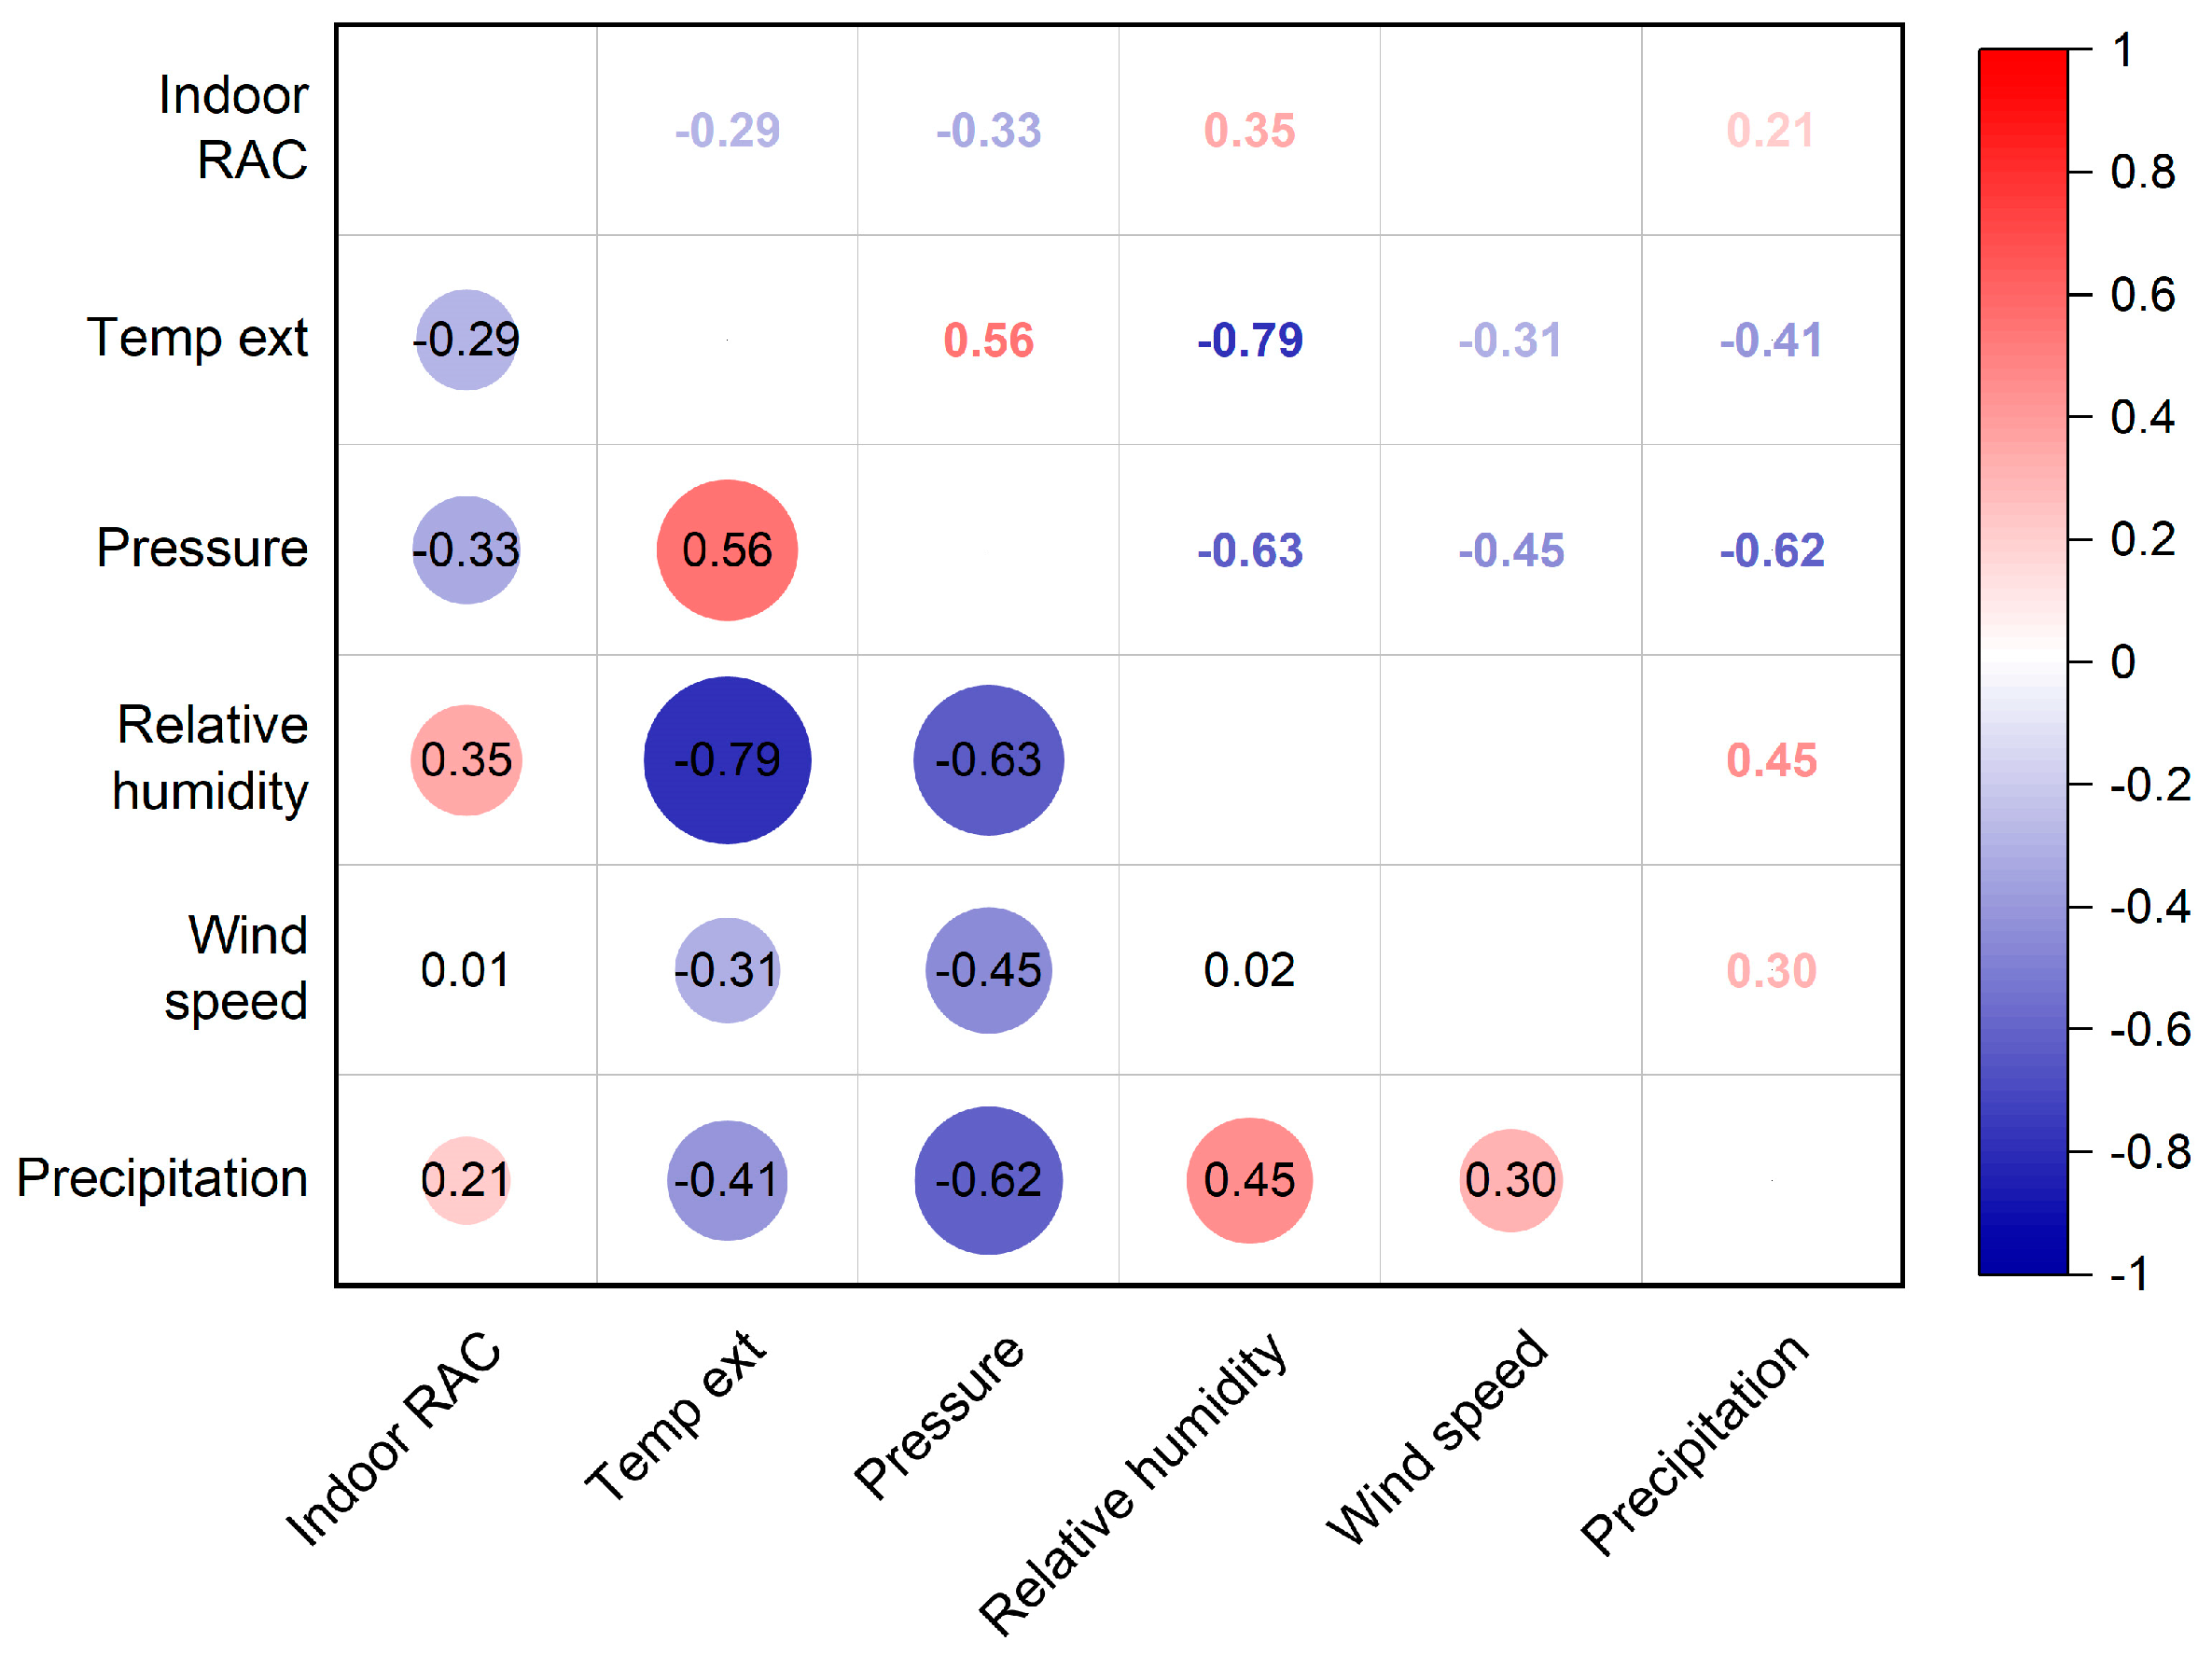
A significant negative correlation was found between the indoor RAC and the outside temperature (rS = −0.29, p < 0.01) as well as with atmospheric pressure (rS = −0.33, p < 0.001) (Figure 4). There was a weak positive correlation between indoor RAC and the amount of precipitation (rS = 0.21, p = 0.01) and a moderate positive correlation with the relative humidity (rS = 0.35, p < 0.001). The negative correlation of the indoor RAC with the outdoor temperature, respectively, atmospheric pressure can be linked to the influence these physical factors have on the radon exhalation from the soil. Therefore, as the outside temperature decreases and becomes lower than the temperature in the soil, it facilitates the movement of lighter air from the earth to the atmosphere, resulting in an increased exhalation rate. An increase in the exhalation rate, and consequently, the indoor RAC, may be attributed to a decrease in the atmospheric pressure, which facilitates the movement of air from the soil into the atmosphere [26]. A similar trend of a positive correlation with relative humidity and a negative correlation with the outdoor temperature was observed for radon levels monitored in 13 homes from Switzerland [13].
A multiple linear regression analysis was conducted utilizing log-transformed values for the RAC measured with the continuous method as the dependent variable and meteorological factors as well as radon in soil, RP, and radon from leakages as independent variables. The resulting model had an adjusted R2 value of 0.11. The variables included in the model were relative humidity (p = 0.02) and the amount of precipitation (p = 0.03). The VIF score of 1.23 suggests that there is no collinearity among the variables, while the Durbin–Watson test result of 1.76 indicates that the errors are independent. Through the analysis of the RAC in 13 Swiss homes, it was found that the outdoor temperature and atmospheric pressure were the main factors affecting the variations in RAC in both occupied and unoccupied spaces. Relative humidity, on the other hand, only played a significant role in the radon levels in the basement [13]. In contrast to the current investigation, the amount of precipitation did not exert a substantial influence on indoor radon levels. Several other studies have shown similar correlations regarding the impact of meteorological factors on the dynamics of RACs inside buildings [27,28].

4. Discussion

The main purpose of this study was to evaluate the radon distribution pattern in buildings located in two Romanian cities in order to better understand the spatial variability of RACs between or within buildings and among floors or rooms, depending on the most important influencing factors, like building characteristics, radon potential (RP) in soil, and meteorological factors.
Another important objective of this study was to improve the work protocol in cases where there is insufficient time to conduct investigations using long-term integrated measurements. With Romania anticipating significant reconstruction projects for public buildings, expediting the initial/additional investigations and proposing the radon mitigation solutions are crucial, but at the same time, it is imperative to uphold the regulatory standards.
The proposed changes to the protocol are based on the comparative analysis of both continuous and integrated measurements performed in the same spaces, focusing on the classification accuracy of RAC levels. These proposals for improving the radon measurement protocol are based on the experience gained through the parallel determination of the RAC in more than 130 rooms using the two measurement methods, described in Table 3.
This study aims to present an alternative solution for situations where a public building is undergoing renovation and lacks the minimum required 90-day period to conduct an integrated measurement. In these cases, an estimate of the range in which the RAC can be located can be extremely useful for public authorities and for builders in the preparation of the schedule of renovation works. However, we stress the importance of making the decision on radon mitigation based on long-term, integrated measurements, in accordance with national legislation, and only in those exceptional situations where the nature of the renovation works or the funding of these works do not allow for such long-term measurements, the recommendations from the present study are applicable.
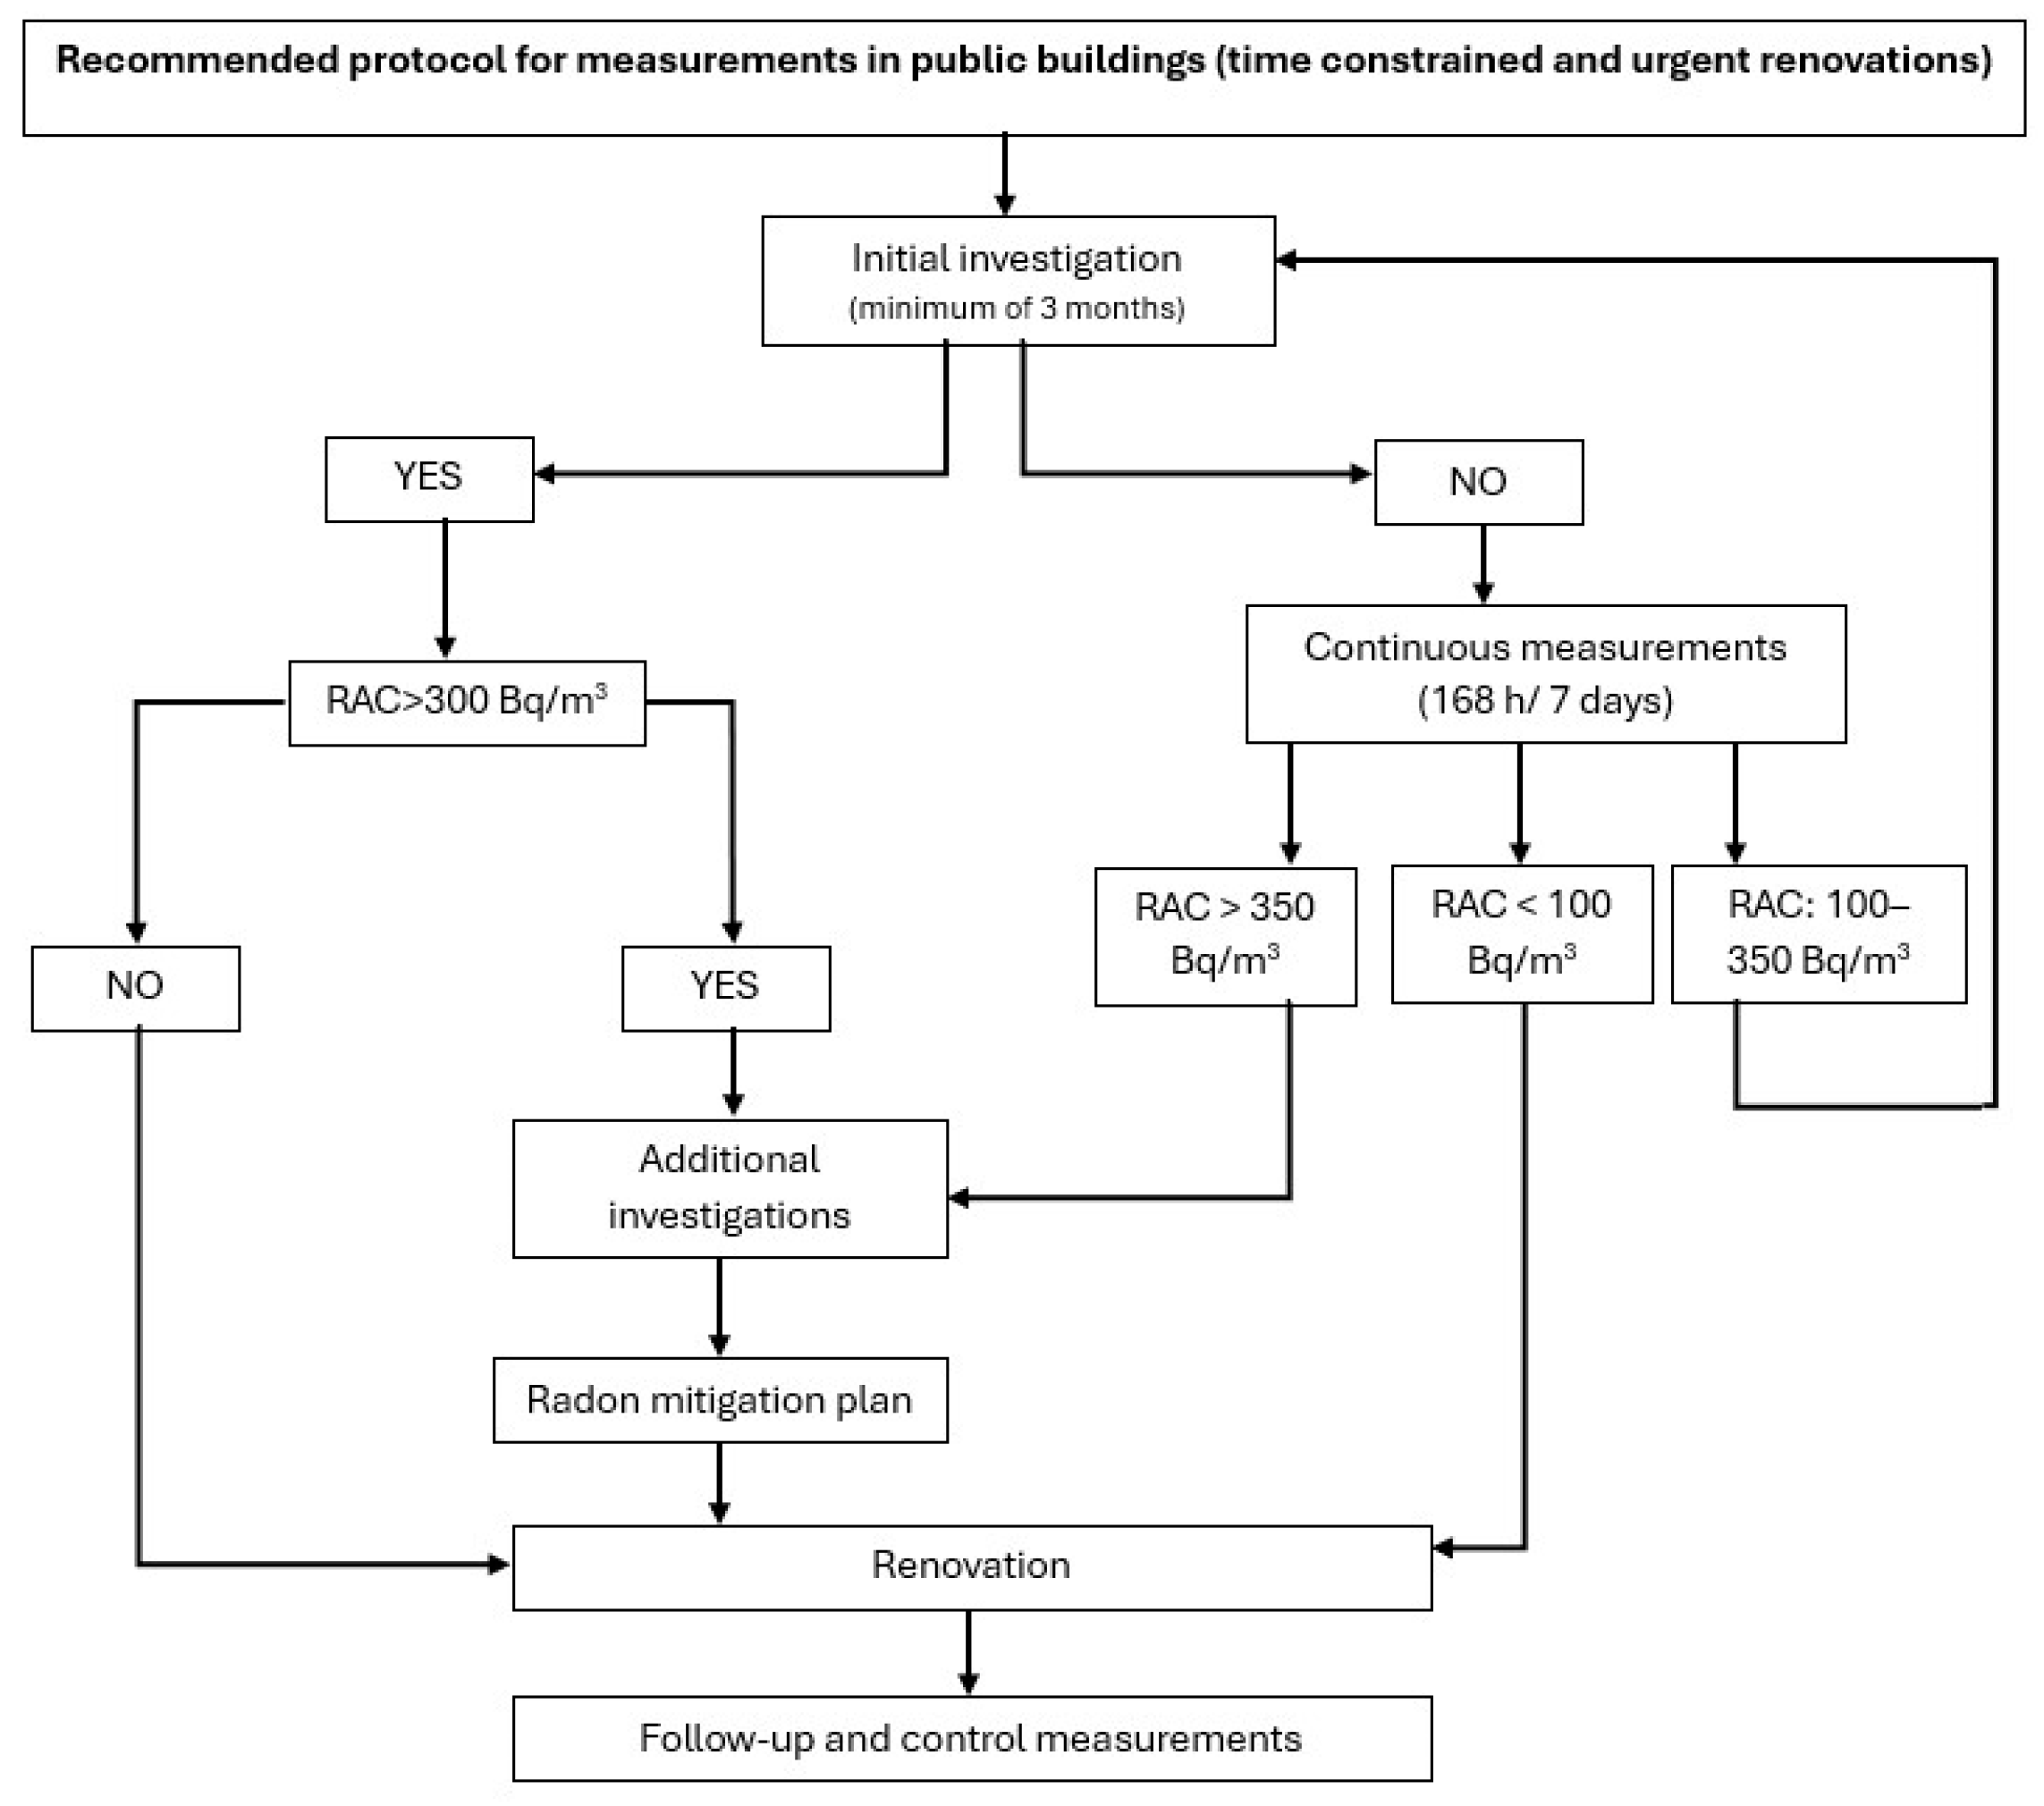
The recommendation is to perform continuous radon measurements in areas without existing screening measurements for a period of 168 h (7 days). Depending on the average RAC, it will be followed one of the suggested scenarios outlined below.
In cases where the RAC is below 100 Bq/m3, where the incorrect labeling in the present study was 14%, the suggestion is to forego additional measurements and proceed directly to post-renovation assessments once all the renovation works are completed. This scenario is ideal and is supported by recent legislative changes in Romania (technical guidelines) that often mandate structural changes to floors during renovations. These changes, made during renovations, can lead to a reduction in radon levels by closing off potential entry points. Additionally, many renovations now necessitate the installation of integrated ventilation systems.
Conversely, for values exceeding 350 Bq/m3, where the incorrect labeling was 9%, the recommendation is to adhere to the ISO 11655:8 [17] measurement protocols without performing integrated measurements, thereby saving time. In this case, the accredited laboratories have the responsibility to identify the main source of radon inside the building, the entry points of radon and ultimately propose the mitigation plan. After mitigation, measurements with the long-term, integrated method are mandatory.
When the RAC falls within the 100–350 Bq/m3 range, showcasing incorrect labeling of 34%, long-term, integrated measurements are mandatory.
Since 63 out of the 134 measurements conducted in this study fall <100 and >350 Bq/m3, applying this proposal involves conducting long-term, integrated measurements for only half of the targeted buildings. As such, by implementing these tailored approaches, a faster identification process can be carried out in public buildings regarding radon exposure, allowing for the implementation of radon remediation measures in the building renovation plan. Figure 5 shows the proposed protocol.

5. Conclusions

The objective of this study was to assess the indoor RAC in 41 educational buildings. This was undertaken by initial investigations with long-term measurements, as well as through additional investigations. Therefore, in the initial investigation, the impact of variables such as the floor level and room type on the RAC was examined. Rooms situated in the basement and on the ground floor were found to have high levels of radon. Among them, classrooms were particularly susceptible to increased radon exposure, probably due to inadequate ventilation.
As part of additional investigation, the building’s radon entrance points through leakage measures were identified, and the influence of the soil on the building using the radon index was examined. The lack of association between the RAC and RP, as well as the weak link with radon in cracks, suggests that there are numerous parameters involved in the generation, transport, and accumulation of this radioactive gas in indoor spaces. In this sense, the negative correlation of the indoor RAC with the outdoor temperature and atmospheric pressure, respectively, indicates the influence these factors have on the exhalation rate of radon from the soil and subsequently on the indoor RAC. However, the multiple linear regression led to a coefficient of determination of 11%, the relative humidity and the amount of precipitation being the only variables with a significant impact, kept in the model. Additional information related to the type and degree of ventilation, as well as the extension of the measurement period, could lead to the improvement of the prediction model. Although, from a scientific point of view, increasing the amount of data is intended to better comprehend the behavior of radon in big buildings, from a practical point of view, e.g., during the renovation works, there is a growing demand to shorten the measurement period or to take measurements in a different period of the year compared to the current legal recommendations. Another objective of the present study was to investigate the impact of adopting such a strategy, in which the measurements are of a short duration and aims to compare them with the long-term ones, based on which the ARAC was calculated. While the incorrect labeling regarding the RL was present in about 25% of cases, this finding does not fully support the hypothesis of the widespread adoption of this methodology. It is important to approach this information with caution, as the remediation plan requires not only accurate labeling in relation to the RL but also knowledge of the actual radon level. As such, the proposed solution is a compromise for those special situations in which either radon measurements are performed in a short time and a remedial solution is proposed, or this component will not be discussed in the remediation plan, therefore leaving radon to be treated separately within other interventions on the building at some point in the future—until then, children and teaching and auxiliary staff are likely to be exposed to high radon concentrations.
The results and the main findings will be integrated into recommendations addressed to the authorities in Romania as a basis to guide future efforts to optimize the management of radon mitigation in buildings and to reduce the population’s exposure.

Author Contributions

Conceptualization, G.-C.D.; data curation G.-C.D. and T.D.; methodology, G.-C.D., M.-C.M. and T.D.; writing—original draft preparation G.-C.D., M.-C.M., T.D. and A.C.; writing—review and editing M.-C.M., T.D. and A.C.; investigation, G.-C.D., M.-C.M., T.D., A.C., Ș.F., A.-I.L. and A.-C.Ț.; statistical analysis, T.D. All authors have read and agreed to the published version of the manuscript.

Funding

This research was founded, for the preparation of the article (analysis and interpretation of the data and in the writing of the report), by a grant from the Ministry of Research, Innovation and Digitization, CNCS–UEFISCDI, project number PNIII- P1-1.1-TE-2021-0249, within PNCDI III. This research was also founded by the project ID P_37_229, Contract No. 22/01 September 2016, with the title “Smart Systems for Public Safety through Control and Mitigation of Residential Radon linked with Energy Efficiency Optimization of Buildings in Romanian Major Urban Agglomerations SMART-RAD-EN” of the POC Program in study design.

Institutional Review Board Statement

The study did not require ethical approval.

Informed Consent Statement

Not applicable.

Data Availability Statement

The raw data supporting the conclusions of this article will be made available by the authors on request. The data are not publicly available due to privacy.

Conflicts of Interest

The authors declare no conflicts of interest. Ștefan, Florică is employee of S.C. RADON CONTROL S.A. The company had no roles in the design of the study; in the collection, analysis, or interpretation of data; in the writing of the manuscript, or in the decision to publish the articles. The paper reflects the views of the scientists and not the company.

References

  1. Kapdan, E.; Altinsoy, N. A comparative study of indoor radon concentrations between dwellings and schools. Radiat. Phys. Chem. 2012, 81, 383–386. [Google Scholar] [CrossRef]
  2. Čeliković, I.; Pantelić, G.; Vukanac, I.; Krneta Nikolić, J.; Živanović, M.; Cinelli, G.; Gruber, V.; Baumann, S.; Quindos Poncela, L.S.; Rabago, D. Outdoor Radon as a Tool to Estimate Radon Priority Areas—A Literature Overview. Int. J. Environ. Res. Public Health 2022, 19, 662. [Google Scholar] [CrossRef] [PubMed]
  3. IARC. Man-Made Mineral Fibres and Radon. In IARC Monographs on the Evaluation of the Carcinogenic Risks to Humans; IARC: Lyon, France, 1988; Volume 43, ISBN 978-92-832-1243-0. [Google Scholar]
  4. The Council of the European Union. Council Directive 2013/59/Euratom of 5 December 2013 laying down basic safety standards for protection against the dangers arising from exposure to ionising radiation, and repealing Directives 89/618/Euratom, 90/641/Euratom, 96/29/Euratom, 97/43/Euratom and 2003/122/Euratom. Off. J. Eur. Union 2014, 1–73. [Google Scholar]
  5. ICRP. Lung Cancer Risk from Radon and Progeny and Statement on Radon; ICRP Publication: Ottawa, Canada, 2010. [Google Scholar]
  6. Gordon, K.; Terry, P.D.; Liu, X.; Harris, T.; Vowell, D.; Yard, B.; Chen, J. Radon in Schools: A Brief Review of State Laws and Regulations in the United States. Int. J. Environ. Res. Public Health 2018, 15, 2149. [Google Scholar] [CrossRef] [PubMed]
  7. Bican-Brișan, N.; Dobrei, G.-C.; Burghele, B.-D.; Cucoș, A.-L. First Steps towards a National Approach for Radon Survey in Romanian Schools. Atmosphere 2021, 13, 59. [Google Scholar] [CrossRef]
  8. Trevisi, R.; Leonardi, F.; Buresti, G.; Cianfriglia, M.; Cinelli, G.; Gruber, V.; Heinrich, T.; Holmgren, O.; Salvi, F.; Seri, E.; et al. Radon levels in dwellings and workplaces: A comparison with data from some European countries. J. Eur. Radon Assoc. 2022, 3, 1–13. [Google Scholar] [CrossRef]
  9. Carpentieri, C.; Zunic, Z.S.; Carelli, V.; Cordedda, C.; Ferrigno, G.; Veselinovic, N.; Bossew, P.; Tollefsen, T.; Cuknic, O.; Vojinovic, Z.; et al. Assessment of long-term radon concentration measurement precision in field conditions (Serbian Schools) for a survey carried out by an international collaboration. Radiat. Prot. Dosim. 2011, 145, 305–311. [Google Scholar] [CrossRef] [PubMed]
  10. Bochicchio, F.; Žunić, Z.S.; Carpentieri, C.; Antignani, S.; Venoso, G.; Carelli, V.; Cordedda, C.; Veselinović, N.; Tollefsen, T.; Bossew, P. Radon in indoor air of primary schools: A systematic survey to evaluate factors affecting radon concentration levels and their variability. Indoor Air 2014, 24, 315–326. [Google Scholar] [CrossRef] [PubMed]
  11. Ivanova, K.; Stojanovska, Z.; Tsenova, M.; Badulin, V.; Kunovska, B. Measurement of indoor radon concentration in kindergartens in Sofia, Bulgaria. Radiat. Prot. Dosim. 2014, 162, 163–166. [Google Scholar] [CrossRef] [PubMed]
  12. CNCAN. Order of the President of CNCAN No. 153/ 27.07.2023, May 2023. Available online: http://www.cncan.ro/assets/Radon/2023/Ordin-153-din-2023-Metodologie-radon.pdf (accessed on 13 June 2024).
  13. Rey, J.F.; Goyette, S.; Pernot, J.G. Weather Impacts on Indoor Radon Short-Term Measurements in Switzerland. Atmosphere 2023, 14, 1163. [Google Scholar] [CrossRef]
  14. Dinu, A.C.; Cosma, C.; Dicu, T.; Begy, R.; Moldovan, M.; Papp, B.; Niţă, D.; Burghele, B.; Sainz, C. Thorough investigations on indoor radon in Bǎita radon-prone area (Romania). Sci. Total Environ. 2012, 431, 78–83. [Google Scholar] [CrossRef]
  15. MDLPA—RTC6 Guide. Available online: http://www.cncan.ro/assets/Radon/2023/Ghid-remediere-aprobat-prin-Ordinulnr.-220192023.pdf (accessed on 22 June 2024).
  16. Dinu, A.C.; Papp, B.; Dicu, T.; Moldovan, M.; Burghele, D.B.; Moraru, I.T.; Tenţer, A.; Cosma, C. Residential, soil and water radon surveys in north-western part of Romania. J. Environ. Radioact. 2017, 166, 412–416. [Google Scholar] [CrossRef]
  17. ISO 11665-8:2019; Measurement of Radioactivity in the Environment—Air: Radon-222—Part 8: Methodologies for Initial and Additional Investigations in Buildings. International Organization for Standardization: Geneva, Switzerland, 2019. Available online: https://www.iso.org/obp/ui/en/#iso:std:iso:11665:-8:ed-2:v1:en (accessed on 4 June 2024).
  18. ISO 11665-5:2020; Measurement of Radioactivity in the Environment—Air: Radon-222 Part 5: Continuous Measurement Methods of the Activity Concentration. International Organization for Standardization: Geneva, Switzerland, 2020.
  19. ISO 11665-6:2020; Measurement of Radioactivity in the Environment—Air: Radon-222 Part 6: Spot Measurement Methods of the Activity Concentration. International Organization for Standardization: Geneva, Switzerland, 2020.
  20. ISO 11665-7:2012; Measurement of Radioactivity in the Environment—Air: Radon-222 Part 7: Accumulation Method for Estimating Surface Exhalation Rate. International Organization for Standardization: Geneva, Switzerland, 2012.
  21. Neznal, M.; Neznal, M.; Matolin, M.; Barnet, I.; Miksova, J. The New Method for Assessing the Radon Risk of Building Sites; Czech Geological Survey: Praga, Czech Republic, 2004. [Google Scholar]
  22. Florică, Ş.; Burghele, B.D.; Bican-Brişan, N.; Begy, R.; Codrea, V.; Cucoş, A.; Catalina, T.; Dicu, T.; Dobrei, G.; Istrate, A.; et al. The path from geology to indoor radon. Environ. Geochem. Health 2020, 42, 2655–2665. [Google Scholar] [CrossRef] [PubMed]
  23. Lupulescu, A.; Baciu, C.; Dicu, T.; Burghele, B.-D.; Cucoș, A.L. Determining the Geogenic Radon Potential in Different Layouts and Numbers of Points. Atmosphere 2023, 14, 713. [Google Scholar] [CrossRef]
  24. Cosma, C.; Dinu, A.C.; Dicu, T. Preliminary results regarding the first map of residential radon in some regions in Romania. Radiat. Prot. Dosim. 2013, 155, 343–350. [Google Scholar] [CrossRef]
  25. Sferle, T.; Dobrei, G.; Dicu, T.; Burghele, B.D.; Brişan, N.; Cucoş, A.; Catalina, T.; Istrate, A.; Lupulescu, A.; Moldovan, M.; et al. Variation of Indoor Radon Concentration within a Residential Complex. Radiat. Prot. Dosim. 2020, 189, 279–285. [Google Scholar] [CrossRef] [PubMed]
  26. Cujic, M.; Janković Mandić, L.; Petrović, J.; Dragović, R.; Đorđević, M.; Đokić, M.; Dragović, S. Radon-222: Environmental behavior and impact to (human and non-human) biota. Int. J. Biometeorol. 2021, 65, 69–83. [Google Scholar] [CrossRef] [PubMed]
  27. García-Tobar, J. Weather-dependent modelling of the indoor radon concentration in two dwellings using CONTAM. Indoor Built Environ. 2019, 28, 1341–1349. [Google Scholar] [CrossRef]
  28. Spasić, D.; Gulan, L. High Indoor Radon Case Study: Influence of Meteorological Parameters and Indication of Radon Prone Area. Atmosphere 2022, 13, 2120. [Google Scholar] [CrossRef]
Figure 1. ARACs depending on the room type and floor level (the box is delimited by the first and the third quartiles, known as the interquartile range (IQR), and the median is shown by the line inside the box, while any values that are larger than 1.5× IQR are shown as dots, indicating outliers).
Atmosphere 15 01154 g001
Figure 2. The temporal variation of RACs depending on the monitored room in a high school. The yellow background indicates the weekend period, while the dash line represents the reference level (RL).
Atmosphere 15 01154 g002
Figure 3. The percentage of mislabeling obtained by continuous measurements compared to integrated measurements in relation to the RL.
Atmosphere 15 01154 g003
Figure 4. Correlation matrix between the indoor RAC and the meteorological factors monitored in the outdoor air.
Atmosphere 15 01154 g004
Figure 5. Recommended protocol for measurements in public buildings undergoing renovation when it is not possible to carry out integrated, long-term measurements due to time constraints.
Atmosphere 15 01154 g005
Table 1. Descriptive statistical analysis of the ARAC according to the building floor.
Floor LevelN*Min.A.M.S.D.Max.Mdn.G.M.G.S.D.% > RL
Basement10844472958924383422.360%
Ground floor2443329325114952422122.338%
First floor89141139774287892.03%
Total3431425123914951681722.429%
N*—Number of measurements, Min.—Minimum, A.M.—Arithmetic Mean, S.D.—Standard Deviation, Max.—Maximum, Mdn.—Median, G.M.—Geometric Mean, G.S.D.—Geometric Standard Deviation, % > RL—the percentage of radon measurements that exceed the reference level of 300 Bq/m3.
Table 2. Descriptive statistics of ARAC based on the room type.
Room TypeNMin.A.M.S.D.Max.Mdn.G.M.G.S.D.
Administrative932421320011991691592.1
Classroom1051432627014952572242.6
Laboratory493523418510511871772.2
Other961521424512471131352.5
N—Number of measurements, Min.—Minimum, A.M.—Arithmetic Mean, S.D.—Standard Deviation, Max.—Maximum, Mdn.—Median, G.M.—Geometric Mean, G.S.D.—Geometric Standard Deviation.
Table 3. Descriptive statistics for the 134 rooms in which the RAC was evaluated by both integrated and continuous measurements.
Measurement MethodMin.A.M.S.D.Max.Mdn.G.M.G.S.D.% > RL
Integrated4842526714953653561.864%
Continuous4337726515563173081.956%
Min.—Minimum, A.M.—Arithmetic Mean, S.D.—Standard Deviation, Max.—Maximum, Mdn.—Median, G.M.—Geometric Mean, G.S.D.—Geometric Standard Deviation, % > RL—the percentage of radon measurements that exceed the reference level of 300 Bq/m3.
Table 4. Identification of radon entry routes by leakage measurements and the exhalation rate from the floor.
Type of InvestigationNMin.A.M.S.D.Max.Mdn.G.M.G.S.D.
Leakage (kBq/m3)2250.22.73.035.62.01.92.2
Exhalation rate (Bq/mh)370.229.632.9143.820.016.43.9
N—Number of measurements, Min.—Minimum, A.M.—Arithmetic Mean, S.D.—Standard Deviation, Max.—Maximum, Mdn.—Median, G.M.—Geometric Mean, G.S.D.—Geometric Standard Deviation.
Table 5. Descriptive statistics regarding RACs in soil gas and radon potential (RP) for 37 buildings.
Type of InvestigationMin.A.M.S.D.Max.Mdn.G.M.G.S.D.
RAC in soil gas (kBq/m3)5.525.914.183.922.522.81.7
RP52414752221.41.7
Min.—Minimum, A.M.—Arithmetic Mean, S.D.—Standard Deviation, Max.—Maximum, Mdn.—Median, G.M.—Geometric Mean, G.S.D.—Geometric Standard Deviation.
Disclaimer/Publisher’s Note: The statements, opinions and data contained in all publications are solely those of the individual author(s) and contributor(s) and not of MDPI and/or the editor(s). MDPI and/or the editor(s) disclaim responsibility for any injury to people or property resulting from any ideas, methods, instructions or products referred to in the content.