


Analysis of the Meteorological Conditions and Atmospheric Numerical Simulation of an Aircraft Icing Accident

Abstract
1. Introduction
2. Data and Methods
2.1. Data
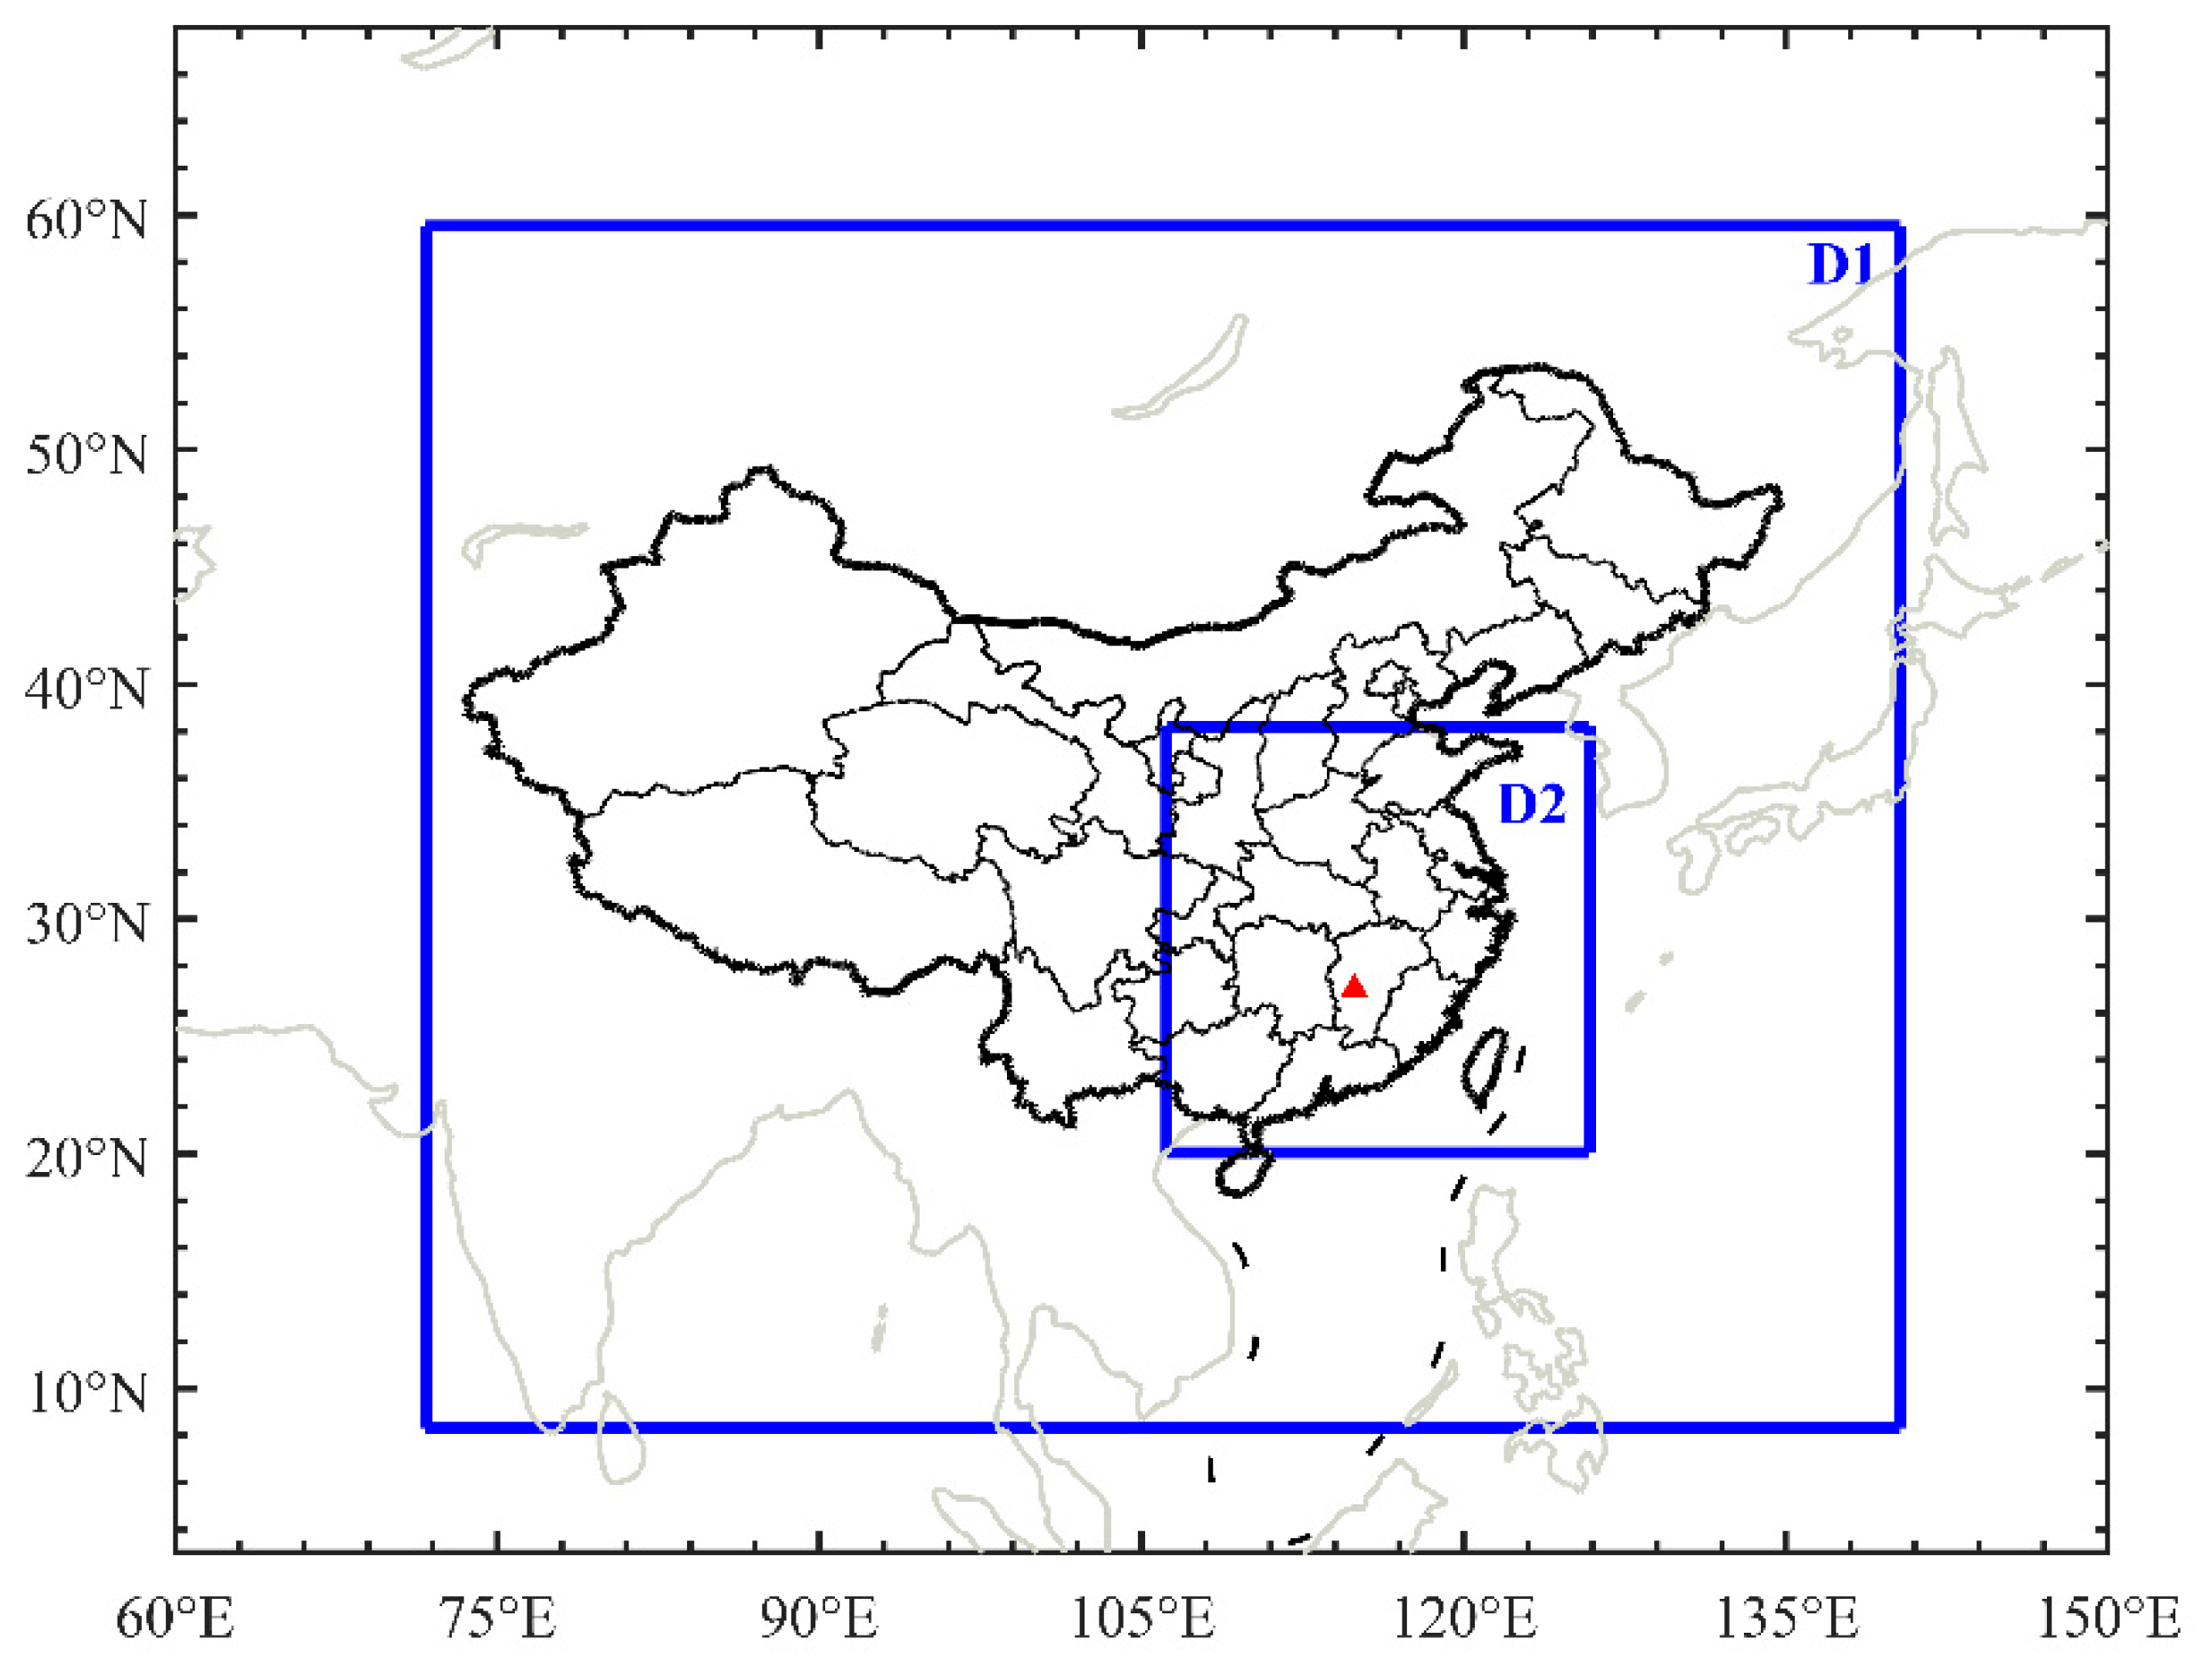
2.2. Model
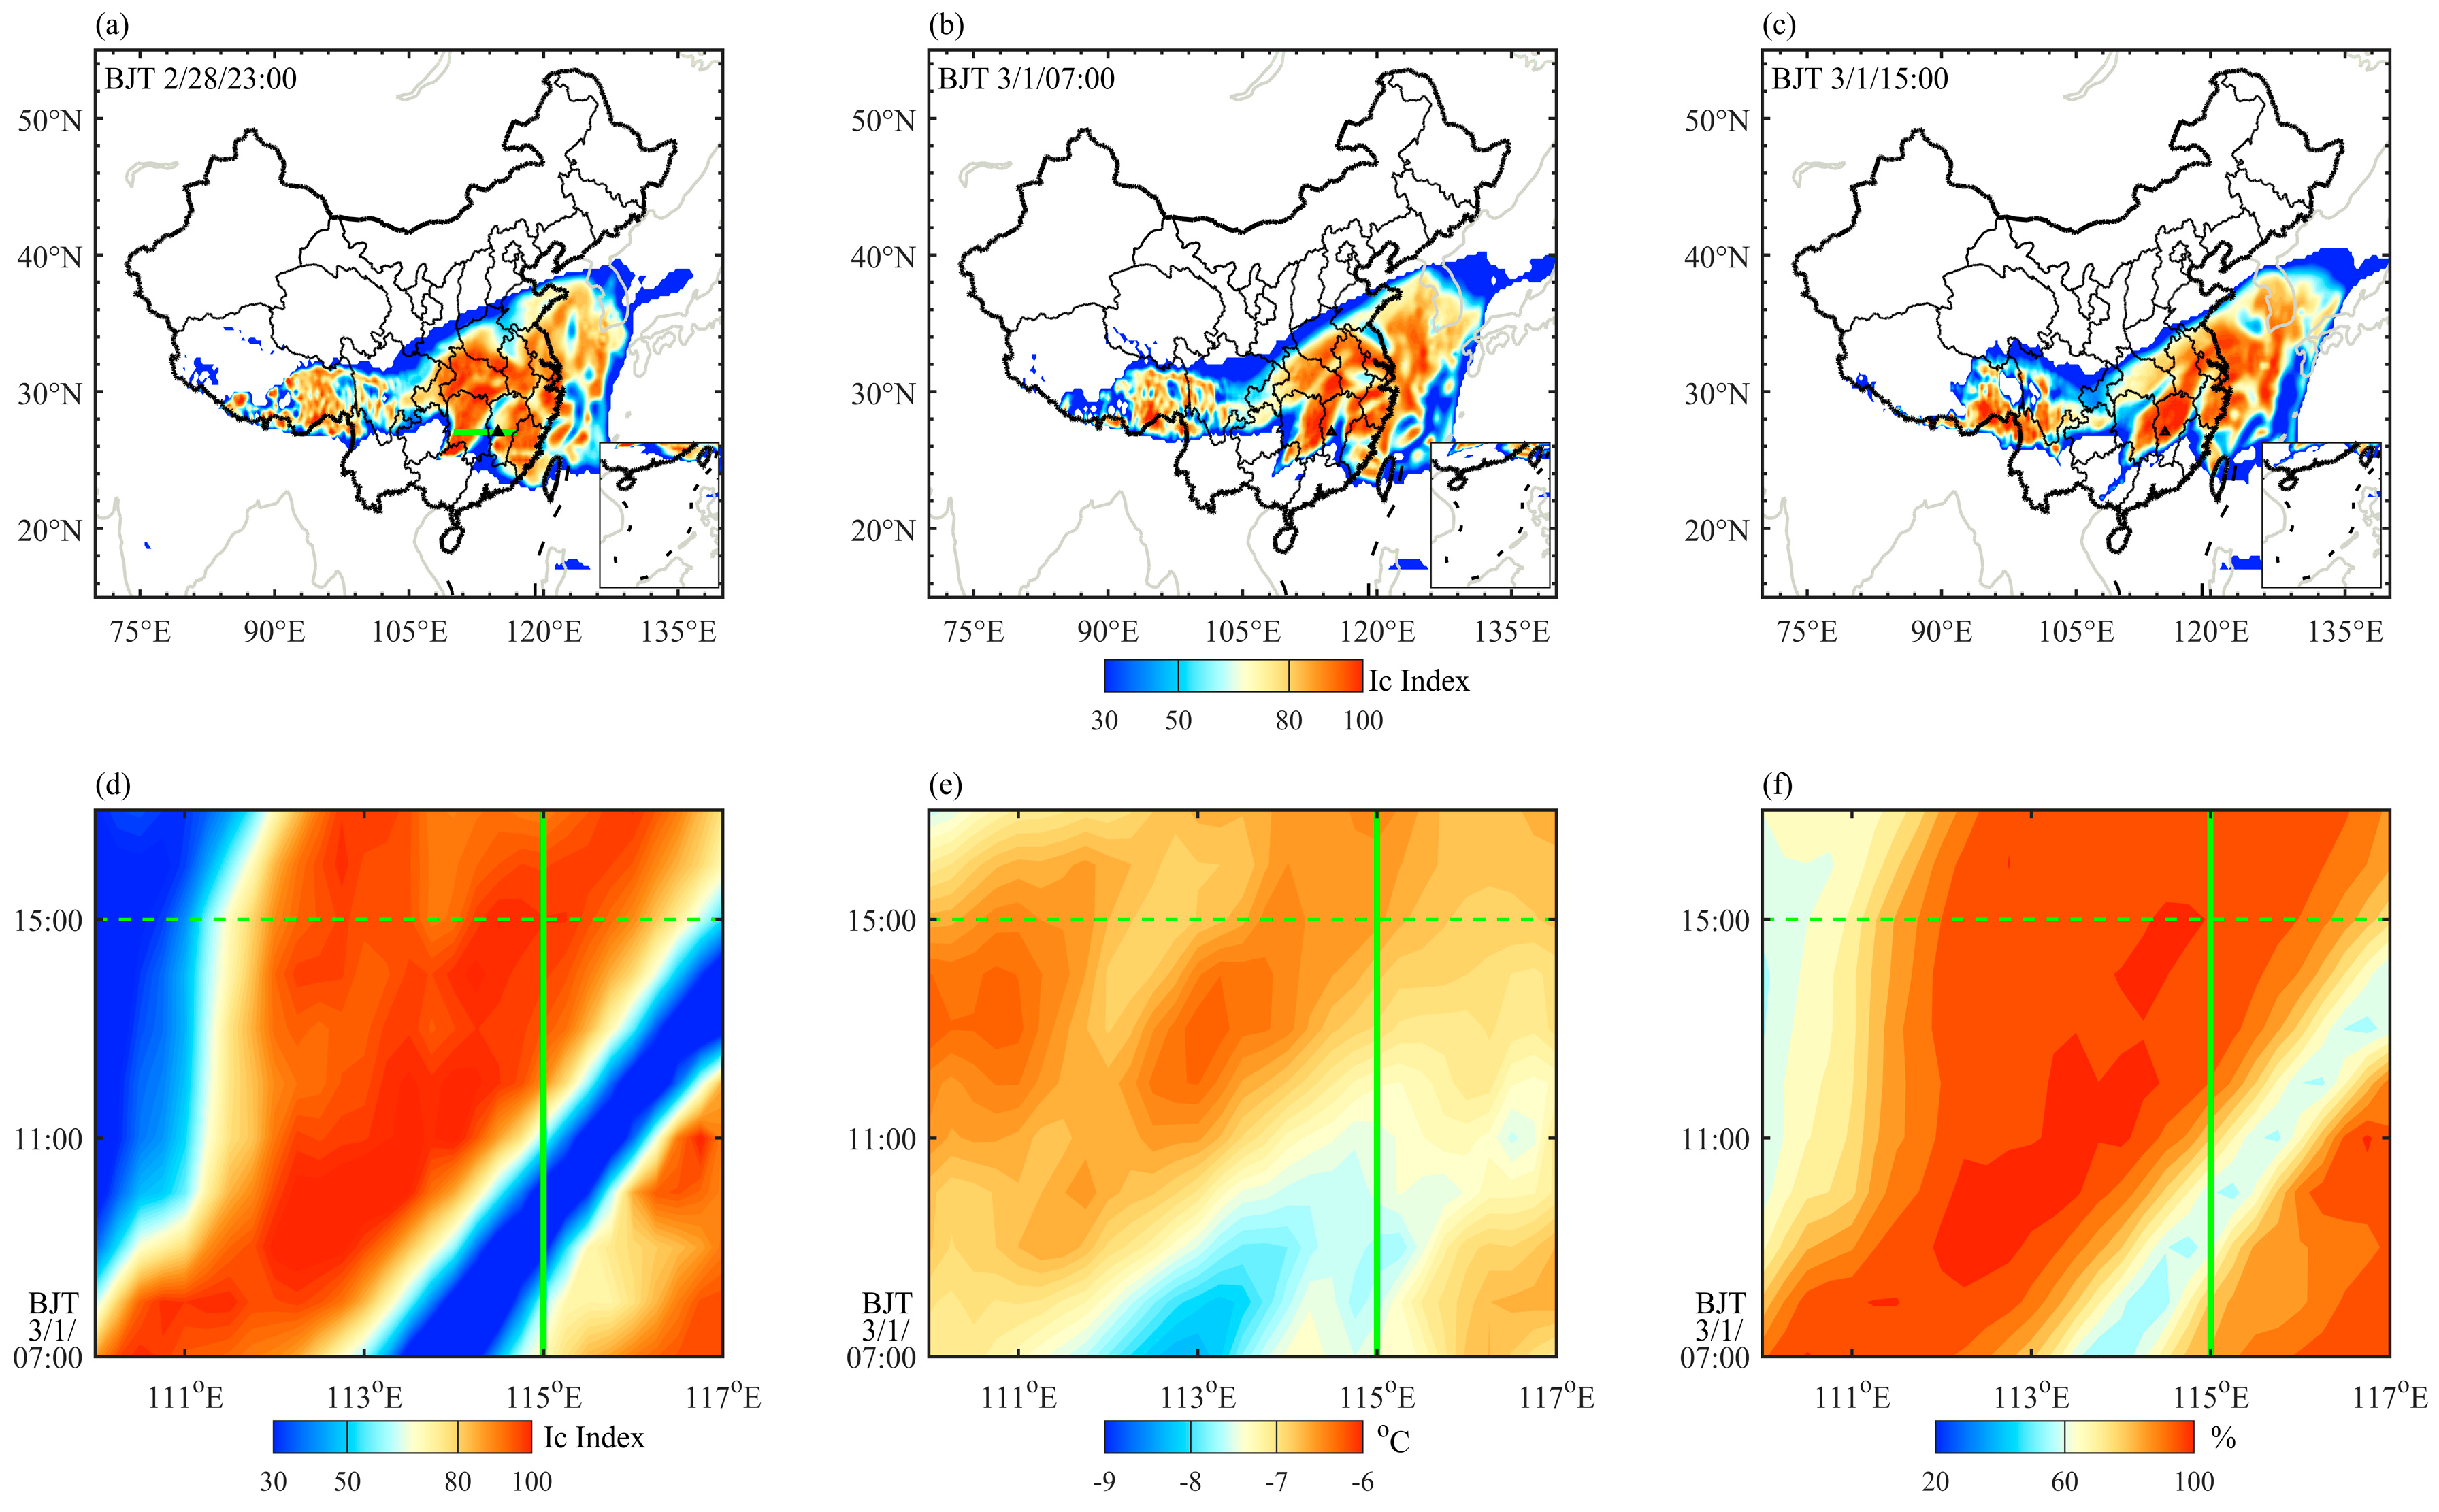
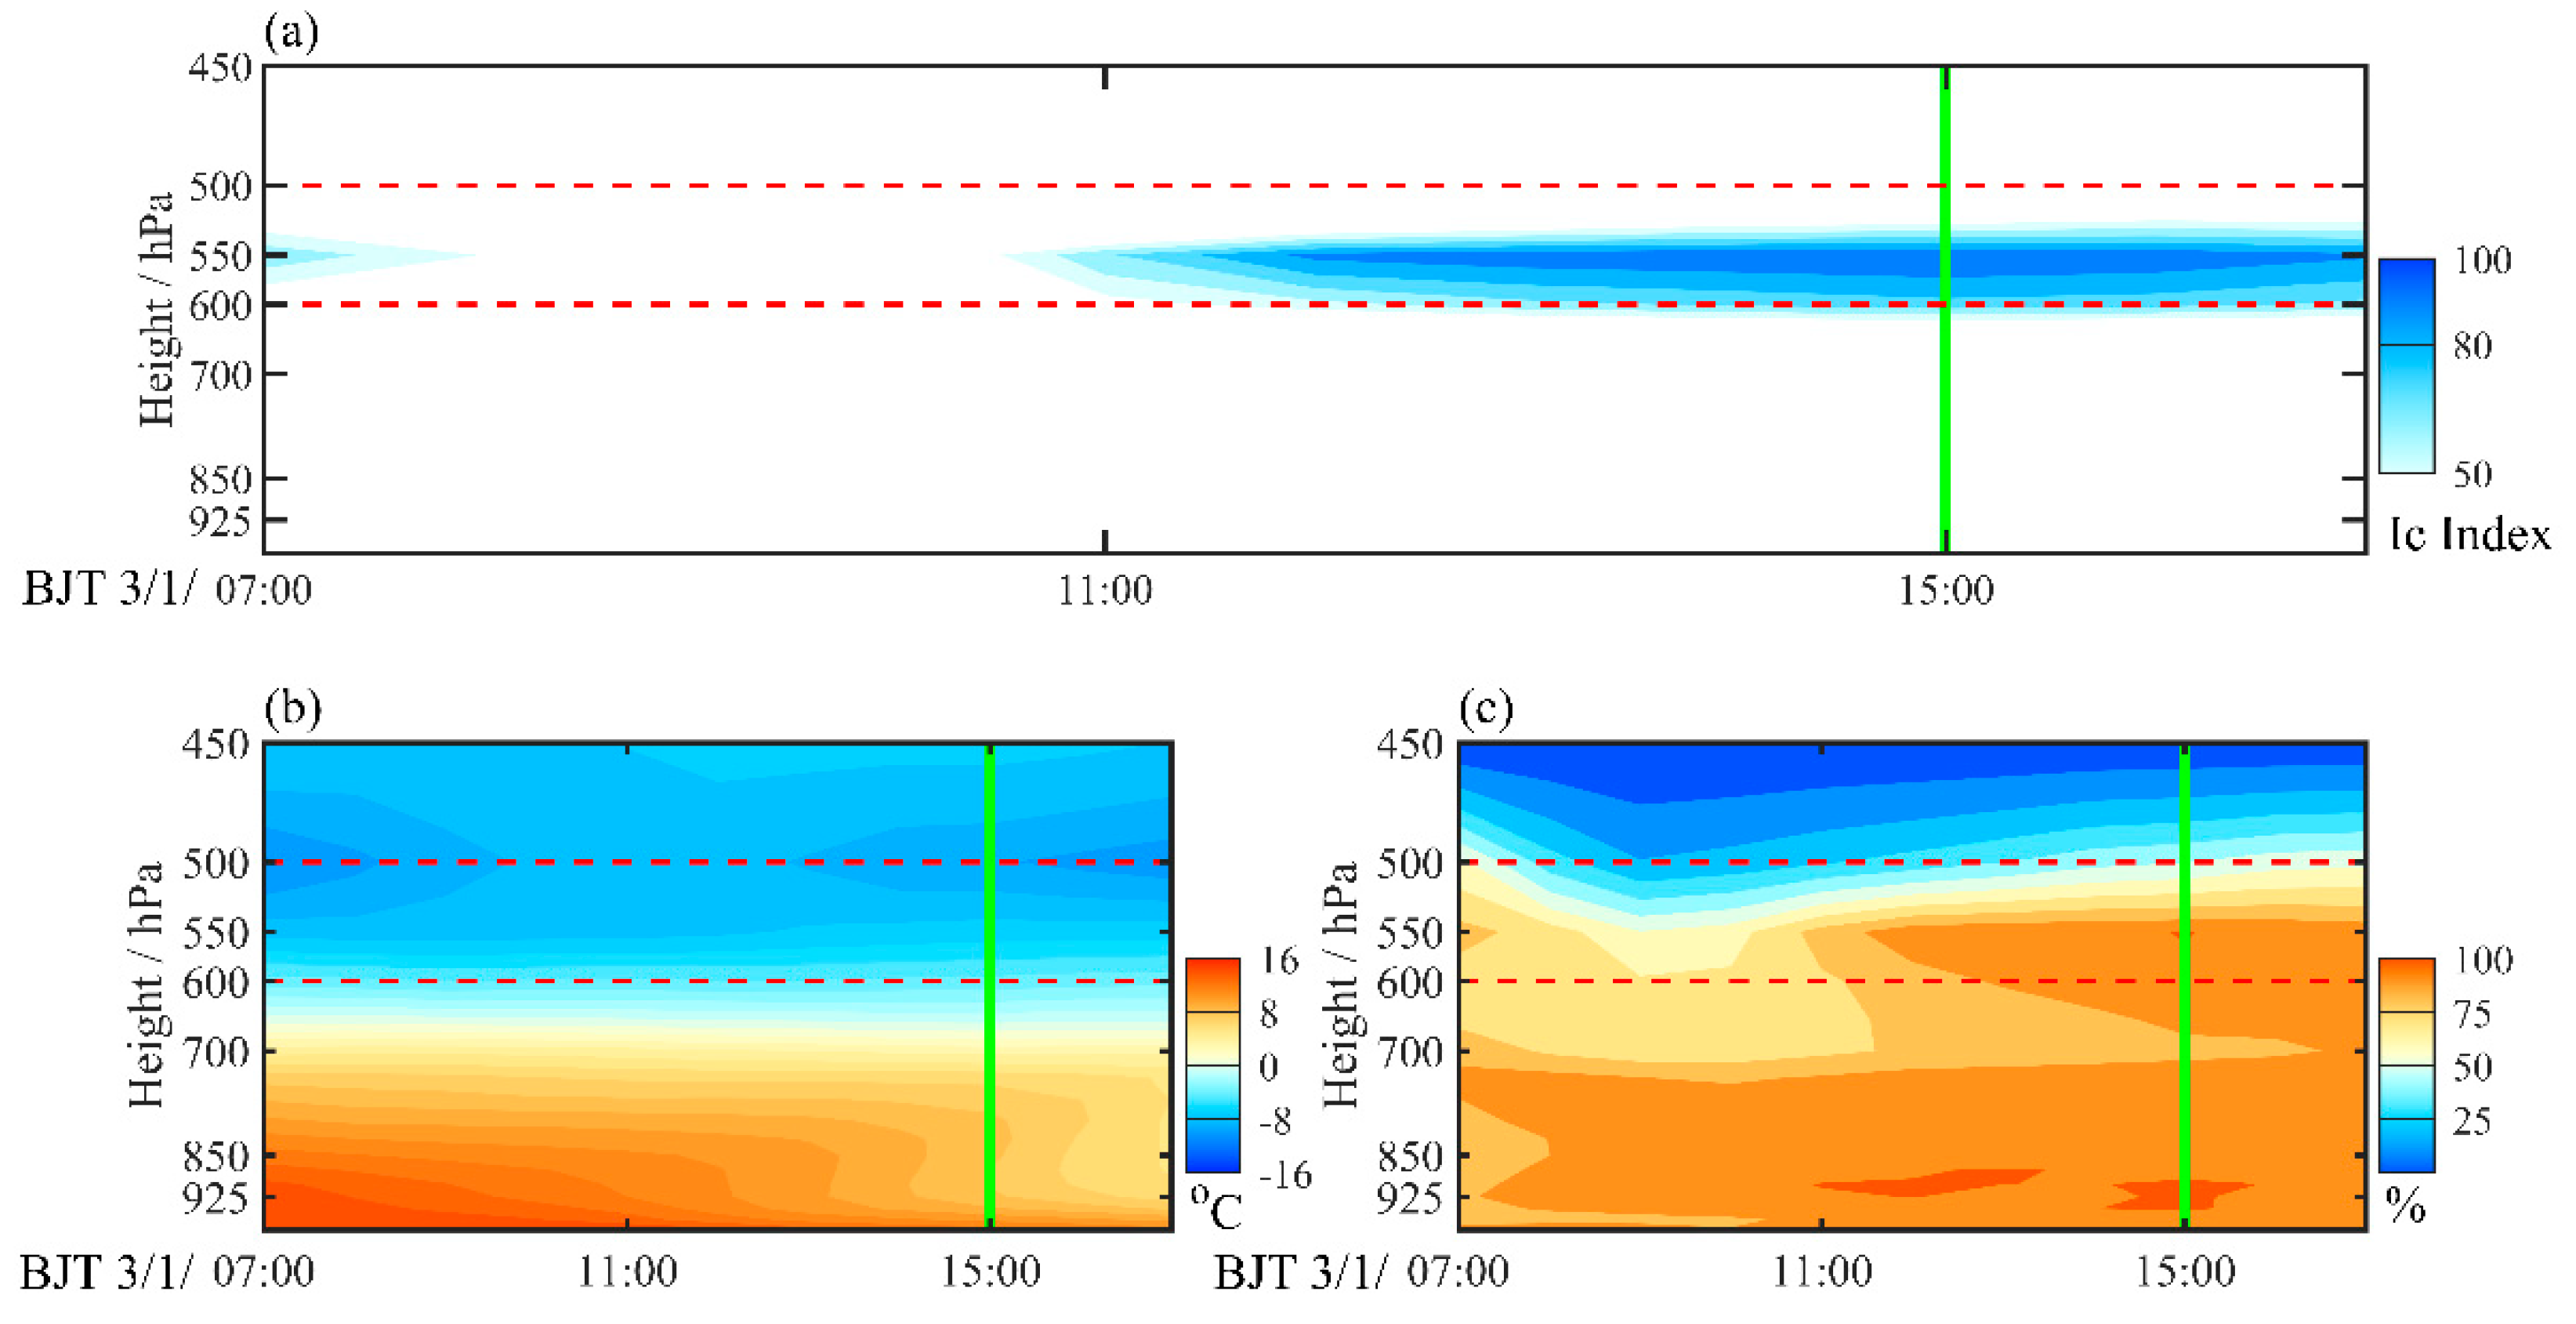
2.3. Icing Index
3. Synoptic Analysis of Meteorological Conditions for Aircraft Icing
3.1. Overview of the Aircraft Icing Accident
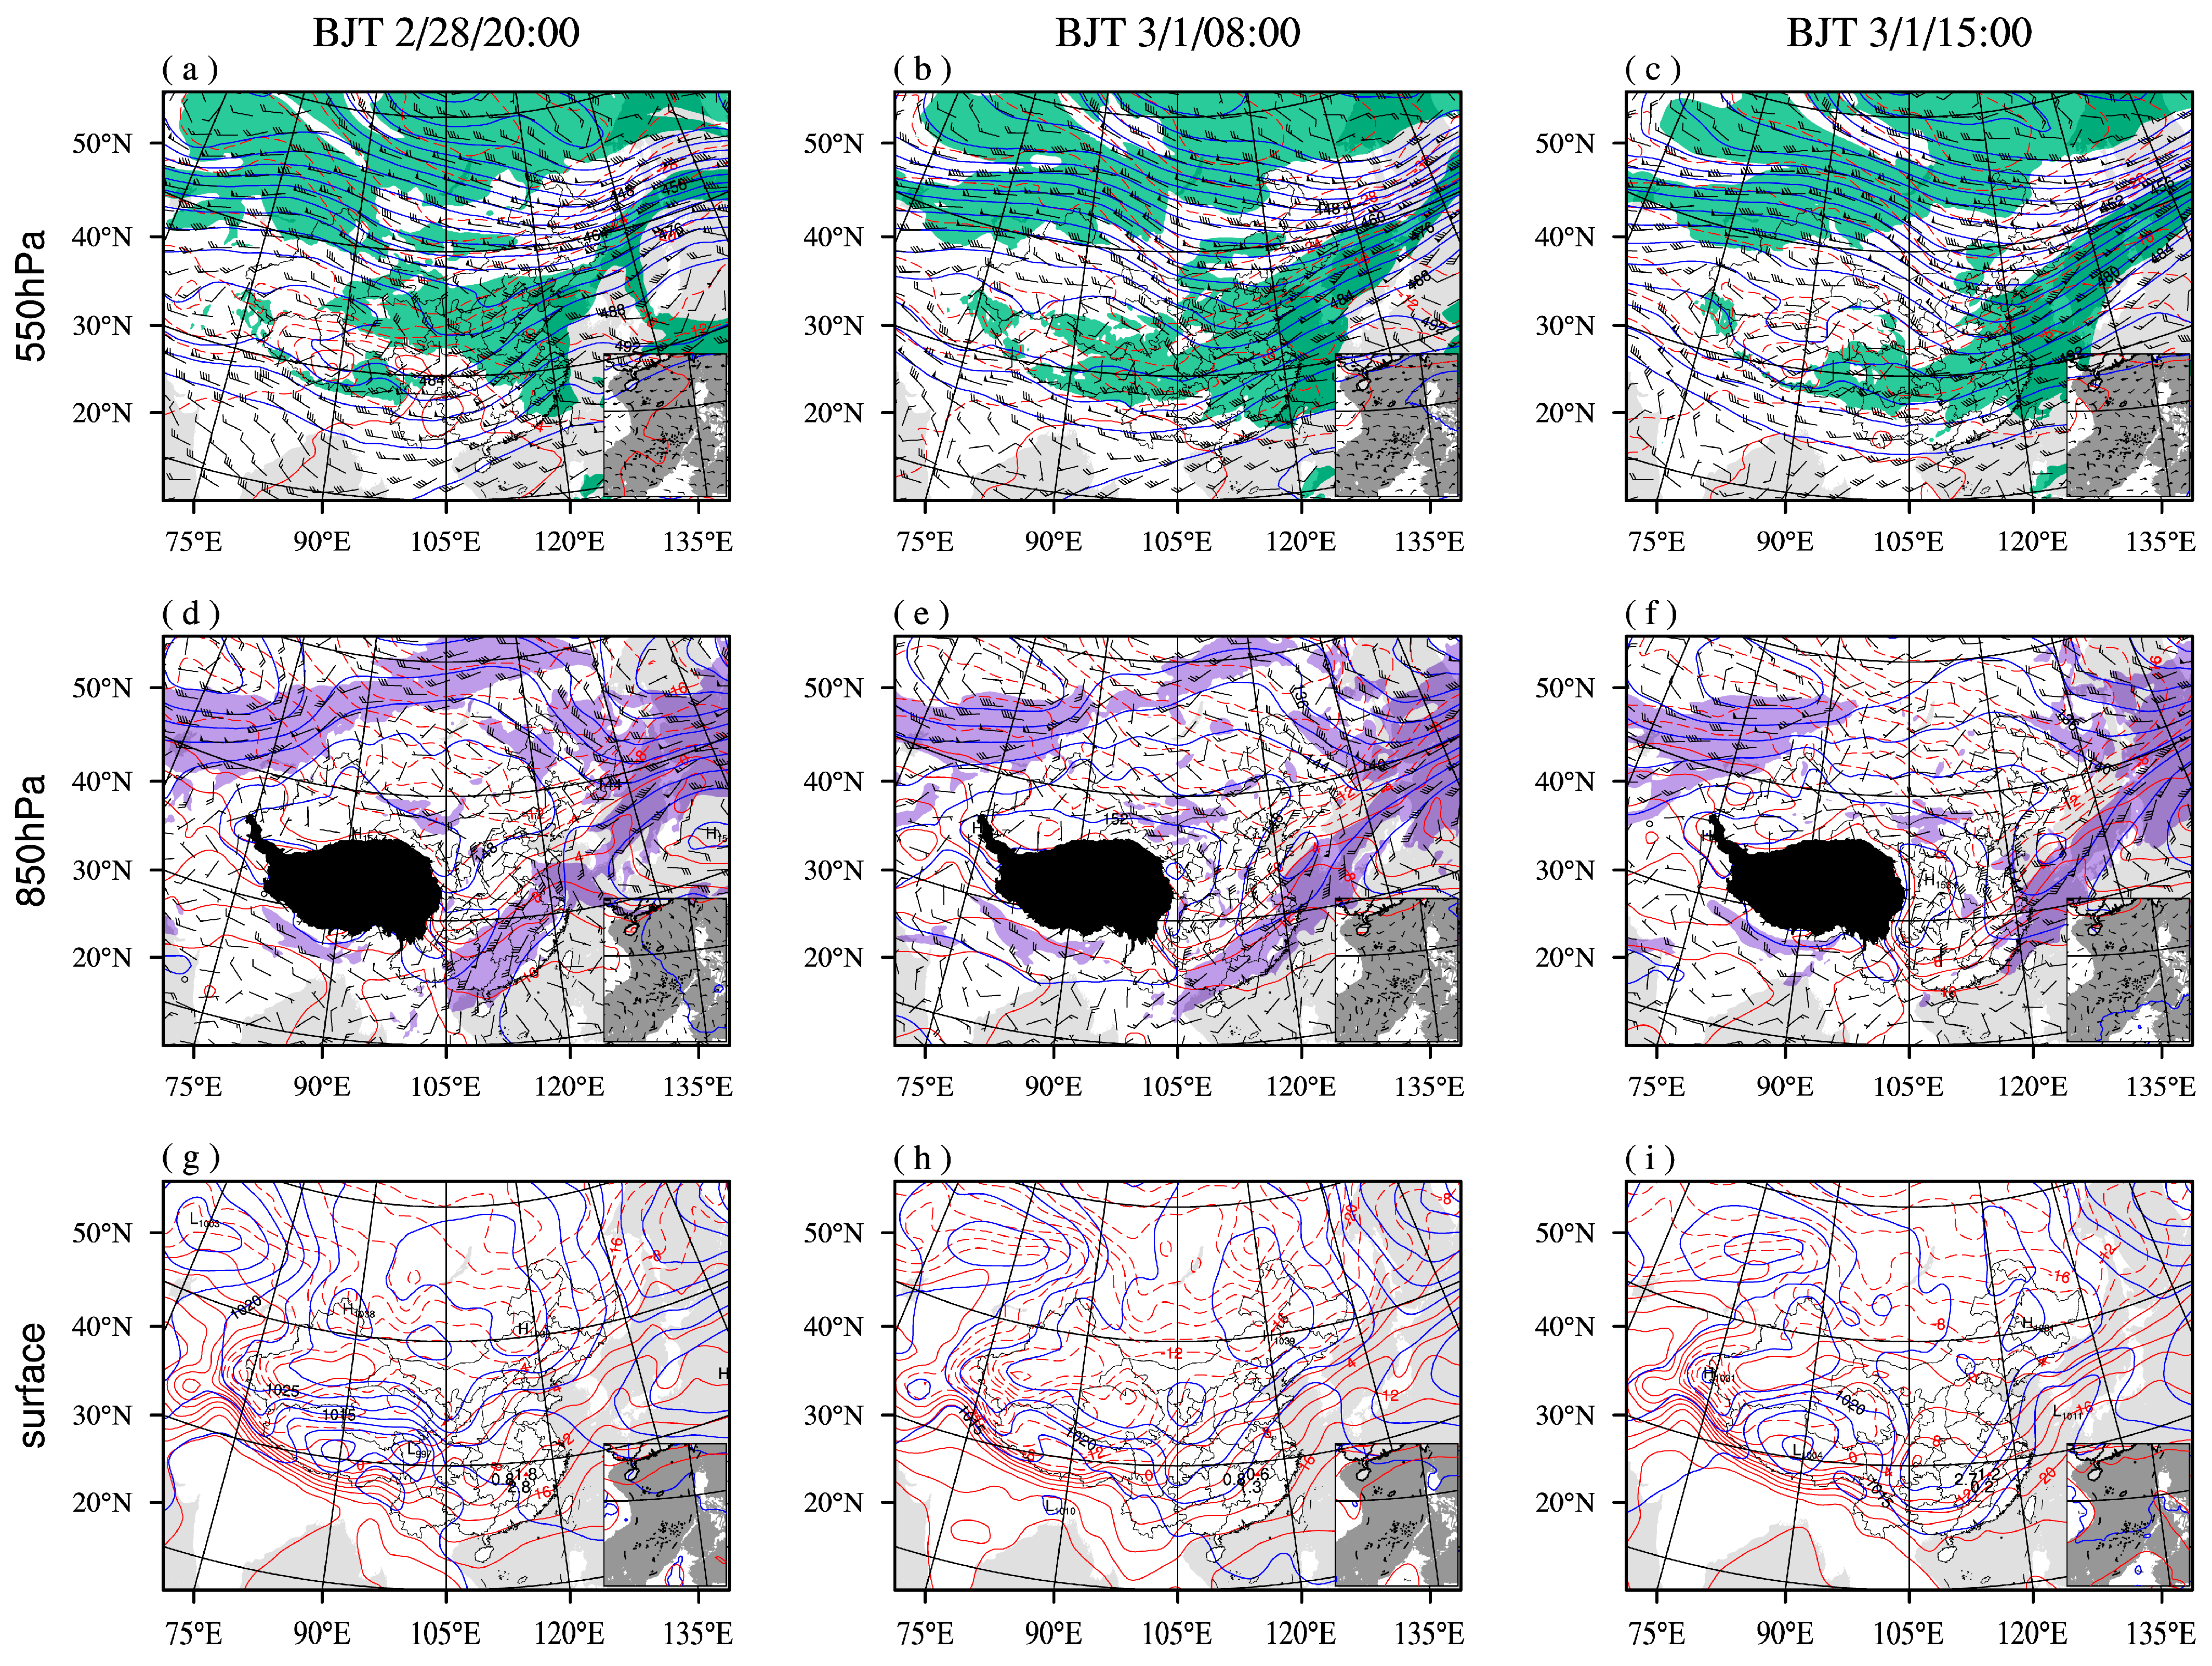
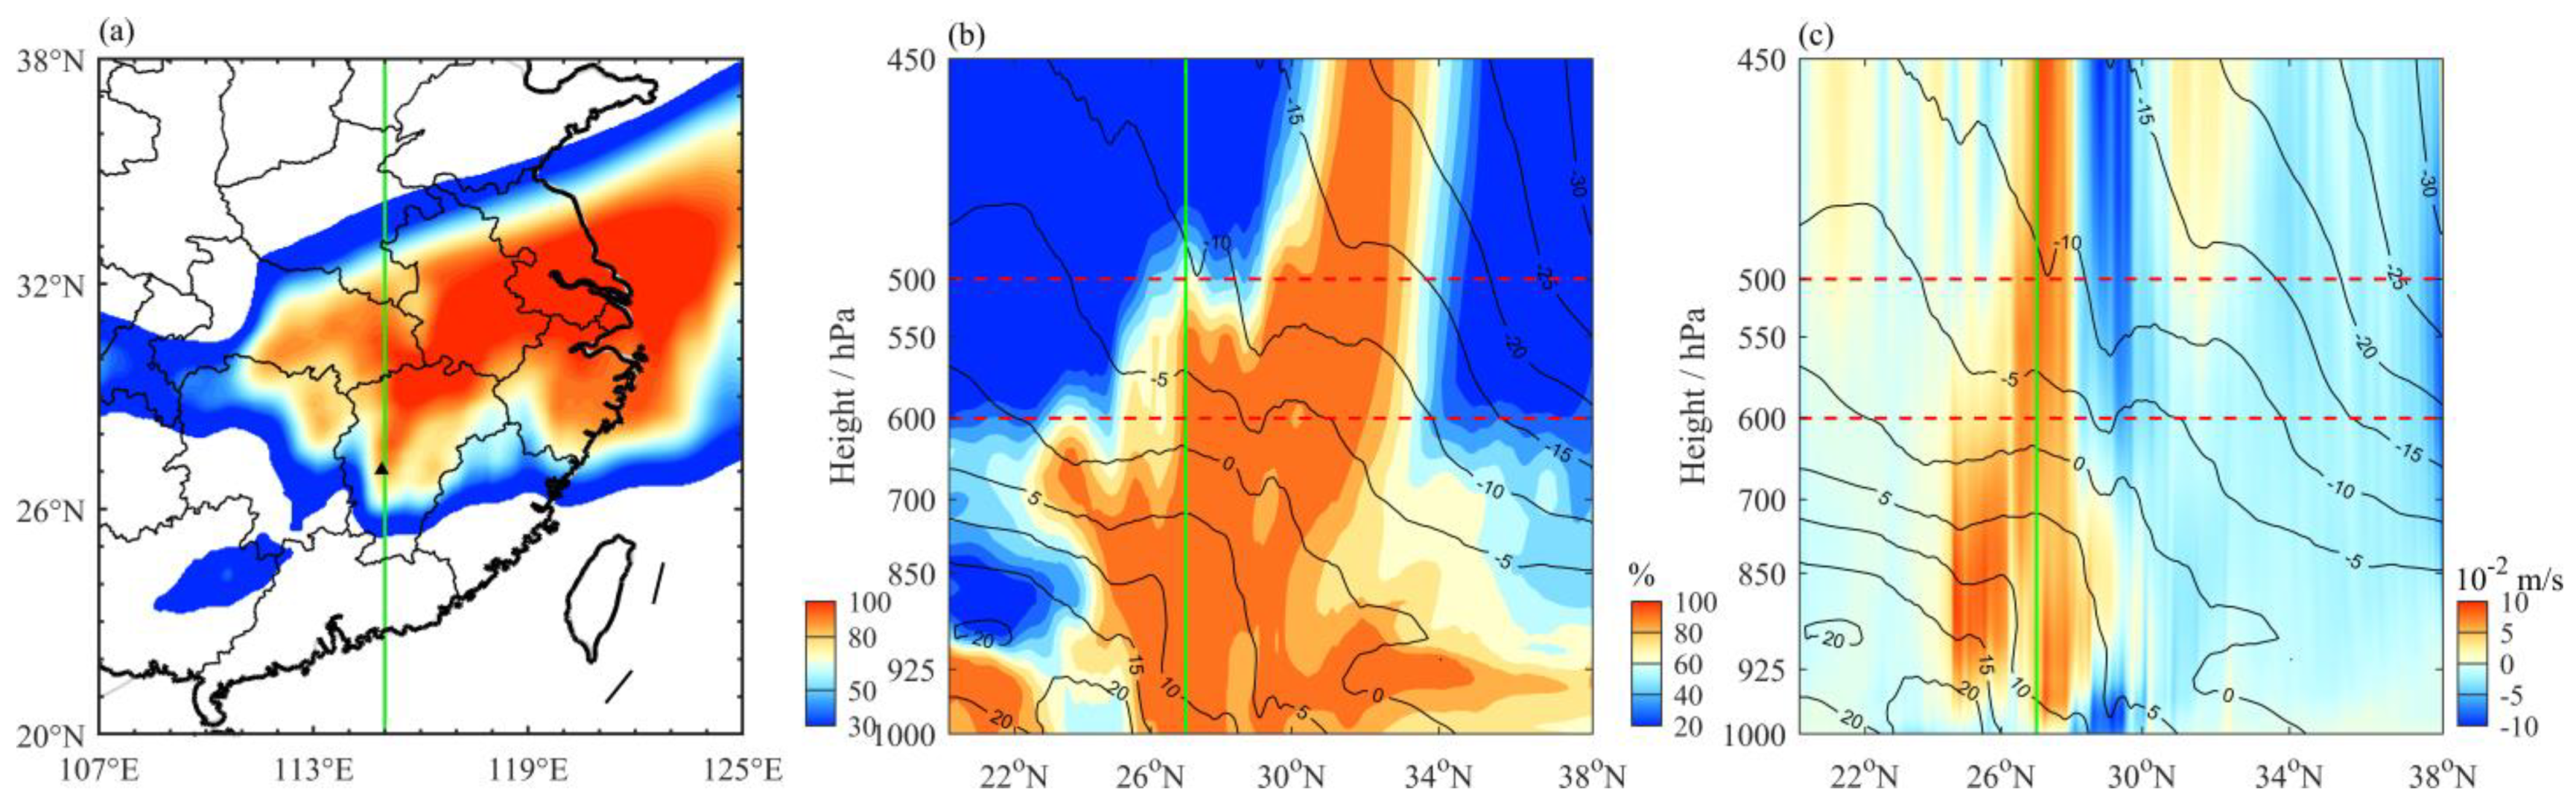
3.2. Main Weather System over the Aircraft Icing Region
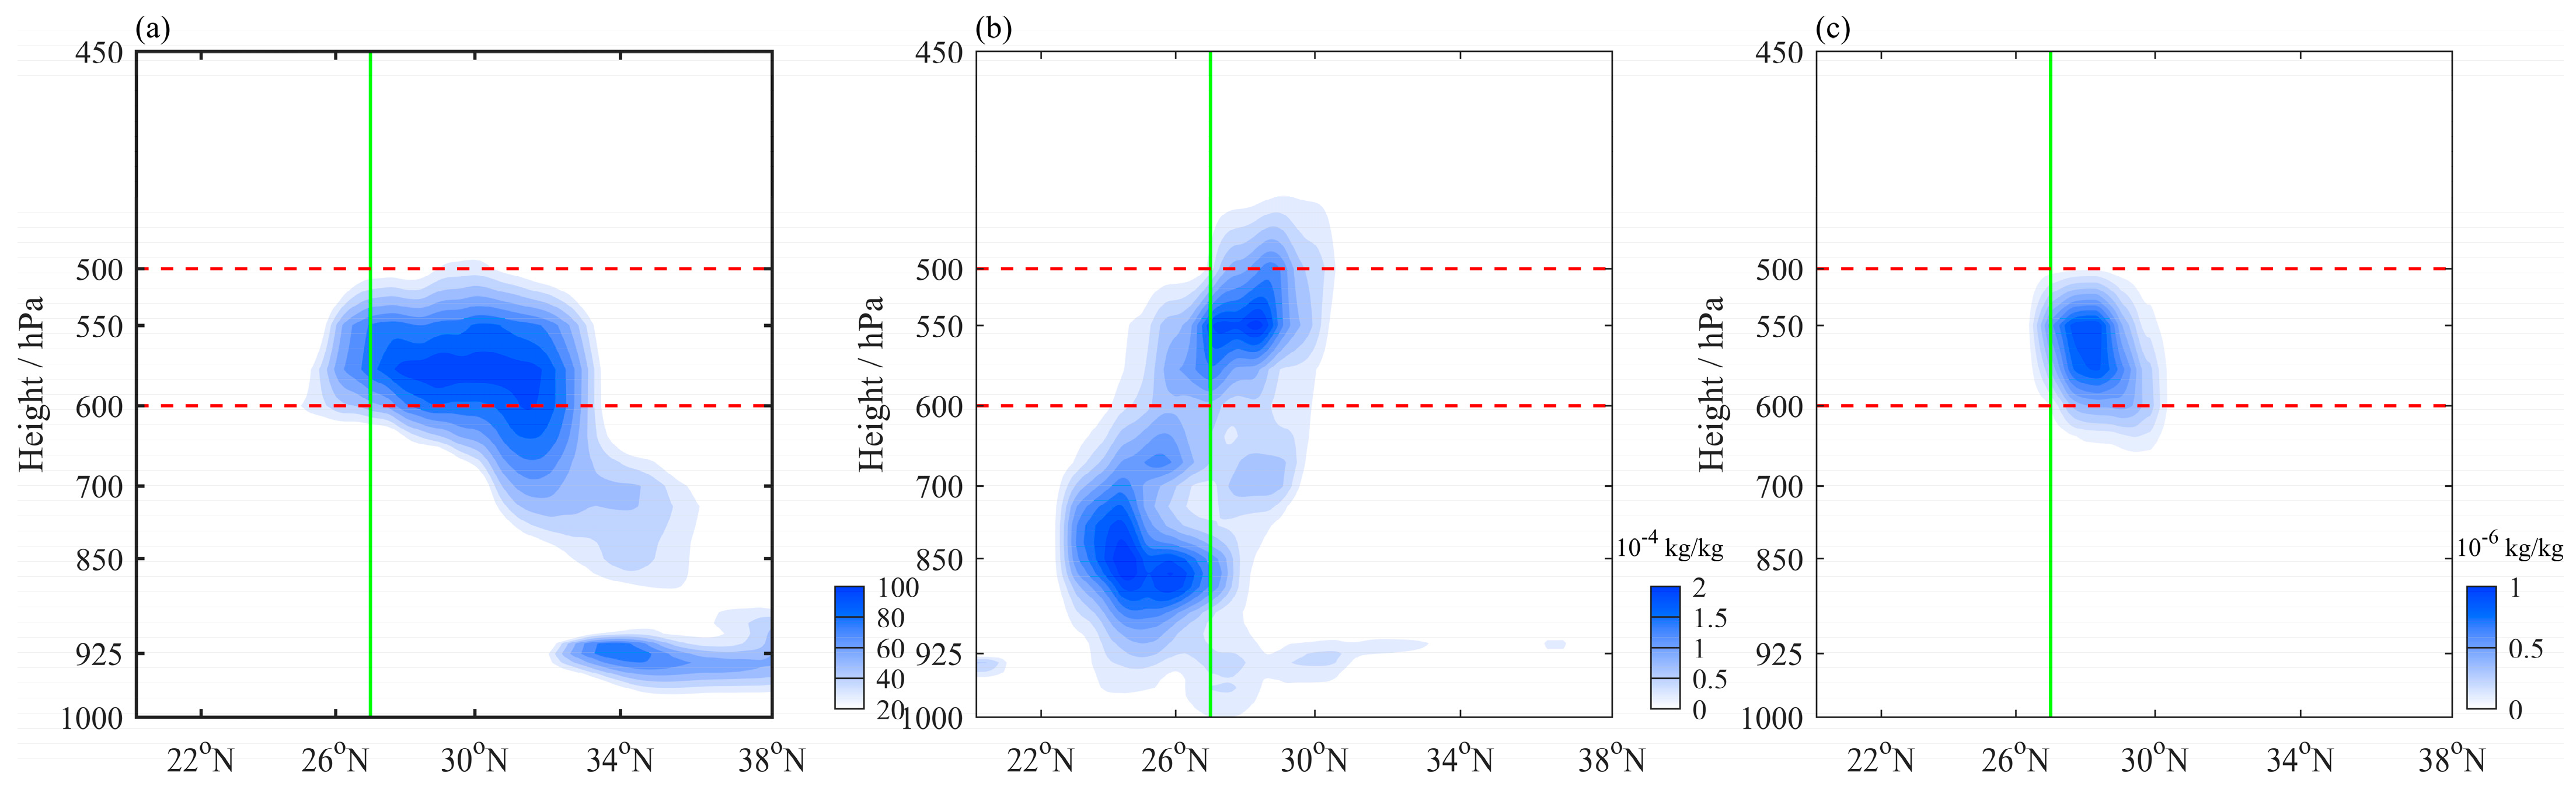
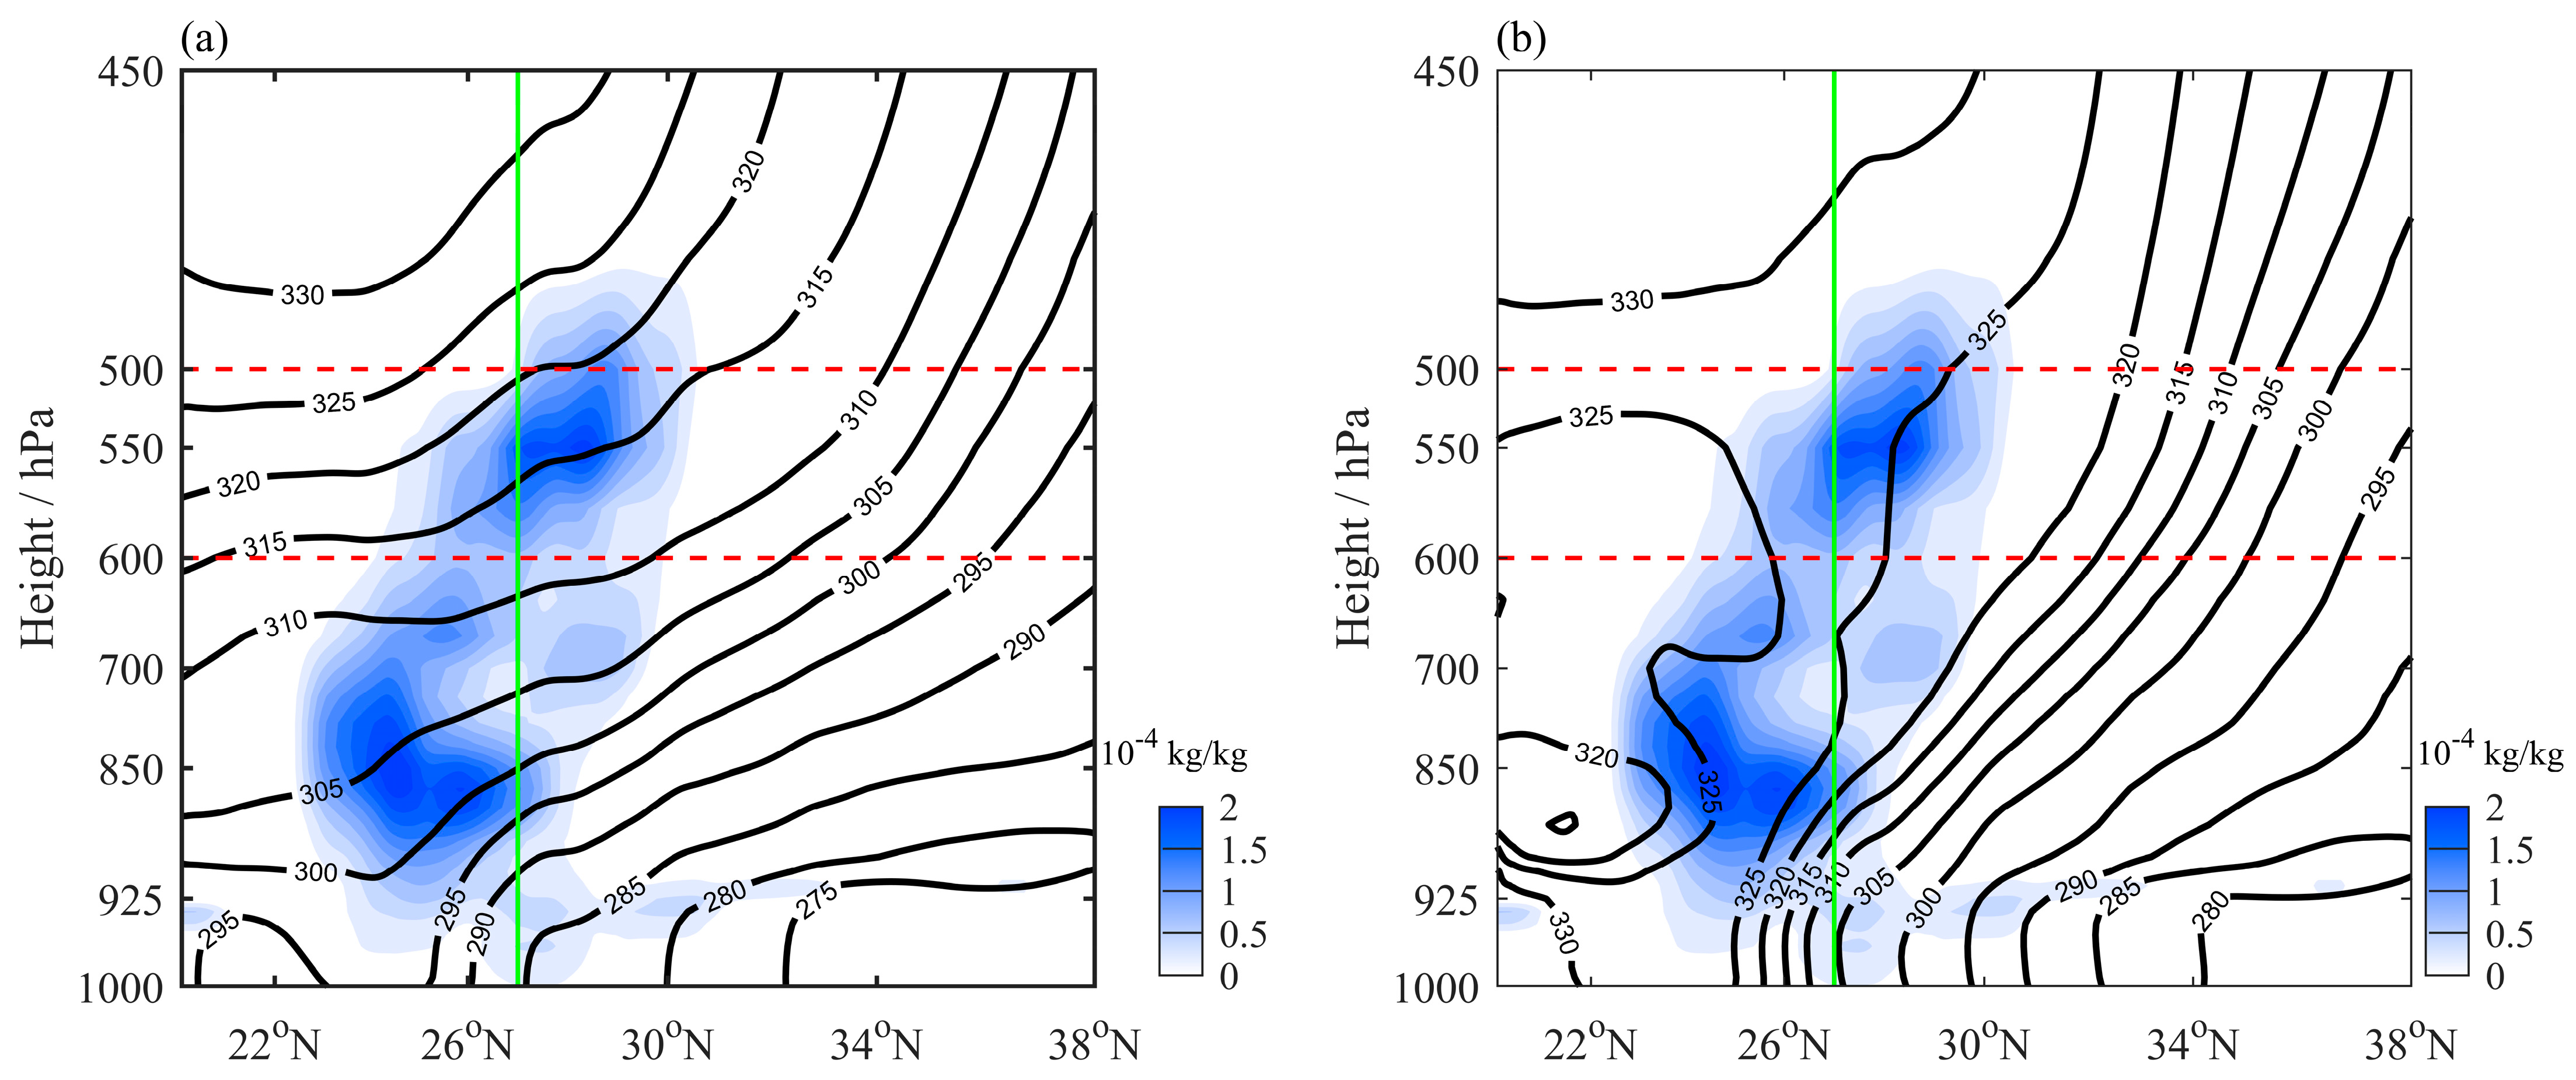
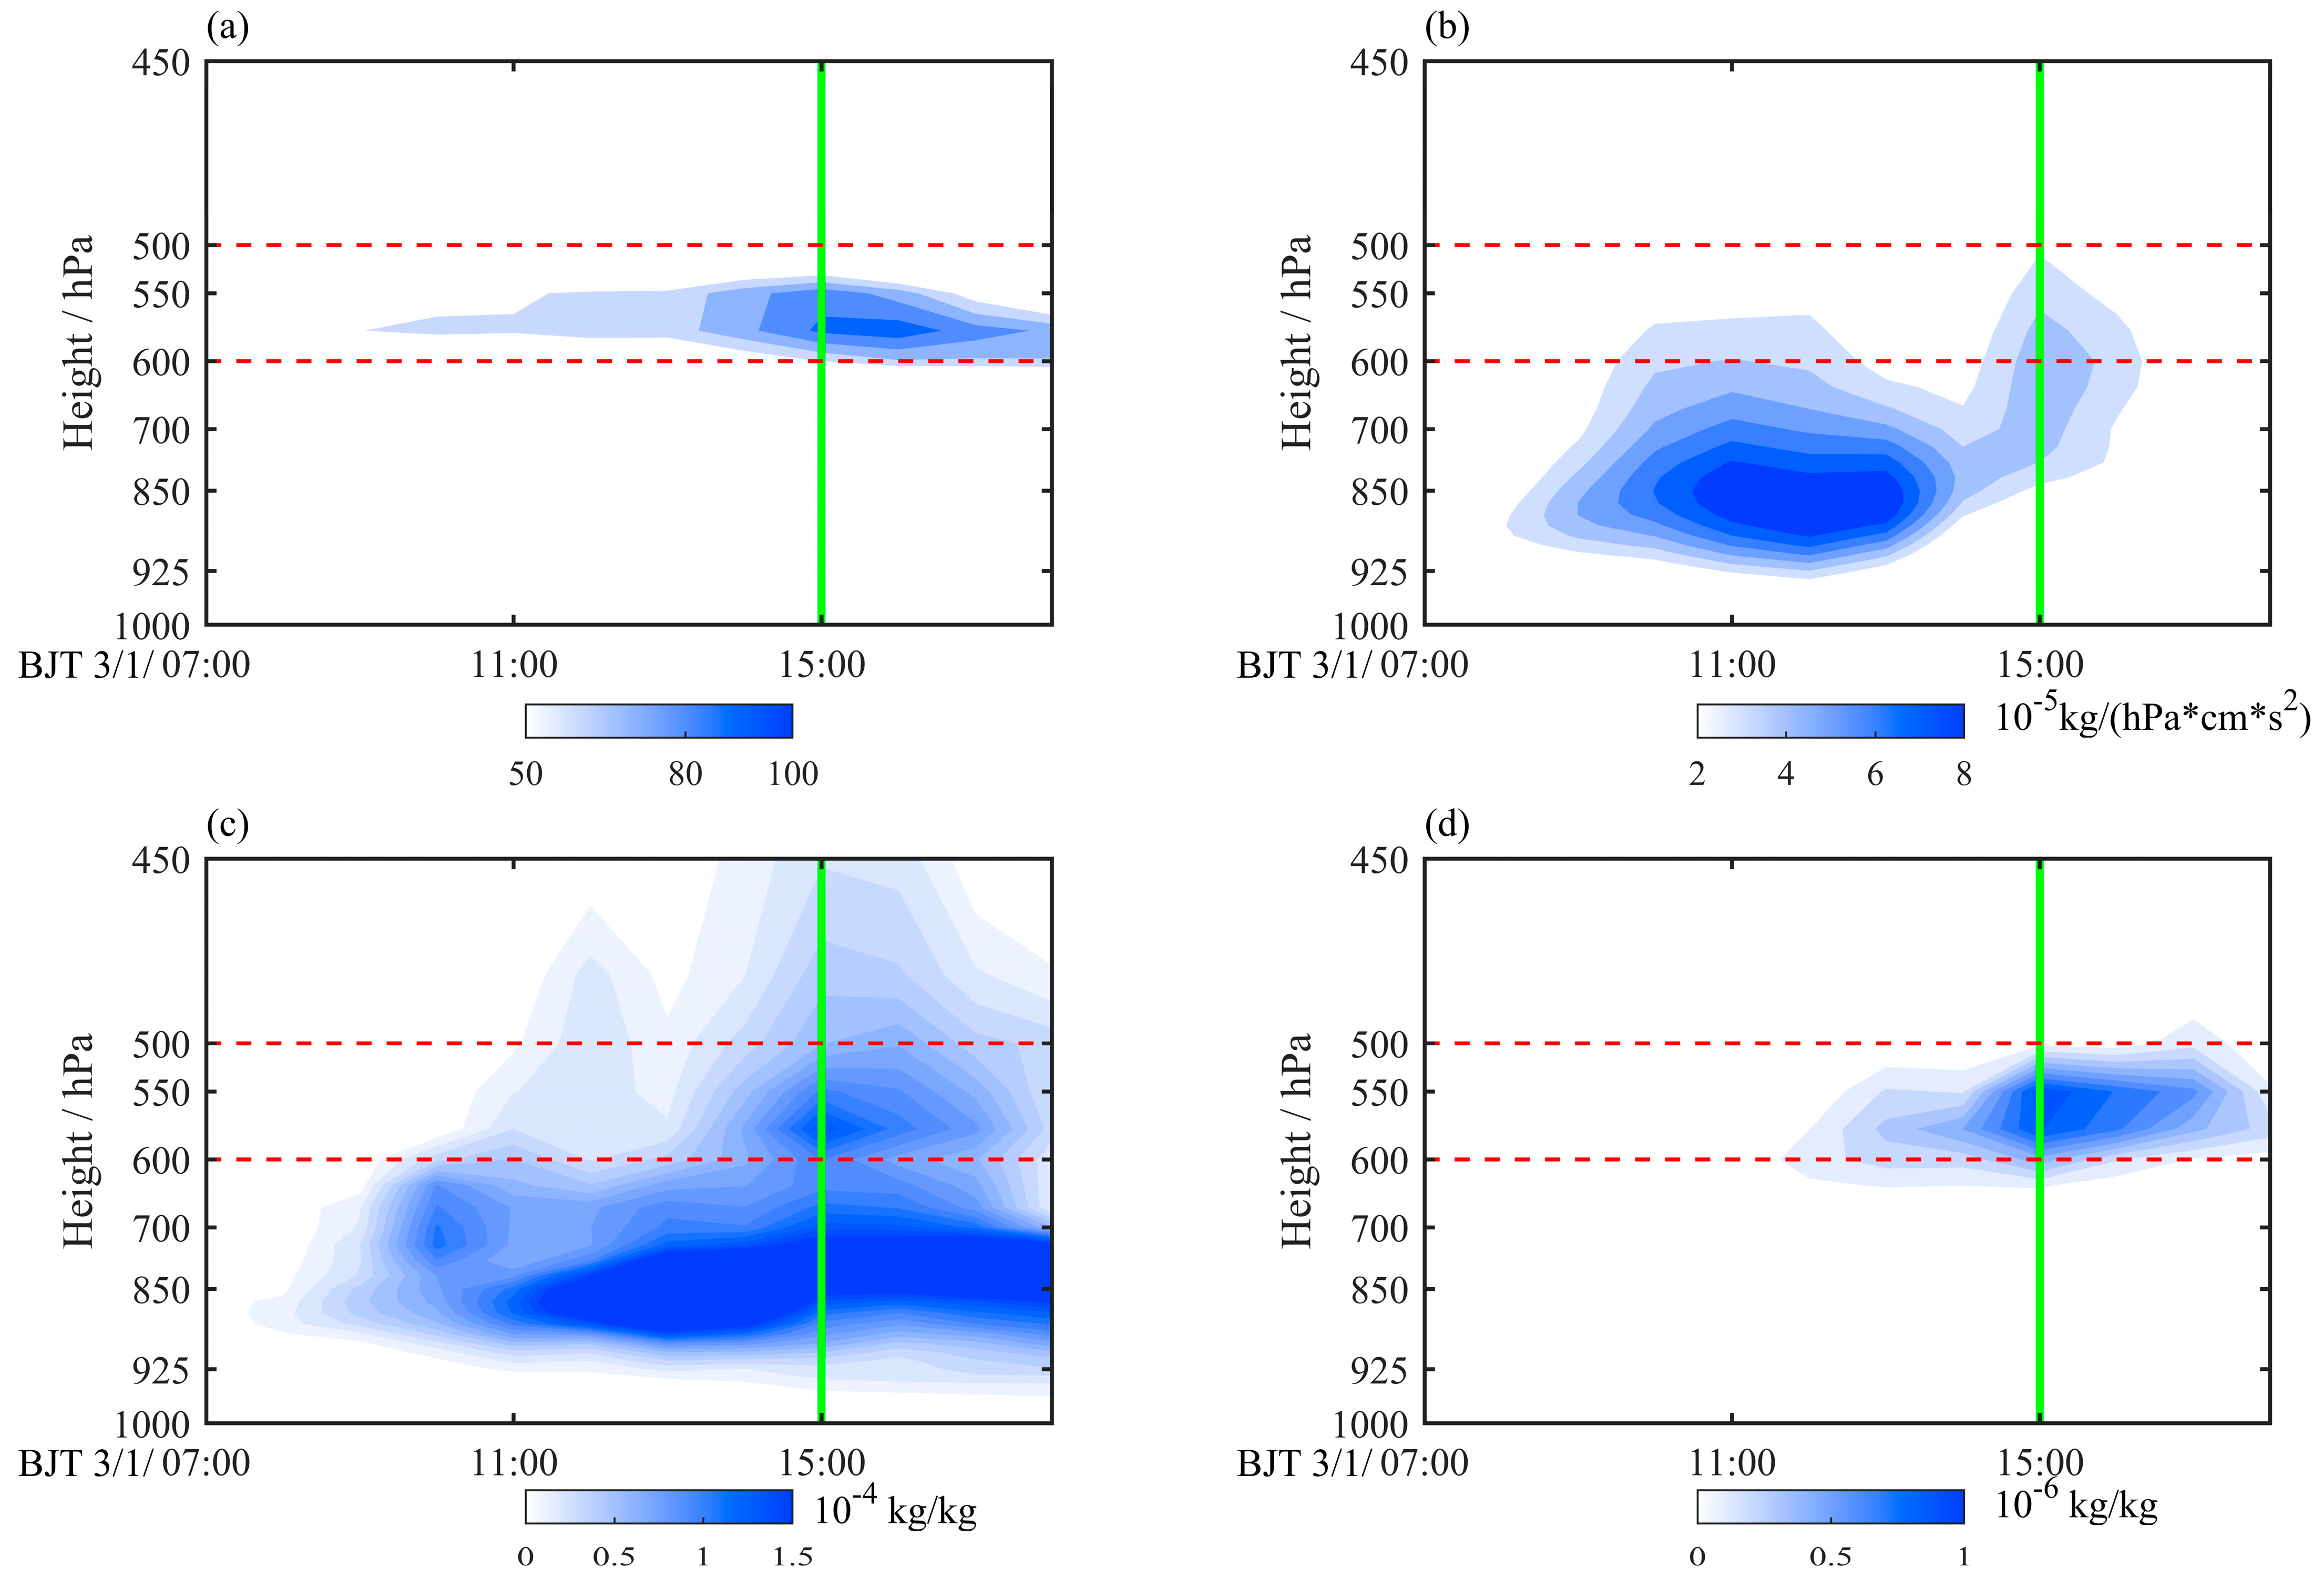
4. Numerical Simulations of Meteorological Conditions for the Aircraft Icing
5. Conclusions
Author Contributions
Funding
Data Availability Statement
Acknowledgments
Conflicts of Interest
References
- Cao, Y.; Tan, W.; Wu, Z. Aircraft icing: An ongoing threat to aviation safety. Aerosp. Sci. Technol. 2018, 75, 353–385. [Google Scholar] [CrossRef]
- Yamazaki, M.; Jemcov, A.; Sakaue, H. A Review on the Current Status of Icing Physics and Mitigation in Aviation. Aerospace 2021, 8, 188. [Google Scholar] [CrossRef]
- Zhou, C.; Li, Y.; Zheng, W.; Wu, P.; Dong, Z. Safety Analysis for Icing Aircraft during Landing Phase Based on Reachability Analysis. Math. Probl. Eng. 2018, 2018, 3728241. [Google Scholar] [CrossRef]
- Sundaresan, A.; Arunvinthan, S.; Pasha, A.A.; Pillai, S.N. Effect of Ice accretion on the aerodynamic characteristics of wind turbine blades. Wind Struct. 2021, 32, 205–217. [Google Scholar]
- Lynch, F.T.; Khodadoust, A. Effects of ice accretions on aircraft aerodynamics. Prog. Aerosp. Sci. 2001, 37, 669–767. [Google Scholar] [CrossRef]
- Cao, Y.; Wu, Z.; Su, Y.; Xu, Z. Aircraft flight characteristics in icing conditions. Prog. Aerosp. Sci. 2015, 74, 62–80. [Google Scholar] [CrossRef]
- Bromfield, M.A.; Horri, N.; Halvorsen, K.; Lande, K. Loss of control in flight accident case study: Icing-related tailplane stall. Aeronaut. J. 2023, 127, 1554–1573. [Google Scholar] [CrossRef]
- Boyd, D.; Guinn, T. Deficiencies in Safe Practices by Pilots Operating General Aviation Aircraft in Weather Conducive for Icing. J. Aviat. Technol. Eng. 2024, 13, 13–22. [Google Scholar] [CrossRef]
- Kind, R.J.; Potapczuk, M.G.; Feo, A.; Golia, C.; Shah, A.D. Experimental and computational simulation of in-flight icing phenomena. Prog. Aerosp. Sci. 1998, 34, 257–345. [Google Scholar] [CrossRef]
- Czernkovich, N. Understanding in-flight icing. In Proceedings of the Transport Canada Aviation Safety Seminar, Budapest, Hungary, 17 November 2004; pp. 1–21. [Google Scholar]
- Bragg, M.B.; Basar, T.; Perkins, W.R.; Selig, M.S.; Voulgaris, P.G.; Melody, J.W.; Sarter, N.B. Smart Icing Systems for Aircraft Icing Safety. In Proceedings of the 40th AIAA Aerospace Sciences Meeting and Exhibit, Reno, NV, USA, 14–17 January 2002; pp. 1–16. [Google Scholar]
- Hauf, T.; Schröder, F. Aircraft icing research flights in embedded convection. Meteorol. Atmos. Phys. 2005, 91, 247–265. [Google Scholar] [CrossRef]
- Merino, A.; García-Ortega, E.; Fernández-González, S.; Díaz-Fernández, J.; Quitián-Hernández, L.; Martín, M.L.; López, L.; Marcos, J.L.; Valero, F.; Sánchez, J.L. Aircraft Icing: In-Cloud Measurements and Sensitivity to Physical Parameterizations. Geophys. Res. Lett. 2019, 46, 11559–11567. [Google Scholar] [CrossRef]
- Sand, W.R.; Cooper, W.A.; Politovich, M.K.; Veal, D.L. Icing Conditions Encountered by a Research Aircraft. J. Clim. Appl. Meteorol. 1984, 23, 1427–1440. [Google Scholar] [CrossRef]
- Nickovic, S.; Cvetkovic, B.; Petković, S.; Amiridis, V.; Pejanović, G.; Solomos, S.; Marinou, E.; Nikolic, J. Cloud icing by mineral dust and impacts to aviation safety. Sci. Rep. 2021, 11, 6411. [Google Scholar] [CrossRef]
- Bernstein, B.C.; Le Bot, C. An Inferred Climatology of Icing Conditions Aloft, Including Supercooled Large Drops. Part II: Europe, Asia, and the Globe. J. Appl. Meteorol. Climatol. 2009, 48, 1503–1526. [Google Scholar] [CrossRef]
- Li, S.; Qin, J.; He, M. Fast Evaluation of Aircraft Icing Severity Using Machine Learning Based on XGBoost. Aerospace 2020, 7, 36. [Google Scholar] [CrossRef]
- Schultz, P.; Politovich, M.K. Toward the Improvement of Aircraft-Icing Forecasts for the Continental United States. Weather Forecast. 1992, 7, 491–500. [Google Scholar] [CrossRef]
- Thompson, G.; Bruintjes, R.T.; Brown, B.G.; Hage, F. Intercomparison of In-Flight Icing Algorithms. Part I: WISP94 Real-Time Icing Prediction and Evaluation Program. Weather Forecast. 1997, 12, 878–889. [Google Scholar] [CrossRef]
- Bernstein, B.C.; McDonough, F.; Politovich, M.K.; Brown, B.G.; Ratvasky, T.P.; Miller, D.R.; Wolff, C.A.; Cunning, G. Current Icing Potential: Algorithm Description and Comparison with Aircraft Observations. J. Appl. Meteorol. 2005, 44, 969–986. [Google Scholar] [CrossRef]
- Morcrette, C.; Brown, K.; Bowyer, R.; Gill, P.; Suri, D. Development and Evaluation of In-Flight Icing Index Forecast for Aviation. Weather Forecast. 2019, 34, 731–750. [Google Scholar] [CrossRef]
- Fernández-González, S.; Sánchez, J.L.; Gascón, E.; López, L.; García-Ortega, E.; Merino, A. Weather Features Associated with Aircraft Icing Conditions: A Case Study. Sci. World J. 2014, 2014, 279063. [Google Scholar] [CrossRef]
- Reinking, R.F.; Snider, J.B.; Coen, J.L. Influences of Storm-Embedded Orographic Gravity Waves on Cloud Liquid Water and Precipitation. J. Appl. Meteorol. 2000, 39, 733–759. [Google Scholar] [CrossRef]
- Bernstein, B.C.; Omeron, T.A.; McDonough, F.; Politovich, M.K. The Relationship between Aircraft Icing and Synoptic-Scale Weather Conditions. Weather Forecast. 1997, 12, 742–762. [Google Scholar] [CrossRef]
- Politovich, M.K.; Bernstein, T.A.O. Aircraft Icing Conditions in Northeast Colorado. J. Appl. Meteorol. 2002, 41, 118–132. [Google Scholar] [CrossRef]
- Politovich, M.K. Aircraft Icing Caused by Large Supercooled Droplets. J. Appl. Meteorol. 1989, 28, 856–868. [Google Scholar] [CrossRef]
- Smith, W.L., Jr.; Minnis, P.; Young, D.F. An icing product derived from operational satellite data. In Proceedings of the Ninth Conference on Aviation, Range and Aerospace Meteorology, Orlando, FL, USA, 13 September 2000; pp. 256–259. [Google Scholar]
- Tafferner, A.; Hauf, T.; Leifeld, C.; Hafner, T.; Leykauf, H.; Voigt, U. ADWICE: Advanced Diagnosis and Warning System for Aircraft Icing Environments. Weather Forecast. 2003, 18, 184–203. [Google Scholar] [CrossRef]
- Nicholls, S. A model of drizzle growth In warm, turbulent, stratiform clouds. Q. J. R. Meteorol. Soc. 2007, 113, 1141–1170. [Google Scholar] [CrossRef]
- Wang, X.; Zhang, J.; Wang, S. Climatic Features of Aircraft Icing of China. Meteorol. Sci. 2002, 22, 343–350. (In Chinese) [Google Scholar]
- Wang, J.; Xie, B.; Cai, J. The Distribution of Aircraft Icing Accretion in China—Preliminary Study. Atmosphere 2020, 11, 876. [Google Scholar] [CrossRef]
- Li, Z. Analysis of meteorological conditions of aircraft icing. J. Sichuan Meteor. 1999, 19, 55–57. (In Chinese) [Google Scholar]
- Pang, Z.; Zhang, Y. Weather Conditions of Aircraft Icing in the Middle Part of Gansu Province. Arid Meteor. 2008, 26, 53–56. (In Chinese) [Google Scholar]
- Sun, J.; Cai, M.; Wang, F.; Shi, Y. A case study of aircraft icing conditions in Anqing Area. Meteor. Mon. 2019, 45, 1341–1351. (In Chinese) [Google Scholar]
- Chi, Z. Statistical Analysis and Numerical Prediction Experiment of Weather Conditions for Aircraft Icing. Meteor. Sci. Technol. 2007, 33, 714–718+766. (In Chinese) [Google Scholar]
- Wang, Z.; Zhou, X.; Wu, J.; Li, B.; Lin, Y.; Yan, W.; Zhang, Y. Weather Conditions and Cloud Microphysical Characteristics of an Aircraft Severe Icing Process. J. Appl. Meteor. Sci. 2022, 33, 555–567. (In Chinese) [Google Scholar]
- Sun, J.; Tan, C.; Zhou, Y.; Liu, Z.; Huang, J.; Wang, Z. Meteorological Conditions of Two Cases of Aircraft Icing in Spring in Xinjiang. Meteor. Environ. Sci. 2021, 44, 24–32. (In Chinese) [Google Scholar]
- Nygaard, B.E.K.; Kristjánsson, J.E.; Makkonen, L. Prediction of In-cloud icing conditions at ground level using the WRF model. J. Appl. Meteorol. Climatol. 2011, 50, 2445–2459. [Google Scholar] [CrossRef]
- Regmi, R.P.; Kitada, T.; Dudhia, J.; Maharjan, S. Large-Scale Gravity Current over the Middle Hills of the Nepal Himalaya: Implications for Aircraft Accidents. J. Appl. Meteorol. Climatol. 2017, 56, 371–390. [Google Scholar] [CrossRef]
- Davis, N.; Hahmann, A.N.; Clausen, N.-E.; Žagar, M. Forecast of Icing Events at a Wind Farm in Sweden. J. Appl. Meteorol. Climatol. 2014, 53, 262–281. [Google Scholar] [CrossRef]
- Guo, Q.; Sang, W.; Niu, J.; Yi, Z.; Xia, Z.; Miao, S. Evaluation of Different Cloud Microphysics Schemes on the Meteorological Condition Prediction of Aircraft Icing. Trans. Nanjing Univ. Aeronaut. Astronaut. 2023, 40, 124–136. [Google Scholar]
- Bian, S.; An, H.; Su, X.; Huang, Y. Diagnostic Analysis and Intensity Prediction Modeling of Aircraft Icing Process. Meteor. Disaster Reduct. Res. 2023, 46, 304–311. (In Chinese) [Google Scholar]
- Ratvasky, T.P.; Barnhart, B.P.; Lee, S. Current Methods Modeling and Simulating Icing Effects on Aircraft Performance, Stability, Control. J. Aircraft. 2010, 47, 201–211. [Google Scholar] [CrossRef]
- Hersbach, H.; Bell, B.; Berrisford, P.; Hirahara, S.; Horányi, A.; Muñoz-Sabater, J.; Nicolas, J.; Peubey, C.; Radu, R.; Schepers, D.; et al. The ERA5 global reanalysis. Q. J. R. Meteorol. Soc. 2020, 146, 1999–2049. [Google Scholar] [CrossRef]
- Dyroff, C.; Zahn, A.; Christner, E.; Forbes, R.; Tompkins, A.M.; van Velthoven, P.F.J. Comparison of ECMWF analysis and forecast humidity data with CARIBIC upper troposphere and lower stratosphere observations. Q. J. R. Meteorol. Soc. 2014, 141, 833–844. [Google Scholar] [CrossRef]
- Belo-Pereira, M. Comparison of in-flight aircraft icing algorithms based on ECMWF forecasts. Meteorol. Appl. 2015, 22, 705–715. [Google Scholar] [CrossRef]
- Skamarock, W.C.; Klemp, J.B. A time-split nonhydrostatic atmospheric model for weather research and forecasting applications. J. Comput. Phys. 2008, 227, 3465–3485. [Google Scholar] [CrossRef]
- Bolgiani, P.; González, S.F.; Martin, M.L. Analysis and numerical simulation of an aircraft icing episode near Adolfo SuárezMadrid-Barajas International Airport. Atmos. Res. 2017, 200, 60–69. [Google Scholar] [CrossRef]
- Liu, T.; Sun, J.; Zhou, Y.; Peng, C.; Yan, F. Simulation Study on Stratiform Cloud Structure of Trough Cold Front and Characeristics of Supercooled Water Distribution. Meteor. Mon. 2015, 41, 1232–1244. (In Chinese) [Google Scholar]
- Wu, J.J.; Yang, C.J.; Xun, R.R.; Wang, L.; Yu, W.F.; Chen, Q. Analysis of Aircraft Icing Characteristics in Sichuan Basin Based on Cloudsat Data. Aeronaut. Comput. Tech. 2023, 53, 24–28. (In Chinese) [Google Scholar]
- Zhou, X.X.; Li, Y.Y.; Zhang, C. Study on the Forecasting Method and Application Scenario of Aircraft Icing. Meteor. Mon. 2023, 49, 415–426. (In Chinese) [Google Scholar]
- Mierzwiak, M.; Kroszczynski, K.; Araszkiewicz, A. WRF Parameterizations of Short-Term Solar Radiation Forecasts for Cold Fronts in Central and Eastern Europe. Energies 2023, 16, 5136. [Google Scholar] [CrossRef]

| WRF Physic Options | Domain 1 | Domain 2 |
|---|---|---|
| Mp_Physics | 10 | 10 |
| Cu_Physics | 1 | 1 |
| Ra_lw_Physics | 1 | 1 |
| Ra_sw_Physics | 1 | 1 |
| Bl_pbl_Physics | 1 | 1 |
| Sf_sfclay_Physics | 1 | 1 |
| Sf_surface_Physics | 2 | 2 |
| Radt | 15 | 15 |
| Cudt | 0 | 0 |
| Icloud | 1 |
Disclaimer/Publisher’s Note: The statements, opinions and data contained in all publications are solely those of the individual author(s) and contributor(s) and not of MDPI and/or the editor(s). MDPI and/or the editor(s) disclaim responsibility for any injury to people or property resulting from any ideas, methods, instructions or products referred to in the content. |
© 2024 by the authors. Licensee MDPI, Basel, Switzerland. This article is an open access article distributed under the terms and conditions of the Creative Commons Attribution (CC BY) license (https://creativecommons.org/licenses/by/4.0/).
Share and Cite
Liu, H.; Peng, S.; Fang, R.; Li, Y.; Duan, L.; Wang, T.; Mao, C.; Lin, Z. Analysis of the Meteorological Conditions and Atmospheric Numerical Simulation of an Aircraft Icing Accident. Atmosphere 2024, 15, 1222. https://doi.org/10.3390/atmos15101222
Liu H, Peng S, Fang R, Li Y, Duan L, Wang T, Mao C, Lin Z. Analysis of the Meteorological Conditions and Atmospheric Numerical Simulation of an Aircraft Icing Accident. Atmosphere. 2024; 15(10):1222. https://doi.org/10.3390/atmos15101222
Chicago/Turabian StyleLiu, Haoya, Shurui Peng, Rong Fang, Yaohui Li, Lian Duan, Ten Wang, Chengyan Mao, and Zisheng Lin. 2024. "Analysis of the Meteorological Conditions and Atmospheric Numerical Simulation of an Aircraft Icing Accident" Atmosphere 15, no. 10: 1222. https://doi.org/10.3390/atmos15101222
APA StyleLiu, H., Peng, S., Fang, R., Li, Y., Duan, L., Wang, T., Mao, C., & Lin, Z. (2024). Analysis of the Meteorological Conditions and Atmospheric Numerical Simulation of an Aircraft Icing Accident. Atmosphere, 15(10), 1222. https://doi.org/10.3390/atmos15101222