Abstract
Urban ventilation corridors are designed to enhance air quality, alleviate urban thermal conditions, reduce pollution and energy consumption, as well as improve human comfort within cities. They play a pivotal role in mitigating environmental impacts, particularly in densely populated urban areas. Based on satellite remote sensing data, meteorological observations, basic geographic information of Zhengzhou City and its surroundings, and urban planning data, we analyzed the urban wind environment, urban heat island, ecological cold sources, and ventilation potential. The findings reveal several key insights: (1) Dominant winds in Zhengzhou City predominantly originate from the northwest, northeast, and south, influenced by topography and the monsoon climate, with seasonal variations. These wind patterns are crucial considerations for designing primary ventilation corridors. (2) The urban heat island exhibits a polycentric spatial distribution, with intensity decreasing from the city center towards the periphery. Ecological cold sources, primarily situated in the city outskirts, act as reservoirs of fresh air that mitigate the urban heat island effect through designated corridors. (3) A preliminary corridor system, termed “eight primary and thirteen secondary corridors”, is proposed for Zhengzhou City based on an integrated assessment of ventilation potential, urban surface roughness, and sky view factor. This research contributes to advancing the understanding of urban ventilation systems and provides practical insights for policymakers, urban planners, and researchers seeking sustainable solutions to mitigate climate impacts in rapidly urbanizing environments in the region.
1. Introduction
With global warming and rapid urbanization, large-scale urban expansion and population growth are accompanied by a series of environmental and ecological problems [,,], such as heat island effect [,,], air pollution [], and vegetation degradation [,]. Rapid urban population growth and limited urban space have led to compact and high-density building layouts in most cities [,]. In high-density urban areas, the surface roughness increases, the temperature, wind field, humidity and other meteorological conditions near the surface change significantly, while the climate and environmental problems become increasingly prominent [,,]. Urban heat islands increase energy use in relatively hot areas and harm nearby water quality, increasing building and energy consumption, as well as affecting the health of city residents. Studies have shown that people in cities are at higher health risk during hot weather, especially in the face of climate change, urbanization, and an aging population [,,]. So, it is crucial to mitigate the urban heat island effect for enhancing thermal comfort, reducing energy consumption, and improving public health in urban areas. Therefore, it is important to consider the influence of climate factors in urban planning and development, and to optimize the urban ecological environment by planning the spatial distribution of buildings [,,,], optimizing building design, and greening urban areas to reduce the urban heat island effect and improve urban ventilation [,,].
Urban ventilation corridor, as an effective planning tool for coordinated solutions to urban climate problems, has been developed and implemented in many countries [,,,,,,,,,,]. As early as 1930, German scientists pointed out that urban planning and construction can affect or even change the local climate and air quality []. The city of Stuttgart takes urban environmental climate analysis as one of the tools to assist urban planning, providing technical support for the rational layout of urban green space, water systems, and other ecological spaces. Kress [] divided the urban ventilation corridor system into function space, compensation space, and air guiding passage according to the evaluation criteria of the underlying surface climate function proposed by the local circulation operation law. Japan uses the connection with the actual river, green space, street, and building space to establish “wind channels” [], so that fresh cold air can flow into the nearby urban space or deep into the urban hinterland, to ensure the effectiveness of air exchange and circulation in the urban near ground. In Hong Kong, ventilation corridors have been designed for waterfront sites to promote air circulation and bring sea breezes inland, thereby improving the climate of localized areas []. Many large cities in China, such as Beijing, Shanghai, Wuhan, Hefei, Xi’an, Guangzhou, Shenzhen, Chengdu, Dalian, Hangzhou, and Jinan, have carried out studies on urban ventilation corridors [,,,,,,,,,]. Considering the combination of building information and geographic information technology with meteorology, they use observation, multi-scale numerical simulation, and other methods to evaluate the ventilation environment at the urban scale and to propose guidance for urban planning.
Urban ventilation depends on the combination of multiple urban geometric parameters; the purpose of constructing urban ventilation corridor is to organize rationally urban space and create channels for air circulation [,]. The construction of ventilation corridors should consider not only roads but also water bodies and green spaces, while controlling the height, density, and distribution of buildings []. The influence of meteorological parameters such as wind speed, wind direction, temperature, and humidity on urban ventilation is also extremely important []. In the construction of urban multi-level ventilation corridor systems, the width, orientation, open space, adjacent interfaces, buildings, and other aspects are also the control indicators for the planning and construction of ventilation corridors [,].
Methods for urban wind environment assessment mainly include field observation, wind tunnel tests, and numerical simulations [,,]. The field observations are limited by the scarcity and uneven distribution of stations, and are not very generalizable and representative. Wind tunnel experiments are more accurate but mostly used for small-scale wind simulation with high simulation cost and long evaluation period, and are not applicable to the evaluation of natural ventilation at urban and regional scales. Numerical simulation methods for urban climate are mainly classified into mesoscale and microscale. the Weather research and forecasting (WRF) model [,] and computational fluid dynamics (CFD) [,,] model are often used to simulate the wind environment conditions to obtain a better understanding of urban ventilation at the city and neighborhood levels [,], but they require complex boundary condition configurations and model construction. Remote sensing and geographic information system (GIS) technologies can support spatially continuous extraction of information on urban surface morphology with high spatial resolution, independent of the scale of the study, and provide a new means of assessing ventilation environments at the urban scale [,,]. Utilizing building and urban form data in a geographical information system format, to calculate urban roughness length and building density to test the permeability and ventilation capacity of the urban form under prevailing wind conditions, can provide a reference for the planning of urban ventilation corridors [,,].
As a megacity in China, Zhengzhou’s climate and environmental problems are becoming increasingly prominent with the expansion of the city’s scale and urbanization [,]. There is an urgent need to explore the application of urban climate information in sustainable urban planning. We hope that through the rational construction of ventilation corridors in Zhengzhou, the ventilation capacity of the city will be improved, thus improving the urban climate and creating a good living environment. In this study, we combine the urban climate information of Zhengzhou City with urban development planning, consider the characteristics of urban wind and thermal environments, combine the spatial layout of the city, and utilize remote sensing inversion, climate statistics, and geographic information system spatial analysis to assess the urban ventilation environment, so as to provide technical support for urban planning.
2. Materials and Methods
2.1. Study Area
Zhengzhou is the capital of Henan Province, a megacity in China. It is located in the southern part of the North China Plain and the lower reaches of the Yellow River, with a continental monsoon climate. The terrain is high in the west and low in the east, with the Yellow River in the north, Songshan Mountain in the west, and the vast Huanghuai Plain in the southeast. The city covers an area of approximately 7889 km2, with a population of 1300.8 million in 2023; the main urban area of Zhengzhou City was selected as the study area with nine administrative districts and a total area of 990 km2. Figure 1 shows the location and elevation of the study area. The changes in population and urbanization rate in Zhengzhou City over time are shown in Figure 2. It can be seen that after 2000, the population and urbanization rate increased significantly, and tended to stabilize after 2016.
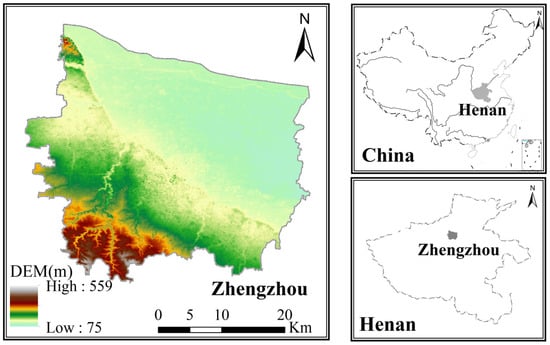
Figure 1.
Location and elevation of the study area.
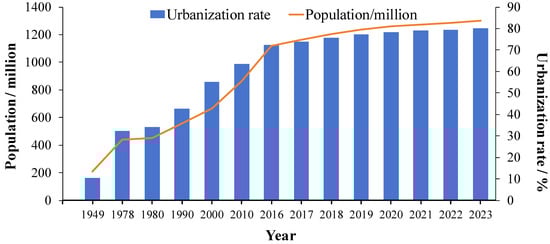
Figure 2.
Change in population and urbanization rate in Zhengzhou City.
2.2. Data
The satellite remote sensing data, derived from the Geospatial Data Cloud website (http://www.gscloud.cn, accessed on 22 September 2018), are used to extract ecological cold source and land surface temperature inversion, which mainly contain satellite images of the clear sky on 22 September 2018 of Zhengzhou, from Landsat-8 OLI with a resolution of 30 m. The meteorological observation data come from Henan Meteorological Bureau, including wind direction covering 49 national stations in Zhengzhou and its surrounding areas from 1991 to 2020 for statistical analysis of large-scale wind environment as well as wind direction data from 69 regional automatic stations in Zhengzhou City from 2015 to 2017 for refined wind field statistics analysis. The basic geographic information data, collected from the urban planning department including the 1:2000 topographic map of Zhengzhou in 2018 with building height and building density, are used to extract the morphological characteristics of urban buildings, calculate the surface roughness and sky view factor, and estimate the surface ventilation potential.
The urban planning data are used for the analysis of urban morphology and the identification of ventilation corridors, which are obtained from Zhengzhou Natural Resources Bureau, mainly including urban master planning, green space system planning, urban ecological protection and construction planning, etc.
2.3. Method
Based on the multisource data collected above, urban wind environment, thermal environment, and surface ventilation potential are calculated using mathematical statistics, remote sensing, and geographic information system techniques.
2.3.1. Urban Heat Island
Urban heat island (UHI) is the temperature difference between urban and rural areas. Surface temperatures obtained from satellite image inversion are used to calculate the UHI. The specific calculation is as follows:
where Ii is the intensity of surface urban heat island (SUHI) of the ith pixel, expressed in degrees Celsius (°C),; Ti is the surface temperature of the ith pixel, Tcropj is the temperature of the j pixel in the farmland area, and N is the total number of all pixels in the farmland area [].
SUHI can be divided into daily heat island intensity (Iday) and monthly or seasonal heat island intensity (Imth,ssn) [,]. The grades of SUHI are shown in Table 1. In this paper, the spatial distribution of SUHI is obtained by using the daily grades.

Table 1.
Classification of SUHI.
2.3.2. Ecological Cold Source
Ecological cold sources are areas capable of generating fresh cold air, generally referring to water bodies, forest lands, farmlands, and high-cover green spaces in cities. They can effectively alleviate the UHI effect, and are also an important source of cold air and a place to improve the circulation and living environment, which is one of the important prerequisites for ventilation corridor planning.
The two indicators, land use type and green quantity, extracted from remote sensing images, are used jointly to determine the ecological cold source class (Table 2) [,], and the Landsat normalized vegetation index (NDVI) data are used to estimate the green quantity S in urban areas:
where: S represents green quantity—unit is square meter (m2); V represents vegetation index; Rnir ~Landsat near-infrared band reflectance; Rred ~reflectance of satellite in red band.
Table 2.
Classification of the ecological cold source.
2.3.3. Surface Roughness Length
Surface roughness length is the height at which the near-surface wind speed in the atmospheric boundary layer decreases to zero and indicates the surface roughness in urban and vegetated areas, which is used to characterize the degree of surface irregularity and heterogeneity of the surface. The calculation of surface roughness is categorized into natural surface roughness and urban surface roughness. For urban areas, the urban morphology model established by Grimmond [] is adopted for estimation:
Z0 is the roughness length in meters, Zh is the building height in meters; Zd is the height of zero plane displacement in meters; Zd/Zh is the normalized zero plane displacement height; Uh is the wind speed at the height of the building in m/s; u* is fiction velocity in m/s; λF is the frontal area of urban building per unit area, which is called the frontal area density, and it is an important index reflecting the wind permeability of urban buildings.
2.3.4. Sky View Factor
Sky View Factor (SVF) is a morphology parameter that indicates the extent to which the sky is obscured by surrounding obstacles, reflecting the geometry of different street channels in a city. In this study, the grid calculation model based on digital elevation proposed by Zakšek [] is used to estimate the sky view factor. The formula is as follows:
where SVF ranges between 0 and 1 and is dimensionless; γi stands for the elevation angle of the relief horizon at the ith azimuth; and n stands for the number of directions used to estimate the vertical elevation angle of the relief horizon.
2.3.5. Urban Ventilation Potential
Urban ventilation potential is the air circulation capacity determined by surface vegetation, building cover, and sky view factor. The ventilation potential grade is determined by the combination of sky view factor and surface roughness length, as shown in Table 3 [].
Table 3.
Classification of ventilation potential.
3. Results
3.1. Characteristics of Urban Climate
Annual temperatures in Zhengzhou are on an increasing trend, consistent with global and national warming. The number of high-temperature days has also increased year by year, especially after 2000, which is related to the development of the city. Rising temperatures tend to increase the intensity of UHI and the frequency of heat islands, especially in densely populated urban centers where the extreme high temperatures and the intensity of heat islands increase significantly in summer.
Annual precipitations range from 350 mm to 1000 mm, with significant inter-annual variability but with no clear trend. Precipitation is mainly concentrated in summer, accounting for more than half of the total. The number of rainy days in summer decreases slightly, but heavy precipitation increases.
Annual wind speeds show a decreasing trend, which is not only related to the regional climate change in the context of global warming but also to the influence of anthropogenic factors such as urbanization in Zhengzhou. The decrease in wind speed leads to an increase in the frequency of small and static winds, which is not conducive to urban ventilation and air pollution diffusion.
The urban climate of Zhengzhou City is moving towards warmer and drier conditions. These changes not only exacerbate the UHI effect, but also impede wet deposition of pollutants. In response to urban climate change and its impacts, we are introducing fresh cold air into urban areas through ventilation corridors, aiming to improve air mobility, mitigate the heat island effect, and improve human comfort for sustainable urban development.
3.2. Assessment of Urban Wind Environment
The urban ventilation corridor system mainly considers the primary and secondary corridors []. Primary urban corridors act as wind guides, blocking the spread of heat islands between cities and creating ecological separation. Secondary corridors play a role of conducting winds, cutting off the heat islands, connecting cold sources to heat island areas, and promoting air circulation.
To understand further the characteristics of the urban wind environment, we expanded the scope from Anyang in the north to Xuchang in the south, Kaifeng in the east, and Luoyang in the west, as the background field for the large-scale wind environment, which was used for the analysis of wind sources. Taking Zhengzhou City area and its counties, cities, and districts as the second layer, the fine urban wind environment was analyzed to identify the distribution of wind in different regions of the city.
3.2.1. Wind Rose in Zhengzhou City
The prevailing winds in Zhengzhou are northeasterly, southerly, and northwesterly, with frequencies of 8.9%, 8.5%, and 6.8%, respectively. The prevailing wind frequency is similar in all seasons, but slightly different in winter and summer. In summer, it is mainly influenced by the summer monsoon, which above all comes from the south. In winter, the winter monsoon is more influential, with northeasterly and westerly winds predominating (Figure 3).
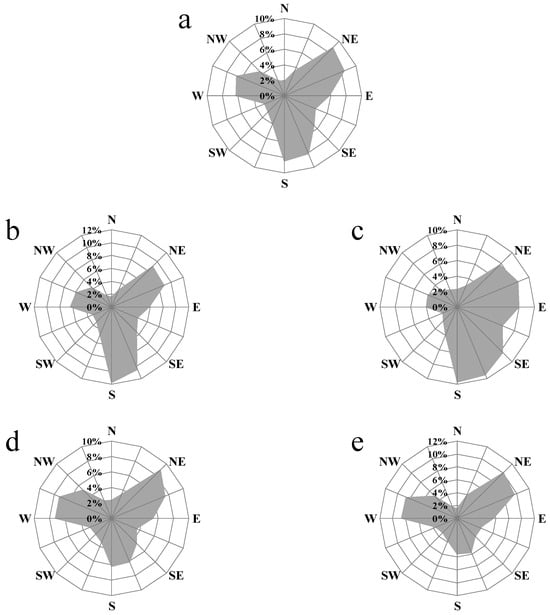
Figure 3.
Wind rose of Zhengzhou (1991–2020): (a) year; (b) spring; (c) summer; (d) autumn; (e) winter.
3.2.2. Background of Wind Environment
The spatial distribution of the first layer of the wind environment is shown in Figure 4. The prevailing wind in the northwest is northeast–southwest, influenced by the Taihang Mountains, with a northeast–southwest wind direction. In the southwest are the Songshan Mountains in a northwest–southeast direction, with prevailing winds in a northwest–southeast direction. In the east is a vast plain less than 100 m above sea level, and under the influence of the monsoon climate, the wind direction is north–south.
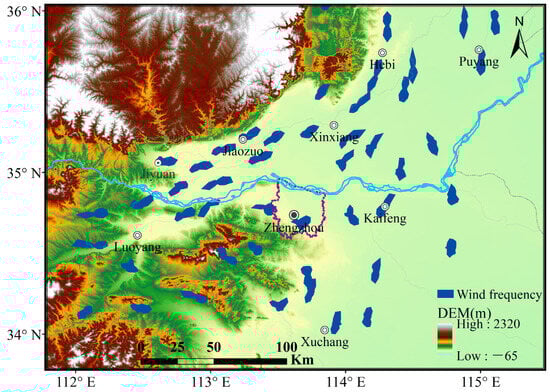
Figure 4.
Distribution of wind environment in the first layer.
Due to topographical and climatic characteristics, the ecological environment of the riverside forest ecological zone along the Yellow River in the north and the ecological reserve in the south of Zhengzhou is relatively good. Fresh, clean air affecting the central city is usually brought in by the north wind, which is more effective in improving the local climate environment and human comfort. Since the biggest role of the primary ventilation corridors in the city is to bring clean air from the ecological reserve outside the city to the central city smoothly, its direction should be set according to the regional background wind environment and the distribution of ecological cold sources. Therefore, the direction of the primary ventilation corridors in Zhengzhou should be designed with more consideration to the north–south direction, and be consistent with the background wind field as much as possible.
3.2.3. Refine Wind Environment
The wind frequency in different wind speed bands and different urban areas are somewhat different. Due to the influence of buildings, streets, and other factors, the direction of the secondary ventilation corridors should be set differently from the primary ventilation corridors, which pays more attention to the local wind direction in small and medium wind speed bands, with a speed of 0.3 m/s to 3.3 m/s [,]. Therefore, when determining urban secondary ventilation corridors, the distribution of soft and light winds is mainly considered.
The dominant wind directions for soft and light winds in Zhengzhou are mainly northeast, south, and west. In spring and summer, south and northeaster winds are obvious, while west winds are slightly less. In autumn and winter, northeasterly and westerly winds predominate, with slightly less southerly winds. In the second layer (Figure 5), the wind frequency varies in different areas of the city. The northern part of the city is influenced by the Yellow River and is dominated by east–west winds; the eastern part of the city is a plain with northeast–southwest winds. The western part of the city is influenced by different mountain ranges, with northeast–southwest winds dominating in the northwest and northwest–southeast winds in the southwest. Secondary ventilation corridors should be oriented as closely as possible to these directions.
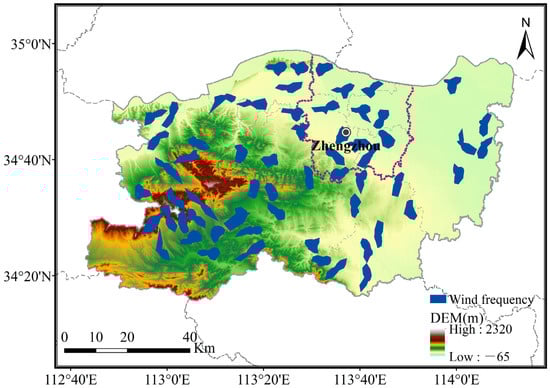
Figure 5.
Distribution of refined wind environment in the second layer.
3.3. Assessment of Urban Thermal Environment
Based on Landsat satellite image data, surface temperature inversion and urban green quantity estimation were carried out to analyze the spatial distribution of UHI and the ecological cold sources.
3.3.1. Urban Heat Island
Mitigating the UHI effect is an important purpose of ventilation corridor design, and the spatial distribution of heat islands should be fully considered in the identification of ventilation corridors. Based on the synthesized satellite remote sensing data, land use in Zhengzhou City, the ground temperature was inverted and the spatial distribution of SUHI in Zhengzhou City was mapped (Figure 6). It can be seen that the UHI of Zhengzhou is located in the densely populated and built-up area of the central city, and is distributed in a polycentric manner with the development of the city. The intensity is higher in urbanized and sparsely vegetated areas, industrial and warehousing areas, and lower in water bodies, parks, and green spaces.
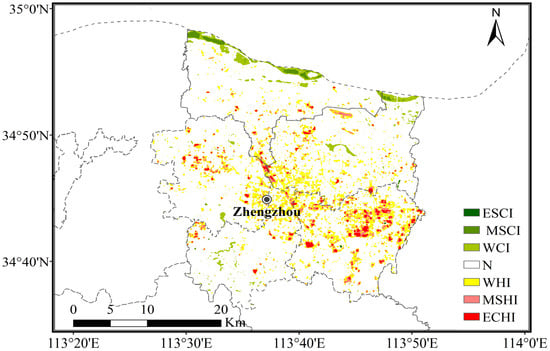
Figure 6.
Distribution of urban heat island intensity in Zhengzhou.
With the current development status of the city, the population density of the central city is relatively high and accompanied by the distribution of heat islands, some of which exhibit extremely strong heat islands. The southeastern region is an industrial storage area with large scale development and construction, with low green space coverage and moderate strong SUHI, indicating a strong heat absorption effect of urban buildings and roads. Due to the coverage of water systems, forests, and green spaces in the north and east of Zhengzhou, the intensity is weaker than in other urban areas, showing moderate strong cold island or neutral.
3.3.2. Ecological Cold Source
Ecological cold sources play an important role in mitigating UHI as a source of fresh and cold air. Zhengzhou’s ecological cold sources are mainly located in the north, east, and south of the city, and less in the city center (Figure 7). The cold source is extremely strong in the riverside forest ecological zone along the Yellow River in the north, and strong in the northeast and southwest; in the southern and southwestern parts of the city, the ecological cold source alternates from strong to weak. At the periphery, the western, and the eastern edges of the city, the ecological cold source is weak. Therefore, fresh air can be introduced from the north, northeast, and south to improve the urban thermal environment, and to provide cooling, humidification, and dust removal.
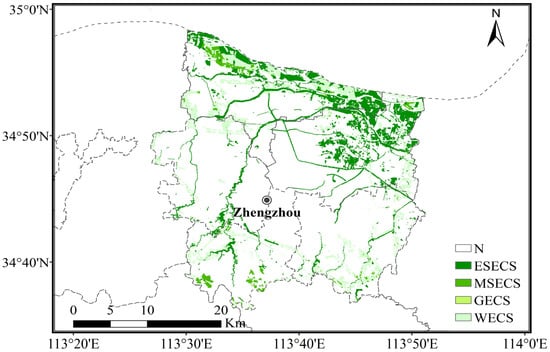
Figure 7.
Distribution of ecological cold source in Zhengzhou.
3.4. Assessment of Urban Ventilation Environment
Using building height, density, and land use data, urban surface parameters and spatial morphology parameters were extracted by remote sensing and GIS techniques to assess surface ventilation capacity.
3.4.1. Surface Roughness Length
There are many factors that affect surface roughness, but the key parameters are the coverage and height of buildings. In terms of the distribution of the underlying surface, water bodies have the least roughness, followed by green spaces, woodland, and roads. Surface roughness is lower in areas with low development intensity. Roughness lengths in Zhengzhou City (Figure 8) are generally over 1 m, mainly in the city center, and when the air flows through these areas, the wind speeds are significantly reduced. In urban fringe and most farmland, roughness lengths are relatively low, generally between 0.5 and 1.0 m. In most areas of the north and mid-west region, roughness lengths are relatively small, below 0.5 m, which facilitate urban ventilation and are less affected by air as it passes through.
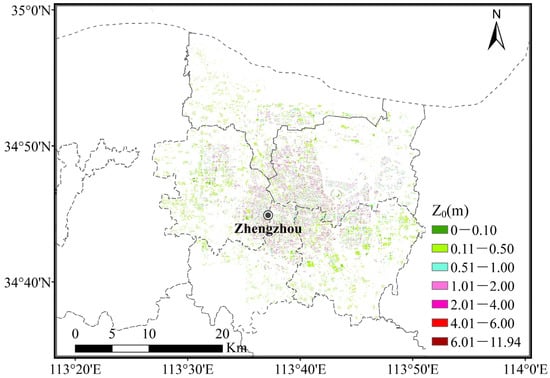
Figure 8.
Distribution of surface roughness in Zhengzhou.
3.4.2. Sky View Factor
Figure 9 shows the distribution of the sky view factor. Lower SVF values are found in areas with dense and taller buildings, mainly in the central city of Zhengzhou, where the SVF values are generally below 0.5, indicating that the openness of the sky in these areas is severely obscured. The SVF gradually increases from the central city to the suburbs, with less shading outside the central city. In Zhengdong New District, Huiji District, western Zhongyuan District, and southern Erqi District, there is less urban shading, and the values are all above 0.9, indicating a better SVF.
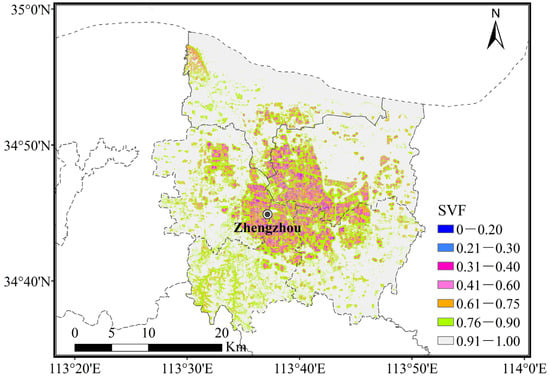
Figure 9.
Distribution of sky view factor in Zhengzhou.
3.4.3. Urban Ventilation Potential
Ventilation potential is one of the important reference bases for identifying urban ventilation corridors. Based on the surface roughness and sky view factor, the ventilation potential of the central city of Zhengzhou was calculated and its high-resolution distribution map obtained. Figure 10 shows that areas close to the periphery have a higher ventilation potential, while areas with high urban density have a lower one. Most of the central, southeastern, northern, and western areas have a ventilation potential grade of 1–2. These areas are densely built-up areas with fewer parks and green spaces and relatively narrow roads, resulting in poor ventilation potential. Ventilation potential grades of 3–5 are found in most of the northern, southeastern, central, and western portions of the region, which have relatively good air circulation and high ventilation potential.
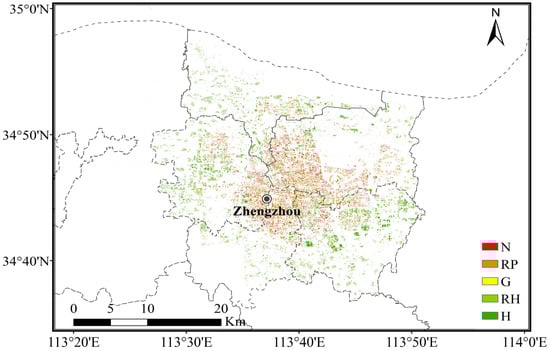
Figure 10.
Distribution of ventilation potential in Zhengzhou.
Areas with higher ventilation potential are mainly green spaces, rivers, farmlands, wide streets, and areas with low and scattered buildings, while areas with dense buildings and narrow streets have relatively low ventilation potential. An important means to identify ventilation corridors is to connect and communicate effectively these areas of high ventilation potential to realize the transfer of fresh air from the city and mitigate the UHI.
3.5. Construction of Urban Ventilation Corridor
3.5.1. Construction Principle of Ventilation Corridor
The construction of urban ventilation corridors, as an integral part of urban planning, should be in accordance with the characteristics of the local natural landscape and respect the reality of the existing urban structure [,,,,]. Ventilation corridors should pass through areas with high ventilation potential as much as possible, and the width of the corridors should take into account the current state of land use in the city center, the future planning, and the realistic conditions under which the corridors can be constructed and implemented. In conjunction with the current status of urban land use and urban planning, geographic information technology is utilized to initially construct primary and secondary urban ventilation corridors by superimposing the urban wind environment, thermal environment, distribution of ecological cooling sources and ventilation potential [,].
Primary urban ventilation corridors should run throughout the city, connecting ecological cold sources to the city center along areas with low surface roughness and high ventilation potential, high ventilation in the suburbs, low ventilation in the urban areas, weak ventilation in the city center, and high heat island intensity, relying on existing transportation arteries, rivers, parks, green spaces, and urban high voltage line corridors connecting recreational lands and other types of open spaces. Secondary ventilation corridors should be planned along areas with high ventilation potential, connecting ecological cold sources to densely built-up areas and to neighboring areas with significant differences in ventilation capacity, in order to compensate for areas within the city with low ventilation capacity and high heat island intensity that are not connected to primary ventilation corridors [,,,]. Secondary ventilation corridors, utilizing existing streets, rivers, parks, and green spaces in the city as carriers of the corridors, should complement and extend the efficiency of primary ventilation wherever possible.
3.5.2. Urban Ventilation Corridor System in Zhengzhou
Based on the spatial distribution of the urban thermal environment, ecological cold sources, functional space, and compensation space, in combination with Zhengzhou’s urban master plan and special planning for green space system, the pattern of urban ventilation corridor system of “eight main and thirteen secondary” was preliminarily identified. Ventilation corridors connect ecological green spaces such as parks and water systems, with linear open areas such as urban arterials and point openings, to bring fresh air into urban areas, creating a good ventilation cycle and improving the effect of microclimate.
The primary ventilation corridors identified in this study are roads, rivers, green land areas, and a combination of the three, with a width of more than 200 m and running through the city. Corridors are important air guiding channels under dominant wind conditions, blocking the expansion and development of UHI, and playing a role in separating urban space and controlling urban layout and development patterns.
The secondary ventilation corridors are mainly located in the urban interior, as the “urban ventilation veins” extend from the primary corridors to the city, showing the spatial distribution characteristics of “six horizontal and seven vertical, external bearing and internal connections”. Secondary corridors are 50 m or more in width, aligned with the directions of higher frequency of soft and light winds, direct fresh air from the suburbs to areas of higher heat island intensity, and improved air circulation.
4. Discussion
With remote sensing, GIS technologies, and multi-source data, we identified a corridor system for Zhengzhou City. We expanded the scope to assess the wind environment, and not just limited to the local wind characteristics. In order to test the “ventilation and cooling” effect of the corridor, we used portable automatic weather stations and selected the central business district (CBD) on Zhongzhou Avenue, the primary ventilation corridor, as observation point 1 and a location 400 m away from the CBD as observation point 2. Then, we carried out 24 h simultaneous uninterrupted continuous meteorological element observation comparisons under the typical weather conditions of small to medium winds with good air quality on 19–20 August 2019.
As can be seen from the comparison of the wind speeds at the two observation points (Figure 11a), the variation of the wind speeds is similar during the observation period, and when the wind speed is greater than 1 m/s, the average wind speed at the observation point of the ventilated corridor is obviously greater than that of the observation point of the non-ventilated corridor; whereas in the case of small wind speeds (less than 1 m/s), there is not much difference in the observed values of the wind speeds at the two points. This shows that in the background of small and medium wind speeds, the ventilation corridor can make the wind speed increase significantly, while in static winds or near static winds, the effect of the corridor on the wind speed is not obvious.
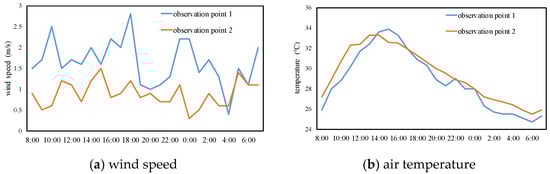
Figure 11.
Comparison of observation points in ventilated and non-ventilated corridors: (a) wind speed, (b) air temperature.
From the comparative observation of air temperature (Figure 11b), it can be seen that the observed value of air temperature at site 1 (28.8 °C) is about 0.6 °C lower than that at site 2 (29.4 °C), which means that the cooling effect of the ventilation corridor is more obvious; whereas in the afternoon from 14:00 to 17:00, due to the road’s small heat capacity and more obvious heat absorption, the observed value of air temperature at site 1 (33.6 °C) is slightly higher than that of site 2 (33.3 °C), which results in the temperature at the observation site being also slightly higher than that at the non-ventilated corridor. Therefore, it is important to increase the green space around the corridors and to ensure the greening of the road-type ventilation corridor. And numerous studies have revealed that urban water bodies and vegetation can effectively mitigate the UHI effect, which is conducive to urban cooling, humidification, and local flow field changes [,,,].
As an effective means of optimizing the urban ventilation environment, urban ventilation corridors can effectively improve the urban ecological environment and play an important role in improving the urban climate. Reasonable corridor settings play an obvious role in improving the local wind and heat environment [,,]. Urban ventilation corridors are mainly considered ventilation for large-scale; at the regional or neighborhood scale, regional or neighborhood wind and thermal environments can be evaluated with mesoscale models such as WRF and CFD software, combined with observations from meteorological stations. It is recommended that on the basis of the identified urban ventilation corridors, the overall layout of the city’s future development should be rationally planned, the urban structure should be optimized, and the research on the impact of the climate environment on the planning of the central urban area of Zhengzhou should be strengthened and climate feasibility demonstrated. This will ensure that the regional planning and the ventilation effect of the corridors are improved to the maximum extent.
Seeking ways to optimize urban morphology is a daunting but important task for urban planning in coping with climate change and the development of urbanization in the future. (1) Protecting the cold source space around the city: The farmland, woodland, and water area around Zhengzhou are the cold source compensation space and clean air generation area; attention should be paid to protecting and controlling these spaces and avoiding development, construction, and productivity distribution in these areas. (2) Improving the urban open space system: There is a close correlation between urban spatial layout and climate environment. Appropriately increasing the number of urban wedge-shaped green spaces, especially the formation of ribbon or surface green spaces, is conducive to the introduction of cold sources. (3) Adjusting and optimizing the spatial layout of the city: Combined with the renovation of old cities, the building density should be reduced, the greening rate should be increased, and priority should be given to freeing up land for the construction of urban green space. In the planning of new districts, combining the ventilation corridor system with urban water bodies, green areas, squares, and other open spaces as early as possible is more conducive to the improvement of urban air quality and the thermal comfort of urban residents. (4) Strict control and protection of ventilation corridors: Ventilation corridors should be protected through the development of guidelines for the control of different systems in regions, cities, and neighborhoods to avoid urban development and construction affecting the normal air circulation in the corridors. The ecological space area around the corridor should be kept at low density development to enhance the penetration of cold air compensation space into high-density building areas.
5. Conclusions
Based on multi-source data, this study comprehensively evaluated the wind and the thermal and ventilation environments of Zhengzhou City, and initially identified urban ventilation corridors in Zhengzhou City. (1) Influenced by the Taihang Mountains in the northwest, the Songshan Mountains in the west, and the Yellow River in the north, the prevailing winds in Zhengzhou are northeast, south, and northwest, varying slightly in different seasons. The direction of the city’s primary ventilation corridors was designed with greater consideration for consistency with the background wind field. Due to the influence of buildings, streets, and other factors, the dominant wind direction varies in different areas of the city, and secondary ventilation corridors should be identified to represent the local wind environments as much as possible, so as to provide the actual ventilation within the city. (2) With the development of the city, the UHI of Zhengzhou shows a trend of expanding scope and increasing intensity. The UHI has the characteristics of a multi-center spatial distribution, the intensity decreases from the urban area to the periphery, and the UHI exhibits an increasing pattern matching the urban development area. The UHI is positively correlated with urbanization indicators such as built-up area, urban population, and development intensity. Ecological cold sources are mainly located in the periphery of the city, mainly the mountains, river systems, farmland, and green areas, which serve as ecological compensation spaces to introduce fresh cold air into the city and alleviate the UHI effect. (3) On the basis of comprehensive evaluation of urban ventilation potential by combining urban surface roughness and sky view factors, combined with refined wind fields and UHI while taking into account the influence of surface ventilation environment, a preliminary urban ventilation corridor system pattern of “eight primary and thirteen secondary” in Zhengzhou City based on river wind corridors, green space wind corridors, and road wind corridors was identified. The primary corridors are more than 200 m wide and run through the city, playing a role in separating urban space and controlling urban pattern and development. The secondary corridors are wider than 50 m and follow the direction of soft and light winds, which can guide fresh air from the suburbs into areas with high SUHI, improve air circulation capacity, and alleviate the UHI.
The identification of ventilation corridors was achieved on the basis of considering the wind environment, heat environment, and ventilation environments, and is also inseparable from the planning and construction of the city. There are also certain limitations due to the impact of climate change and the increase in extreme weather on the urban thermal environment, as well as the impact of urban construction on the ventilation environment. In future study, it will be possible to further strengthen the comparative observation of corridor effects under different wind speed ranges of typical weather, and couple the rapidly updated urban mesoscale meteorological model with the fine scale model that can be distinguished from streets and buildings, and apply it to evaluate quantitatively the impact of the corridor on local and regional climate and environment.
Author Contributions
Conceptualization, P.P. and Y.Z.; methodology, Y.Z. and Y.S.; software, F.L.; formal analysis, F.L.; investigation, P.X. and Y.S.; writing—original draft, P.P. and R.L.; writing—review and editing, F.L., R.L. and P.X.; supervision, P.P., R.L. and Y.Z. All authors have read and agreed to the published version of the manuscript.
Funding
This work was supported by Henan Provincial Science and Technology R&D Program Joint Fund (232103810098), Henan Provincial Science and Technology Research (242102320008), China Meteorological Administration Key Open Laboratory of Transforming Climate Resources to the Economy (No. 2024002K), and the Basic Research Fund of the Chinese Academy of Meteorological Science (Grant No. 2023Z016).
Data Availability Statement
The original contributions presented in the study are included in the article, further inquiries can be directed to the corresponding author/s.
Conflicts of Interest
The authors declare no conflicts of interest.
References
- Kalnay, E.; Cai, M. Impact of urbanization and land-use change on climate. Nature 2003, 423, 528–531. [Google Scholar] [CrossRef] [PubMed]
- Karl, T.; Diaz, H.; Kukla, G. Urbanization: Its detection and effect in the United States climate record. J. Clim. 1988, 1, 1099–1123. [Google Scholar] [CrossRef]
- Lim, Y.; Cai, M.; Kalnay, E.; Zhou, L. Observational evidence of sensitivity of surface climate changes to land types and urbanization. Geophy Res. Lett. 2005, 32, L22712. [Google Scholar] [CrossRef]
- Yang, X.; Hou, Y.; Chen, B. Observed surface warming induced by urbanization in east China. J. Geophys. Res. 2011, 116, D14113. [Google Scholar] [CrossRef]
- Sun, Y.; Zhang, X.; Ren, G.; Francis, W.; Hu, T. Contribution of urbanization to warming in China. Nat. Clim. Chang. 2016, 6, 706–709. [Google Scholar] [CrossRef]
- Miles, V.; Esau, I.; Miles, M. The urban climate of the largest cities of the European Arctic. Urban Clim. 2023, 48, 101423. [Google Scholar] [CrossRef]
- Han, L.; Zhou, W.; Li, W.; Li, L. Impact of urbanization level on urban air quality: A case of fine particles (PM2.5) in Chinese cities. Environ. Pollut. 2014, 194, 163–170. [Google Scholar] [CrossRef]
- Patra, S.; Sahoo, S.; Mishra, P.; Mahapatra, S. Impacts of urbanization on land use/cover changes and its probable implications on local climate and groundwater level. J. Urban Manag. 2018, 7, 70–84. [Google Scholar] [CrossRef]
- Song, B.; Park, K. Temperature trend analysis associated with land-cover changes using time-series data (1980–2019) from 38 weather stations in South Korea. Sustain. Cities Soc. 2021, 65, 102615. [Google Scholar] [CrossRef]
- Cui, L.; Shi, J. Urbanization and its environmental effects in Shanghai, China. Urban Clim. 2012, 2, 1–15. [Google Scholar] [CrossRef]
- Svensson, M.; Eliasson, I. Diurnal air temperatures in built-up areas in relation to urban planning. Landsc. Urban Plan. 2002, 61, 37–54. [Google Scholar] [CrossRef]
- Ngarambe, J.; Nganyiyimana, J.; Kim, I.; Santamouris, M.; Yun, G. Synergies between urban heat island and heat waves in Seoul: The role of wind speed and land use characteristics. PLoS ONE 2020, 15, e0243571. [Google Scholar] [CrossRef]
- Kumari, P.; Gary, V.; Kumar, R.; Kumar, K. Impact of urban heat island formation on energy consumption in Delhi. Urban Clim. 2021, 36, 100763. [Google Scholar] [CrossRef]
- Li, X.; Zhou, Y.; Yu, S.; Jia, G.; Li, H.; Li, W. Urban heat island impacts on building energy consumption: A review of approaches and findings. Energy 2019, 174, 407–419. [Google Scholar] [CrossRef]
- Heaviside, C.; Macintyre, H.; Vardoulakis, S. The Urban Heat Island: Implications for Health in a Changing Environment. Curr. Environ Health Rpt. 2017, 4, 296–305. [Google Scholar] [CrossRef] [PubMed]
- Badach, J.; Voordeckers, D.; Nyka, L.; Acker, M. A framework for Air Quality Management Zones—Useful GIS-based tool for urban planning: Case studies in Antwerp and Gdansk. Build. Environ. 2020, 174, 106743. [Google Scholar] [CrossRef]
- Ng, E.; Yuan, C.; Chen, L.; Ren, C.; Fung, J. Improving the wind environment in high-density cities by understanding urban morphology and surface roughness: A study in Hong Kong. Landsc. Urban Plan. 2011, 101, 59–74. [Google Scholar] [CrossRef]
- Yang, F.; Qian, F.; Lau, S. Urban form and density as indicators for summertime outdoor ventilation potential: A case study on high-rise housing in Shanghai. Build. Environ. 2013, 70, 122–137. [Google Scholar] [CrossRef]
- Gao, Y.; Yao, R.; Li, B.; Turkbeyler, E.; Luo, Q.; Short, A. Field studies on the effect of built forms on urban wind environments. Renew. Energy 2012, 46, 148–154. [Google Scholar] [CrossRef]
- Hang, J.; Li, Y. Ventilation strategy and air change rates in idealized high-rise compact urban areas. Build. Environ. 2010, 45, 2754–2767. [Google Scholar] [CrossRef]
- Rajagopalan, P.; Lim, K.; Jamei, E. Urban heat island and wind flow characteristics of a tropical city. Sol. Energy 2014, 107, 159–170. [Google Scholar] [CrossRef]
- Tong, Z.; Chen, Y.; Malkawi, A. Estimating natural ventilation potential for high-rise buildings considering boundary layer meteorology. Appl. Energ. 2017, 193, 276–286. [Google Scholar] [CrossRef]
- Matzarakis, A.; Mayer, H. Mapping of urban air paths for planning in Munich. Wiss. Ber. Inst. Meteorol. Klimafor Univ. Karlsr. 1992, 16, 13–22. [Google Scholar]
- Gál, T.; Unger, J. Detection of ventilation paths using high-resolution roughness parameter mapping in a large urban area. Build. Environ. 2009, 44, 198–206. [Google Scholar] [CrossRef]
- Suder, A.; Szymanowski, M. Determination of ventilation channels in urban area: A case study of Wrocław (Poland). Pure Appl. Geophys. 2014, 171, 965–975. [Google Scholar] [CrossRef]
- Osińska, K.; Zawalich, J. Analysis of land use changes of urban ventilation corridors in Warsaw in 1992–2015. Geogr Pol. 2016, 89, 345–358. [Google Scholar]
- Marzena, W.; Andreas, W.; Katarzyna, O. Detection of ventilation corridors using a spatio-temporal approach aided by remote sensing data. Eur. J. Remote Sens. 2017, 50, 254–267. [Google Scholar]
- Son, J.; Eum, J.; Kim, S. Wind corridor planning and management strategies using cold air characteristics: The application in Korean cities. Sustain. Cities Soc. 2022, 77, 103512. [Google Scholar] [CrossRef]
- Diem, N.; Diem, P.; Thien, P.; Downes, N. Monitoring Urban Heat Island Spatial Variability over Urban Structure Types–A Case Study from a Fast-growing City in the Vietnamese Mekong Delta. IOP Conf. Ser. Earth Environ. Sci. 2024, 1345, 012001. [Google Scholar] [CrossRef]
- Diem, P.; Hong, T.; Diem, N.; Downes, N. Assessing the Relationship Between Land Surface Temperature and Air Temperature for Thermal Comfort Analysis in Can Tho City: Implications for Sustainable Spatial Planning. IOP Conf. Ser. Earth Environ. Sci. 2024, 1345, 012002. [Google Scholar] [CrossRef]
- Katzschner, A.; Diem, N.K.; Dang, T.; Downes, N. The Challenge of Cooling Rapidly Growing Cities: The Case of Densification and Peri-Urbanisation in Ho Chi Minh City and Adaptation Responses. In Climate Change and Cooling Cities; Springer Nature: Singapore, 2023; pp. 115–127. [Google Scholar]
- Katzschner, L.; Burghardt, R.; Kupski, S.; Campe, S. Urban climate. Sustainable Ho Chi Minh City: Climate Policies for Emerging Mega Cities; Springer: Cham, Switzerland, 2016; pp. 117–131. [Google Scholar]
- Ng, E.; Katzschner, L.; Wang, U. Initial methodology of urban climatic mapping-urban climatic map and standards for wind environment-feasibility study. Tech. Rep. Plan. Dep. HKSAR 2007. [Google Scholar]
- Kress, R. Regional Luftaustauschprozesse und Ihre Bedeutung fur die Raumliche Planung; Institue fur Umwelschutz der Universitat Dortmund: Dortmund, Germany, 1979; pp. 154–168. [Google Scholar]
- Ren, C.; Yang, R.; Cheng, C.; Xing, P.; Fang, X.; Zhang, S.; Wang, H.; Shi, Y.; Zhang, X.; Kwok, Y.; et al. Creating breathing cities by adopting urban ventilation assessment and wind corridor plan—The implementation in Chinese cities. J. Wind. Eng. Ind. Aerod. 2018, 182, 170–188. [Google Scholar] [CrossRef]
- Ng, E. Policies and technical guidelines for urban planning of high-density cities—Air ventilation assessment (AVA) of Hong Kong. Build. Environ. 2009, 44, 1478–1488. [Google Scholar] [CrossRef]
- Liu, Y.; Xuan, C.; Xu, Y.; Fu, N.; Xiong, F.; Gan, L. Local climate effects of urban wind corridors in Beijing. Urban Clim. 2022, 43, 101181. [Google Scholar] [CrossRef]
- Gong, D.; Dai, X.; Zhou, L. Satellite-Based Optimization and Planning of Urban Ventilation Corridors for a Healthy Microclimate Environment. Sustainability 2023, 15, 15653. [Google Scholar] [CrossRef]
- Xie, P.; Liu, D.; Liu, Y.; Liu, Y. A Least Cumulative Ventilation Cost Method for Urban Ventilation Environment Analysis. Complexity 2020, 2020, 9015923. [Google Scholar] [CrossRef]
- Fang, Y.; Gu, K.; Qian, Z.; Sun, Z.; Wang, Y.; Wang, A. Performance evaluation on multi-scenario urban ventilation corridors based on least cost path. J. Urban Manag. 2021, 10, 3–15. [Google Scholar] [CrossRef]
- Zhang, S.; Fang, X.; Cheng, C.; Chen, L.; Zhang, L.; Yu, Y.; Li, L.; Luo, H. Research on the Planning Method and Strategy of Urban Wind and Heat Environment Optimization—Taking Shenzhen, a Sub-Tropical Megacity in Southern China, as an Example. Atmosphere 2022, 13, 1395. [Google Scholar] [CrossRef]
- Wang, W.; Wang, D.; Chen, H.; Wang, B.; Chen, X. Identifying urban ventilation corridors through quantitative analysis of ventilation potential and wind characteristics. Build. Environ. 2022, 214, 108943. [Google Scholar] [CrossRef]
- Liu, X.; Huang, B.; Li, R.; Zhang, J.; Gou, Q.; Zhou, T.; Huang, Z. Wind environment assessment and planning of urban natural ventilation corridors using GIS: Shenzhen as a case study. Urban Clim. 2022, 42, 101091. [Google Scholar] [CrossRef]
- Guo, F.; Zhang, H.; Fan, Y.; Zhu, P.; Wang, S.; Lu, X.; Jin, Y. Detection and evaluation of a ventilation path in a mountainous city for a sea breeze: The case of Dalian. Build. Environ. 2018, 145, 177–195. [Google Scholar] [CrossRef]
- Dang, B.; Liu, Y.; Lyu, H.; Zhou, X.; Du, W.; Xuan, C.; Xing, P.; Yang, R.; Xiong, F. Assessment of Urban Climate Environment and Configuration of Ventilation Corridor: A Refined Study in Xi’an. J. Meteor. Res. 2022, 36, 914–930. [Google Scholar] [CrossRef]
- Liu, Y.; Cheng, P.; Chen, P.; Zhang, S. Detection of wind corridors based on “Climatopes”: A study in central Ji’nan. Theor. Appl. Climatol. 2020, 142, 869–884. [Google Scholar] [CrossRef]
- Carpentieri, M.; Robins, A. Influence of urban morphology on air flow over building arrays. J. Wind. Eng. Ind. Aerodyn. 2015, 145, 61–74. [Google Scholar] [CrossRef]
- Palusci, O.; Monti, P.; Cecere, C.; Montazeri, H.; Blocken, B. Impact of morphological parameters on urban ventilation in compact cities: The case of the Tuscolano-Don Bosco district in Rome. Sci. Total Environ. 2022, 807, 150490. [Google Scholar] [CrossRef]
- Guo, A.; Yue, W.; Yang, J.; Li, M.; Xie, P.; He, T.; Zhang, M.; Yu, H. Quantifying the impact of urban ventilation corridors on thermal environment in Chinese megacities. Ecol. Indic. 2023, 156, 111072. [Google Scholar] [CrossRef]
- Gu, K.; Fang, Y.; Qian, Z.; Sun, Z.; Wang, A. Spatial planning for urban ventilation corridors by urban climatology. Ecosyst. Health Sust. 2020, 6, 1747946. [Google Scholar] [CrossRef]
- Li, X.; Lin, K.; Shu, Y.; Lin, X. Comparison of the influences of different ventilation corridor forms on the thermal environment in Wuhan City in summer. Sci. Rep. 2023, 13, 13416. [Google Scholar] [CrossRef]
- Chen, Y.; Lin, T.; Lin, C. A simple approach for the development of urban climatic maps based on the urban characteristics in Tainan, Taiwan. Int. J. Biometeorol. 2017, 61, 1029–1041. [Google Scholar] [CrossRef]
- Johnson, G.; Hunter, L. Urban wind flows: Wind tunnel and numerical simulations—A preliminary comparison. Environ. Modell. Softw. 1998, 13, 279–286. [Google Scholar] [CrossRef]
- Xu, W.; Zhao, L.; Zhang, Y.; Gu, Z. Investigation on air ventilation within idealized urban wind corridors and the influence of structural factors with numerical simulations. Sustainability 2023, 15, 13817. [Google Scholar] [CrossRef]
- Zheng, Z.; Ren, G.; Gao, H.; Yang, Y. Urban ventilation planning and its associated benefits based on numerical experiments: A case study in beijing, China. Build. Environ. 2022, 222, 109383. [Google Scholar] [CrossRef]
- Xu, Y.; Wang, W.; Chen, B.; Chang, M.; Wang, X. Identification of ventilation corridors using backward trajectory simulations in Beijing. Sustain. Cities Soc. 2021, 70, 102889. [Google Scholar] [CrossRef]
- Antoniou, N.; Montazeri, H.; Wigo, H.; Neophytou, M.; Blocken, B.; Sandberg, M. CFD and wind-tunnel analysis of outdoor ventilation in a real compact heterogeneous urban area: Evaluation using “air delay”. Build. Environ. 2017, 126, 355–372. [Google Scholar] [CrossRef]
- Chang, S.; Jiang, Q.; Zhao, Y. Integrating CFD and GIS into the Development of Urban Ventilation Corridors: A Case Study in Changchun City, China. Sustainability 2018, 10, 1814. [Google Scholar] [CrossRef]
- Hsieh, C.; Huang, H. Mitigating urban heat islands: A method to identify potential wind corridor for cooling and ventilation. Comput. Environ. Urban 2016, 57, 130–143. [Google Scholar] [CrossRef]
- Chen, L.; Hang, J.; Sandberg, M.; Claesson, L.; Sabatino, S.; Wigo, H. The impacts of building height variations and building packing densities on flow adjustment and city breathability in idealized urban models. Build. Environ. 2017, 118, 344–361. [Google Scholar] [CrossRef]
- Liu, W.; Zhang, G.; Jiang, Y.; Wang, J. Effective range and driving factors of the urban ventilation corridor effect on urban thermal comfort at unified scale with multisource data. Remote Sens. 2021, 13, 1783. [Google Scholar] [CrossRef]
- Wong, M.; Nichol, J.; To, P.; Wang, J. A simple method for designation of urban ventilation corridors and its application to urban heat island analysis. Build. Environ. 2010, 45, 1880–1889. [Google Scholar] [CrossRef]
- Yuan, C.; Ren, C.; Ng, E. GIS-based surface roughness evaluation in the urban planning system to improve the wind environment—A study in Wuhan, China. Urban Clim. 2014, 10, 585–593. [Google Scholar] [CrossRef]
- Liu, Y.; Fang, X.; Cheng, C.; Luan, Q.; Du, W.; Xiao, X.; Wang, H. Research and application of city ventilation assessments based on satellite data and GIS technology: A case study of the Yanqi Lake Eco-city in Huairou District, Beijing. Meteorol. Appl. 2016, 23, 320–327. [Google Scholar] [CrossRef]
- Zhao, H.; Zhang, H.; Miao, C.; Ye, X.; Min, M. Linking Heat Source–Sink Landscape Patterns with Analysis of Urban Heat Islands: Study on the Fast-Growing Zhengzhou City in Central China. Remote Sens. 2018, 10, 1268. [Google Scholar] [CrossRef]
- Cai, E.; Bi, Q.; Lu, J.; Hou, H. The spatiotemporal characteristics and rationality of emerging megacity urban expansion: A case study of Zhengzhou in Central China. Front. Environ. Sci. 2022, 10, 860814. [Google Scholar] [CrossRef]
- Liu, Y.; Fang, X.; Xu, Y.; Zhang, S.; Luan, Q. Assessment of surface urban heat island across China’s three main urban agglomerations. Theor. Appl. Climatol. 2018, 133, 473–488. [Google Scholar] [CrossRef]
- Grimmond, C.; Oke, T. Aerodymamic Properties of Urban Areas Derived from Analysis of Surface Form. J. Appl. Meteorol. 1998, 38, 1262–1292. [Google Scholar] [CrossRef]
- Zakšek, K.; Oštir, K.; Kokalj, Ž. Sky-View Factor as a Relief Visualization Technique. Remote Sens. 2011, 3, 398–415. [Google Scholar] [CrossRef]
- Nichol, J.; Wong, M. Spatial variability of air temperature and appropriate resolution for satellite-derived air temperature estimation. Int. J. Remote Sens. 2008, 29, 7213–7223. [Google Scholar] [CrossRef]
- Huang, H.; Yang, H.; Chen, Y.; Chen, T.; Bai, L.; Peng, Z. Urban green space optimization based on a climate health risk appraisal—A case study of Beijing city, China. Urban For. Urban Gree. 2021, 62, 127154. [Google Scholar] [CrossRef]
- Hathway, E.; Sharples, S. The interaction of rivers and urban form in mitigating the Urban Heat Island effect: A UK case study. Build. Environ. 2012, 58, 14–22. [Google Scholar] [CrossRef]
- Yu, C.; Hien, W. Thermal benefits of city parks. Energy Buildings 2006, 38, 105–120. [Google Scholar] [CrossRef]
- Cheng, Y.; Shen, L.; Teng, M.; Liu, H.; Cheng, W.; Zhang, B.; Wu, C. How to use lake breeze circulations to improve urban natural ventilation: A case study in a typical inland multi-lake megacity. Landsc. Urban Plan. 2023, 230, 104628. [Google Scholar] [CrossRef]
Disclaimer/Publisher’s Note: The statements, opinions and data contained in all publications are solely those of the individual author(s) and contributor(s) and not of MDPI and/or the editor(s). MDPI and/or the editor(s) disclaim responsibility for any injury to people or property resulting from any ideas, methods, instructions or products referred to in the content. |
© 2024 by the authors. Licensee MDPI, Basel, Switzerland. This article is an open access article distributed under the terms and conditions of the Creative Commons Attribution (CC BY) license (https://creativecommons.org/licenses/by/4.0/).