Article

Patterns and Drivers of Greenhouse Gas Emissions in a Tropical Rubber Plantation from Hainan, Danzhou

by
Siqi Yang
1,2,3,4,
Yuanhong Xian
1,4,*,
Wei Tang
1,4,
Mengyang Fang
1,4,
Bo Song
2,3,5,
Qing Hu
2,3 and
Zhixiang Wu
2,3,*
1
Haikou Marine Geological Survey Center, China Geological Survey, Haikou 571127, China
2
Rubber Research Institute, Chinese Academy of Tropical Agricultural Sciences, Haikou 570216, China
3
Hainan DanzhouTropical Agro-Ecosystem National Observation and Research Station, Danzhou 571737, China
4
Sanya Land-Sea Interface Critical Zone Field Scientific Observation and Research Station, Sanya 572022, China
5
School of Accounting, Hainan Vocational University of Science and Technology, Haikou 571126, China
*
Authors to whom correspondence should be addressed.
Atmosphere 2024, 15(10), 1245; https://doi.org/10.3390/atmos15101245
Submission received: 25 September 2024 / Revised: 10 October 2024 / Accepted: 15 October 2024 / Published: 18 October 2024
(This article belongs to the Special Issue Agriculture-Climate Interactions in Tropical Regions)

Abstract

:
The intensification of global climate change has made the study of greenhouse gas (GHG) emissions increasingly important. To gain a deeper understanding of the emission characteristics and driving factors of nitrous oxide (N2O), carbon dioxide (CO2), and methane (CH4) from rubber plantation soils, this study conducted a 16-month continuous observation in a rubber plantation in Danzhou, Hainan, employing the static chamber method for the monthly sampling and measurement of GHG emissions while analyzing the soil’s physical and chemical properties. The results indicated that the N2O flux exhibited no significant diurnal variation between the dry and rainy seasons, with an average emission rate of 0.03 ± 0.002 mg·m−2·h−1. A clear seasonal trend was observed, with higher emissions in summer than in winter, resulting in an annual flux of 3 kg·hm−2·a−1 (equivalent to 1.9 kg N·hm−2·a−1). N2O emissions were significantly correlated with soil temperature and moisture, explaining 46% and 40% of the variations, respectively, while soil ammonium nitrogen content also significantly influenced N2O and CO2 emissions. The rubber plantation soil acted as a source of N2O and CO2 emissions and a sink for CH2, with lower emissions of N2O and CO2 during the daytime compared to nighttime, and higher CH4 uptake during the daytime. In the dry season, there was a significant positive correlation between N2O and CO2 emissions (R2 = 0.74, p < 0.001). This study reveals the diurnal and seasonal patterns of GHG emissions from rubber plantation soils in Hainan and their interrelationships, providing a scientific basis for the low-carbon management of rubber plantations and GHG mitigation strategies, thereby contributing to attempts to reduce the impact of rubber cultivation on climate change.

1. Introduction

Global climate change is one of the most severe environmental challenges of the 21st century, with greenhouse gas (GHG) emissions being a primary driving factor behind this phenomenon. Carbon dioxide (CO2), methane (CH4), and nitrous oxide (N2O) are the three major greenhouse gases in the atmosphere. Their increase not only leads to global warming but also triggers a series of complex climatic effects, such as more frequent extreme weather events, rising sea levels, and ecosystem imbalances [1,2,3]. Soil, as a significant sink and source of greenhouse gases in terrestrial ecosystems, plays a crucial role in the processes of GHG emissions and absorption [4]. Understanding the emission characteristics and influencing factors of soil greenhouse gases across different land use types has become an important topic in addressing climate change [4,5,6].
Rubber plantations (Hevea brasiliensis), as a tropical economic crop, are widely distributed in tropical regions such as Southeast Asia, South America, and Africa. The rapid expansion of rubber plantation areas in recent years has attracted considerable academic attention. The GHG emission characteristics of rubber plantation soils and their relationships with environmental factors have become focal points for researchers. Existing studies indicate that rubber plantation soils can be significant sources of CO2, N2O, and CH4 under certain conditions [6,7,8]. The emissions of these greenhouse gases are influenced by various factors, including soil temperature, moisture, vegetation types, and land management practices, as well as being closely related to the biochemical processes occurring in rubber plantation soils and their environmental conditions [9,10].
Research on GHG emissions from rubber plantation soils shows significant differences in emission characteristics under varying habitat conditions. For instance, studies have shown that CO2 emissions from rubber plantation soils are mainly influenced by soil respiration processes, including the microbial decomposition of organic matter and root respiration [8]. Conversely, N2O emissions are primarily associated with nitrification and denitrification processes, which are regulated by the forms of nitrogen in the soil, such as ammonium and nitrate [11,12]. Additionally, the organic carbon and total nitrogen contents in rubber plantation soils may have a certain correlation, suggesting complex interactions between the carbon and nitrogen cycles in the soil [13]. However, most of these studies focused on specific climatic zones or management practices, and limitations remain in comprehensively understanding the temporal variation characteristics and driving mechanisms of GHG emissions from rubber plantation soils.
Despite existing studies revealing some important characteristics of GHG emissions from rubber plantation soils, several unresolved questions remain. Notably, the influencing factors of N2O emissions and their relationship with other greenhouse gases, such as CO2, have not been systematically explored and analyzed in the current literature. Therefore, this study aims to further analyze the diurnal and seasonal variations in GHG emissions from rubber plantation soils, focusing on the relationship between GHG emissions and soil ammonium nitrogen concentration, as well as the correlation between N2O and CO2 emissions, to provide new insights into the GHG emission mechanisms of rubber plantations in tropical regions.

2. Materials and Methods

2.1. Study Site

The study was conducted at the National Field Scientific Observation and Research Station for Tropical Agricultural Ecosystems in Danzhou, Hainan (109°28′30″ E, 19°32′47″ N). The research area is characterized by a tropical humid monsoon climate, with an average annual temperature of 23.5 °C. Influenced by monsoons, the region experiences distinct wet and dry seasons, with an average annual precipitation of approximately 1815 mm. The rainy season occurs from May to October, accounting for 84% of the annual rainfall, while the dry season spans from November to the following April, contributing 16%. The average annual sunshine duration exceeds 2000 h, and solar radiation ranges from 110 to 130 kilocalories per square centimeter. The relative humidity is consistently above 80%, and the average wind speed ranges from 1 to 4 m·s−1. The predominant soil type is brick-red soil developed from granite, with a clayey texture, mostly sandy loam and sandy soils. Soil pH is 4.08 ± 0.37, with a moisture content of 19.58 ± 6.07%. Organic matter content is 15.0 ± 7.40 g·kg−1, total nitrogen content is 0.15 ± 0.06 g·kg−1, total phosphorus content is 0.06 ± 0.03 g·kg−1, and total potassium is 1.71 ± 1.56 g·kg−1 [14]. The rubber plantation features a simple plant community structure, consisting of a tree layer of rubber trees and an understory herbaceous layer. The understory is artificially interplanted with Strelitzia reginae, along with annual herbaceous and climbing plants. The planting configuration includes an inter-row spacing of 3.0 m and a row spacing of 7.0 m, with a planting density of 476 trees per hectare. The tapping season lasts from May to December, with tapping conducted every three days. From December to February of the following year, various management practices, such as pruning, fertilization, and weed control, are implemented in the plantation.

2.2. Sampling Methods

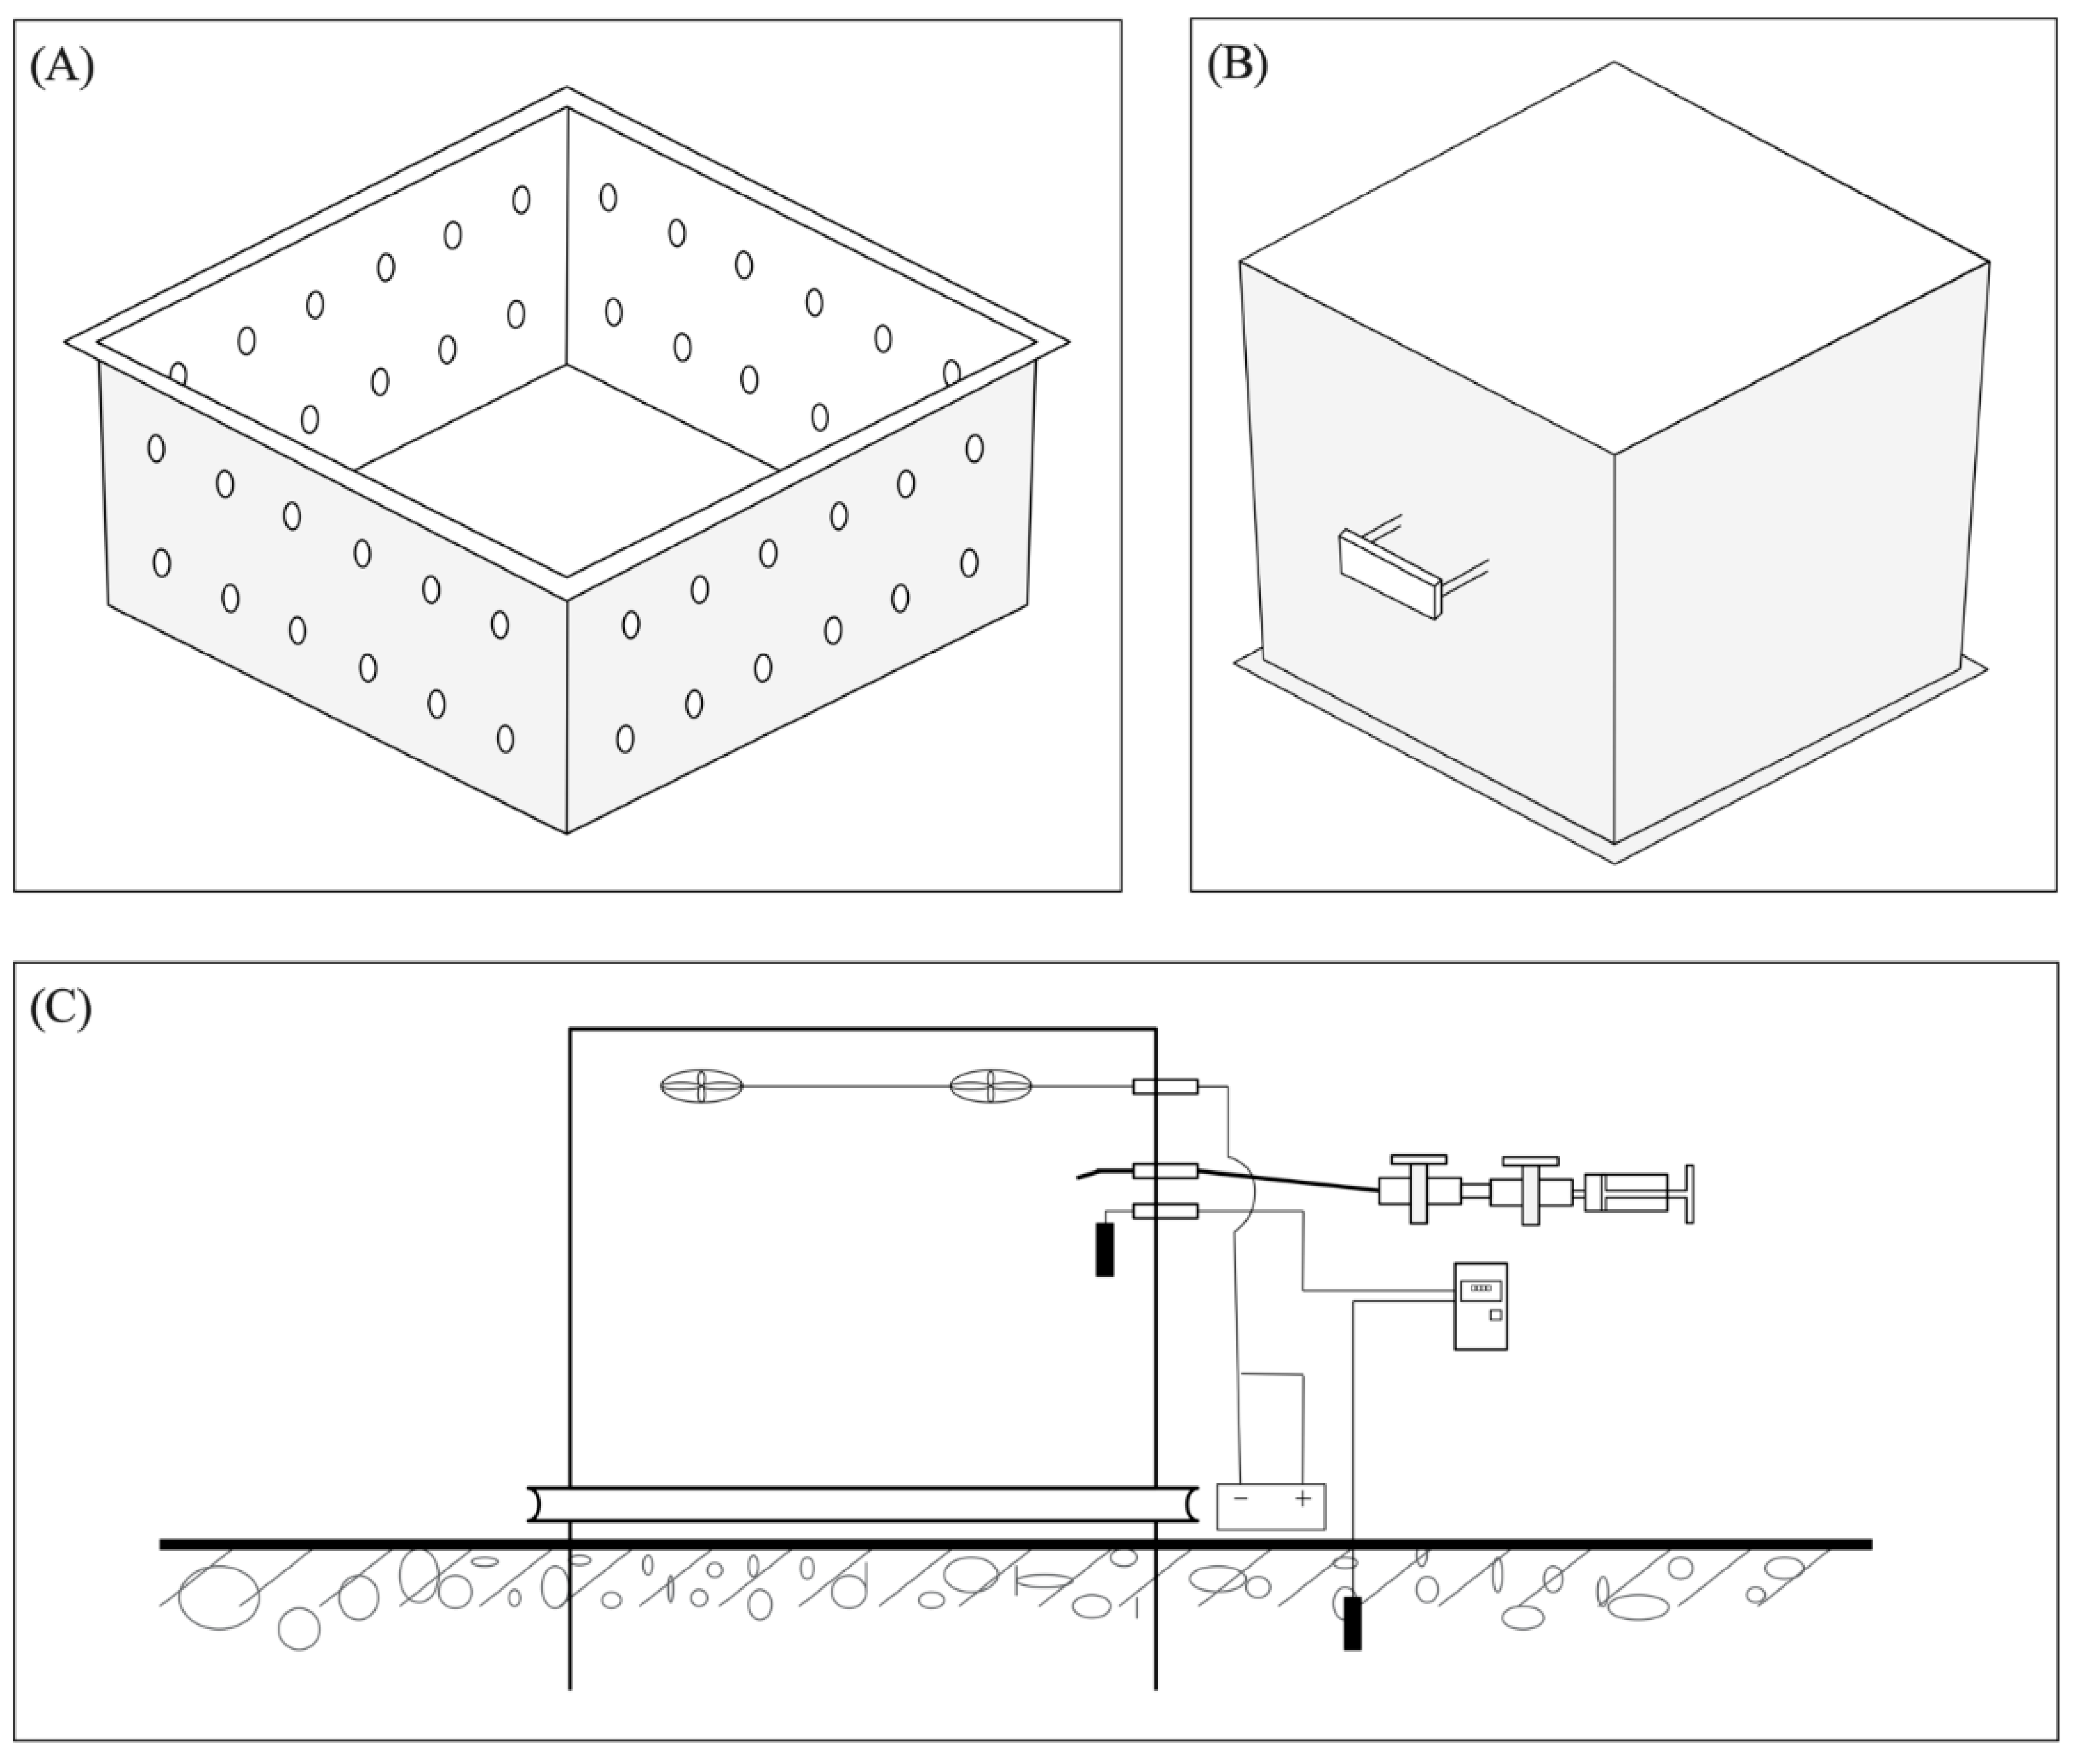
2.2.1. GHG Gas Sampling

From May 2022 to October 2023, greenhouse gas fluxes were measured once or twice monthly using the static chamber method. Five static chambers were randomly installed at the observation station, providing five spatial replicates. After installation, the chambers were allowed to recover naturally for one month to minimize the effects of soil disturbance on flux measurements. During the experimental period, all chambers remained in place; each chamber consisted of a stainless-steel base (50 × 50 × 10 cm) and a top enclosure (50 × 50 × 50 cm). To ensure proper moisture and nutrient circulation between the walls of the chamber base, small holes were left on the sidewalls of the base. A fan was installed inside each chamber to maintain gas homogeneity during sampling. Additionally, the outside of the chamber was insulated with a 2 cm thick layer of foam board. When not in use for sampling, the chambers were removed from the base to prevent disturbance to the soil within the base area. A schematic diagram was referenced from the Chinese Agricultural Industry Standard to monitor CH4 and N2O emission fluxes using the static chamber method (Figure 1).
Before each gas sampling, a water layer was injected into the slots of the base to seal the chamber. After closing the chamber, gas samples were collected at ten-minute intervals (0 min, 10 min, 20 min, and 30 min), and sampling times, along with air temperature and atmospheric pressure, were recorded. Sampling occurred monthly between 9:00 a.m. and 11:30 a.m. Gas samples, drawn from the sealed sampling chamber using a plastic syringe, were transferred to pre-prepared vacuum bottles for storage within 24 h. Once back in the laboratory, gas concentrations were analyzed using gas chromatography with an automated injection system (Agilent 7890B, Agilent Technologies Inc., Wilmington, NC, USA; GX-271, Gilson, Villiers le Bel, France).

2.2.2. Soil Sampling

The soil sampling points were located in the rubber tree inter-row regeneration areas, away from fertilization holes, as this region had similar soil total nitrogen and organic matter levels to the overall study area. Surface soil samples were collected in two layers: the first layer was from 0 to 20 cm and the second layer was from 20 to 40 cm. To minimize spatial heterogeneity, each sampling point included three replicates. After collection, soil samples were air-dried in a cool, ventilated area and passed through a 30-mesh sieve. They were then ground using a soil grinder (XPM-Φ120 × 3 three-head grinder, Wuhan Exploration Machinery Factory, Wuhan, China) to pass through a 100-mesh sieve. Soil organic carbon was measured using the potassium dichromate-concentrated sulfuric acid method, total nitrogen was determined by the semi-micro Kjeldahl method, and inorganic nitrogen was assessed using a colorimetric method [15].

2.3. Data Analysis

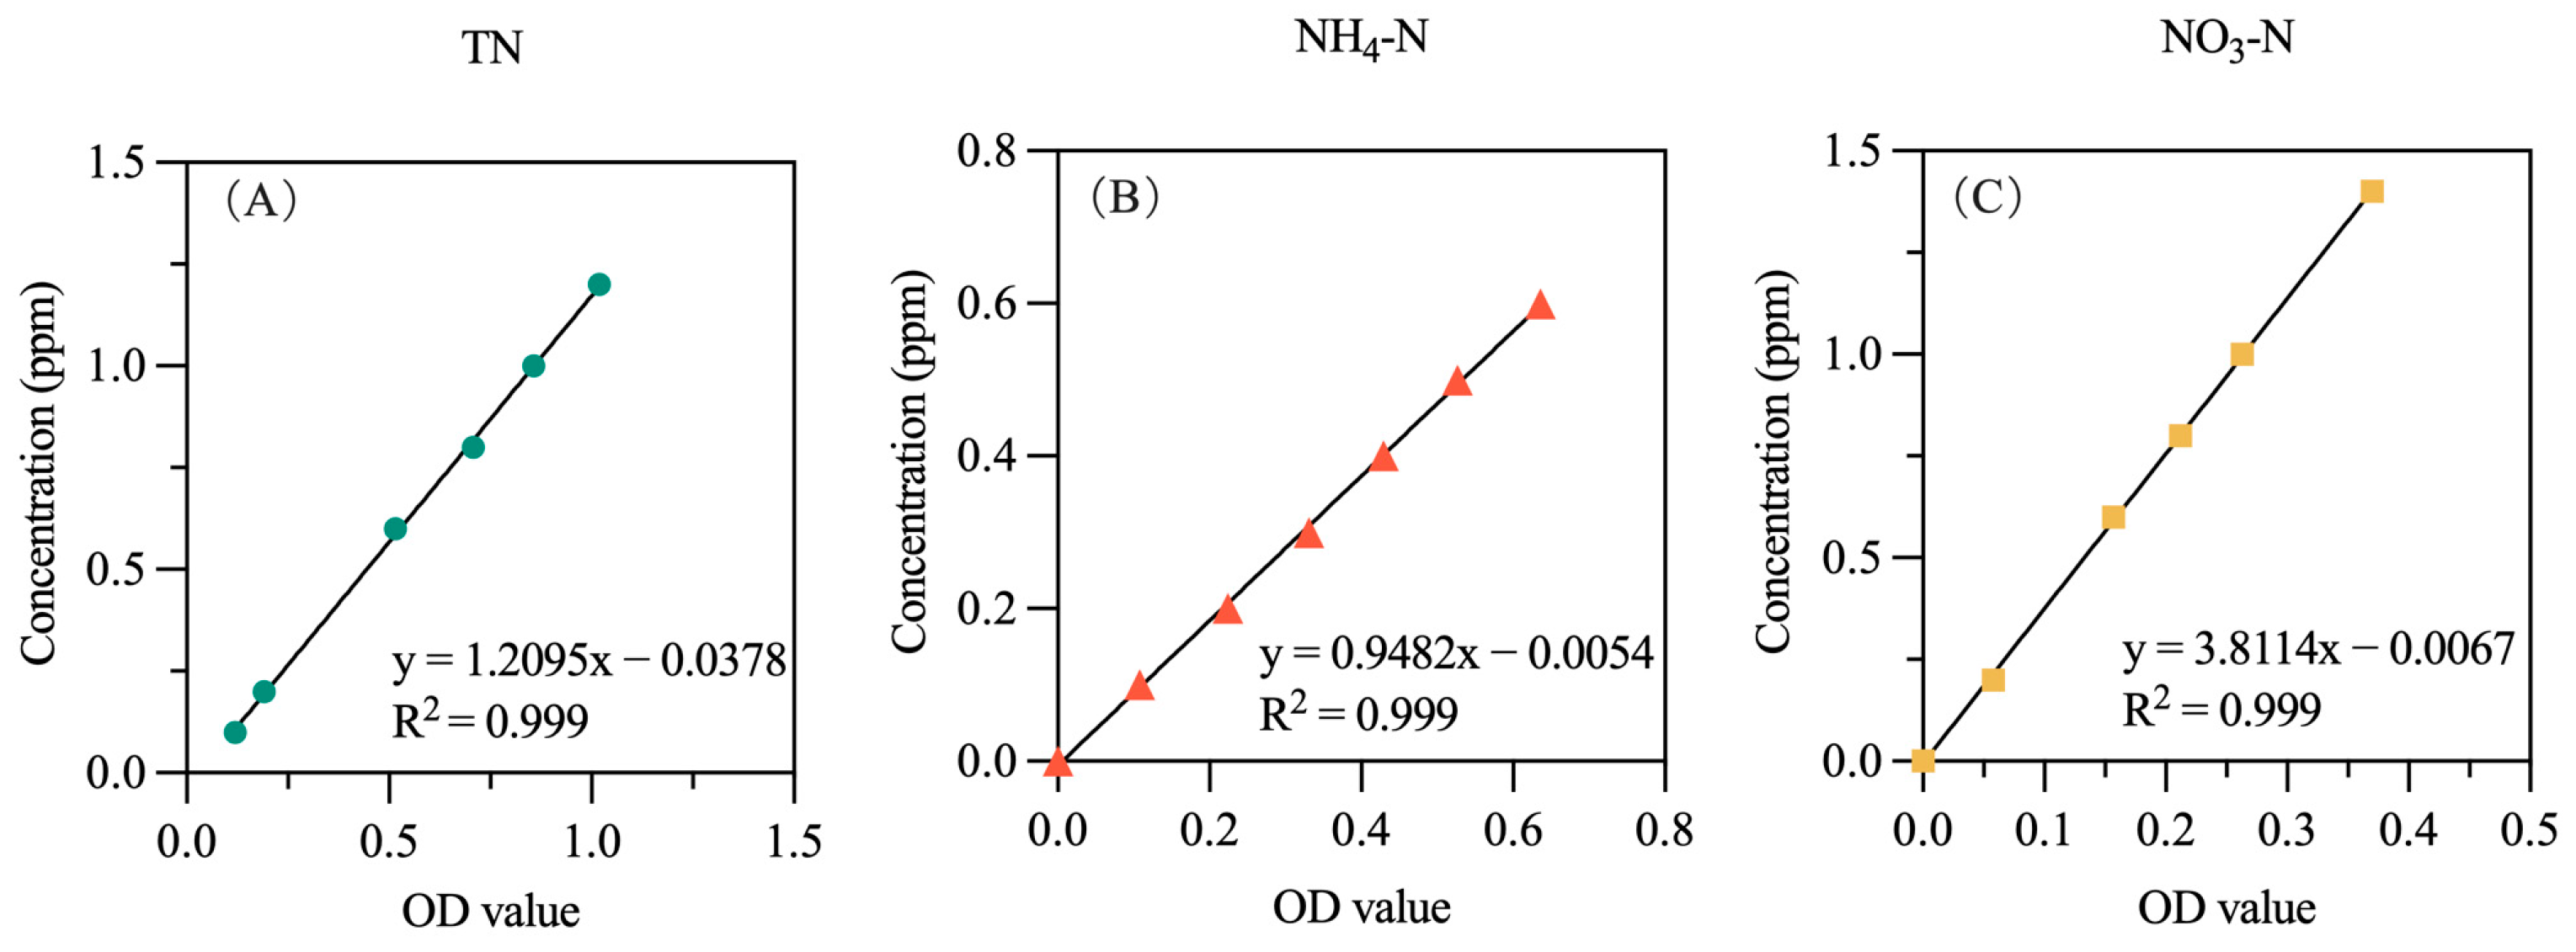
2.3.1. GHG Gas Analysis

The emission flux (F) per unit time and unit area is calculated using the following Formula (1):
F = ρ   ×   dc dt   ×   V A   ×   273 273 + T
where F is the emission flux (mg m−2·h−1); ρ is the gas density under standard conditions (N2O: 1.250 kg·m−3, CO2: 1.870 kg·m−3, CH4: 0.716 kg·m−3); V is the volume of the sampling chamber (m3); A is the area of the chamber base (m2); dc/dt refers to the change in gas concentration over time, determined through linear regression of the four gas concentration samples against their respective sampling times, with an R2 value greater than 0.9. The slope of this regression represents dc/dt (m2·h−1). T is the temperature inside the chamber (°C). Data are presented as the mean ± standard error (SE).

2.3.2. Soil Physicochemical Properties Analysis

The soil organic carbon content is calculated using Formula (2):
SOC   ( g · k g 1 ) = c × 5 V 0   ×   ( V 0   -   V )   ×   10 3   ×   3.0   ×   1.1 m   ×   1000
where c is the concentration of the 1/6 potassium dichromate standard solution (0.8 mol·L−1); 5 is the volume of potassium dichromate standard solution that is added (mL); V0 is the volume of the sulfuric acid solution used for blank titration (mL); V is the volume of the sulfuric acid solution used for titration of the sample (mL); 3.0 is the molar mass of carbon (1/4 of the carbon atom) (g·mol−1); 10−3 converts mL to L; 1.1 is the oxidation correction factor, as this method oxidizes approximately 90% of soil organic matter, meaning that the result should be multiplied by the correction factor 1.1; and m is the mass of the soil sample (g).
Soil organic matter is calculated using Formula (3), where 1.724 is the average conversion factor for converting soil organic carbon to organic matter:
SOM   ( g · k g 1 ) = SOC   ( g · k g 1 )   ×   1.724
Based on the standard curve (Figure 2) and Formula (4), the concentrations of total nitrogen and inorganic nitrogen in the soil solution are calculated:
N   content   ( mg · k g 1 ) = ρ   ×   V   ×   ts / m
where the left side of the equation represents the total nitrogen, ammonium nitrogen and nitrate nitrogen content in the soil; ρ is the mass concentration of total nitrogen, ammonium nitrogen and nitrate nitrogen obtained from the standard regression curve (μg·mL−1); V is the volume of the color reagent (mL); ts is the dilution factor; and m is the mass of the soil sample (g).

3. Results

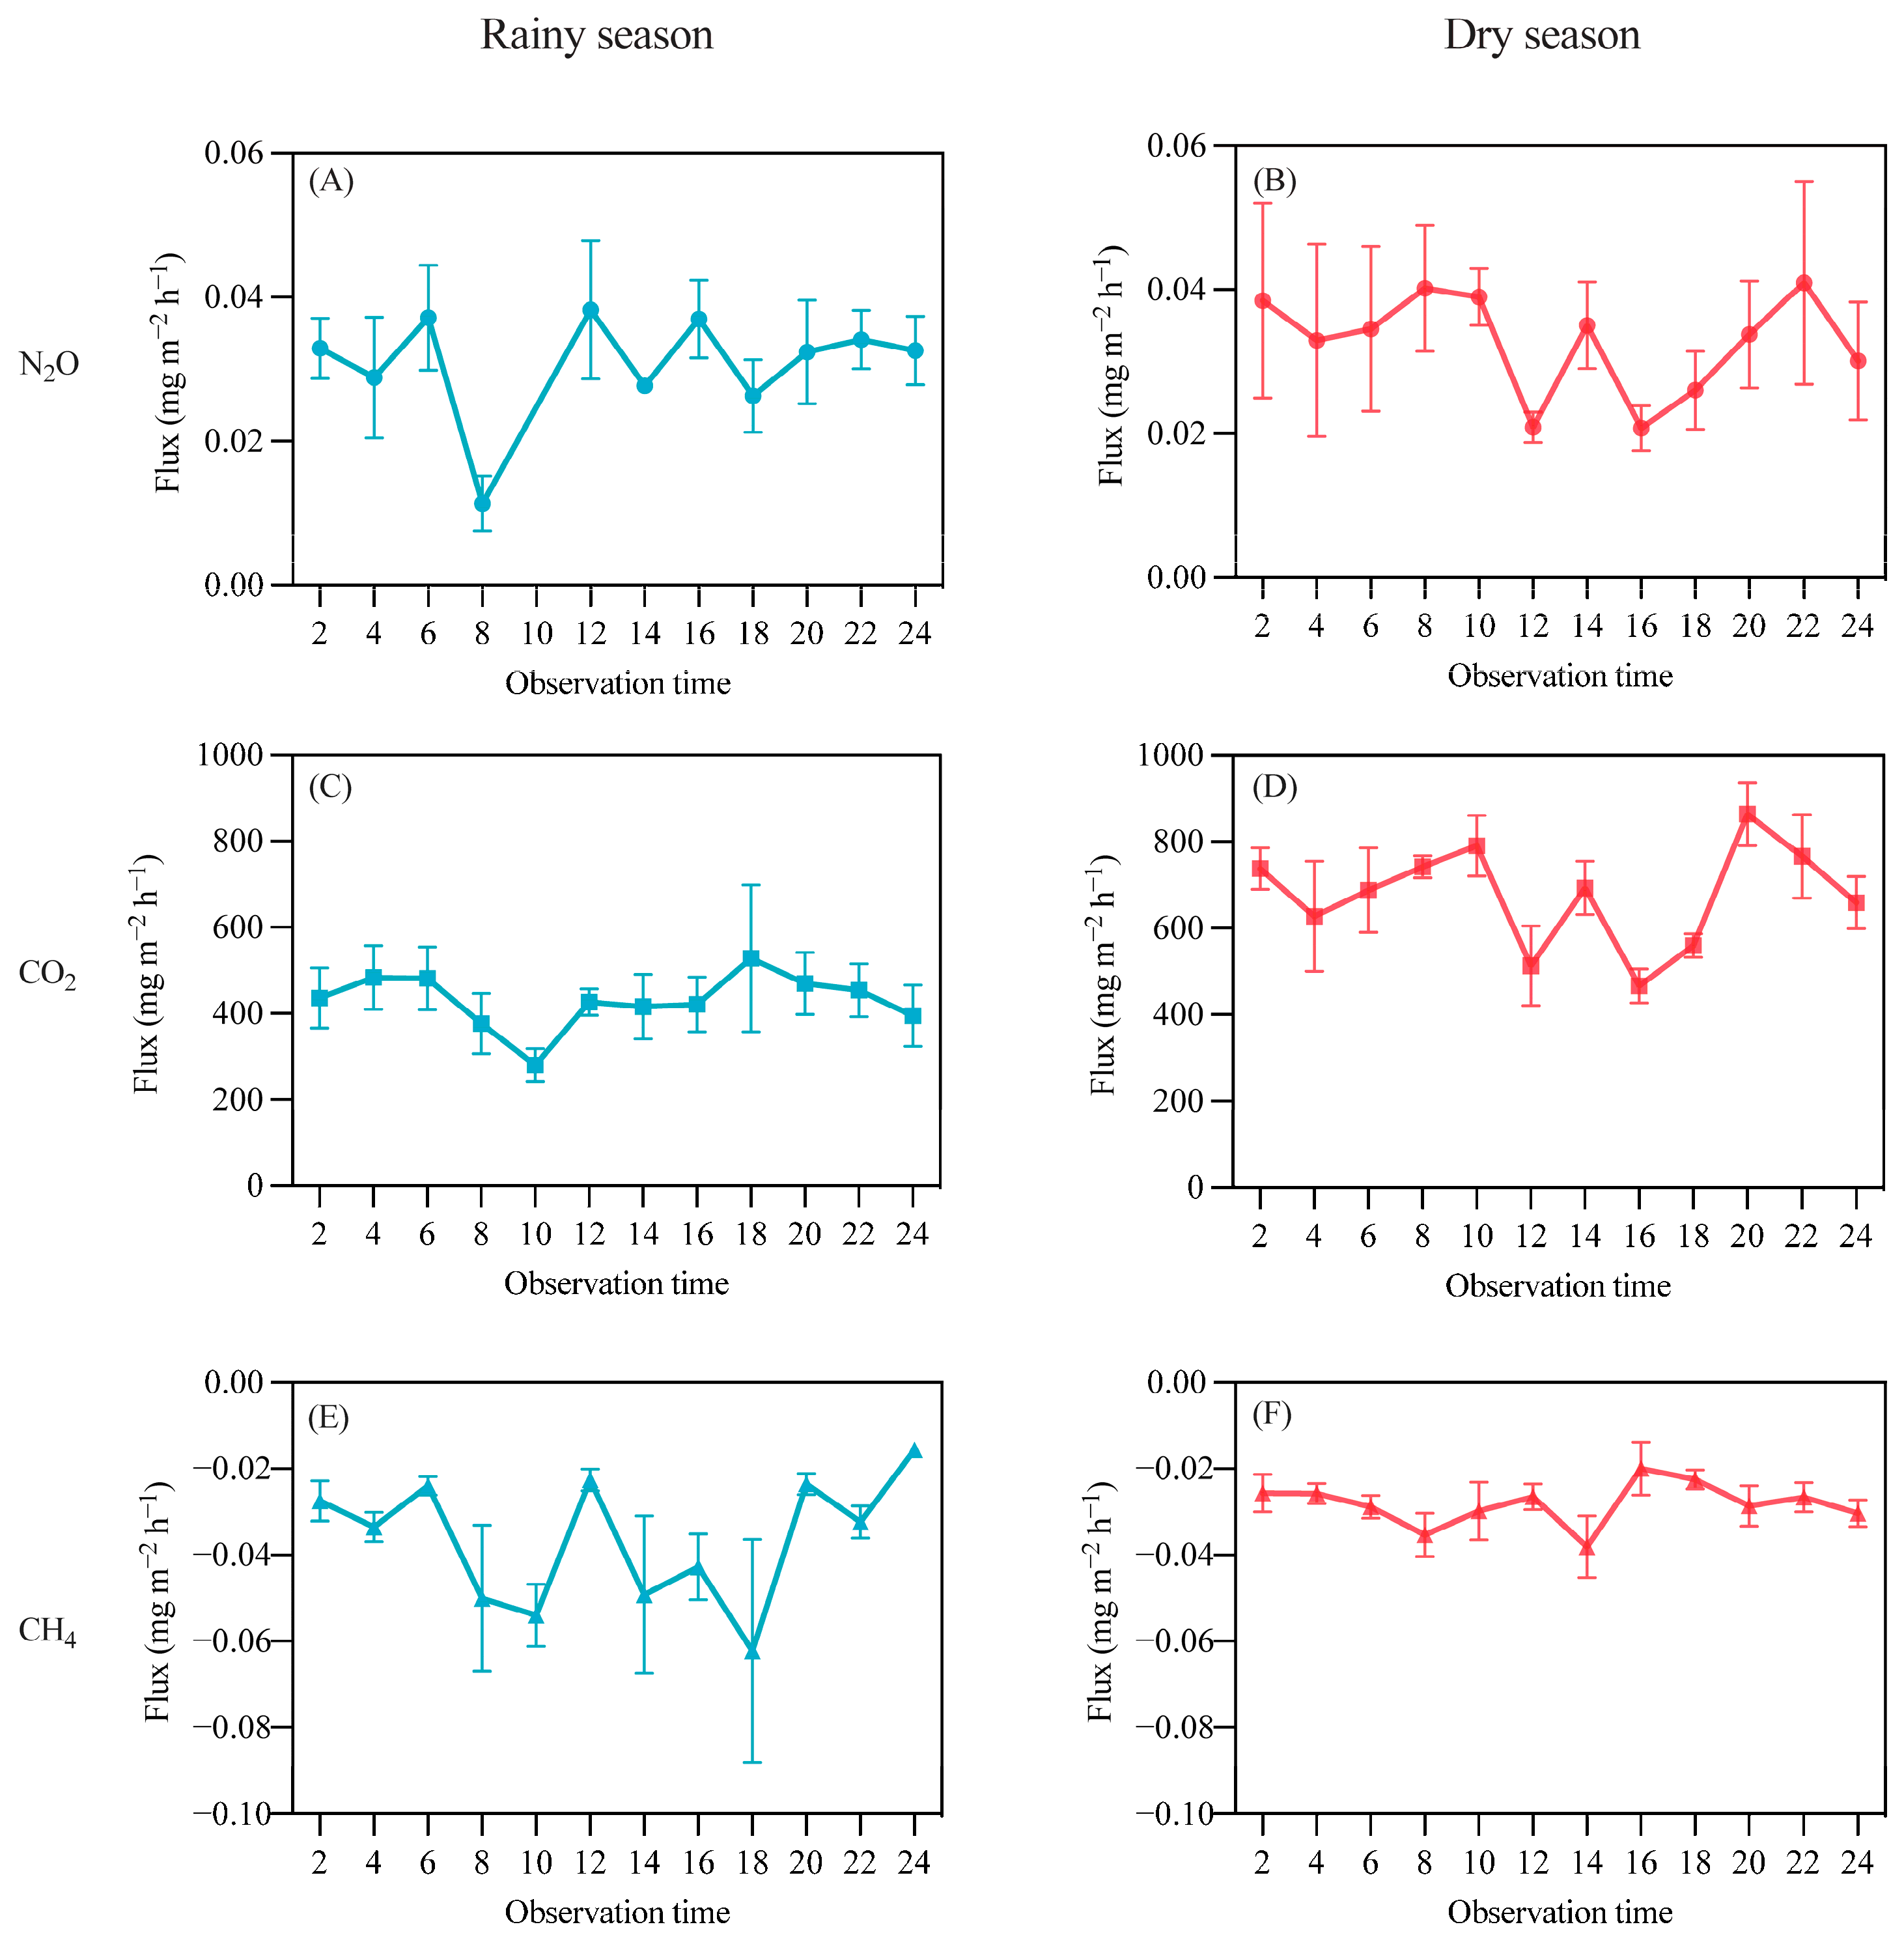
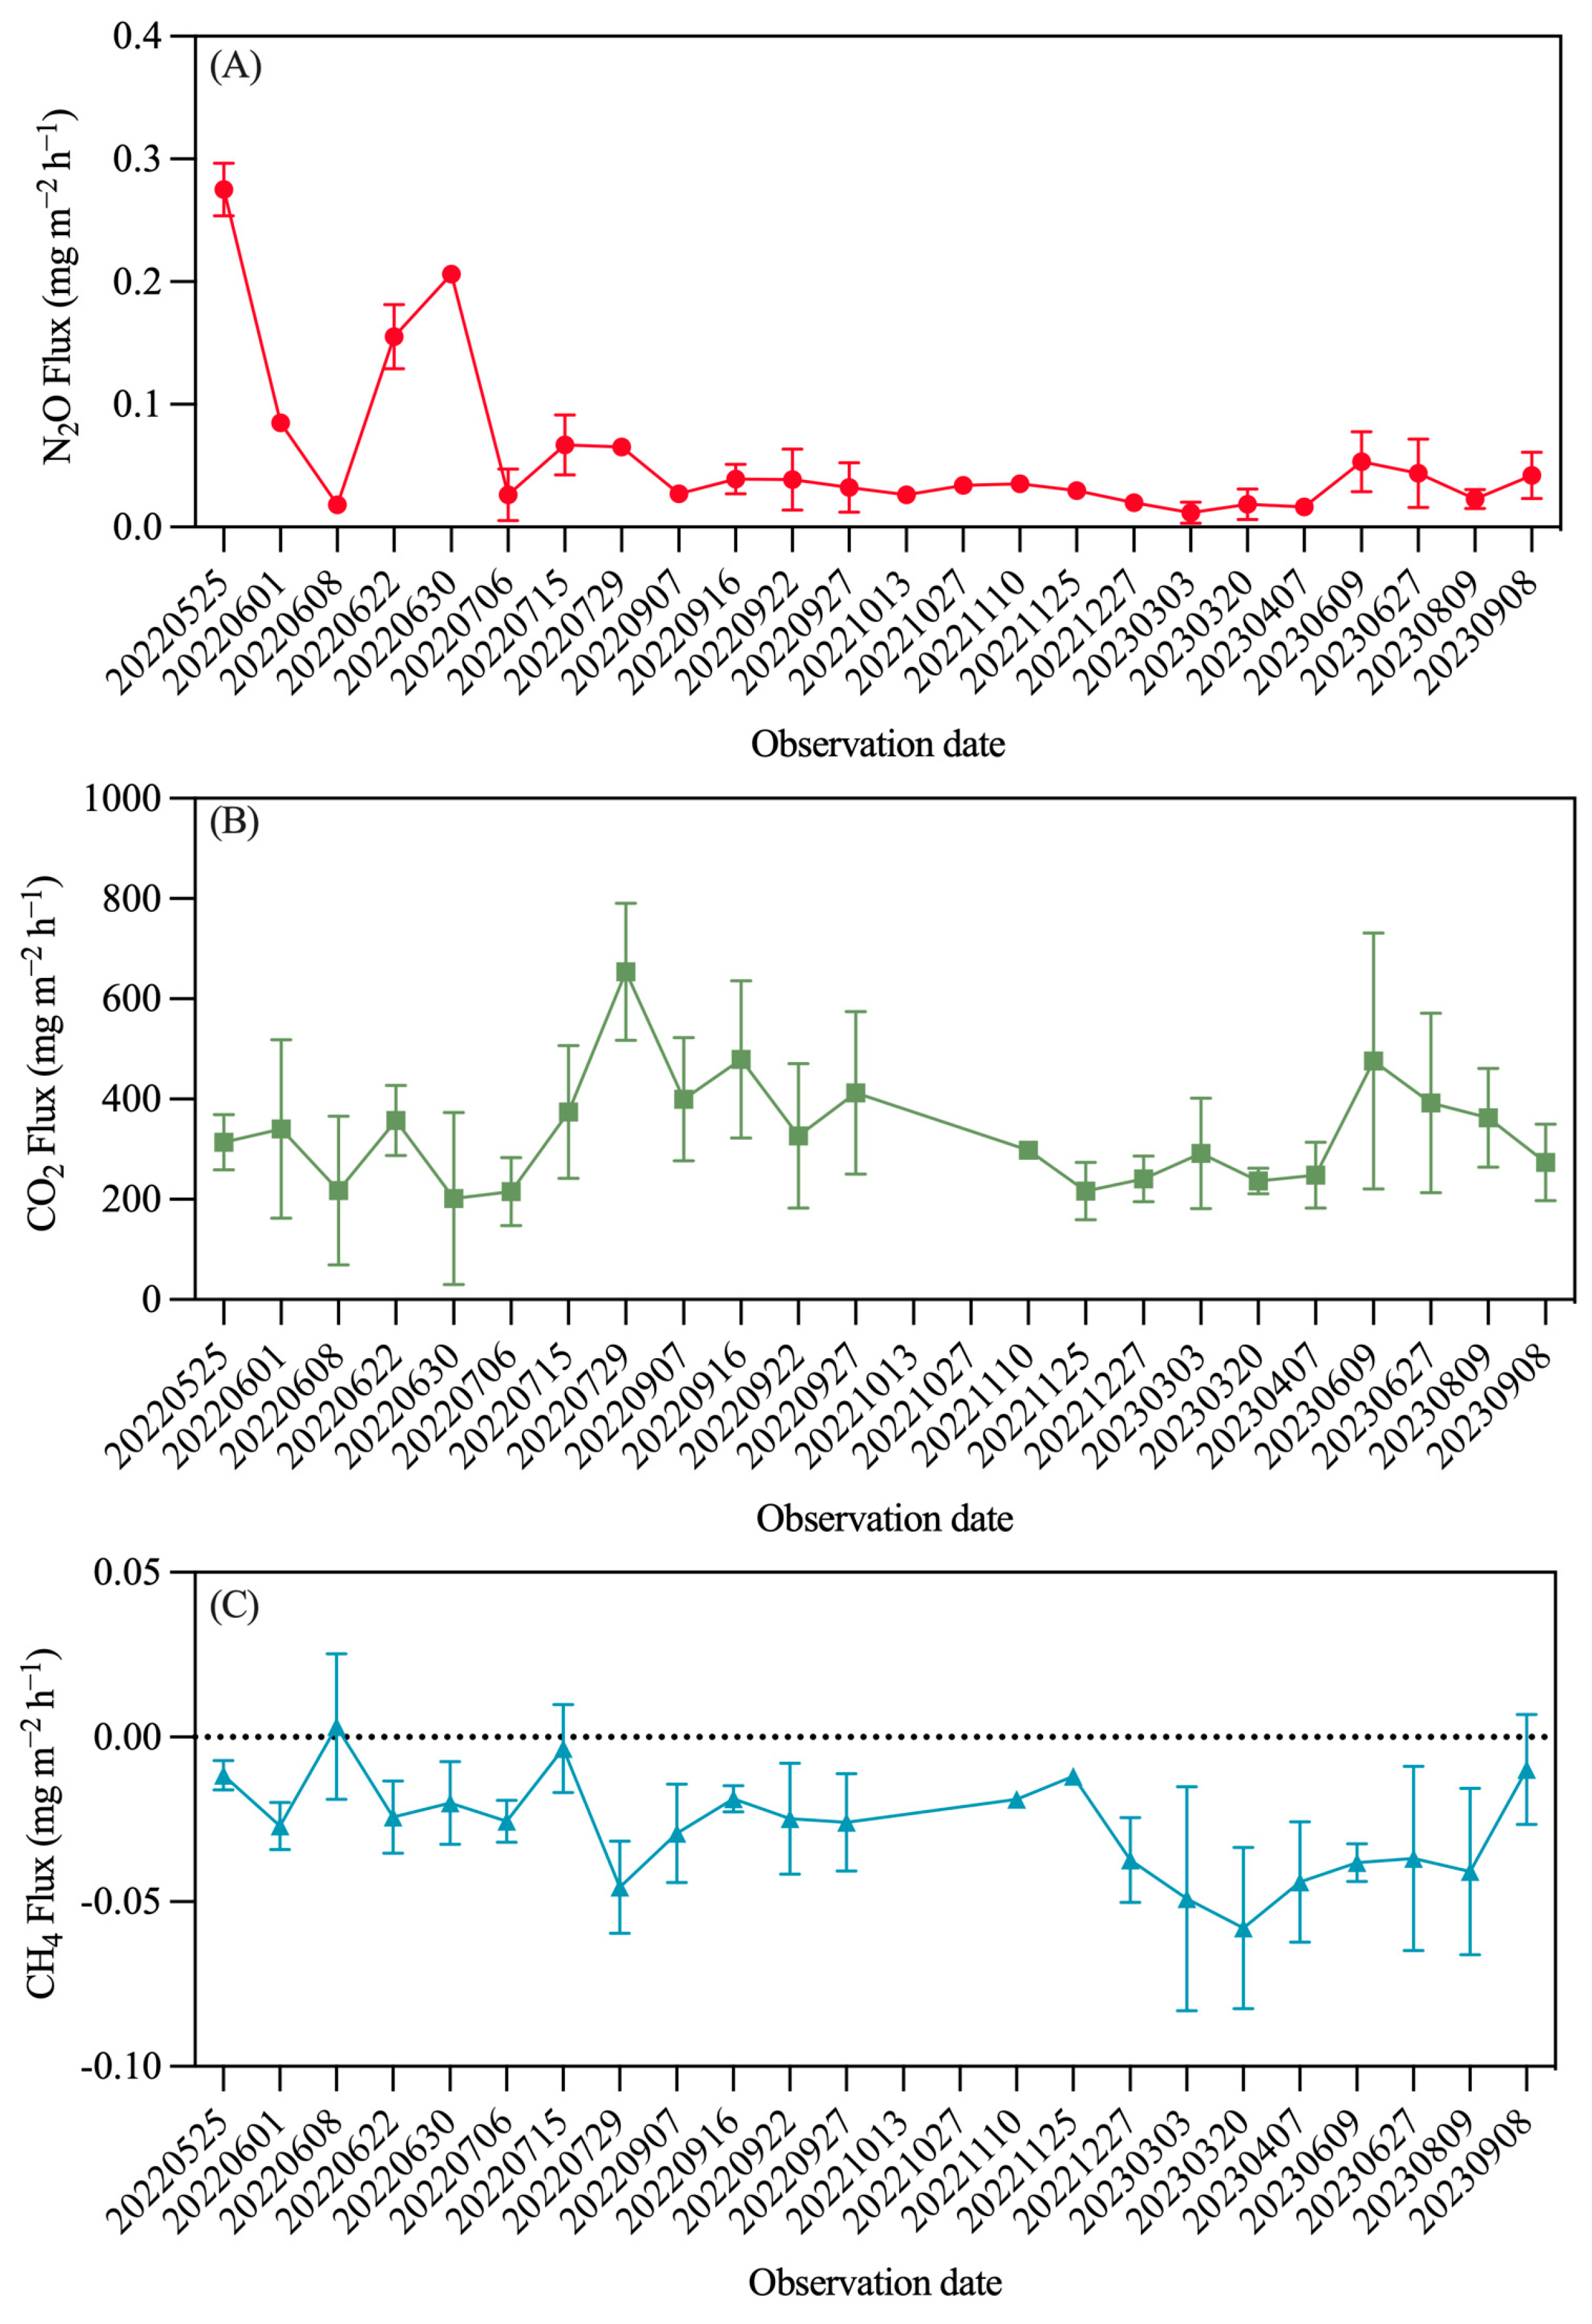
3.1. Diurnal and Daily Variations

A continuous 24 h monitoring of GHG was conducted on 23 April and 14 July, measuring GHG at two-hour intervals to examine diurnal variations during the wet and dry seasons. As shown in Figure 3, overall, the diurnal differences were not significant in either season, and the differences between the wet and dry seasons were also minimal. The average N2O emissions during the wet season were 0.030 ± 0.002 mg·m−2·h−1, with maximum and minimum values of 0.040 and 0.010 mg·m−2·h−1, respectively. The average emissions during the dry season were also 0.030 ± 0.002 mg·m−2·h−1, with a minimum value of 0.020 mg·m−2·h−1 and a maximum of 0.040 mg·m−2·h−1. Higher emissions were associated with greater variability; for example, during the wet season at 12:00, the emission flux was 0.038 ± 0.009 mg·m−2·h−1, while at 8:00, it was 0.010 ± 0.003 mg·m−2·h−1. In the dry season, emissions at 8:00 were 0.040 ± 0.008 mg·m−2·h−1, and at 16:00, they decreased to 0.020 ± 0.003 mg·m−2·h−1. The diurnal flux trends differed between the two seasons; in the wet season at 8:00, there was a decreasing trend, followed by a rise towards the average, while in the dry season, a decline was observed between 12:00 and 16:00, followed by an increase.
In both seasons, N2O and CO2 acted as sources, while CH4 functioned as a sink (Figure 3). This indicates that the rubber plantation soil emits N2O and CO2, with lower emissions during the day compared to night; it absorbs CH4, with daytime absorption greater than that during nighttime. Furthermore, CO2 emissions during the day were higher in the wet season than in the dry season, averaging 430.60 mg·m−2·h−1 in the wet season and 675.7 mg·m−2·h−1 in the dry season. The absorption of CH4 was greater in the wet season, with an average of −0.036 mg·m−2·h−1, compared to −0.028 mg·m−2·h−1 in the dry season.
From May 2022 to September 2023, continuous observations of GHG emissions from rubber plantation soils were conducted. In the first two months of observation, the emissions were significantly higher than the subsequent values. Starting in July, the observed values showed minimal variation, ranging between 0.010 and 0.060 mg·m−2·h−1, exhibiting a certain seasonal trend. Emissions in summer were higher than those in winter, with the highest emissions recorded on 15 July 2022, at 0.060 ± 0.012 mg·m−2·h−1, and the lowest on 27 December 2022, at 0.020 ± 0.002 mg·m−2·h−1. In 2023, the highest emissions occurred on 9 June at 0.050 ± 0.011 mg·m−2·h−1, while the lowest occurred on 3 March at 0.010 ± 0.003 mg·m−2·h−1. The annual N2O flux was measured at 3.0 kg·hm−2·a−1, which translates to 1.9 kg N·hm−2·a−1 (Figure 4).
The long-term observation results, as shown in Figure 4, indicate that the seasonal trends are not very pronounced. However, a clear correlation between the emissions of carbon and nitrogen gases is evident; when N2O emissions increase, CO2 emissions also rise, along with an increase in CH4 absorption. Over the long term, while occasional observations indicate that rubber plantation soils can act as CH4 sources, overall, both N2O and CO2 are sources, while CH4 functions as a sink. Even though the global warming potential (GWP) of CH4 and N2O is 27.2 and 273.0 times that of CO2, respectively, the calculated contributions show that CO2 accounts for the vast majority. In the wet and dry seasons, daily emissions per hectare of N2O, CO2, and CH4 were calculated to be 0.007/0.008 kg, 103.344/162.168 kg, and −0.238/−0.184 kg, respectively. When converted to GWP, these values are 2.01/2.14, 103.34/162.17, and −0.24/−0.18. The N2O emissions from the rubber plantation account for less than 2.0% of the CO2 emissions, and CH4 absorption is only 0.3%.

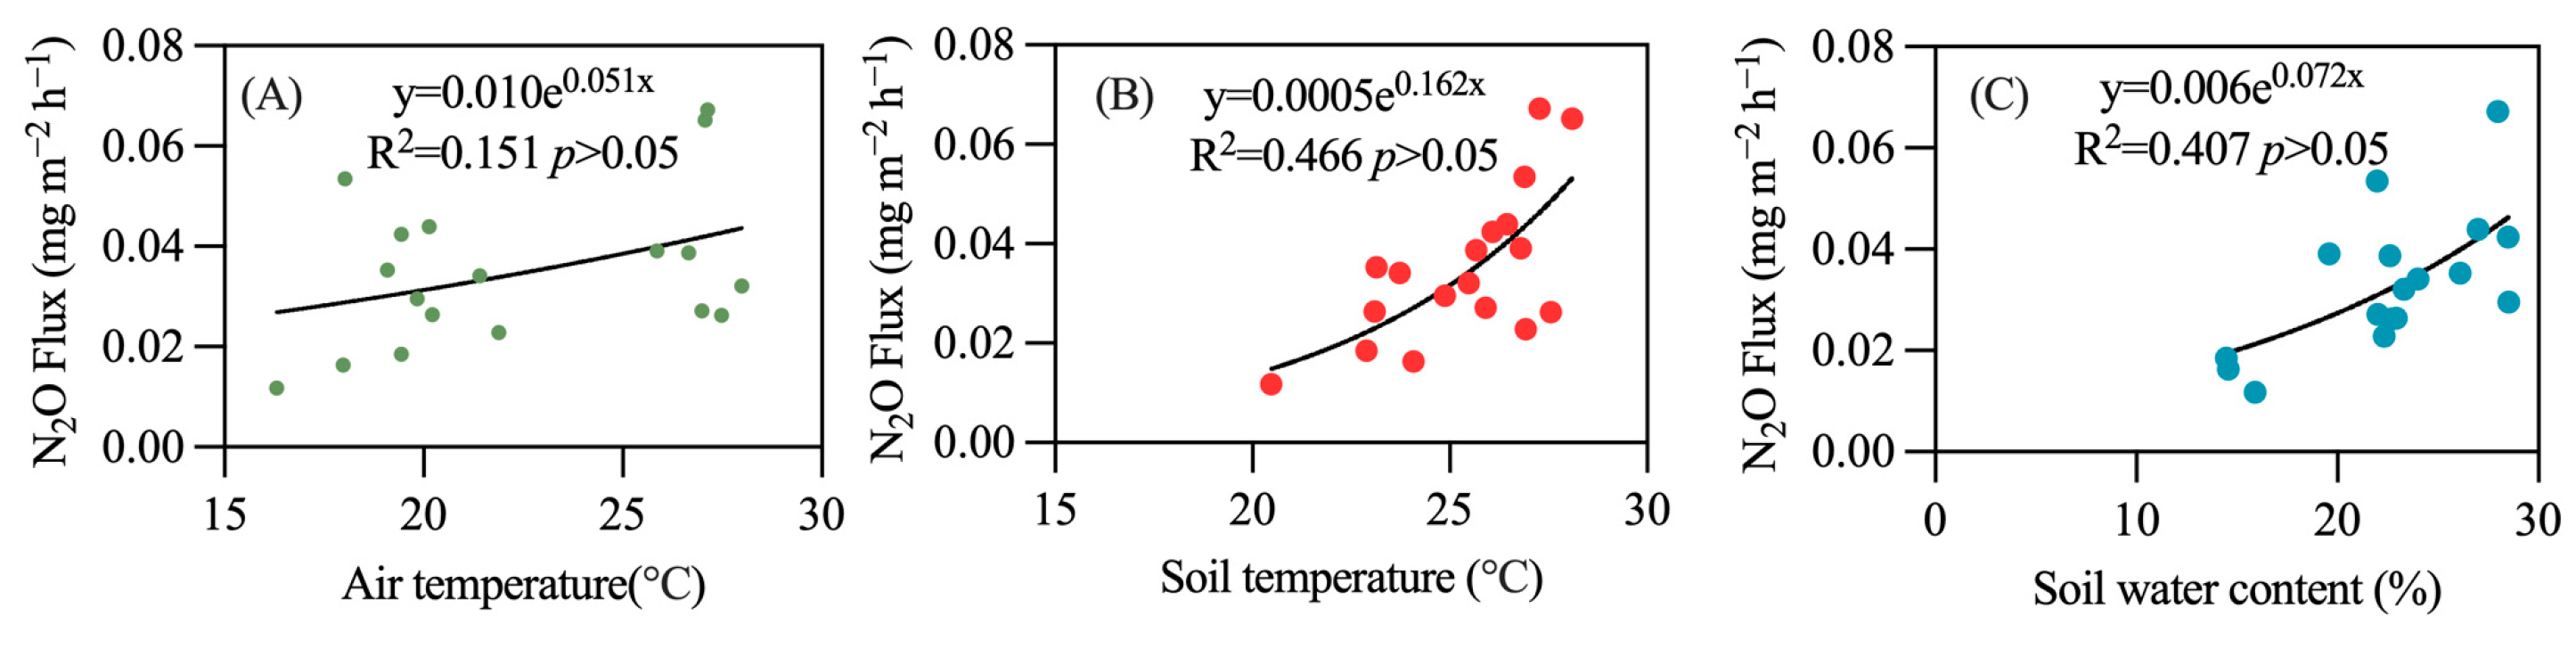
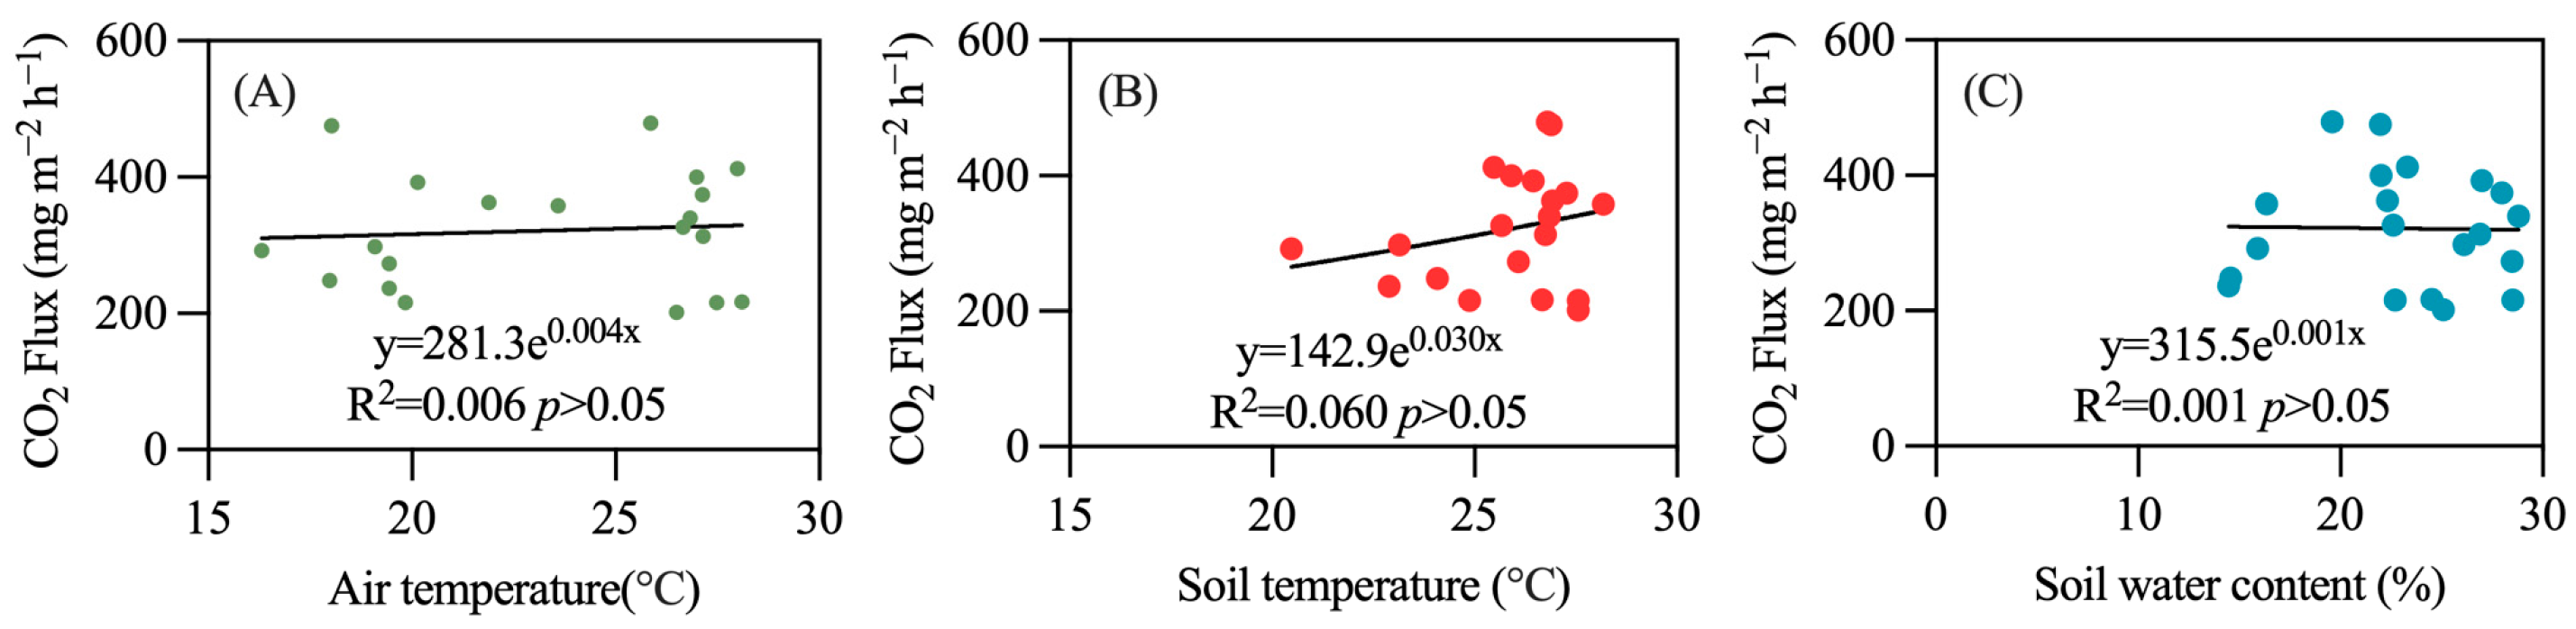
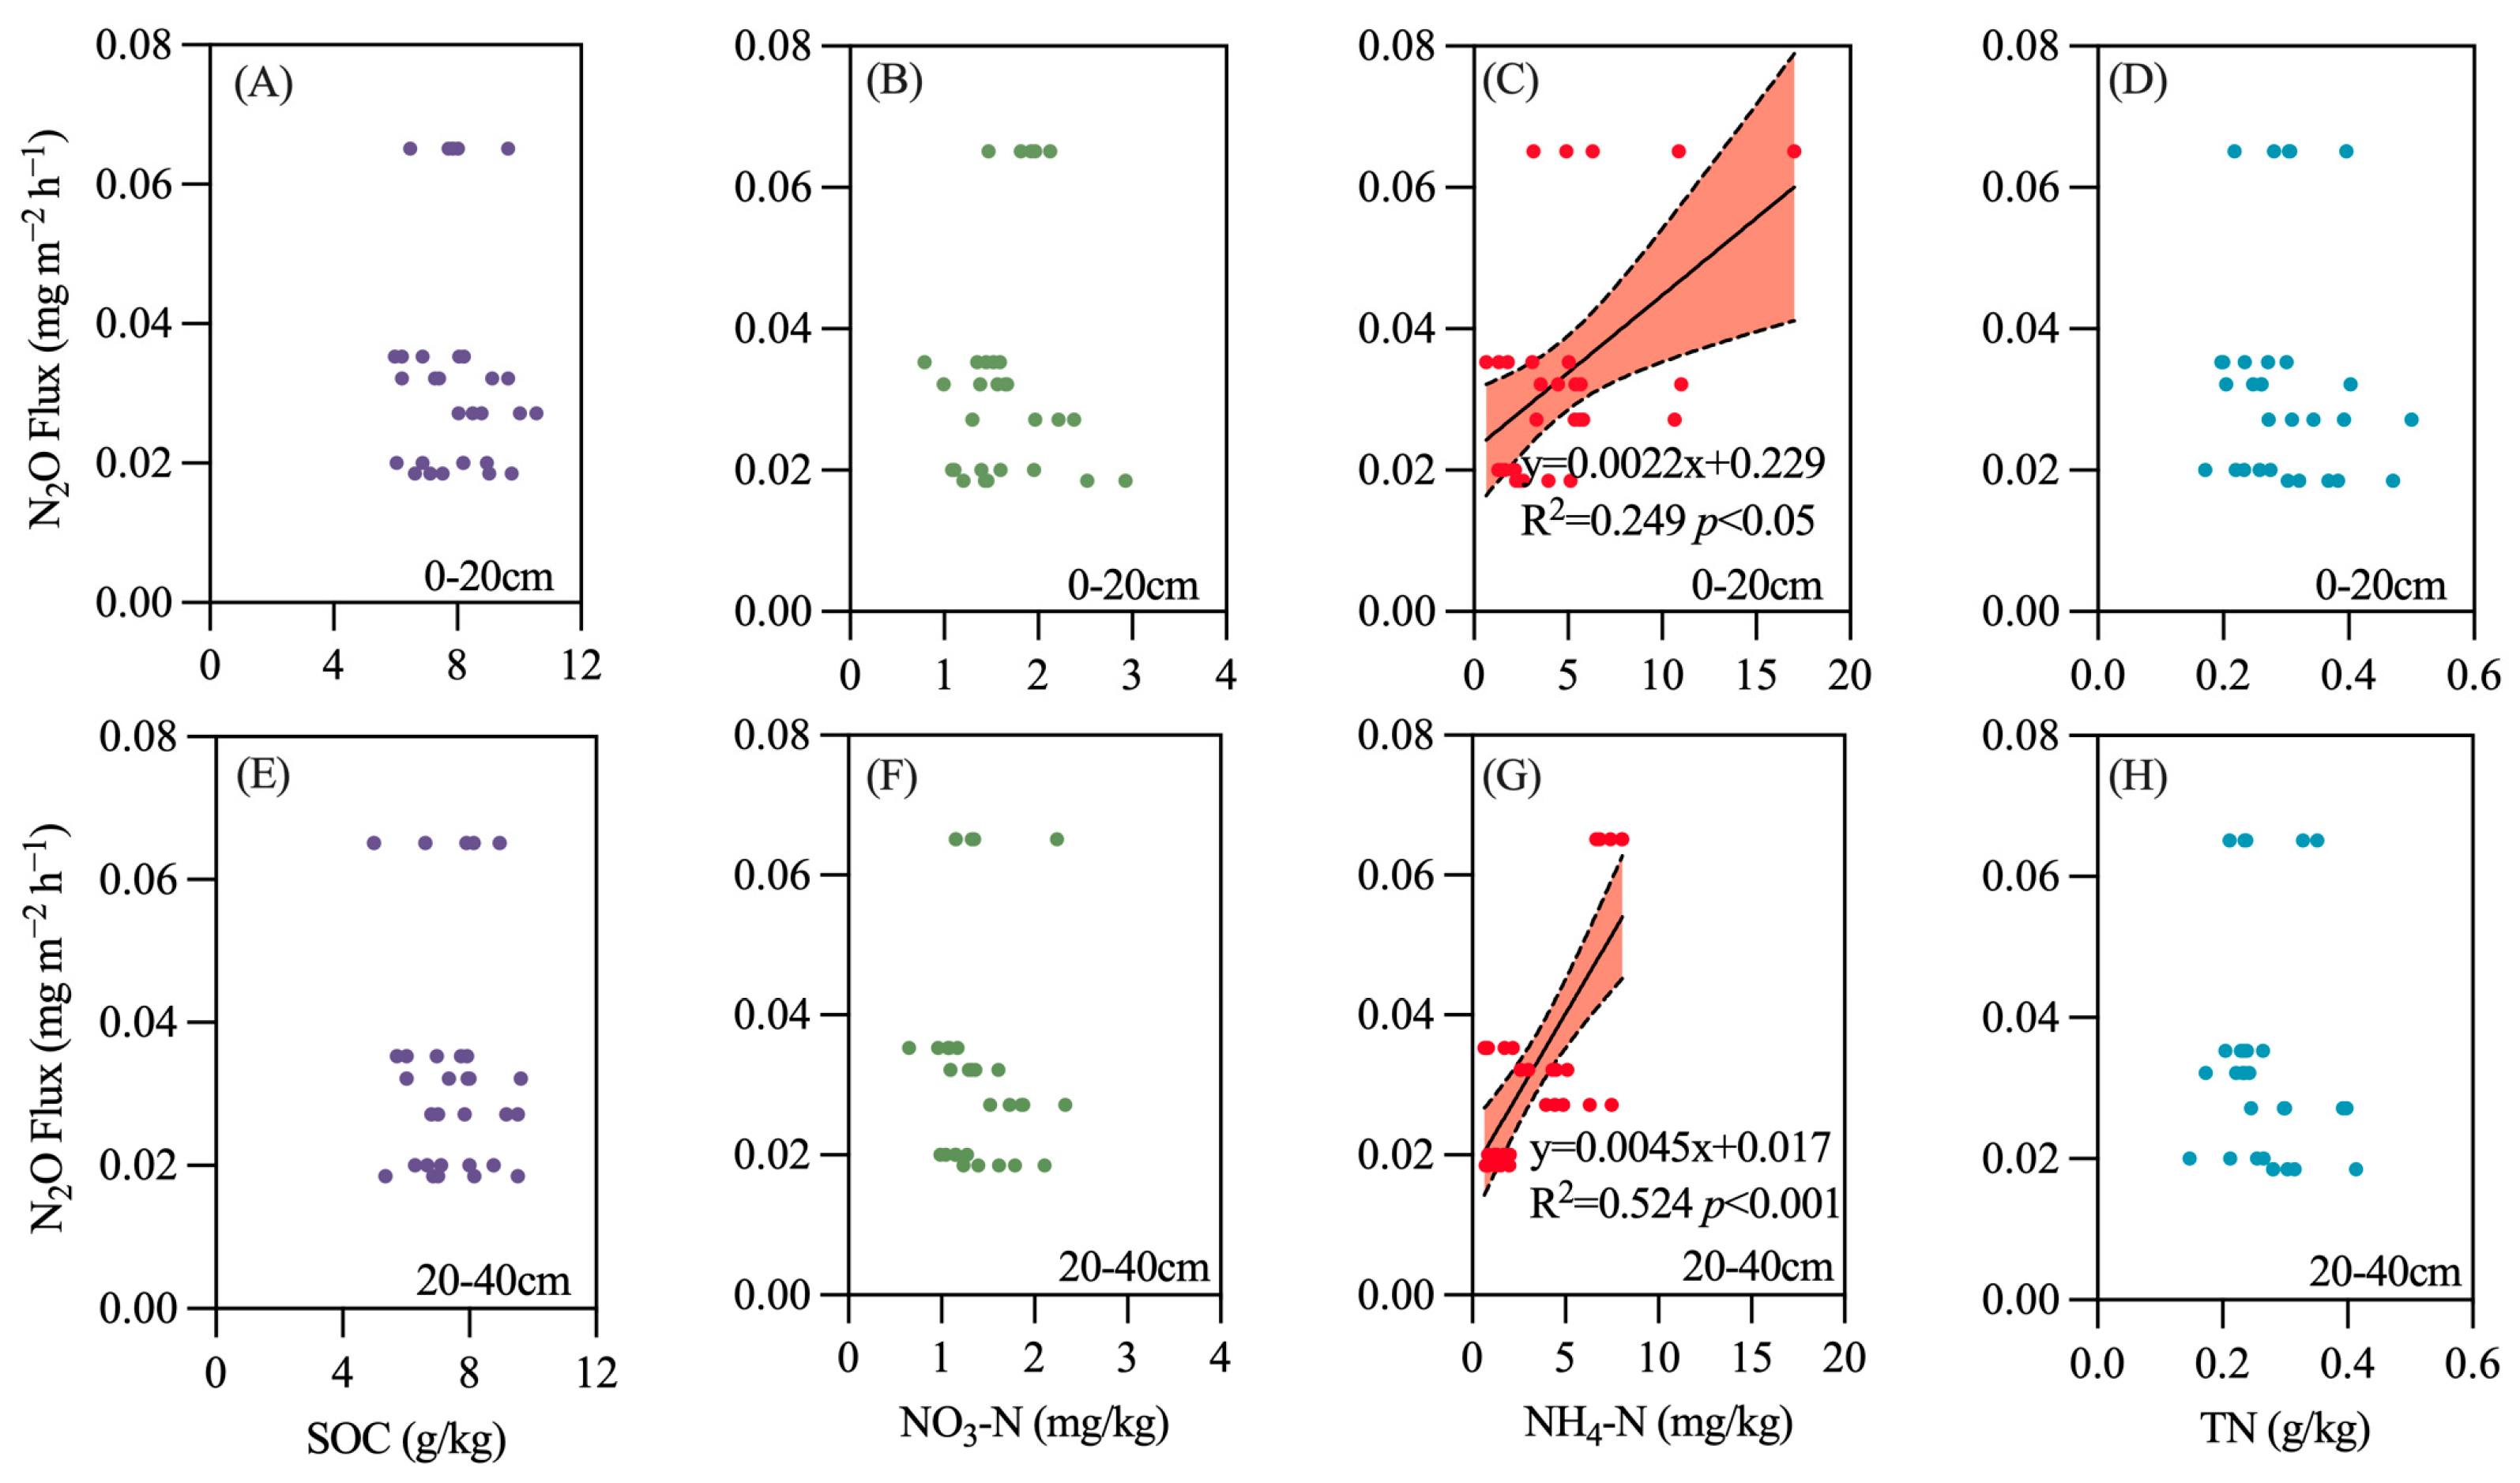
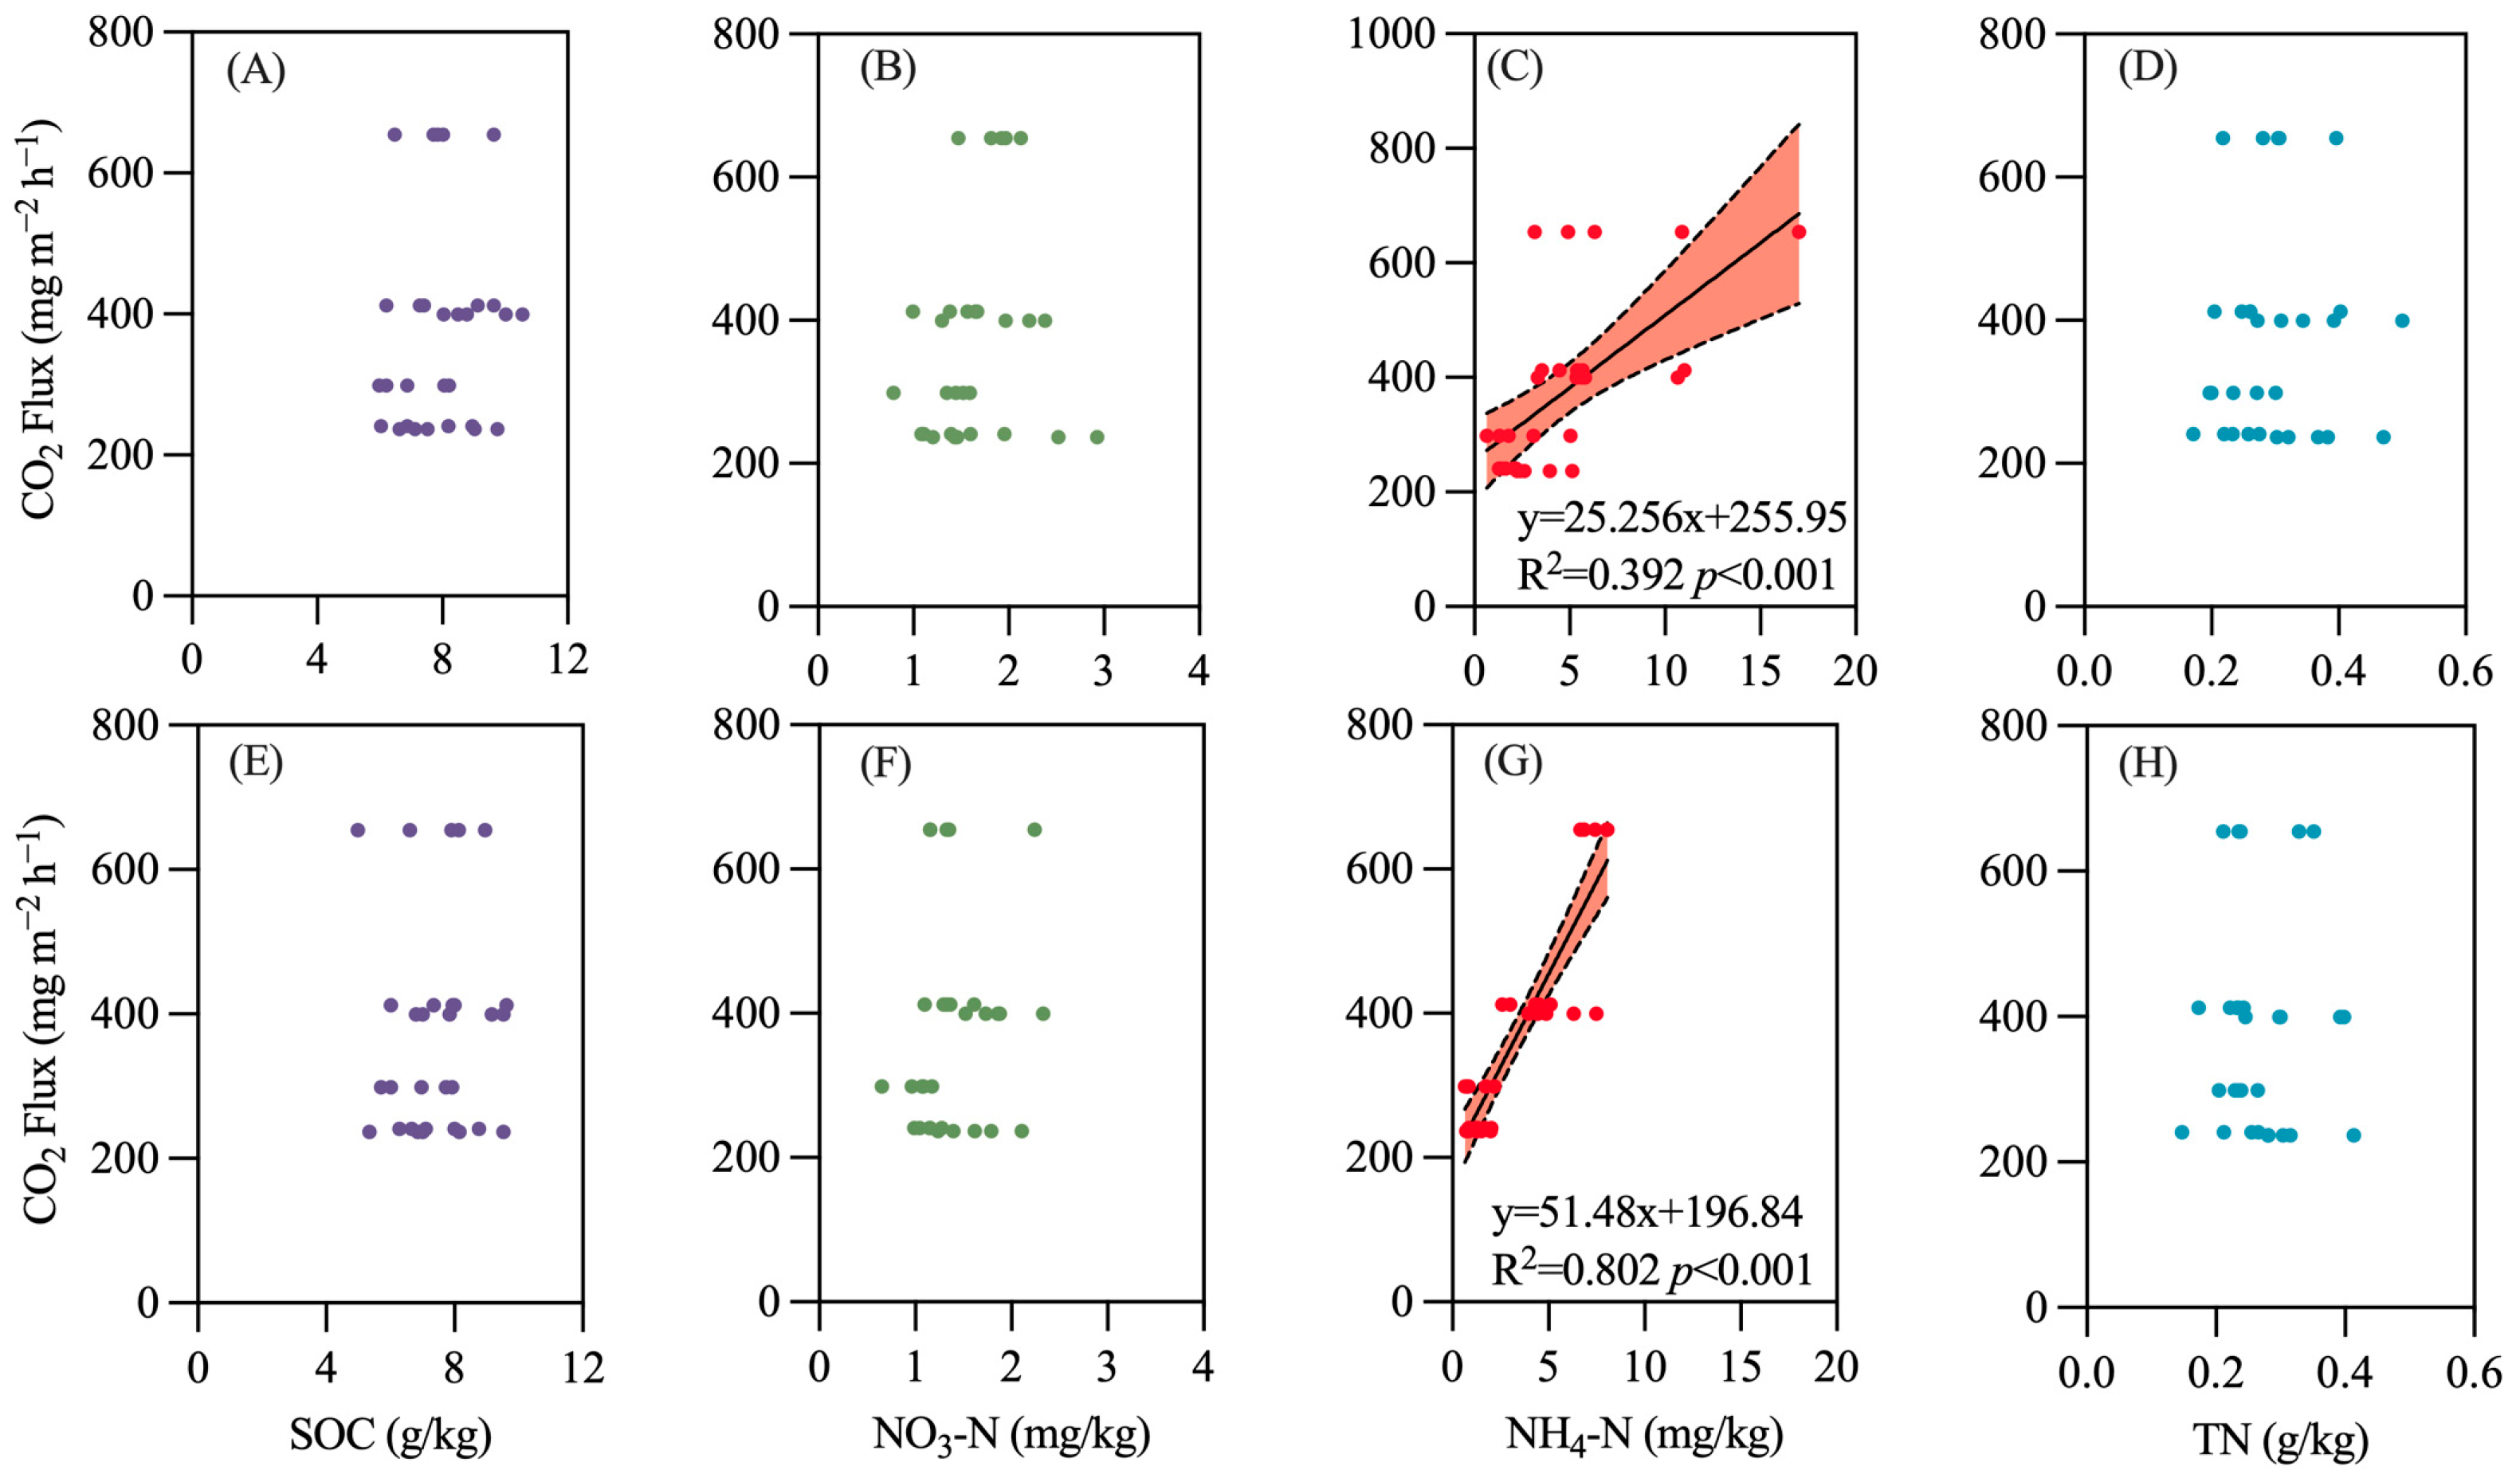
3.2. Factors Influencing GHG Emissions

Regression analysis shows a correlation between temperature, moisture, and N2O emission flux. Specifically, air temperature explains approximately 15% of the variability (R2 = 0.151, Figure 5A), soil temperature accounts for about 46% (R2 = 0.466, Figure 5B), and soil moisture explains around 40% (R2 = 0.410, Figure 5C). This indicates that soil temperature is more likely to influence the N2O emission flux in rubber plantations, demonstrating a high level of dependency on soil temperature.
From the range of the X-axis, it can be observed that the variation in air temperature during the observation period exceeds that of soil temperature; however, the fit between the N2O emission flux and soil temperature is much better. Specifically, as soil temperature increases, the N2O emission flux also rises. For instance, in the colder month of March, the soil temperature was 20.47 °C, resulting in an N2O emission flux of 0.012 mg·m−2·h−1. In contrast, during the hotter month of July, with a soil temperature of 28.10 °C, the N2O emission flux rose to 0.067 mg·m−2·h−1.
Due to the synchronous occurrence of water and heat at the study site, the seasonal variation trends of soil moisture and soil temperature are quite similar. When soil temperature is low (20.47 °C), soil moisture is also low (15.89%), resulting in a lower N2O emission flux. Conversely, during the high soil temperature period in July (28.10 °C), which coincides with the rainy season, continuous rainfall elevates soil moisture to a higher level (27.98%), leading to an increased N2O emission flux. In contrast, temperature and moisture have minimal effects on CO2 emissions and CH4 absorption, with no significant correlation observed (Figure 6 and Figure 7).
Additionally, the study analyzed the relationship between soil physicochemical properties at different depths and greenhouse gas (GHG) emission flux, including surface soil (0–20 cm) and subsurface soil (20–40 cm) parameters such as soil organic carbon, soil nitrate nitrogen, soil ammonium nitrogen, and total soil nitrogen. The results indicate that, compared to temperature and moisture, there is no significant correlation between soil carbon and nitrogen content and the N2O emission flux, with the exception of ammonium nitrogen content.
In both surface soil (0–20 cm) and subsurface soil (20–40 cm), the ammonium nitrogen content is significantly correlated with the N2O emission flux, with a stronger correlation observed in subsurface soil (R2 = 0.524, p < 0.001) compared to surface soil (R2 = 0.249, p < 0.05) (Figure 8). A similar trend was noted for CO2 (Figure 9), while CH4 emissions were associated with total nitrogen content in surface soil (Figure 10).

3.3. Carbon and Nitrogen Coupling in Soil-Atmosphere Systems

A regression analysis was conducted of the emissions of N2O, CO2, and CH4 during both the dry and rainy seasons (Figure 11). The results indicate that, regardless of the season, there is a significant correlation among the emissions of these three gases, particularly between N2O and CO2 during the dry season, which shows a highly significant correlation (R2 = 0.740, p < 0.001). The relationship between N2O and CH4 varies between the two seasons; during the rainy season, as N2O emissions increase, CH4 absorption decreases. Conversely, during the dry season, an increase in N2O emissions corresponds with an increase in CH4 absorption. The relationship between N2O and CO2 exhibits a synergistic trend in both seasons, with emissions of both gases either increasing or decreasing simultaneously.

4. Discussion

4.1. Sampling Time for Greenhouse Gases

There are various methods to measure N2O emissions from soil [16], with the static chamber method being the most widely used. Compared to other methods such as micrometeorological techniques and automatic sampling systems, static chambers are more cost-effective and easier to deploy and replicate in rubber plantations. However, a major drawback of the static chamber method is that sampling is typically conducted only once during the daytime, which may cause diurnal variations in emissions to be overlooked. Diurnal trends in N2O emissions have been observed across various ecosystems [17,18]. Therefore, measuring only once per day can lead to overestimations or underestimations of daily emissions. Shurpali et al. [19] emphasized that neglecting diurnal variations introduces uncertainty in terrestrial N2O emissions, noting that when soil nitrogen is high due to fertilization, daytime N2O emissions exceed nighttime levels, while nighttime emissions become higher when soil nitrogen is limited.
Thus, assessing the optimal sampling times throughout the day can ensure a more reliable estimate of daily cumulative emissions. Alves and Reeves used automated chamber systems for continuous measurements in agricultural, crop, and grassland ecosystems [20,21], finding that manual sampling between morning (09:00) and noon (12:00), as well as late night (21:00) and midnight (24:00), closely approximated daily average N2O emissions. In crop and grassland ecosystems in Brazil, fluxes measured in the morning (09:00–10:00) and evening (21:00–22:00) were found to best represent the daily average values. In this study, the diurnal variation of N2O emissions during both the dry and rainy seasons were not significant, with daily average emissions of 0.030 ± 0.002 mg·m−2·h−1, indicating a relatively stable low emission trend. Thus, considering the actual conditions, around 9:00 a.m. is the optimal time for measuring N2O emissions.

4.2. Low N2O Emissions from Rubber Plantation Soils

In situ observations of N2O emission fluxes are labor-intensive, and high sampling frequencies reduce feasibility. Reeves noted that, under appropriate conditions, intermittent sampling can yield accurate annual cumulative N2O emissions [21]. Even after rainfall events, the accuracy and variability of the results from weekly and tri-weekly sampling are similar. This study found that the annual N2O flux from rubber plantations is 3.0 kg·hm−2·a−1, equivalent to 1.9 kg N·hm−2·a−1, with seasonal variations indicating higher emissions in June and July. Throughout all seasons, N2O acts as a source, exhibiting a consistent emission trend. Similar results were observed by Zhou and Rao in rubber plantations in Xishuangbanna [9,22], where the N2O flux from unfertilized plantations was 2.5 kg N·hm−2·a−1 and 0.5~1.5 kg N·hm−2·a−1 among different ages. The annual N2O emissions significantly decreased with the age of the rubber trees, and fertilization and intercropping will influence emissions; for example, intercropping with Flemingia macrophylla (a leguminous shrub) increased annual N2O emissions by 0.15 kg·hm−2 for young trees and 0.55 kg·hm−2 for mature trees, and the fertilized rubber plantation’s N2O flux was 4 kg N·hm−2·a−1 (higher than that of the unfertilized flux: 2.5 kg N·hm−2·a−1). Generally speaking, gully fertilization areas are usually high N2O emission areas. As mentioned earlier, due to the low rubber prices, many farmers have stopped investing in fertilizers, so the N2O emissions from rubber plantations are not high. Even so, the findings from this study are higher than the N2O emission flux found in tropical rainforest soils in Xishuangbanna, Yunnan (0.98 kg N·hm−2·a−1) [23], but lower than those from Hainan’s Jianfengling tropical rainforest (2.52 kg N·hm−2·a−1) [24]. Among various plantations, tea gardens exhibit the highest N2O emissions, reaching 17.1 kg N·hm−2·a−1 [25], largely due to the extensive nitrogen fertilization aimed at increasing yield and quality, with annual applications often between 200 and 1200 kg N per hectare—far exceeding those in grain crop fields. In Malaysia, oil palm plantations have N2O emissions as high as 25.2 kg N·hm−2·a−1 [11], while Acacia and eucalyptus plantations show emissions of 3.5 kg N·hm−2·a−1 and 6.2 kg N·hm−2·a−1, respectively [12].

4.3. Soil Ammonium Nitrogen Content Related to N2O Emission Flux

This study analyzed environmental factors affecting N2O emission fluxes in rubber plantations—specifically air temperature, soil temperature, and soil moisture—as well as the physicochemical properties of both surface and subsurface soils (organic carbon, nitrate nitrogen, ammonium nitrogen, and total nitrogen). The results indicate that soil temperature, moisture, and ammonium nitrogen content are significant factors influencing N2O emissions. The effect of soil temperature on N2O emissions is a complex interaction involving microbial activity, organic matter decomposition, and soil chemical reactions. Temperature directly influences microbial activities in the soil; warmer environments typically accelerate metabolic processes, including those involved in the nitrogen cycle. Key steps in this process are nitrification and denitrification, where nitrification converts organic nitrogen into ammonium nitrogen, and denitrification further transforms ammonium nitrogen into N2O and other nitrous gases. Higher soil temperatures promote nitrification, leading to increased N2O production and release. In warmer environments, organic matter decomposes more rapidly, releasing additional nitrogen sources for microbial utilization and thus providing more substrates for nitrogen reduction reactions, which further increases N2O generation [26,27]. Increased soil moisture leads to reduced oxygen in soil pores, creating water-saturated conditions that inhibit microbial activity. This inhibition can slow down nitrification while promoting denitrification, ultimately resulting in an increase in N2O emissions into the atmosphere. Both excessively high and excessively low soil moisture levels can affect microbial activity and nitrogen cycling processes, as water-filled pore space (WFPS) is critical, with N2O emissions peaking at around 50% to 80% WFPS. Additionally, studies indicate that under the influence of different temperatures, increased soil evaporation can lead to drier surface soil, further impacting soil moisture. There is also a feedback effect between soil moisture and the atmosphere, explaining much of the N2O flux in terrestrial regions—essentially, atmospheric moisture demand increases with temperature, thus reducing soil moisture. Lower soil moisture levels favor the growth of nitrifying bacteria while decreasing denitrifying bacteria [28,29]. Li et al. [30] comprehensively assessed N2O emission rates across different ecosystems and explored the key driving factors behind N2O emission variations. Their structural equation model results indicate that ammonium nitrogen, nitrate nitrogen, and total nitrogen are the primary driving factors of global soil N2O emissions, emphasizing the critical role of nitrogen-rich substrates in N2O emissions. In this study, a correlation was observed between soil ammonium nitrogen content and the N2O emission flux, with low WFPS values (30–60%). This is consistent with the findings of Zhou Wenjun et al. in rubber forests in Xishuangbanna. The rates of N2O production from nitrification and denitrification processes vary under different soil moisture conditions; with a lower WFPS, nitrification contributes more to soil N2O emissions than denitrification, indicating that nitrification, rather than denitrification, controls N2O emissions in rubber plantations [9,31].

4.4. Synergistic Variation in Greenhouse Gases in Rubber Plantation Soils

In this study area, both during the dry and rainy seasons, rubber plantation soils occasionally showed CH4 as a source; however, overall, N2O and CO2 were sources while CH4 acted as a sink. The average emissions of N2O, CO2, and CH4 were 0.058, 333.2, and –0.027 mg m−2 h−1, respectively. Our findings align with those of Zhou, who observed similar results in rubber plantations in Xishuangbanna [8,9], where CO2 and CH4 emissions were 359 ± 91 and –0.020 ± 0.087 mg m−2 h−1 (mean ± SD), respectively, while N2O emissions varied from 0.014 to 0.58 mg N m−2 h−1 across different fertilization sites. In contrast, another intercropping study found that the soils of different aged rubber trees and those intercropped with large-leaf taro acted as a net CH4 sink during the dry season but as a net CH4 source during the rainy season [22]. Forests play a crucial role in terrestrial ecosystems, accounting for 62% of global soil CH4 sinks. Although the amount of CH4 absorbed in our study area was relatively low, research has indicated that soil organic carbon is key in global-scale CH4 sinks. Increased soil organic carbon enhances CH4 absorption; thus, a reduction in soil organic carbon could lead to decreased CH4 sinks, contributing to climate warming through positive feedback as CO2 emissions rise [32]. Our study observed that as N2O emissions increased, CO2 emissions also rose. This correlation arises because N2O and CO2 are typically generated through microbial metabolic activities in the soil, sharing common sources. While the factors influencing N2O and CO2 emissions differ, there are some similarities, particularly regarding soil moisture and temperature. An increase in soil moisture typically increases the availability of water in the soil, creating a more favorable environment for microbial growth and activity. Under these conditions, microbial metabolic activities accelerate, including organic matter decomposition and N2O production, leading to an increase in the emissions of both gases [11,33,34,35,36]. Higher soil temperatures generally promote microbial activity, speeding up organic matter decomposition and metabolic processes, which results in more carbon sources being released into the soil and enhanced CO2 production [8,37,38,39]. Similarly, elevated soil temperatures can accelerate the production of N2O, as many N2O-producing bacterial strains are more adapted to higher temperatures. Thus, warmer soils typically exhibit higher N2O emissions [27,28,40].

5. Conclusions

The N2O flux in rubber plantations shows minimal diurnal variation during both the dry and rainy seasons, with average emissions of 0.030 ± 0.002 mg·m−2·h−1. Seasonal trends indicate that summer emissions are higher than those in winter, resulting in an annual N2O flux of 3.0 kg·hm−2·a−1, equivalent to 1.9 kg N·hm−2·a−1. The flux is highly influenced by environmental factors, with soil temperature explaining approximately 46% of the variability and soil moisture accounting for 40%. Additionally, both surface and subsurface soil ammonium nitrogen levels are significantly correlated with N2O emissions.
This study demonstrates that rubber plantation soils act as sources of N2O and CO2, while CH4 serves as a sink, regardless of the season. Diurnally, N2O and CO2 emissions are lower during the day and increase at night, whereas CH4 absorption is greater during the day. N2O emissions contribute less than 2% to the CO2 emissions, with CH4 absorption comprising only 0.3%. There is a significant correlation between nitrogen and carbon gas emissions, particularly in the dry season, where the correlation between N2O and CO2 emissions is highly significant (R2 = 0.740, p < 0.001).
While this research focuses on a specific case study in a rubber plantation, its findings can be expanded to broader applications. The demonstrated relationships between environmental factors and GHG emissions, as well as the observed carbon–nitrogen coupling, have implications for the understanding of GHG dynamics in other tropical agroforestry systems. This study highlights the importance of considering both seasonal and environmental variables when assessing GHG emissions in managed ecosystems, and future research could build on these insights to explore wider regional or global patterns in tropical plantations. By expanding on this case study, the findings can inform strategies for climate change mitigation in similar ecosystems, providing a framework for broader studies of GHG emissions in tropical agriculture.

Author Contributions

Conceptualization, S.Y. and Z.W.; methodology, S.Y.; software, S.Y. and W.T.; validation, S.Y., Y.X. and B.S.; formal analysis, S.Y.; investigation, S.Y. and Q.H.; resources, M.F.; data curation, S.Y. and B.S.; writing—original draft preparation, S.Y.; writing—review and editing, S.Y., Y.X. and Z.W.; visualization, S.Y.; supervision, M.F. and Z.W.; project administration, Y.X. and Z.W.; funding acquisition, M.F. and Z.W. All authors have read and agreed to the published version of the manuscript.

Funding

This research was funded by Science and Technology Innovation Foundation of Command Center of Integrated Natural Resources Survey Center, grant number KC20230018; China Geological Survey project, grant number DD20242562; Hainan Province Science and Technology Special Fund, grant number ZDYF2021SHFZ257 and China Agriculture Research System, grant number CARS-33-ZP3.

Institutional Review Board Statement

Not applicable.

Informed Consent Statement

Not applicable.

Data Availability Statement

The data are available on request from the corresponding author.

Acknowledgments

We would like to thank Qingmao Fu, Junyi Liu, Junxiang Chen, Tong Pang, Jinyin Yang, Yuying Jiang, and Qinghui Zang for their help with the diurnal experiment in this study.

Conflicts of Interest

The authors declare no conflicts of interest.

References

  1. He, T.; Ding, W.; Cheng, X.; Cai, Y.; Zhang, Y.; Xia, H.; Wang, X.; Zhang, J.; Zhang, K.; Zhang, Q. Meta-analysis shows the impacts of ecological restoration on greenhouse gas emissions. Nat. Commun. 2024, 15, 2668. [Google Scholar] [CrossRef] [PubMed]
  2. Samset, B.H.; Sand, M.; Smith, C.J.; Bauer, S.E.; Forster, P.M.; Fuglestvedt, J.S.; Osprey, S.; Schleussner, C.F. Climate impacts from a removal of anthropogenic aerosol emissions. Geophys. Res. Lett. 2018, 45, 1020–1029. [Google Scholar] [CrossRef] [PubMed]
  3. Bonan, G.B. Forests and climate change: Forcings, feedbacks, and the climate benefits of forests. Science 2008, 320, 1444–1449. [Google Scholar] [CrossRef]
  4. Feng, Z.; Wang, L.; Wan, X.; Yang, J.; Peng, Q.; Liang, T.; Wang, Y.; Zhong, B.; Rinklebe, J. Responses of soil greenhouse gas emissions to land use conversion and reversion—A global meta-analysis. Glob. Change Biol. 2022, 28, 6665–6678. [Google Scholar] [CrossRef] [PubMed]
  5. Deshmukh, C.S.; Julius, D.; Desai, A.R.; Asyhari, A.; Page, S.E.; Nardi, N.; Susanto, A.P.; Nurholis, N.; Hendrizal, M.; Kurnianto, S.; et al. Conservation slows down emission increase from a tropical peatland in Indonesia. Nat. Geosci. 2021, 14, 484–490. [Google Scholar] [CrossRef]
  6. Toriyama, J.; Imaya, A.; Hirai, K.; Lim, T.K.; Hak, M.; Kiyono, Y. Effects of forest conversion to rubber plantation and of replanting rubber trees on soil organic carbon pools in a tropical moist climate zone. Agric. Ecosyst. Environ. 2022, 323, 107699. [Google Scholar] [CrossRef]
  7. Petsri, S.; Chidthaisong, A.; Pumijumnong, N.; Wachrinrat, C. Greenhouse gas emissions and carbon stock changes in rubber tree plantations in Thailand from 1990 to 2004. J. Clean. Prod. 2013, 52, 61–70. [Google Scholar] [CrossRef]
  8. Zhou, W.; Zhu, J.; Ji, H.; Grace, J.; Sha, L.; Song, Q.; Liu, Y.; Bai, X.; Lin, Y.; Gao, J.; et al. Drivers of difference in CO2 and CH4 emissions between rubber plantation and tropical rainforest soils. Agric. For. Meteorol. 2021, 304–305, 108391. [Google Scholar] [CrossRef]
  9. Zhou, W.J.; Ji, H.L.; Zhu, J.; Zhang, Y.-P.; Sha, L.-Q.; Liu, Y.-T.; Zhang, X.; Zhao, W.; Dong, Y.-x.; Bai, X.-L.; et al. The effects of nitrogen fertilization on N2O emissions from a rubber plantation. Sci. Rep. 2016, 6, 28230. [Google Scholar] [CrossRef]
  10. Nizami, S.M.; Zhang, Y.; Liqing, S.; Zhao, W.; Zhang, X. Managing carbon sinks in rubber (Hevea brasilensis) plantation by changing rotation length in SW China. PLoS ONE 2014, 9, e115234. [Google Scholar] [CrossRef]
  11. Chaddy, A.; Melling, L.; Ishikura, K.; Hatano, R. Soil N2O emissions under different N rates in an oil palm plantation on tropical peatland. Agriculture 2019, 9, 213. [Google Scholar] [CrossRef]
  12. Ishizuka, S.; Mori, T.; Nakayama, Y.; Kawabata, C.; Konda, R.; Sasaki, T.; Sawa, Y.; Hamotani, Y.; Gobara, Y.; Kuwashima, K.; et al. Effects of conversion from leguminous acacia to non-leguminous eucalyptus on soil N2O emissions in tropical monoculture plantations. For. Ecol. Manag. 2021, 481, 118702. [Google Scholar] [CrossRef]
  13. Ren, Y.; Lin, F.; Jiang, C.; Tang, J.; Fan, Z.; Feng, D.; Zeng, X.; Jin, Y.; Liu, C.; Olatunji, O.A. Understory vegetation management regulates soil carbon and nitrogen storage in rubber plantations. Nutr. Cycl. Agroecosyst. 2023, 127, 209–224. [Google Scholar] [CrossRef]
  14. Xu, X.; Wei, Y.; Lan, G. Geographical differences weaken the convergence effect of the rhizosphere bacteria of rubber trees. Forests 2024, 15, 415. [Google Scholar] [CrossRef]
  15. Bao, S. Soil Agrochemical Analysis; China Agriculture Press: Beijing, China, 2000. [Google Scholar]
  16. Zhang, Z.; Wang, J.; Sun, J.; Jiang, H.; Wei, T. A review of methods for measuring soil greenhouse gases. Chin. J. Appl. Environ. Biol. 2019, 25, 1228–1243. [Google Scholar] [CrossRef]
  17. Xu, X.; Fu, G.; Zou, X.; Ge, C.; Zhao, Y. Diurnal variations of carbon dioxide, methane, and nitrous oxide fluxes from invasive Spartina alterniflora dominated coastal wetland in northern Jiangsu Province. Acta Oceanol. Sin. 2017, 36, 105–113. [Google Scholar] [CrossRef]
  18. Keane, J.B.; Morrison, R.; McNamara, N.P.; Ineson, P. Real-time monitoring of greenhouse gas emissions with tall chambers reveals diurnal N2O variation and increased emissions of CO2 and N2O from Miscanthus following compost addition. GCB Bioenergy 2019, 11, 1456–1470. [Google Scholar] [CrossRef]
  19. Shurpali, N.J.; Rannik, Ü.; Jokinen, S.; Lind, S.; Biasi, C.; Mammarella, I.; Peltola, O.; Pihlatie, M.; Hyvönen, N.; Räty, M.; et al. Neglecting diurnal variations leads to uncertainties in terrestrial nitrous oxide emissions. Sci. Rep. 2016, 6, 25739. [Google Scholar] [CrossRef] [PubMed]
  20. Alves, B.J.R.; Smith, K.A.; Flores, R.A.; Cardoso, A.S.; Oliveira, W.R.D.; Jantalia, C.P.; Urquiaga, S.; Boddey, R.M. Selection of the most suitable sampling time for static chambers for the estimation of daily mean N2O flux from soils. Soil Biol. Biochem. 2012, 46, 129–135. [Google Scholar] [CrossRef]
  21. Reeves, S.; Wang, W. Optimum sampling time and frequency for measuring N2O emissions from a rain-fed cereal cropping system. Sci. Total Environ. 2015, 530–531, 219–226. [Google Scholar] [CrossRef]
  22. Rao, X.; Liu, C.-A.; Tang, J.-W.; Nie, Y.; Liang, M.-Y.; Shen, W.-J.; Siddique, K.H.M. Rubber-leguminous shrub systems stimulate soil N2O but reduce CO2 and CH4 emissions. For. Ecol. Manag. 2021, 480, 118665. [Google Scholar] [CrossRef]
  23. Hong, S.; Gong, H.; Zhu, X.; Song, Q.; Zhang, Y.; Zhou, W.; Zhang, X.; Sha, L. Response of soil N2O and CO2 emissions to nitrogen addition in Xishuangbanna tropical rain forest. J. West China For. Sci. 2023, 52, 118–127. [Google Scholar] [CrossRef]
  24. Bai, Z. N2O, CH4 Emissions from Soil of a Tropical Mountain Rainforest and Responds to Nutrients Additions in Hainan Island. Master’s Thesis, Northwest A&F University, Xianyang, China, 2015. [Google Scholar]
  25. Wang, Y.; Yao, Z.; Pan, Z.; Wang, R.; Yan, G.; Liu, C.; Su, Y.; Zheng, X.; Butterbach-Bahl, K. Tea-planted soils as global hotspots for N2O emissions from croplands. Environ. Res. Lett. 2020, 15, 104018. [Google Scholar] [CrossRef]
  26. Wang, X.; Li, Y.e.; Waqas, M.A.; Wang, B.; Hassan, W.; Qin, X. Divergent terrestrial responses of soil N2O emissions to different levels of elevated CO2 and temperature. Oikos 2021, 130, 1440–1449. [Google Scholar] [CrossRef]
  27. Jansen-Willems, A.B.; Lanigan, G.J.; Clough, T.J.; Andresen, L.C.; Müller, C. Long-term elevation of temperature affects organic N turnover and associated N2O emissions in a permanent grassland soil. Soil 2016, 2, 601–614. [Google Scholar] [CrossRef]
  28. Liao, J.; Luo, Q.; Hu, A.; Wan, W.; Tian, D.; Ma, J.; Ma, T.; Luo, H.; Lu, S. Soil moisture–atmosphere feedback dominates land N2O nitrification emissions and denitrification reduction. Glob. Change Biol. 2022, 28, 6404–6418. [Google Scholar] [CrossRef]
  29. Zheng, Q.; Ding, J.; Li, Y.; Lin, W.; Xu, C.; Li, Q.; Mao, L. The effects of soil water content on N2O emissions and isotopic signature of nitrification and denitrification. Sci. Agric. Sin. 2017, 50, 4747–4758. [Google Scholar] [CrossRef]
  30. Li, Z.; Zeng, Z.; Song, Z.; Tian, D.; Huang, X.; Nie, S.; Wang, J.; Jiang, L.; Luo, Y.; Cui, J.; et al. Variance and main drivers of field nitrous oxide emissions: A global synthesis. J. Clean. Prod. 2022, 353, 131686. [Google Scholar] [CrossRef]
  31. Wang, H.; Yan, Z.; Ju, X.; Song, X.; Zhang, J.; Li, S.; Zhu-Barker, X. Quantifying nitrous oxide production rates from nitrification and denitrification under various moisture conditions in agricultural soils: Laboratory study and literature synthesis. Front. Microbiol. 2023, 13, 1110151. [Google Scholar] [CrossRef]
  32. Lee, J.; Oh, Y.; Lee, S.T.; Seo, Y.O.; Yun, J.; Yang, Y.; Kim, J.; Zhuang, Q.; Kang, H. Soil organic carbon is a key determinant of CH4 sink in global forest soils. Nat. Commun. 2023, 14, 3110. [Google Scholar] [CrossRef]
  33. Kumagai, T.o.; Mudd, R.G.; Miyazawa, Y.; Liu, W.; Giambelluca, T.W.; Kobayashi, N.; Lim, T.K.; Jomura, M.; Matsumoto, K.; Huang, M.; et al. Simulation of canopy CO2/H2O fluxes for a rubber (Hevea brasiliensis) plantation in central Cambodia: The effect of the regular spacing of planted trees. Ecol. Model. 2013, 265, 124–135. [Google Scholar] [CrossRef]
  34. Mori, T.; Wachrinrat, C.; Staporn, D.; Aoyagi, R.; Meunpong, P.; Suebsai, W.; Boonsri, K.; Kitayama, K. Possibility of avoiding legumes-deriving boost of N2O emissions in tropical monoculture tree plantations. J. For. Res. 2023, 34, 565–573. [Google Scholar] [CrossRef]
  35. Zhang, H.; Zhou, G.; Wang, Y.; Tang, C.; Cai, Y. Clear-cut and forest regeneration increase soil N2O emission in Cunninghamia lanceolata plantations. Geoderma 2021, 401, 115238. [Google Scholar] [CrossRef]
  36. Wakhid, N.; Nurzakiah, S. Soil CO2 emissions from a rubber plantation on tropical peat during a strong El Niño year. IOP Conf. Ser. Earth Environ. Sci. 2021, 648, 012098. [Google Scholar] [CrossRef]
  37. Fernández-Martínez, M.; Sardans, J.; Chevallier, F.; Ciais, P.; Obersteiner, M.; Vicca, S.; Canadell, J.G.; Bastos, A.; Friedlingstein, P.; Sitch, S.; et al. Global trends in carbon sinks and their relationships with CO2 and temperature. Nat. Clim. Change 2019, 9, 73–79. [Google Scholar] [CrossRef]
  38. Fei, X.; Song, Q.; Zhang, Y.; Liu, Y.; Sha, L.; Yu, G.; Zhang, L.; Duan, C.; Deng, Y.; Wu, C.; et al. Carbon exchanges and their responses to temperature and precipitation in forest ecosystems in Yunnan, Southwest China. Sci. Total Environ. 2018, 616, 824–840. [Google Scholar] [CrossRef]
  39. Chayawat, C.; Satakhun, D.; Kasemsap, P.; Sathornkich, J.; Phattaralerphong, J. Environmental controls on net CO2 exchange over a young rubber plantation in Northeastern Thailand. ScienceAsia 2019, 45, 50–59. [Google Scholar] [CrossRef]
  40. Abdalla, M.; Jones, M.; Smith, P.; Williams, M. Nitrous oxide fluxes and denitrification sensitivity to temperature in Irish pasture soils. Soil Use Manag. 2009, 25, 376–388. [Google Scholar] [CrossRef]
Figure 1. GHG sampling chamber structure diagram: (A) chamber base collar, (B) chamber, and (C) operation chart.
Atmosphere 15 01245 g001
Figure 2. Standard curves of (A) total nitrogen, (B) ammonium nitrogen, and (C) nitrate nitrogen.
Atmosphere 15 01245 g002
Figure 3. Diurnal variation in rubber plantation GHG emissions in rainy and dry seasons. (A) N2O diurnal variation in rainy season; (B) N2O diurnal variation in dry season; (C) CO2 diurnal variation in rainy season; (D) CO2 diurnal variation in dry season; (E) CH4 diurnal variation in rainy season; (F) CH4 diurnal variation in dry season.
Atmosphere 15 01245 g003
Figure 4. Seasonal variation in rubber plantation GHG emissions. (A) N2O; (B) CO2; (C) CH4.
Atmosphere 15 01245 g004
Figure 5. Relationship between temperature, soil water content, and N2O emissions. (A) air temperature; (B) soil temperature; (C) soil water content.
Atmosphere 15 01245 g005
Figure 6. Relationship between temperature, soil water content, and CO2 emissions. (A) air temperature; (B) soil temperature; (C) soil water content.
Atmosphere 15 01245 g006
Figure 7. Relationship between temperature, soil water content, and CH4 emissions. (A) air temperature; (B) soil temperature; (C) soil water content.
Atmosphere 15 01245 g007
Figure 8. Relationship between soil carbon and nitrogen content and N2O emissions. (A) SOC (0–20 cm soil); (B) NO3-N (0–20 cm soil); (C) NH4-N (0–20 cm soil); (D) TN (0–20 cm soil); (E) SOC (20–40 cm soil); (F) NO3-N (20–40 cm soil); (G) NH4-N (20–40 cm soil); (H) TN (20–40 cm soil).
Atmosphere 15 01245 g008
Figure 9. Relationship between soil carbon and nitrogen content and CO2 emissions. (A) SOC (0–20 cm soil); (B) NO3-N (0–20 cm soil); (C) NH4-N (0–20 cm soil); (D) TN (0–20 cm soil); (E) SOC (20–40 cm soil); (F) NO3-N (20–40 cm soil); (G) NH4-N (20–40 cm soil); (H) TN (20–40 cm soil).
Atmosphere 15 01245 g009
Figure 10. Relationship between soil carbon and nitrogen content and CH4 emissions. (A) SOC (0–20 cm soil); (B) NO3-N (0–20 cm soil); (C) NH4-N (0–20 cm soil); (D) TN (0–20 cm soil); (E) SOC (20–40 cm soil); (F) NO3-N (20–40 cm soil); (G) NH4-N (20–40 cm soil); (H) TN (20–40 cm soil).
Atmosphere 15 01245 g010
Figure 11. Regression of rubber plantation’s N2O, CO2, and CH4 emissions. (A) N2O and CO2 in rainy season; (B) N2O and CO2 in dry season; (C) N2O and CH4 in rainy season; (D) N2O and CH4 in dry season.
Atmosphere 15 01245 g011
Disclaimer/Publisher’s Note: The statements, opinions and data contained in all publications are solely those of the individual author(s) and contributor(s) and not of MDPI and/or the editor(s). MDPI and/or the editor(s) disclaim responsibility for any injury to people or property resulting from any ideas, methods, instructions or products referred to in the content.

