
Enhancing Tomato Production by Using Non-Conventional Water Resources within Integrated Sprinkler Irrigation Systems in Arid Regions


 ,
,  ,
,  ,
,  and
and
Abstract
1. Introduction
2. Materials and Methods
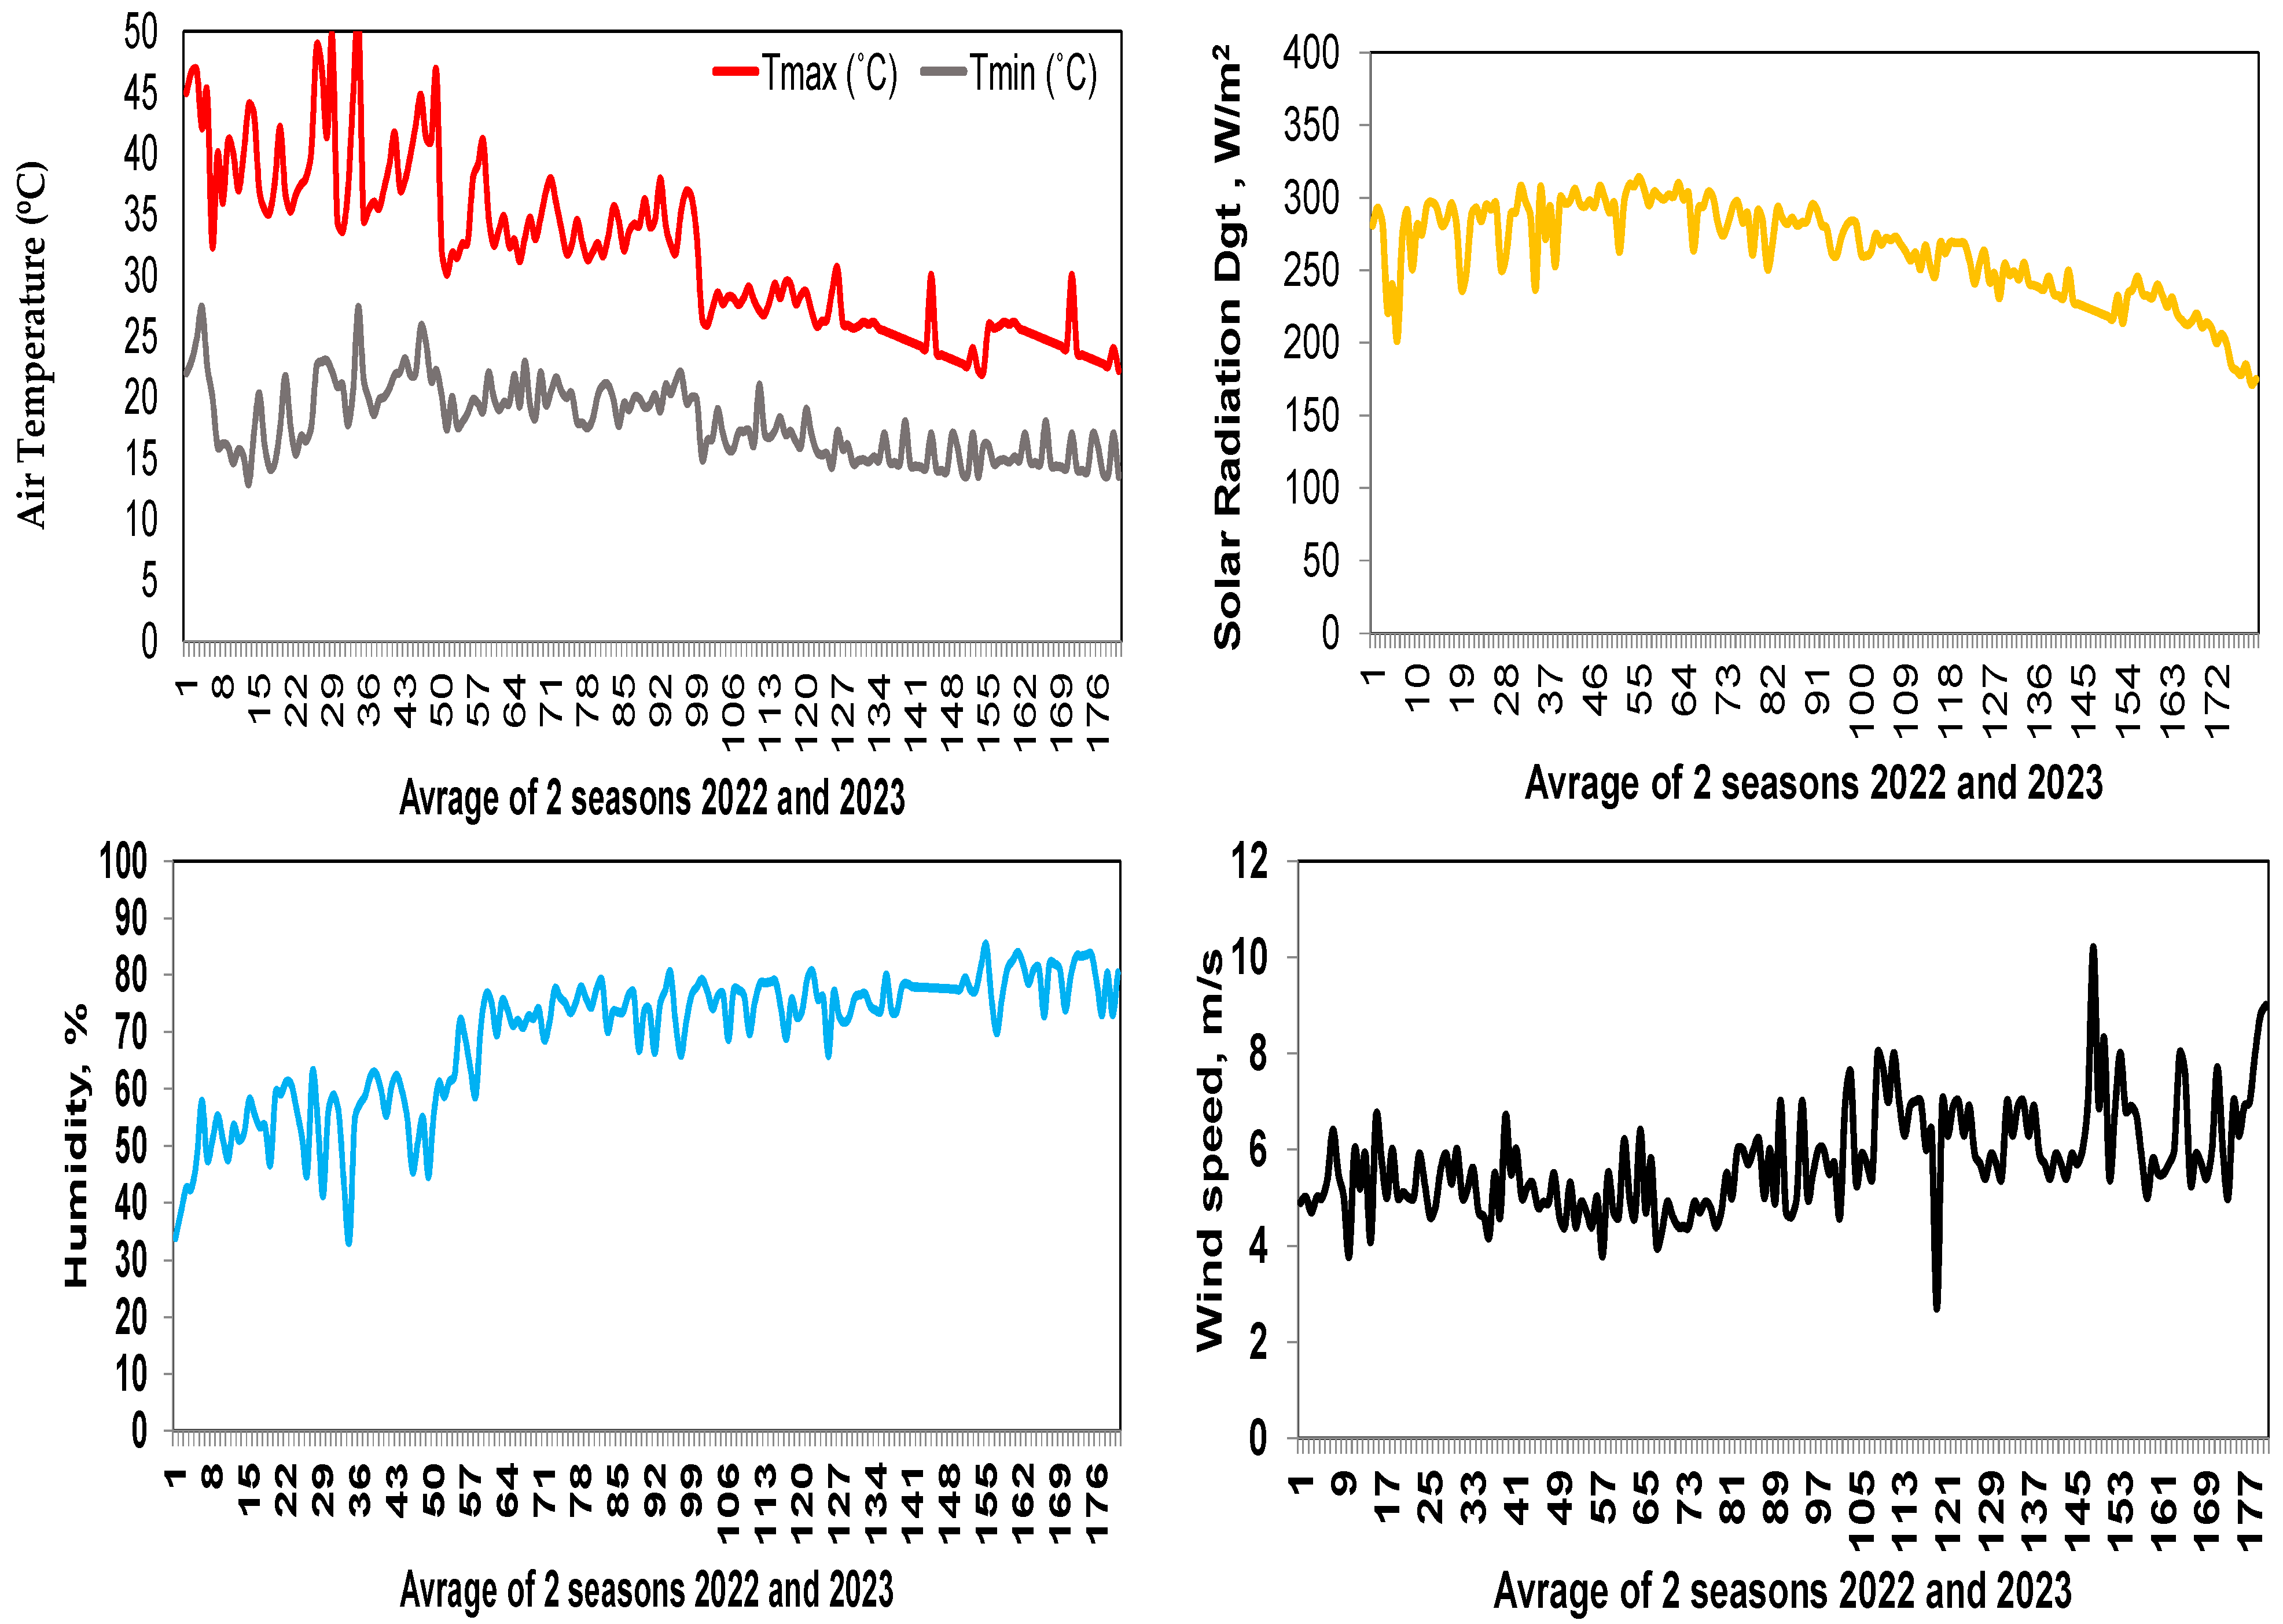
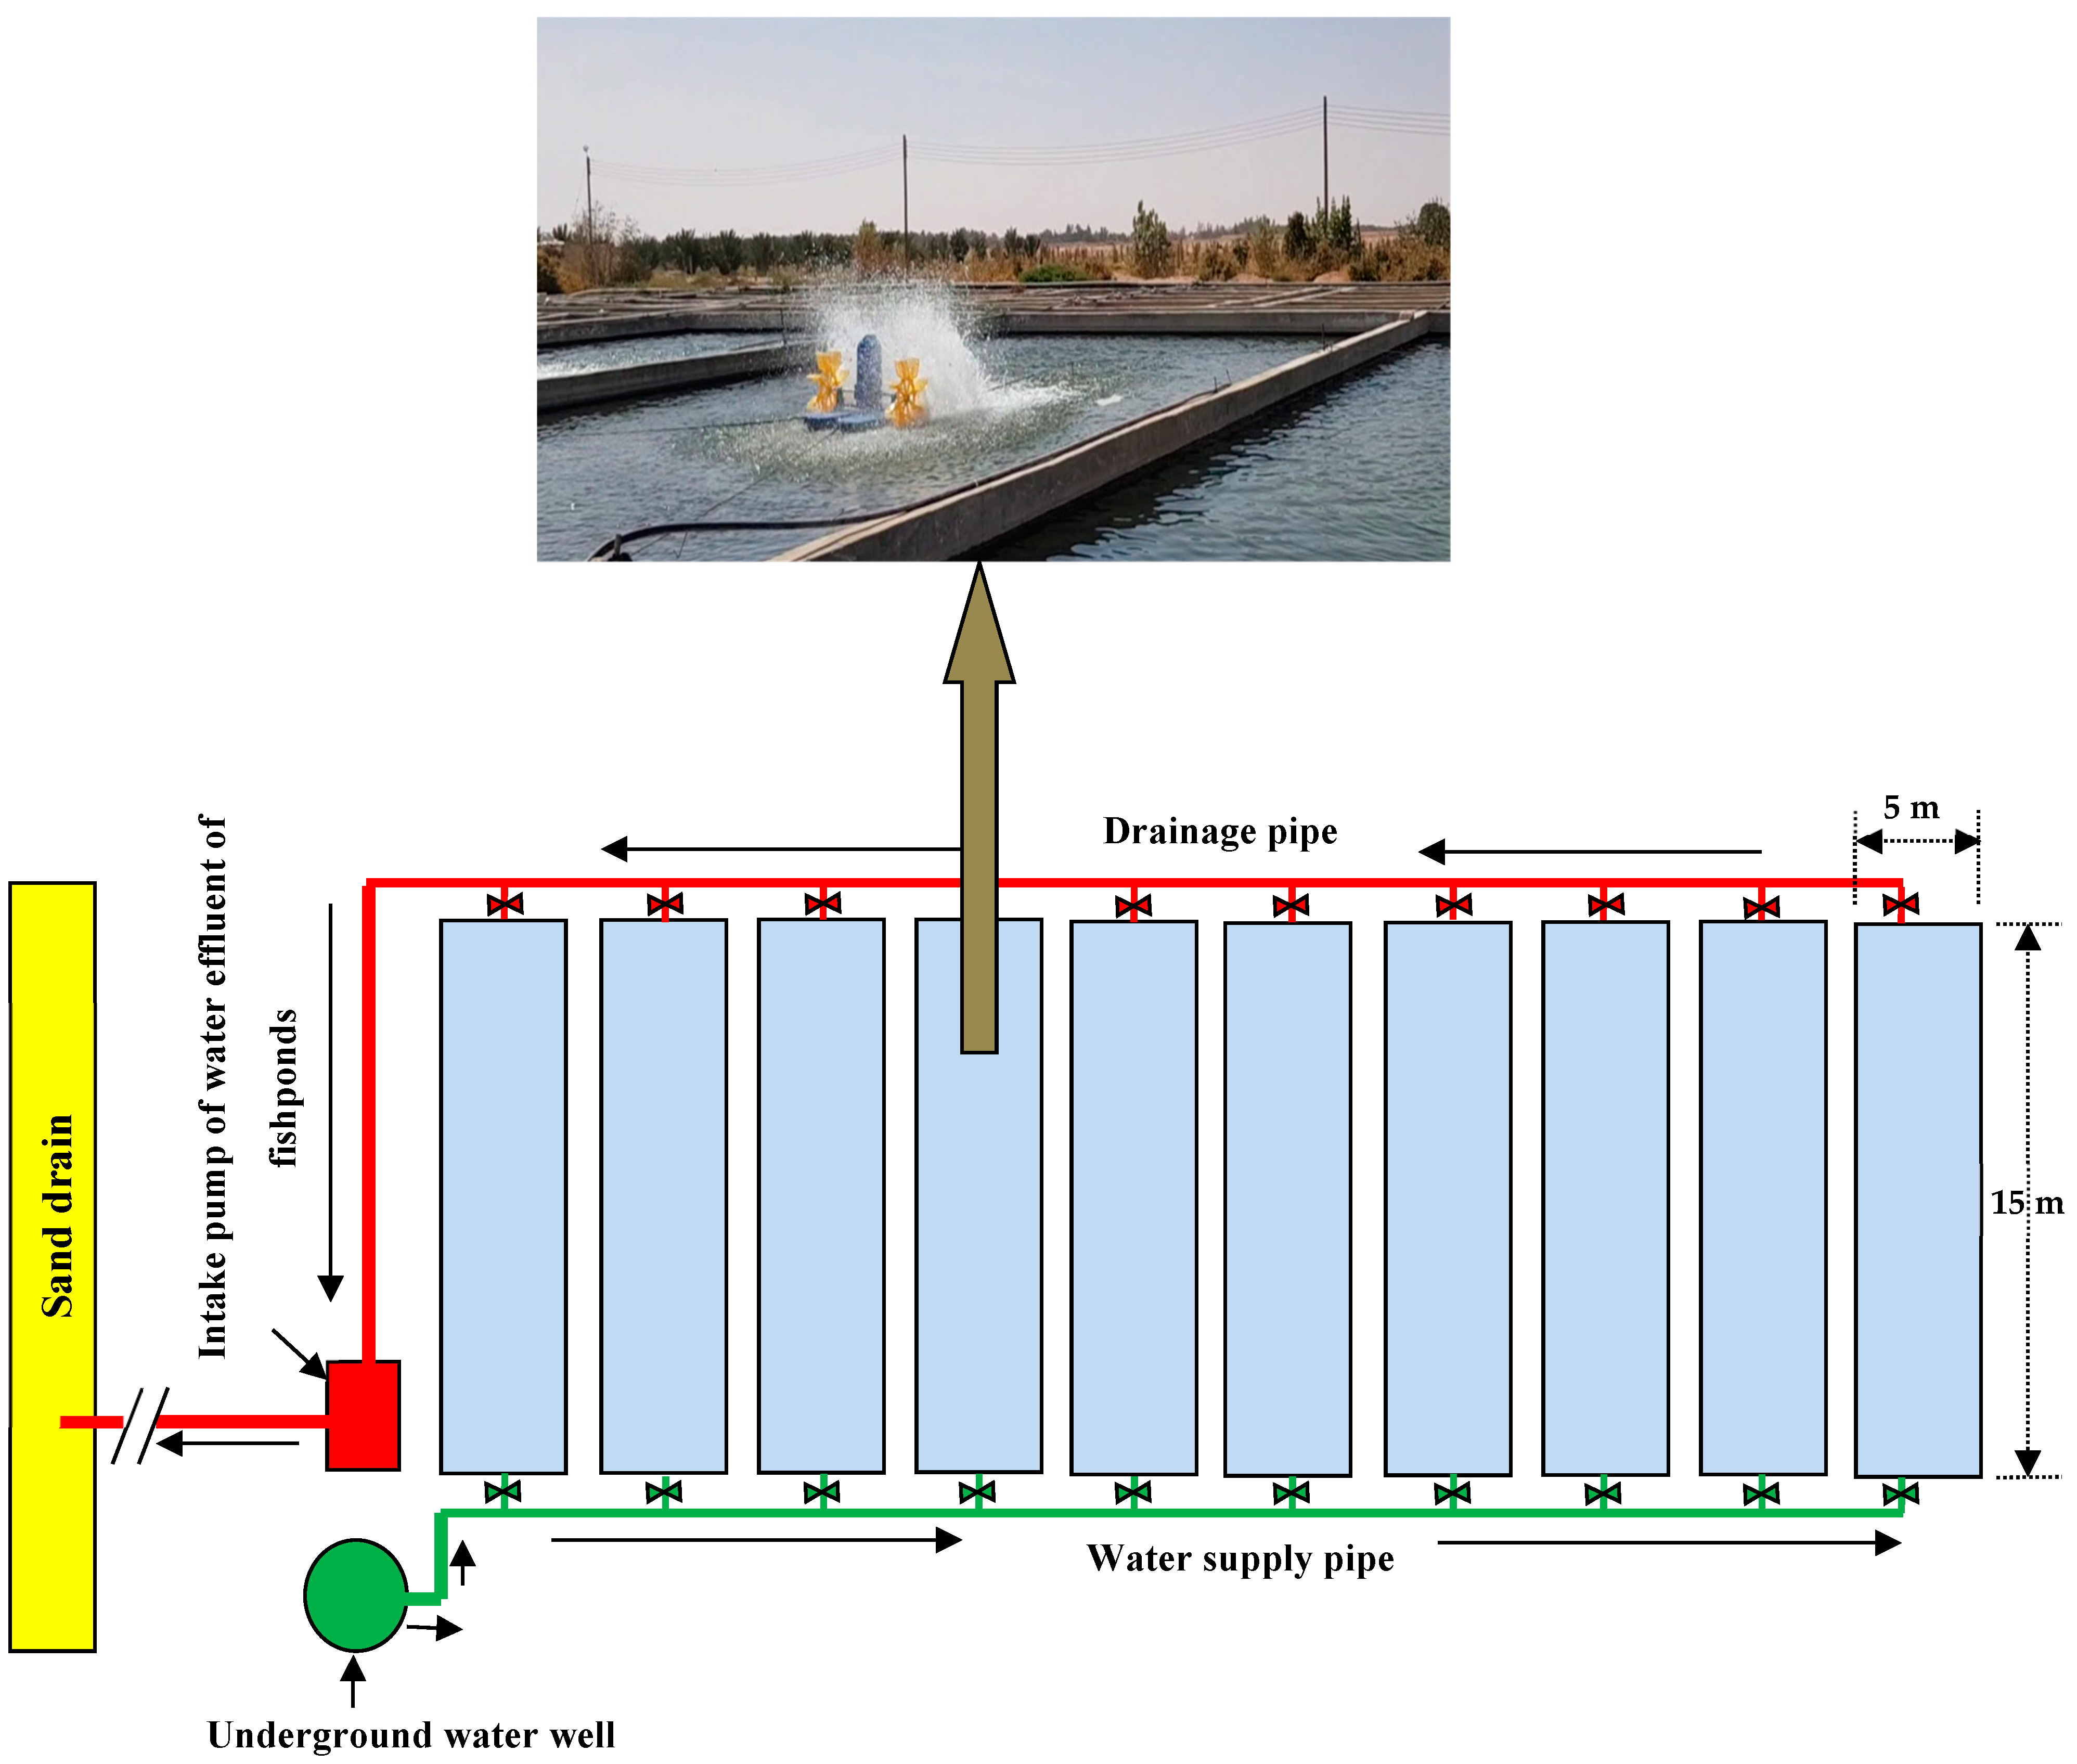
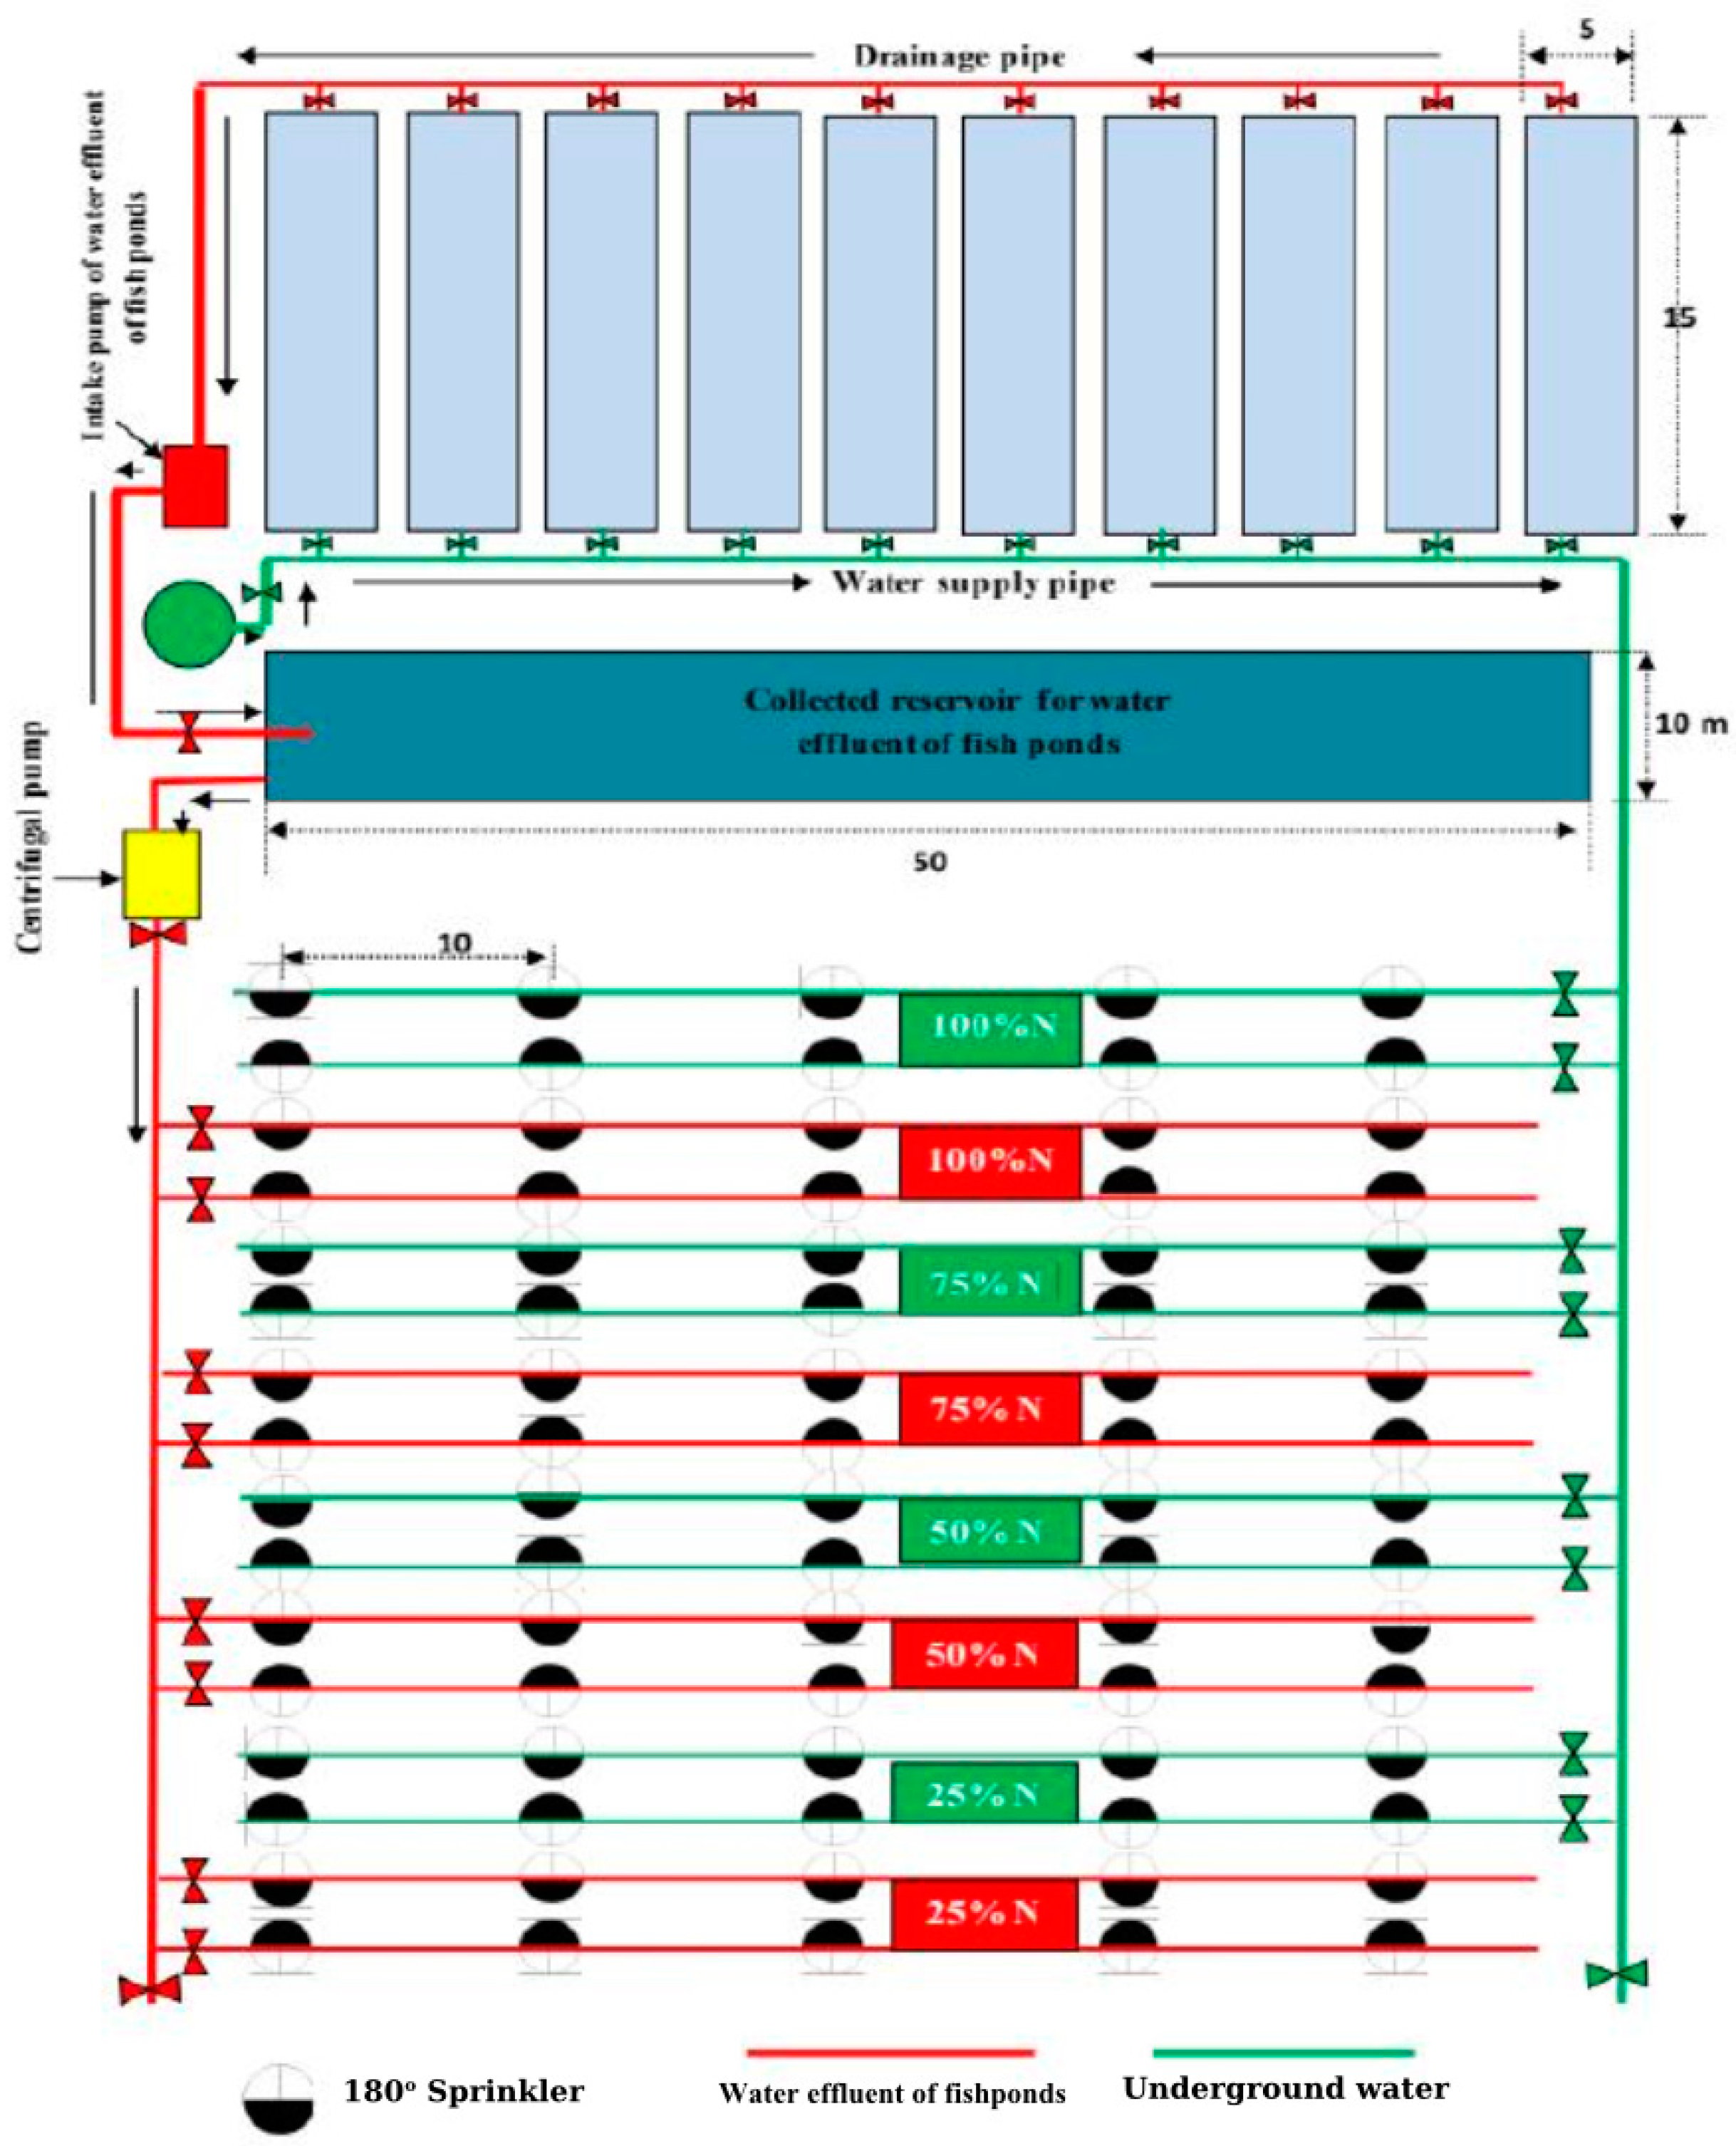
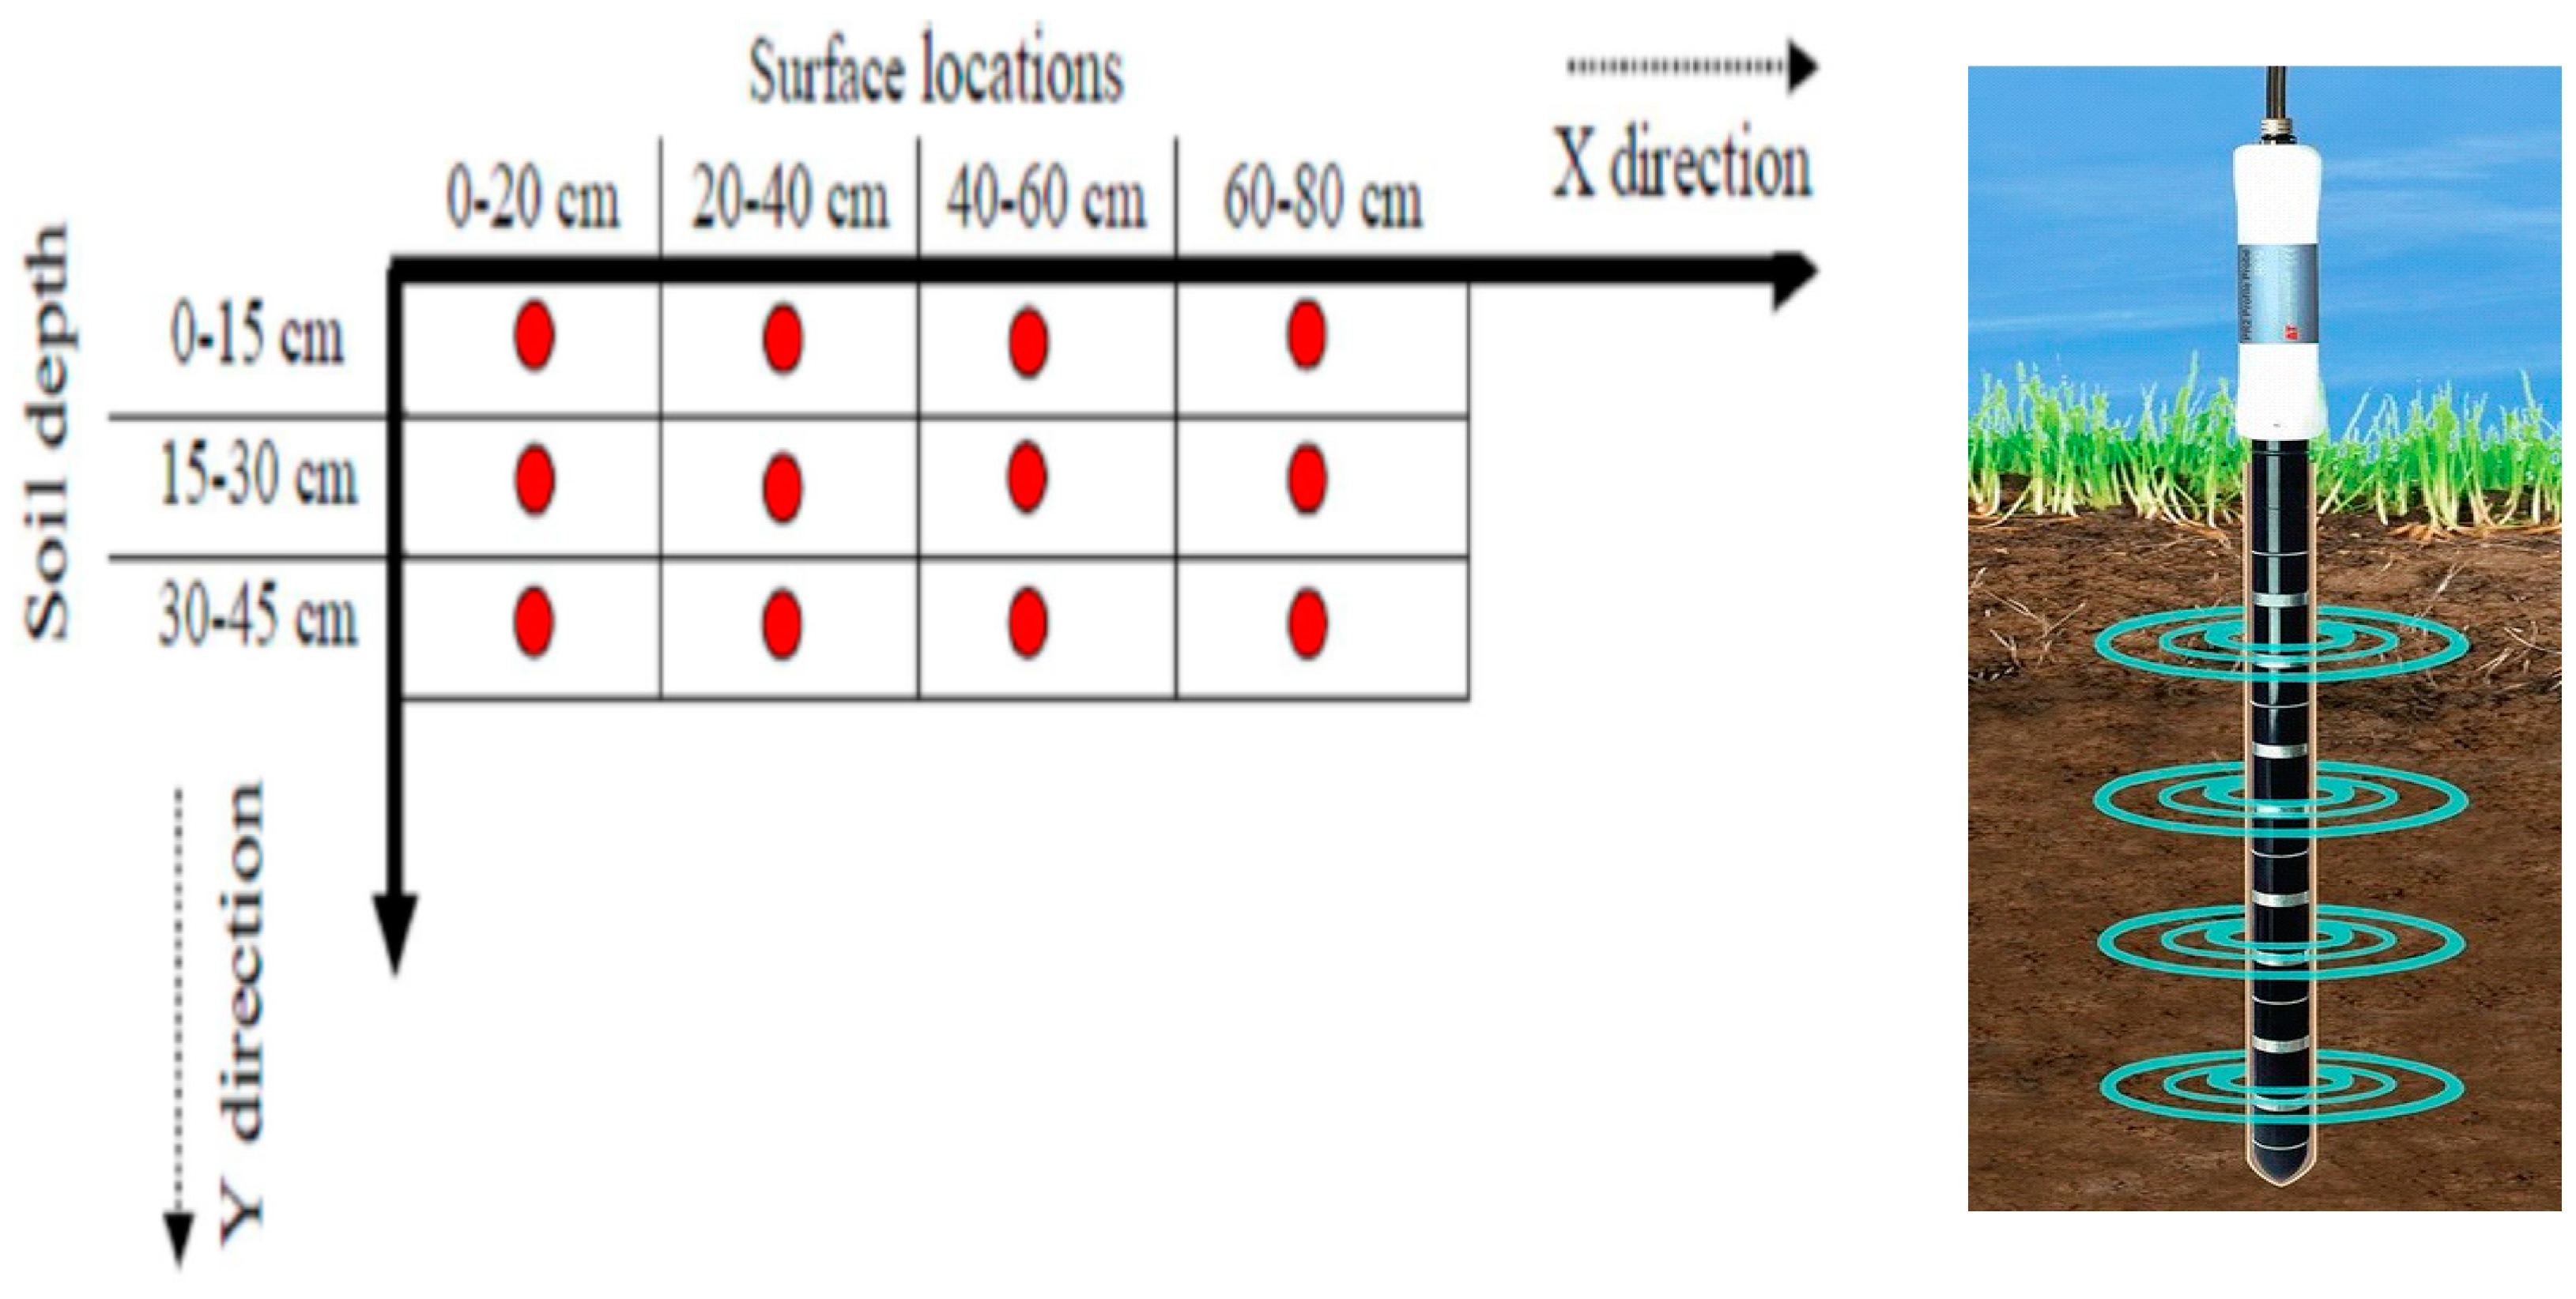
2.1. Site Description
2.2. Evaluation Parameters
3. Results and Discussion
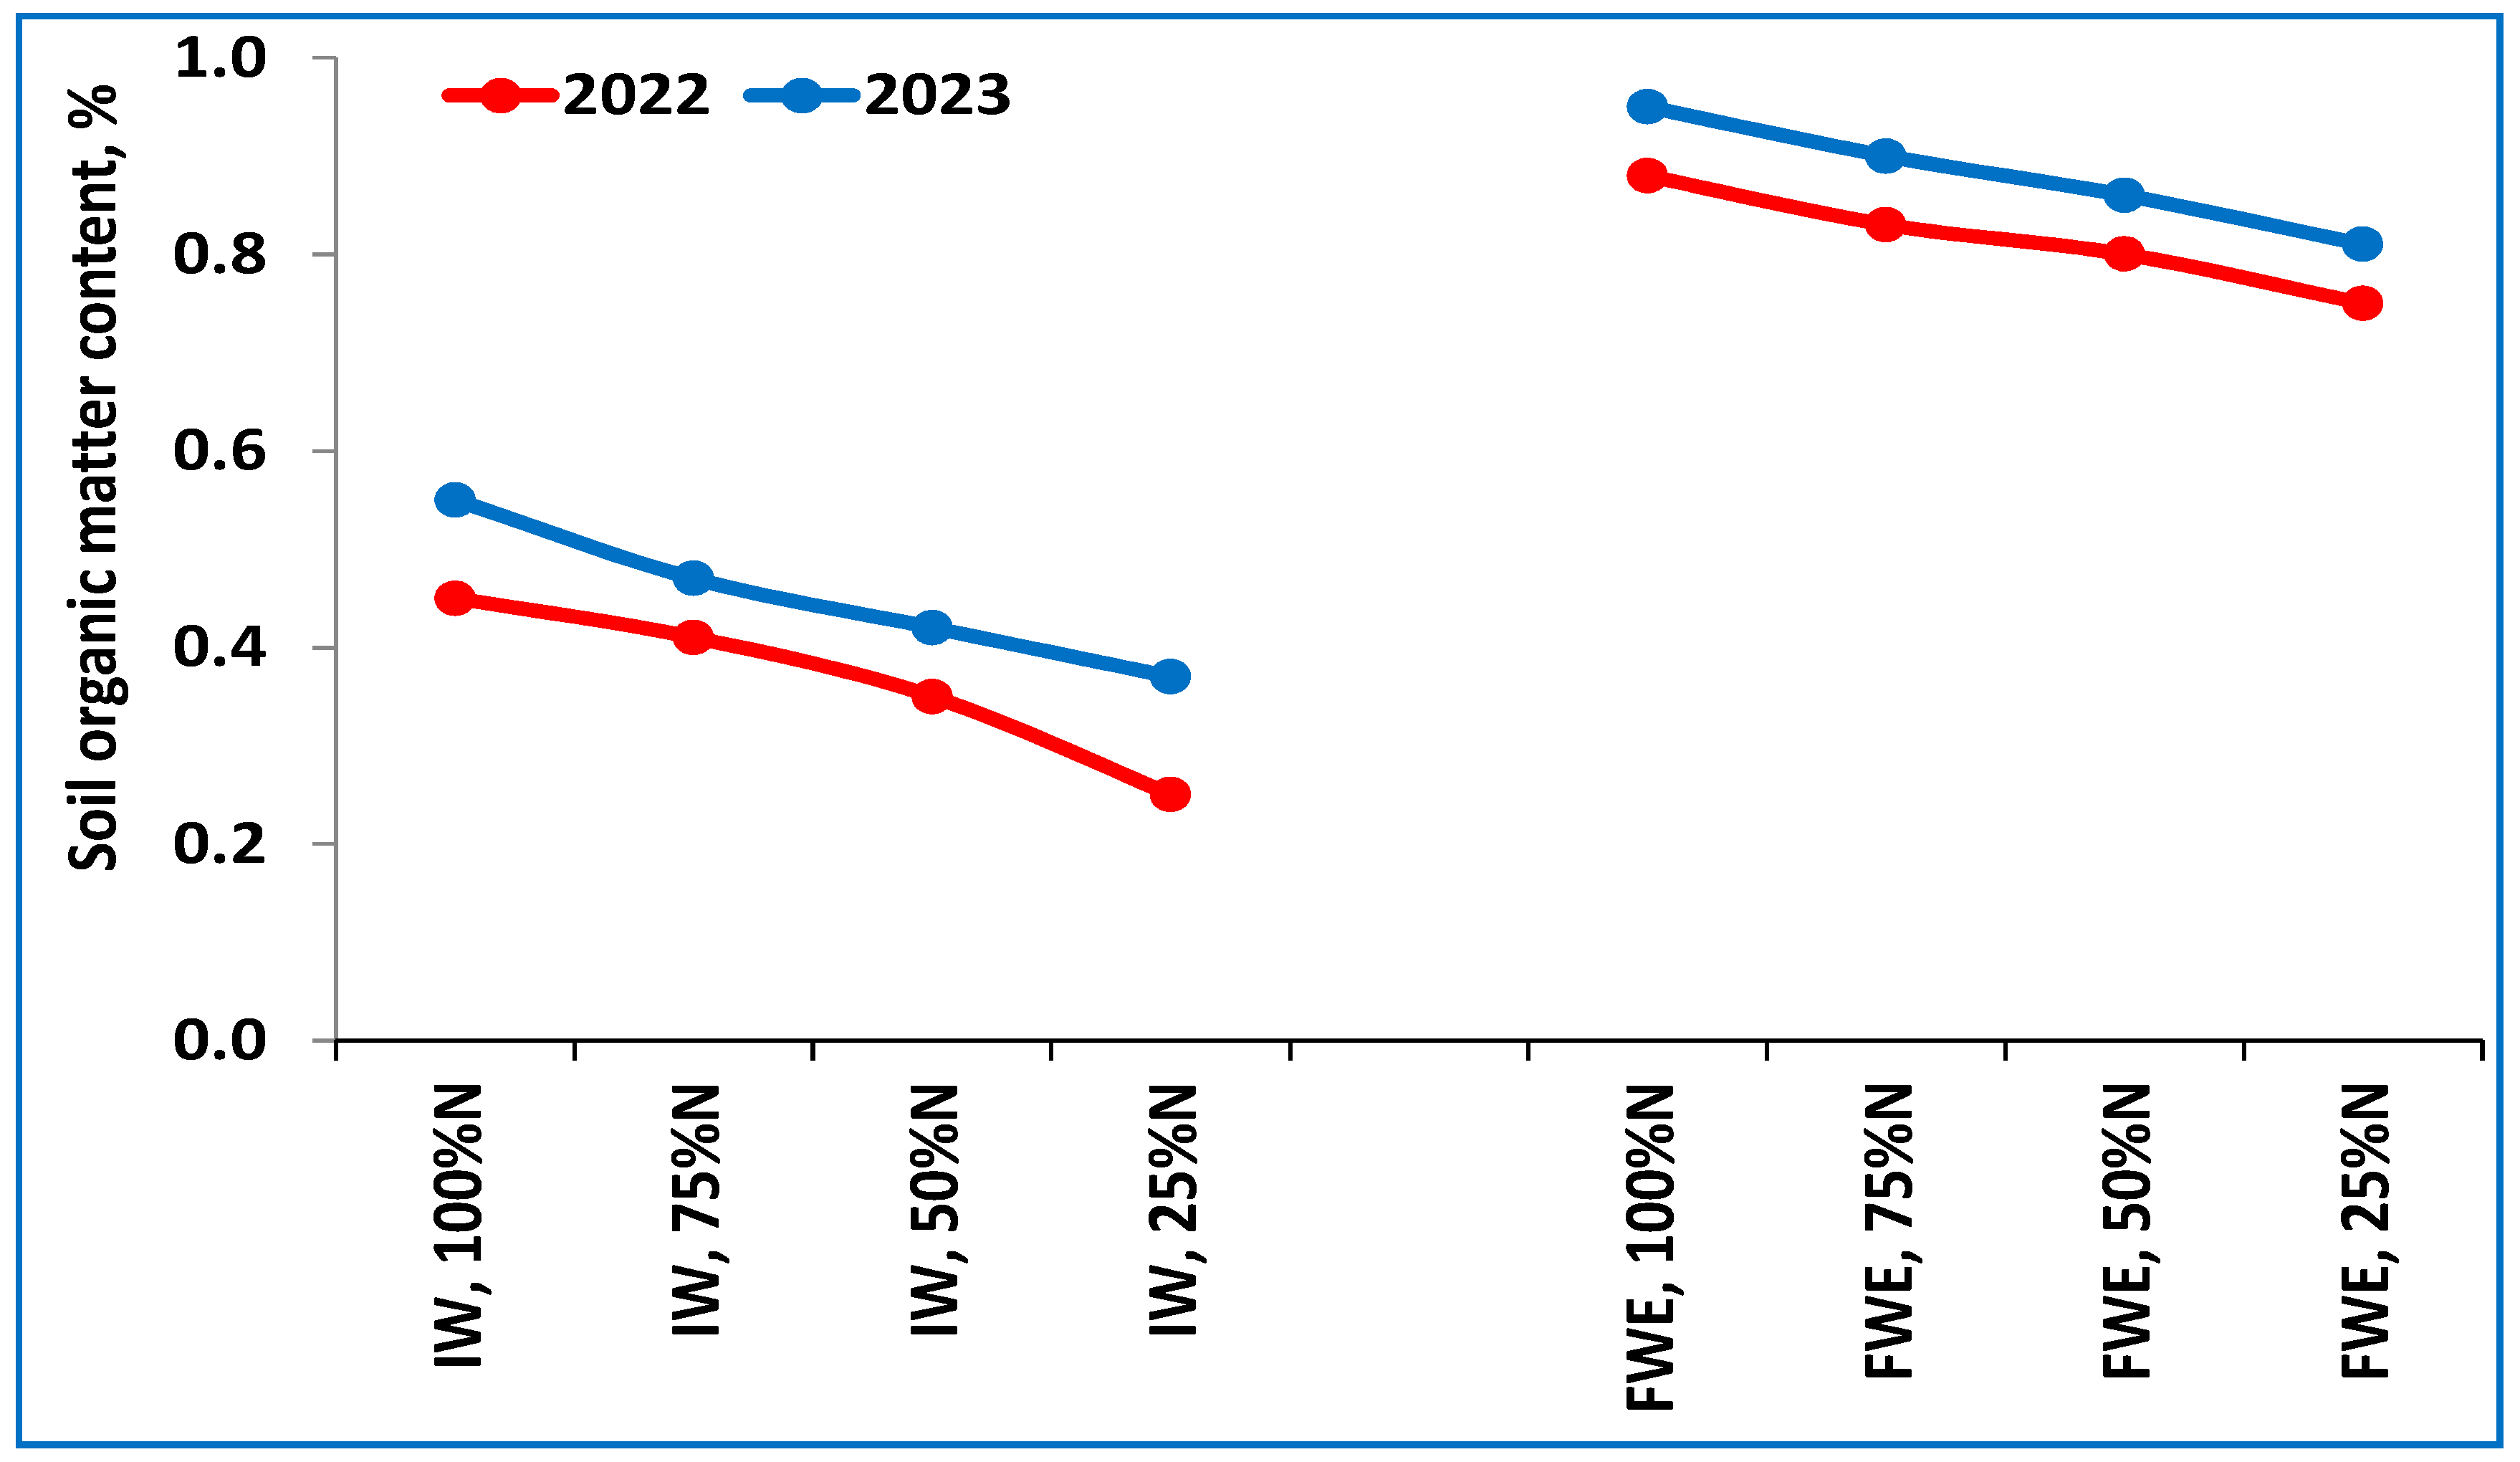
3.1. Soil Organic Matter
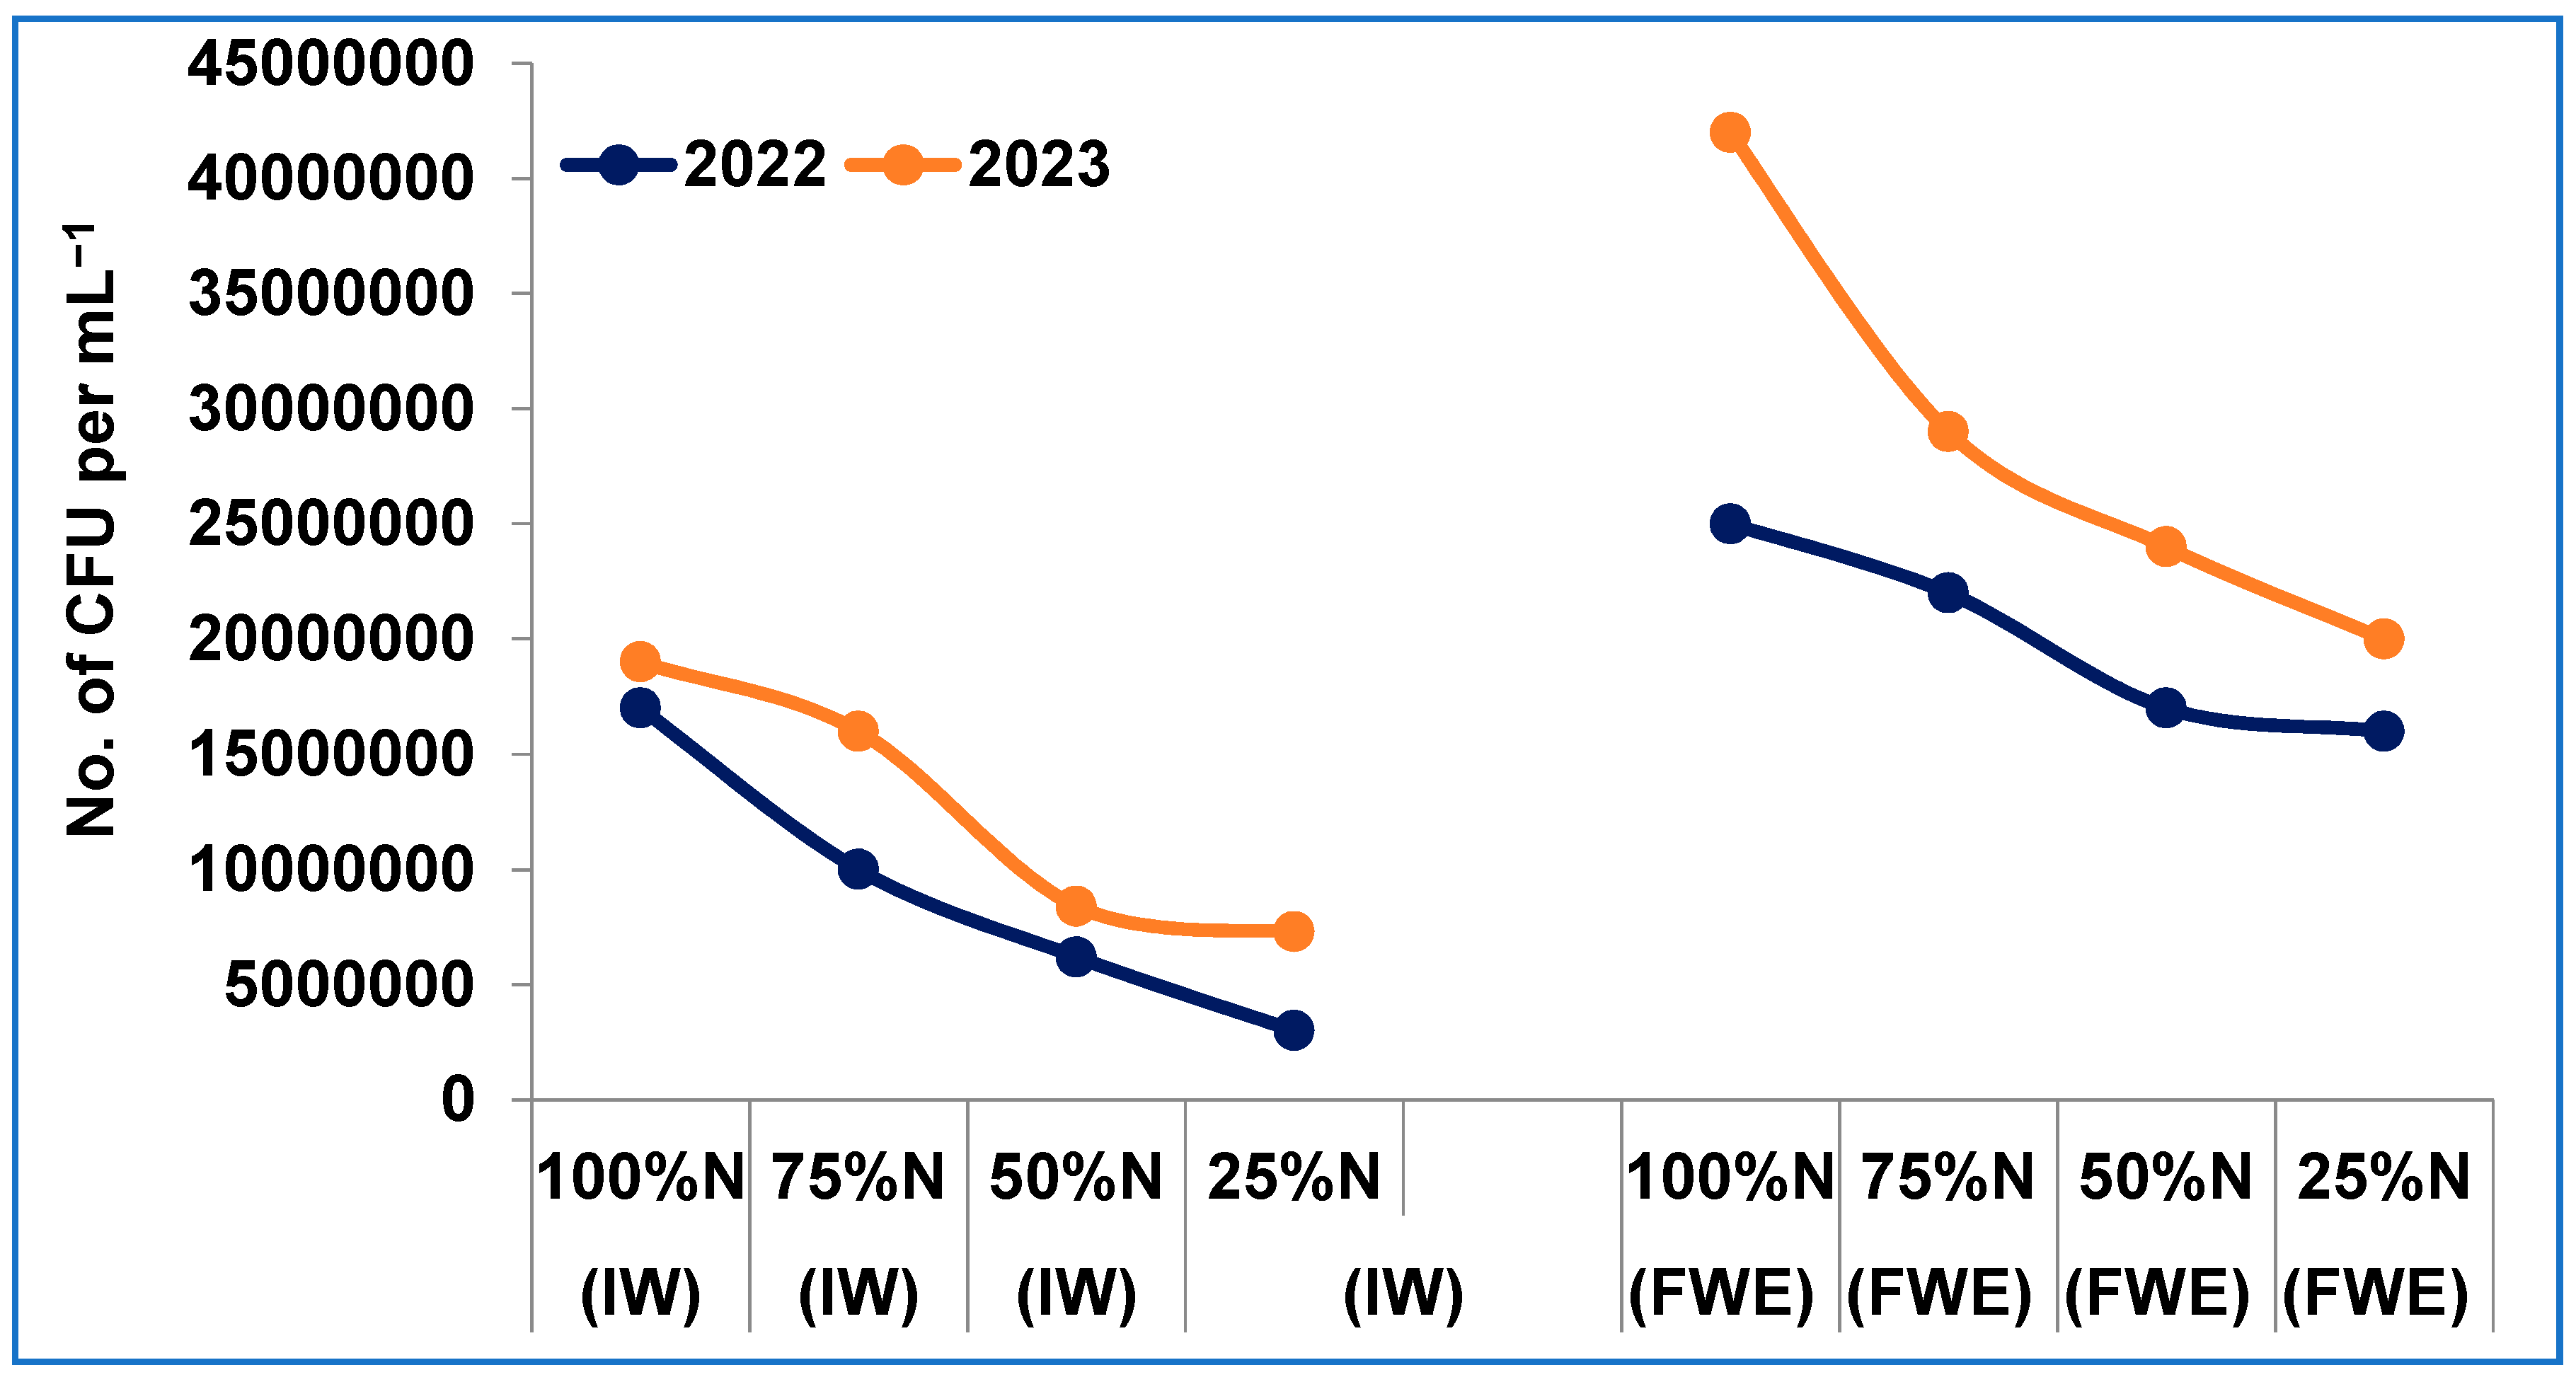
3.2. Activity of Microorganisms in the Root Zone
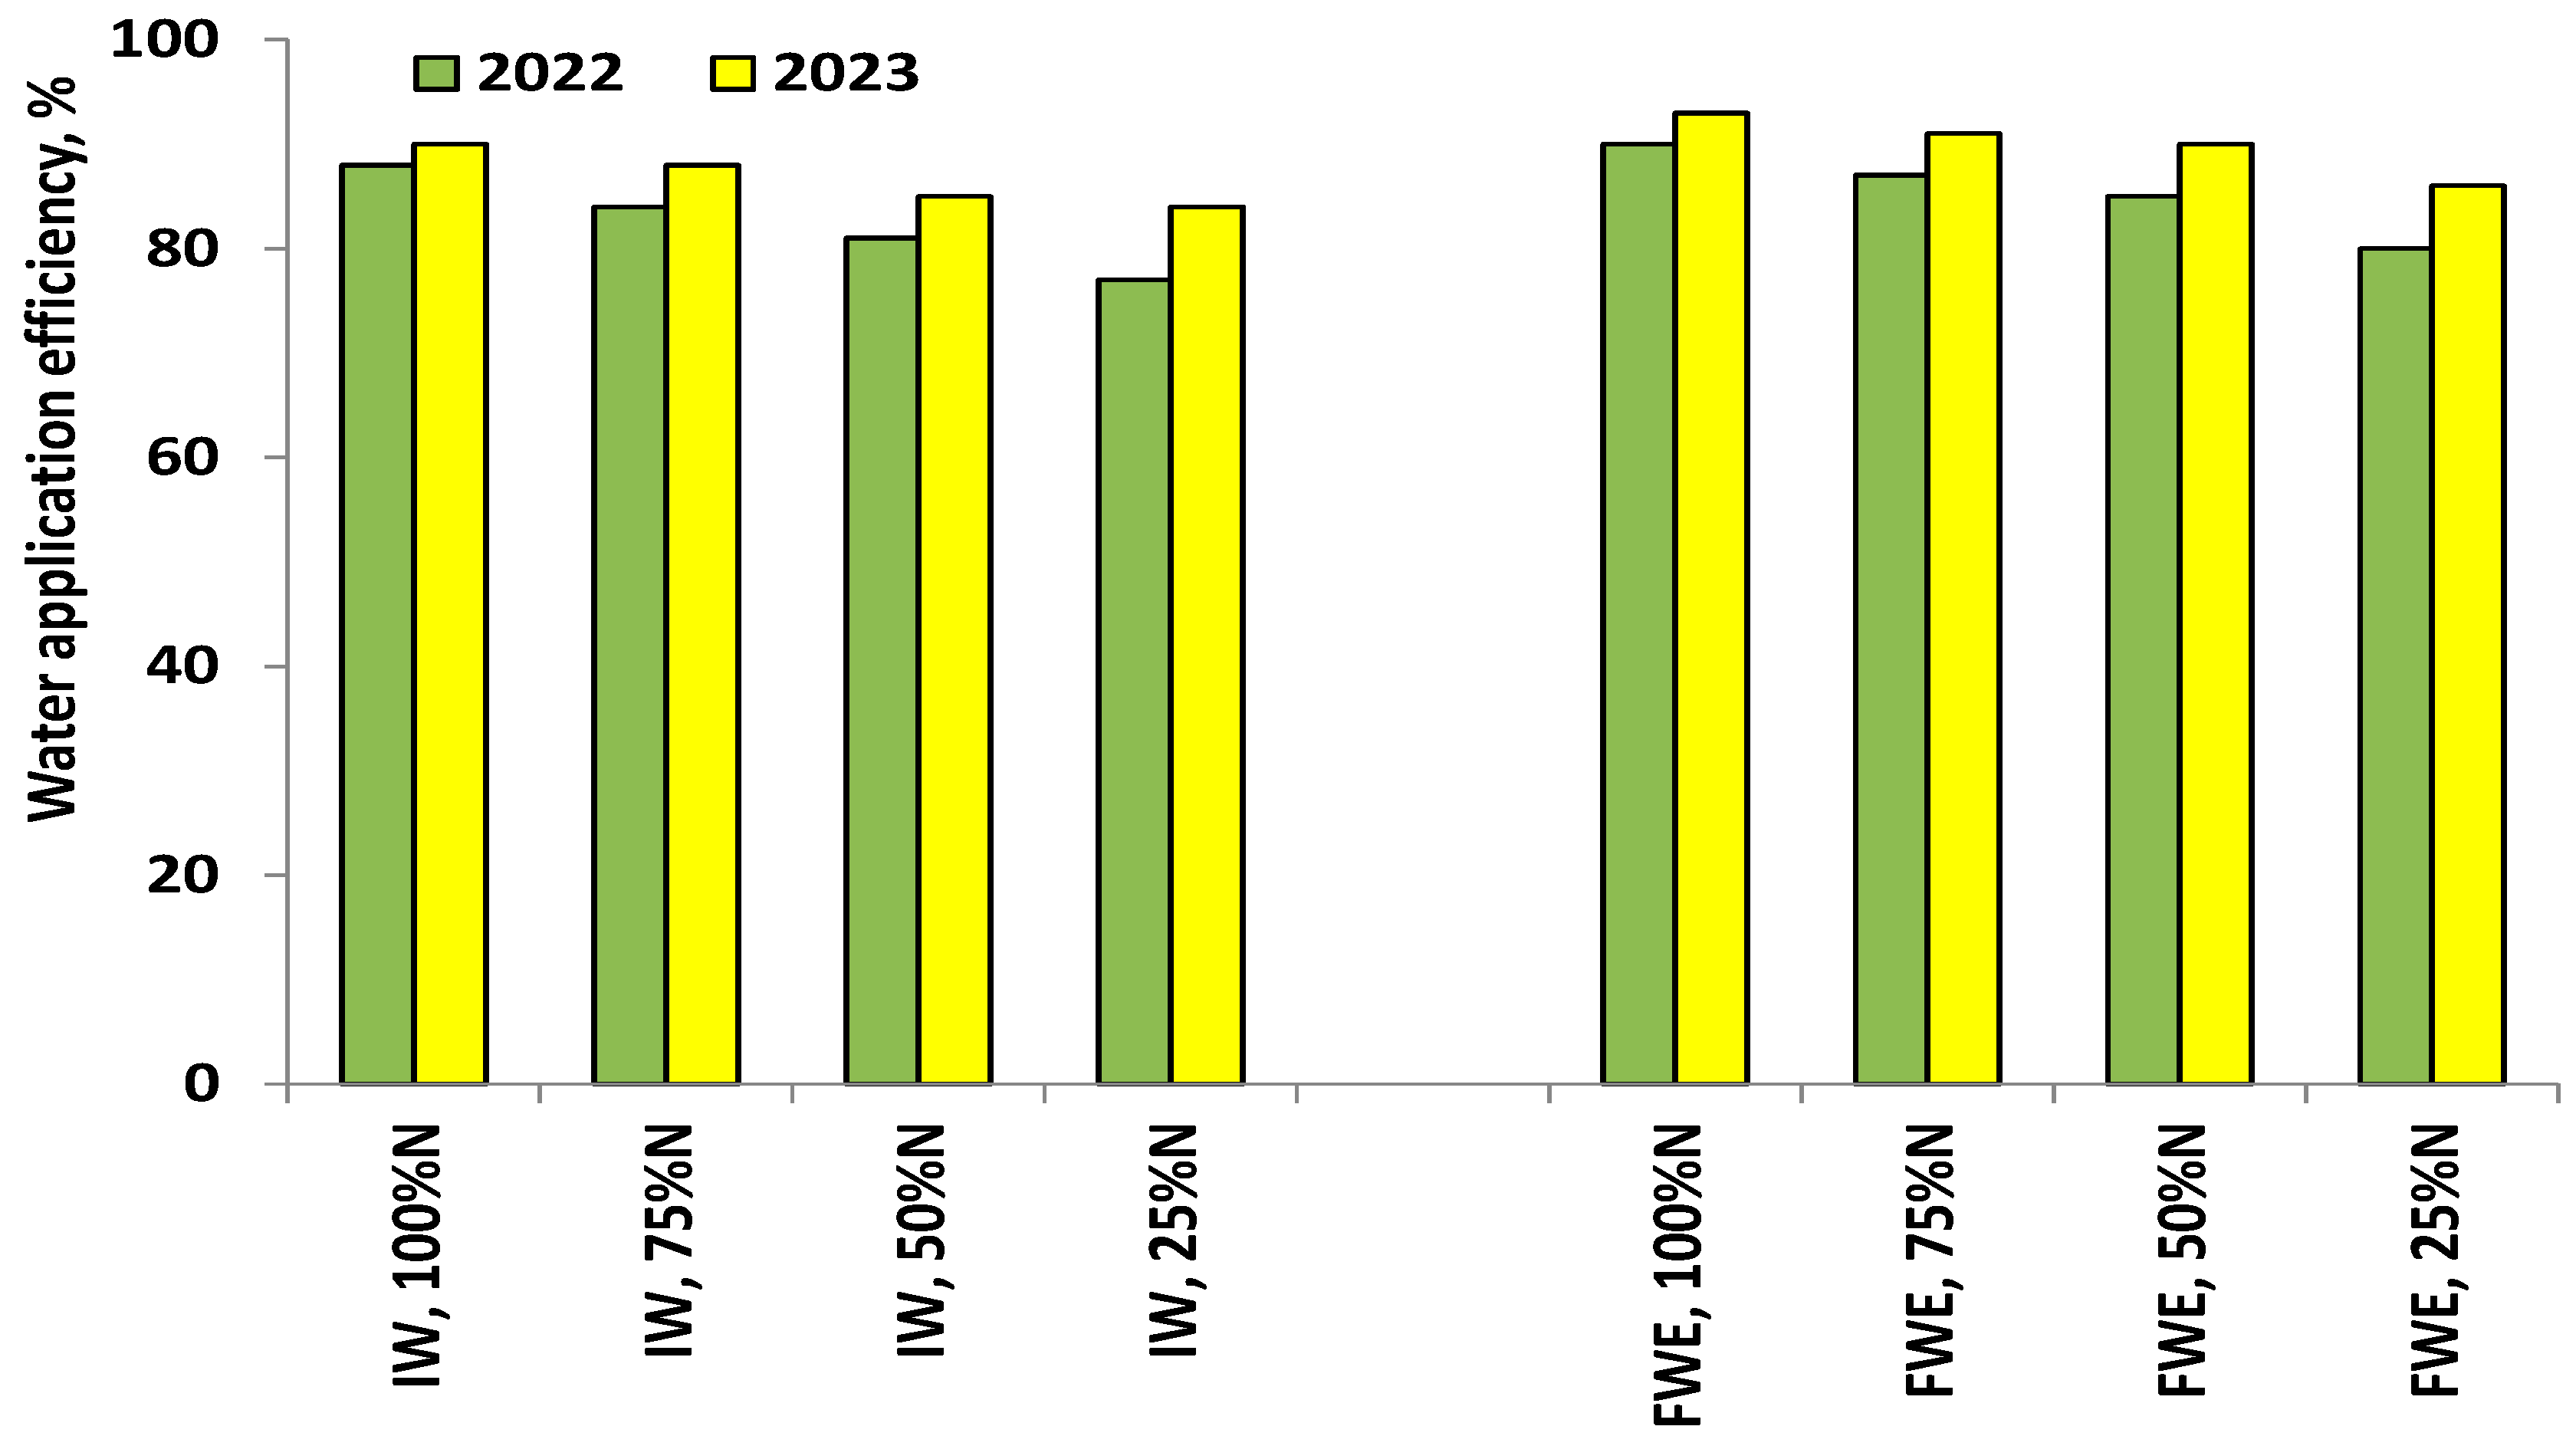
3.3. Water Application Efficiency
3.4. Crop Production
3.5. Water Productivity of Tomato
3.6. Reusing Fish Water Effluent as a Bio-Source for Fertilization and Reducing Groundwater Pollution
3.7. Improving the Microclimate of the Site after Implementing the Experimental Design
4. Conclusions
Author Contributions
Funding
Institutional Review Board Statement
Informed Consent Statement
Data Availability Statement
Acknowledgments
Conflicts of Interest
References
- Abdelraouf, R.E.; Okasha, E.M.; Tarabye, H.H.H. Modified Design for Drip Irrigation System to Improve the Productivity of Irrigation Water and Fertilizers Distribution. Int. J. ChemTech Res. 2016, 9, 40–52. [Google Scholar]
- Abdel-Shafy, H.; El-Saharty, A.; Regelsberger, M.; Platzer, C. Rainwater in Egypt: Quantity, distribution and harvesting. Mediterr. Mar. Sci. 2010, 11, 245–257. [Google Scholar] [CrossRef]
- Abdelraouf, R.E.; Abdou, S.M.M.; Mahmoud Abbas, M.M.; Hafez, M.M.; Popov, A.I.; Hamed, L.M.M. Influence of N-fertigation stress and agro- organic wastes (biochar) to improve yield and water productivity of sweet pepper under sandy soils conditions. Plant Arch. 2020, 20 (Suppl. S1), 3208–3217. [Google Scholar]
- Arafa, Y.; El-Gindy, A.G.M.; El-Shirbeny, M.; Bourouah, M.; Abd-ElGawad, A.M.; Rashad, Y.M.; Hafez, M.; Youssef, M.A. Improving the spatial deployment of the soil moisture sensors in smart irrigation systems using GIS. Cogent Food Agric. 2024, 10, 2361124. [Google Scholar] [CrossRef]
- Youssef, M.A.; Peters, R.T.; El-Shirbeny, M.; Abd-ElGawad, A.M.; Rashad, Y.M.; Hafez, M.; Arafa, Y. Enhancing irrigation water management based on ETo prediction using machine learning to mitigate climate change. Cogent Food Agric. 2024, 10, 2348697. [Google Scholar] [CrossRef]
- Alkhuzai, K.A.H. The Use of Organic Waste in Sustainable Water Management Under the Conditions of Dry Areas: Field and Modeling Study. Arab. J. Sci. Eng. 2022, 48, 5267–5287. [Google Scholar] [CrossRef]
- Abdou, M.A.; Alashram, M.G.; Hamza, A.E.; Rashad, Y.M.; Abd-ElGawad, A.M.; Bourouah, M.; Hafez, M.; Abdelraouf, R.E. Using deficit irrigation strategies and adding sugarcane waste biochar as a sustainable material to sandy soils for improving yield and water productivity of cucumber. Sustainability 2024, 16, 4856. [Google Scholar] [CrossRef]
- Abdelraouf, R.E.; Abou-Hussein, S.D.; Abd-Alla, A.M.; Abdallah, E.F. Effect of Short Irrigation Cycles on Soil Moisture Distribution in Root Zone, Fertilizers Use Efficiency and Productivity of Potato in New Reclaimed Lands. J. Appl. Sci. Res. 2012, 8, 3823–3833. [Google Scholar]
- Omeir, M.K.; Jafari, A.; Shirmardi, M.; Roosta, H. Effects of Irrigation with Fish Farm Effluent on Nutrient Content of Basil and Purslane. Proc. Natl. Acad. Sci. India Sect. B Biol. Sci. 2019, 90, 825–831. [Google Scholar] [CrossRef]
- Elnwishy, N.; Salh, M.; Zalat, S. Combating desertification through fish farming. The Future of Drylands. In Proceedings of the International Scientific Conference on Desertification and Drylands Research, Tunis, Tunisia, 19–21 June 2006. [Google Scholar]
- Hafez, M.; Popov, A.I.; Rashad, M. Enhancing calcareous and saline soils fertility by. increasing organic matter decomposition and enzyme activities: An incubation study. Commun. Soil Sci. Plant Anal. 2022, 53, 2447–2459. [Google Scholar] [CrossRef]
- Eid, A.R.; Negm, A. Improving Agricultural Crop Yield and Productivity of irrigation water via Sustainable and Engineering Techniques. In Conventional Water Resources and Agriculture in Egypt; The Handbook of Environmental Chemistry; Springer International Publishing AG: Cham, Switzerland, 2019; Volume 74, pp. 561–592. [Google Scholar] [CrossRef]
- Altieri, M.A. Linking Ecologists and Traditional Farmers in the Search for Sustainable Agriculture. Front. Ecol. Environ. 2004, 2, 35–42. [Google Scholar] [CrossRef]
- Xie, J.; Hu, L.; Tang, J.; Wu, X.; Li, N.; Yuan, Y.; Yang, H.; Zhang, J.; Luo, S.; Chen, X. Ecological mechanisms underlying the sustainability of the agricultural heritage rice–fish coculture system. Proc. Natl. Acad. Sci. USA 2011, 108, E1381–E1387. [Google Scholar] [CrossRef] [PubMed]
- Bostock, J.; McAndrew, B.; Richards, R.; Jauncey, K.; Telfer, T.; Lorenzen, K.; Little, D.; Ross, L.; Handisyde, N.; Gatward, I.; et al. Aquaculture: Global status and trends. Philos. Trans. R. Soc. B Biol. Sci. 2010, 365, 2897–2912. [Google Scholar] [CrossRef] [PubMed]
- Walia, S.; Kaur, N. Integrated Farming System—An Ecofriendly Approach for Sustainable Agricultural Environment—A Review. Greener J. Agron. For. Hortic. 2013, 1, 001–011. [Google Scholar] [CrossRef]
- Vander Heijden, P.; Nasr Alla, A.; Kenawy, D. Water Use at Integrated Aquaculture-Agriculture Farms: Experiences with Limited Water Resources in Egypt; Global Aquaculture Alliance: Lynnwood, WA, USA, 2012. [Google Scholar]
- Hafez, M.; Abdulla, A.A.; Abdulla, E.M.; Rashad, M. Influence of environmental-friendly bio-organic ameliorants on abiotic stress to sustainable agriculture in arid regions: A long term greenhouse study in northwestern Egypt. J. King Saud Univ. -Sci. 2022, 34, 102212. [Google Scholar] [CrossRef]
- Lee, C.; Schaaf, T. The future of drylands. In Proceedings of the International Scientific Conference on Desertification and Drylands Research, Tunis, Tunisia, 19–21 June 2006; Springer Science & Business Media: New York, NY, USA, 2008. [Google Scholar]
- Allen, R.G.; Pereira, L.S.; Raes, D.; Smith, M. Guidelines for computing crop water requirements. In Irrigation and Drainage Paper; John Wiley & Sons (Wiley): Hoboken, NJ, USA, 1998; Volume 56, 300p. [Google Scholar]
- James, L.G. Principles of Farm Irrigation System Design; John Willey & Sons, Inc.: Hoboken, NJ, USA; Washington State University: Washington, DC, USA, 1988; pp. 73, 152–153, 350–351. [Google Scholar]
- Atlas, R. Handbook Media for Environmental Microbiology; CRC Press, Taylor & Francis: Boca Raton, FL, USA, 2005. [Google Scholar]
- American Public Health Association. Standard Methods for the Examination of Water and Wastewater, 20th ed.; American Public Health Association: Washington, DC, USA, 1998. [Google Scholar]
- Snedecor, G.W.; Cochran, W.G. Statistical Methods, 7th ed.; Iowa State University Press: Ames, IA, USA, 1982; 511p. [Google Scholar]
- Abdelraouf, R.E.; Azab, A.; Tarabye, H.H.H.; Refaie, K.M. Effect of pulse drip irrigation and organic mulching by rice straw on yield, water productivity and quality of orange under sandy soils conditions. Plant Arch. 2019, 19, 2613–2621. [Google Scholar]
- Abdelraouf, R.E.; Abuarab, M.E. Effect of Irrigation Frequency under Hand Move Lateral and Solid Set Sprinkler Irrigation on Water Use Efficiency and Yield of Wheat. J. Appl. Sci. Res. 2012, 8, 5445–5458. [Google Scholar]
- Hafez, M.; Rashad, M.; Popov, A.I. The biological correction of agro-photosynthesis of soil plant productivity. J. Plant Nutr. 2020, 43, 2929–2980. [Google Scholar] [CrossRef]
- Giap, D.H.; Yi, Y.; Lin, C.K. Effects of different fertilization and feedingregimes on the production of integrated farming of rice and prawn Macrobrachium rosenbergii (De Man). Aquac. Res. 2005, 36, 292–299. [Google Scholar] [CrossRef]
- Kizilkaya, R. Nitrogen fixation capacity of Azotobacter spp. strains isolated from soils in different ecosystems and re-lationship between them and the microbiological properties of soils. J. Environ. Biol. 2009, 30, 73–82. [Google Scholar]
- Rashad, M.; Hafez, M.; Popov, A.I.; Gaber, H. Toward sustainable agriculture using extracts of natural materials for transferring organic wastes to environmental-friendly ameliorants in Egypt. Int. J. Environ. Sci. Technol. 2022, 20, 7417–7432. [Google Scholar] [CrossRef]
- Ramadan, A.; Ghanem, H.G.; Bukhari, N.A.; El-Zaidy, M. Field and Modeling Study on Manual and Automatic Irrigation Scheduling under Deficit Irrigation of Greenhouse Cucumber. Sustainability 2020, 12, 9819. [Google Scholar] [CrossRef]


| Items | Soil Depth, cm | ||
|---|---|---|---|
| 0–20 | 20–40 | 40–60 | |
| Textural class | Sandy | ||
| Coarse sand, % | 47.86 | 54.72 | 38.75 |
| Fine sand, % | 49.65 | 41.68 | 57.48 |
| Silt and clay, % | 2.49 | 3.60 | 3.85 |
| Bulk density, (BD), t m−3 | 1.67 | 1.68 | 1.69 |
| Electrical conductivity, (ECe), dS m−1 | 0.67 | 0.69 | 0.72 |
| pH, (1:2.5) | 8.5 | 8.8 | 8.3 |
| CaCO3, % | 7.3 | 4.69 | 4.62 |
| Organic matter, OM, % | 0.48 | 0.44 | 0.41 |
| Chemical Properties | Value | Bio-Component Characteristics | CFU, mL−1 |
|---|---|---|---|
| EC, dS m−1 | 0.61 | Total bacteria | 2460 |
| pH | 8.39 | Total fecal coliforms | 1980 |
| Calcium, Ca2+ mg L−1 | 1.06 | Total fungi | 97 |
| Potassium, K+ mg L−1 | 0.28 | Total free N2 fixers | 59 |
| Sodium, Na+ mg L−1 | 2.45 | Green algae | |
| Magnesium, Mg2+ mg L−1 | 0.56 | Chlorella sp. | 89 |
| Carbonate, CO32− mg L−1 | <0.02 | Pediastrum sp. | 18 |
| Bicarbonate, HCO3− mg L−1 | 0.12 | Scenedesmus sp. | 16 |
| Chloride, Cl− mg L−1 | 2.85 | Cyanobacteria | |
| Sulfate, SO42− mg L−1 | 1.36 | Nostoc sp. | <1 |
| Nitrogen, gN/m3 | <0.01 | Oscillatoria sp. | 15 |
| Phosphorus, P(PO43−) mg L−1 | 0.29 |
| Parameter | Fish Water Effluent (FEW) | Irrigation Water (IW) |
|---|---|---|
| Bio-Characteristics, CFU, mL−1 | ||
| Total no. of bacteria | 16,500 | 2300 |
| Total fecal coliforms | 3300 | 1900 |
| Total fungi | 520 | 90 |
| Treatments | Yield, t ha−1 | Water Productivity kg tomato m−3 Water | |||
|---|---|---|---|---|---|
| Water Quality | Nitrogen Mineral Fertilizer (NMF) | 2022 | 2023 | 2022 | 2023 |
| Impact of fish water effluent on the yield and water productively of tomato | |||||
| IW | 48.95 b | 54.22 b | 9.54 b | 10.63 b | |
| FEW | 56.20 a | 58.92 a | 10.95 a | 11.57 a | |
| LSD at α 0.05 | 0.434 | 1.490 | 0.096 | 0.314 | |
| Impact of nitrogen mineral fertilizer dosage on the yield and water productivity of tomato | |||||
| NMF1 (100%N) | 58.15 a | 63.25 a | 11.33 a | 12.42 a | |
| NMF2 (75%N) | 56.75 b | 59.80 b | 11.05 b | 11.73 b | |
| NMF3 (50%N) | 49.10 c | 52.50 c | 9.58 c | 10.30 c | |
| NMF4 (25%N) | 46.30 d | 50.75 d | 9.02 d | 9.95 d | |
| LSD at α 0.05 | 0.750 | 0.551 | 0.154 | 0.119 | |
| IW | NMF1 (100%N) | 54.5 b | 62.4 b | 10.63 b | 12.23 b |
| NMF2 (75%N) | 51.9 c | 55.9 c | 10.10 c | 10.97 c | |
| NMF3 (50%N) | 46.8 e | 50.5 f | 9.13 e | 9.90 f | |
| NMF4 (25%N) | 42.6 f | 48.1 g | 8.30 f | 9.43 g | |
| FEW | NMF1 (100%N) | 61.8 a | 64.1 a | 12.03 a | 12.60 a |
| NMF2 (75%N) | 61.6 a | 63.7 a | 12.00 a | 12.50 a | |
| NMF3 (50%N) | 51.4 c | 54.5 d | 10.03 c | 10.70 d | |
| NMF4 (25%N) | 50.0 d | 53.4 e | 9.73 d | 10.47 e | |
| LSD at α 0.05 | 1.060 | 0.780 | 0.218 | 0.169 | |
| Irrigation Treatment | Water Received by the Crop, m3 ha−1 | Nitrogen Received by the Crop, kg N ha−1 | Yield, t ha−1 | ||
|---|---|---|---|---|---|
| Biological | Chemical | Total | |||
| 2022 | |||||
| IW, 100%N | 5130 | 0 | 320 | 320 | 54.5 |
| IW, 75%N | 5130 | 0 | 240 | 240 | 51.9 |
| IW, 50%N | 5130 | 0 | 160 | 160 | 46.8 |
| IW, 25%N | 5130 | 0 | 80 | 80 | 42.6 |
| FWE 100%N | 5130 | 21.9 | 320 | 341.9 | 61.8 |
| FWE, 75%N | 5130 | 21.9 | 240 | 261.9 | 61.6 |
| FWE, 50%N | 5130 | 21.9 | 160 | 181.9 | 51.4 |
| FWE, 25%N | 5130 | 21.9 | 80 | 101.9 | 50.0 |
| 2023 | |||||
| IW, 100%N | 5100 | 0 | 320 | 320 | 62.4 |
| IW, 75%N | 5100 | 0 | 240 | 240 | 55.9 |
| IW, 50%N | 5100 | 0 | 160 | 160 | 50.5 |
| IW, 25%N | 5100 | 0 | 80 | 80 | 48.1 |
| FWE 100%N | 5100 | 21.8 | 320 | 341.8 | 64.1 |
| FWE, 75%N | 5100 | 21.8 | 240 | 261.8 | 63.7 |
| FWE, 50%N | 5100 | 21.8 | 160 | 181.8 | 54.5 |
| FWE, 25%N | 5100 | 21.8 | 80 | 101.8 | 53.4 |
Disclaimer/Publisher’s Note: The statements, opinions and data contained in all publications are solely those of the individual author(s) and contributor(s) and not of MDPI and/or the editor(s). MDPI and/or the editor(s) disclaim responsibility for any injury to people or property resulting from any ideas, methods, instructions or products referred to in the content. |
© 2024 by the authors. Licensee MDPI, Basel, Switzerland. This article is an open access article distributed under the terms and conditions of the Creative Commons Attribution (CC BY) license (https://creativecommons.org/licenses/by/4.0/).
Share and Cite
Abdelraouf, R.E.; Abdou, M.A.A.; Bakr, A.; Hamza, A.E.; Rashad, Y.M.; Abd-ElGawad, A.M.; Hafez, M.; Ragab, R. Enhancing Tomato Production by Using Non-Conventional Water Resources within Integrated Sprinkler Irrigation Systems in Arid Regions. Atmosphere 2024, 15, 722. https://doi.org/10.3390/atmos15060722
Abdelraouf RE, Abdou MAA, Bakr A, Hamza AE, Rashad YM, Abd-ElGawad AM, Hafez M, Ragab R. Enhancing Tomato Production by Using Non-Conventional Water Resources within Integrated Sprinkler Irrigation Systems in Arid Regions. Atmosphere. 2024; 15(6):722. https://doi.org/10.3390/atmos15060722
Chicago/Turabian StyleAbdelraouf, Ramadan Eid, Mamdouh A. A. Abdou, Ahmed Bakr, Ahmed E. Hamza, Younes M. Rashad, Ahmed M. Abd-ElGawad, Mohamed Hafez, and R. Ragab. 2024. "Enhancing Tomato Production by Using Non-Conventional Water Resources within Integrated Sprinkler Irrigation Systems in Arid Regions" Atmosphere 15, no. 6: 722. https://doi.org/10.3390/atmos15060722
APA StyleAbdelraouf, R. E., Abdou, M. A. A., Bakr, A., Hamza, A. E., Rashad, Y. M., Abd-ElGawad, A. M., Hafez, M., & Ragab, R. (2024). Enhancing Tomato Production by Using Non-Conventional Water Resources within Integrated Sprinkler Irrigation Systems in Arid Regions. Atmosphere, 15(6), 722. https://doi.org/10.3390/atmos15060722