Article

An Innovative Dynamic Model for Predicting Typhoon Track Deflections over Complex Terrain

by
Hung-Cheng Chen
School of Education, Huanggang Normal University, Huanggang 438000, China
Atmosphere 2024, 15(11), 1372; https://doi.org/10.3390/atmos15111372
Submission received: 9 October 2024 / Revised: 10 November 2024 / Accepted: 12 November 2024 / Published: 14 November 2024
(This article belongs to the Special Issue Typhoon/Hurricane Dynamics and Prediction (2nd Edition))

Abstract

:
This study presents an innovative, dynamic model for predicting typhoon track deflections over complex terrain. Based on potential vorticity conservation, the model incorporates a topographic adjusting parameter (α) and a meridional adjusting velocity (MAV) to capture the vortex’s response to terrain variations. Simulations using an idealized bell-shaped mountain and Taiwan’s realistic topography reveal that steeper terrain gradients consistently deflect typhoon tracks southward. This steering effect intensifies with increasing vortex strength due to a larger α, leading to enhanced MAV. Shallower approach angles also amplify deflections due to prolonged terrain interaction. Results highlight the significant role of Taiwan’s Central Mountain Range in shaping typhoon trajectories. This model offers a refined approach for predicting typhoon behavior near complex terrain, advancing forecasting capabilities, and enhancing disaster preparedness strategies.

1. Introduction

1.1. Research Background

Accurate tropical cyclone (TC) path prediction is crucial for disaster preparedness and mitigation [1,2,3]. However, complex terrain, such as that found on Taiwan Island, poses a significant challenge in forecasting, as it can lead to dramatic changes in the intensity, speed, and direction of a TC [4,5,6,7,8]. These changes introduce considerable uncertainty in forecasts and can have dire consequences, including delayed or misdirected warnings, inadequate preparation, and increased vulnerability to hazards such as heavy rain, strong winds, and flooding.
Taiwan Island, located in the Western North Pacific, is particularly vulnerable to the impacts of TC tracks due to its complex terrain dominated by the Central Mountain Range (CMR). Researchers have classified these tracks, including ‘continuous’ and ‘discontinuous,’ to understand better and predict typhoon behavior near the island [5,6,8,9,10]. Continuous tracks maintain their primary low-pressure center and cyclonic circulation as they cross the island, often exhibiting a cyclonically curved path around the CMR. In contrast, discontinuous tracks are characterized by the formation of secondary low-pressure centers on the lee side of the CMR, which can replace the original typhoon center and cause an abrupt shift in the track.
Further classifications have been proposed to categorize the direction of track deflection, distinguishing between northward and southward deflections. These deflections are influenced by factors like the typhoon’s intensity, size, and strength of the steering flow, highlighting the complex interplay between the vortex’s intrinsic characteristics and the environmental conditions [11,12,13,14,15,16,17,18,19,20,21,22]. In addition to these broad classifications, specific cases of looping tracks, where the typhoon executes a cyclonic loop before landfall, have also been documented [23].

1.2. Mechanisms Influencing Typhoon Track over Complex Terrain

Predicting typhoon tracks over complex terrain is challenging due to the complex interplay of various mechanisms and variables [4,12,22,24]. Many factors, such as terrain-induced asymmetric flow, diabatic heating, and the interaction of the typhoon’s circulation with the larger-scale environmental flow, contribute to the complexity of the deflections of the typhoon track over complicated topographic features, such as Taiwan [4,22]. Understanding how these mechanisms individually and collectively influence typhoon tracks remains an active area of research [12,19,22,25,26].
The intensity of the vortex, characterized by its maximum wind speed and size, is crucial in modulating susceptibility to topographic steering [19,26,27]. Stronger vortices, with more significant Froude numbers, are typically less affected by terrain [19,27], while weaker storms can experience more substantial deflections and more complex track variations [12,25]. The impinging angle between the vortex’s initial movement direction and the terrain’s orientation also significantly influences track deflection. Shallower angles, which lead to a longer interaction with the terrain, tend to produce more significant track deflections [14,24,27,28].
Finally, the characteristics of the terrain, such as mountain height, steepness, and shape, all contribute to the complexity of topographic steering. Higher mountains, steeper slopes, and more complex terrain features amplify topographic forcing, leading to more unpredictable vortex pathways [12,14,19,25,28,29].

1.3. Research Methods in Typhoon Track Studies over Topography

Researchers have employed various methods, including theoretical analysis, numerical modeling, and observational data analysis, to investigate typhoon tracks over terrain and unravel the complex interplay between vortex dynamics and topographic forcing [14,30,31,32,33]. While these studies have advanced our understanding of typhoon–terrain interactions, limitations remain. For instance, theoretical studies often rely on simplified assumptions, and observational data, particularly over mountainous regions, can be sparse, hindering a complete understanding of typhoon behavior near topography [14,25,28].
Numerical modeling has emerged as a powerful tool for simulating typhoon tracks, allowing researchers to explore various scenarios and sensitivities. Studies have utilized various models, including primitive equation models, shallow-water models, and mesoscale models, each with strengths and limitations [2,11,12,14,19,22,24,25,27,29]. Idealized simulations, often employing simplified topographic representations, have provided valuable insight into the fundamental dynamics of vortex–terrain interaction [12,14,24,27,28]. In contrast, real-case simulations, using actual typhoon data and realistic topography, have aimed to improve forecast accuracy and capture the nuances of individual events [2,12,25,27]. Observational data, mainly from surface weather stations, radar networks, and satellite imagery, are crucial to validate the model’s results and understand the observed behavior of typhoons near islands [2,12,19,26,30,34,35,36].
Table 1 summarizes the primary mechanisms influencing typhoon track deflections when interacting with complex terrain, with a particular focus on Taiwan’s CMR. These mechanisms, such as orographic blocking, channeling effects, topographic beta drift, and cyclonic looping, play critical roles in steering typhoons as they approach and traverse mountainous regions. Studies investigating these interactions have employed a range of methods, including observational analysis, numerical simulations, idealized modeling, and laboratory experiments, each contributing unique insights into the complex dynamics of typhoon–topography interactions. Table 1 provides a comprehensive overview of these mechanisms and methodologies, along with references supporting the findings.

1.4. Objectives of the Study

This study aims to improve the prediction of typhoon track deflections near complex terrain by developing and applying an innovative, dynamic model. This model, based on the conservation of potential vorticity (PV), incorporates a novel approach using the topographic adjusting parameter (α) and the meridional adjusting velocity (MAV) to capture the vortex’s response to terrain variations. Specifically, this study aims to (1) elucidate the fundamental mechanisms governing typhoon track deflections near topography, focusing on the role of α and MAV, (2) quantify the sensitivity of typhoon tracks to variations in vortex intensity, impinging angle, and terrain characteristics, particularly steepness, (3) evaluate the model’s performance in predicting typhoon-like vortex tracks over realistic, complex terrain, specifically Taiwan Island and its Central Mountain Range (CMR), and (4) demonstrate the model’s potential for improving typhoon track forecasting and enhancing disaster preparedness strategies in regions with complex terrain.
The paper is structured as follows. Section 2 details the theoretical framework of the dynamic model, focusing on the governing equations, approximations, and the derivation of the α and MAV. Section 3 explores the application of the model to an idealized bell-shaped mountain, analyzing the sensitivity of vortex tracks to variations in vortex-impinging angle and landing position. Section 4 investigates the model’s performance with Taiwan’s realistic topography, highlighting the dominant role of the CMR in shaping typhoon-like vortex paths and comparing these results with those obtained from idealized simulations. Finally, Section 5 summarizes the key findings, emphasizing the contributions of this study to our understanding of vortex–topography interaction, particularly in the context of Taiwan, and identifies areas for future research.

2. A Dynamic Model for Strong Cyclonic Vortex Motion over Topography

2.1. Governing Equations and Approximations

To predict the trajectory of a strong cyclonic vortex as it moves over variable bottom topography, we develop a dynamic model based on the conservation of potential vorticity (PV) on a beta-plane [38,39].
Figure 1 illustrates the schematic of the physical problem addressed in this study. Under the beta-plane approximation, where the Coriolis parameter varies linearly with latitude, the flow is governed by the conservation of potential vorticity [44]:
D Π D t = 0 ,
where Π = ( f 0 + β 0 y + ζ ) / H represents the PV. Here, f 0 is the Coriolis parameter, β 0 is the beta parameter, ζ is the relative vorticity, H is the total fluid depth H = D + η h B , D is the unperturbed depth, η is the free surface depression induced by the vortex, and h B is the bottom topography.
We assume the vortex is strong ( R o v ~ O 1 10 ) and can be approximated as a point vortex with mean core vorticity ζ c . Additionally, we assume the free surface depression and topographic variations are small compared to the unperturbed depth ( η / D 1 ,   h B / D 1 ). These assumptions allow us to simplify Equation (1) to:
D D t f 0 + β 0 y + ζ 1 η / D + h B / D D = 0 .
We introduce the following non-dimensional variables:
y * = y / R m ,   t * = t / τ ,   ζ * = ζ / τ 1 ,   η * = η / η v ,   h B * = h B / h M ,
where τ = R m / V m is a reference time, R m is the vortex radius, V m is the maximum azimuthal velocity, η v is the maximum free surface depression, and h M is the maximum topographic height.
Substituting these variables into Equation (2) and neglecting higher-order terms yields the non-dimensional PV conservation equation:
D Π * D t * = 0 ,
where the non-dimensional potential vorticity Π * is given by Equation (5):
Π * = β 0 * y * + β B * h B * β v * η * + ζ * 1 + R o v β B * h B * β v * η * c o n s t .
This equation includes four non-dimensional parameters: (i) the vortex Rossby number R o v = V m / f 0 R m , (ii) the planetary Beta number β 0 * = β 0 R m 2 / V m , (iii) the topographic Beta number β B * = f 0 R m h M / V m D , and (iv) the vortex Beta number β v * = f 0 R m η v / V m D . Note that these non-dimensional parameters are essential for deriving the similarity laws for laboratory experiments [32,37,41,42,43].

2.2. Point Vortex Model and Meridional Adjusting Velocity (MAV)

We begin with a simplified point vortex model to derive the vortex trajectory. This model predicts the vortex’s non-dimensional velocity at the next time step, V t + 1 * , which consists of two components: (1) the vortex velocity at the current time step ( V t * ) and (2) the MAV induced by the interaction between the vortex and topography ( V y , t * ). This relationship is expressed as [38,39]:
V t + 1 * = V t * + V y , t *
The derivation of V y , t * follows below.
As the strong cyclonic vortex approaches the topography, we assume that, over a short time interval, both the maximum surface depression η v and the mean relative vorticity ζ c within the vortex radius remain unchanged, as indicated in Equation (7):
δ η * 0   and   δ ζ * 0 .
Using Equations (5) and (7), the small variation in non-dimensional potential vorticity δ Π p * over a short time interval δ t * is approximately zero, and it can be expanded as
δ Π p * β 0 * δ y p * + 1 + R o v ζ c * β B * δ h B * = 0 ,
where the subscript p refers to the point vortex model.
From Equation (8), the meridional displacement of the point vortex in non-dimensional form, δ y p * , is expressed in Equation (9):
δ y p , t * = α δ h B *   along   the   direction   of   V t * ,
where the topographic adjustment parameter α is defined in Equation (10) [38,39]:
α = 1 + R o v ζ c * β B * β 0 * .
From Equations (9) and (10), the MAV for the point-vortex model is derived as shown in Equation (11):
V y p , t * = lim δ t * 0 δ y p * δ t * e y = α d h B * d t * e y .
The instantaneous variation of topographic height along the direction of the vortex velocity, d h B * / d t * , can be expressed as:
d h B * d t * = lim δ t * 0 h B * x t * + V t * δ t * h B * x t * δ t * V t * · h B * .

2.3. Finite Vortex Correction and Final Model

We introduce a correction factor to extend the point-vortex model to a more realistic scenario of a vortex with finite size. This factor accounts for the fact that a finite vortex, unlike a point vortex, has a spatial extent and its interaction with topography occurs over a finite area.
We relate the meridional displacement of the point vortex ( δ y p * ) to the displacement of the finite vortex ( δ y t * ) over a given time interval. Assuming the point vortex displacement occurs over a time A and the finite vortex displacement occurs over n times its rotational period (τ), we can establish the following relationship:
δ y p , t * = V y p , t * A = δ y t * = V y , t * n τ .
For simplicity, let A = 1   and   n = 1 . Substituting into Equation (13) yields the real non-dimensional meridional adjustment velocity, V y , t * , as shown in Equation (14):
V y , t * = V y p , t * τ e y = α τ V t * · h B * e y .
Equations (6) and (14) constitute the comprehensive dynamic model for the interaction of strong cyclonic vortices with topography in this study. The model incorporates the influence of the vortex’s inherent motion and the steering effects of the topography.

2.4. Physical Interpretation of the Dynamic Model

The dynamic model provides a framework for understanding how a strong cyclonic vortex interacts with underlying topography, ultimately explaining how terrain features can influence the vortex’s track. The model achieves this by incorporating two key components: the topographic adjusting parameter (α) and the meridional adjusting velocity (MAV), as expressed in Equations (10) and (14), respectively.
The topographic adjusting parameter (α) quantifies how sensitive a vortex’s trajectory is to changes in the underlying topography. A larger α value implies a more substantial topographic steering effect, meaning that changes in bathymetry or topography will more readily alter the vortex path. In contrast, a smaller α suggests a weaker topographic influence, allowing the vortex to maintain a more consistent trajectory over varying terrain.
As shown in Equation (14), the MAV is directly proportional to both the topographic adjusting parameter (α) and the rate of change of the dimensionless topographic height ( d h B * / d t * ). This means that when a vortex encounters a region of steep terrain, such as when approaching the CMR of Taiwan, the MAV will be amplified due to the greater rate of change of topographic height. This leads to more pronounced northward or southward deflections in the vortex’s path.
In essence, the dynamic model uses α to quantify a vortex’s susceptibility to topographic steering and then employs the MAV to adjust the vortex’s trajectory dynamically, based on the underlying topography. This interaction between α and MAV provides a powerful framework for understanding the complex interplay between vortex motion and bathymetry or topography in geophysical flows.

3. Analysis of a Typhoon-like Vortex Path over Isolated Topography

To investigate how isolated topography influences the path of a typhoon-like vortex, we applied our dynamic model to a simplified scenario. This involves simulating the trajectory of a vortex over an idealized three-dimensional mountain. This approach, commonly employed in numerical modeling studies, allows for a focused analysis of topography-induced deflections while minimizing the complexities of real-world terrain [3,21,45]. The insights gained from this idealized scenario provide a valuable foundation for understanding the model’s capabilities and limitations before applying it to more realistic settings.

3.1. Experiment Setup

3.1.1. Idealized Topography Settings

The idealized topography used in this study is a bell-shaped mountain, characterized by its symmetrical shape and gradually increasing elevation toward the center. This shape represents a simplified, representative topographic feature that a typhoon-like vortex might encounter. The specific parameters of this mountain, including its height, base radius, and orientation angle, are chosen to roughly mimic the CMR of Taiwan. This dominant topographic feature is known to significantly influence typhoon tracks.
An ideal three-dimensional bell-shaped mountain is selected to represent the isolated topography, as depicted in Figure 1. The terrain height h B is defined by the following equation
h B = h M 1 + x x a a h 2 + y y a b h 2 n ,
where h M is the maximum mountain height, x a and y a are the coordinates of the mountain center, a h and b h are the half-widths of the mountain in the x and y directions, respectively, and n is the shape parameter of the terrain.
Based on the terrain parameters from [21], with slight adjustments to better simulate Taiwan’s topography, we set the mountain center at x a = 121 °   E and y a = 23.5 °   N . The half-widths a h = 40   k m and b h = 120   k m are in the x-direction and y-direction, with the shape parameter n = 2 and a maximum mountain height h M = 3   k m .
Furthermore, the orientation angle θ of the long axis of the mountains is set to 15° to align with the northeast–southwest orientation of the Taiwan’s CMR. These parameters create a realistic representation of Taiwan’s topography, enabling the examination of how a typhoon-like vortex interacts with such terrain.
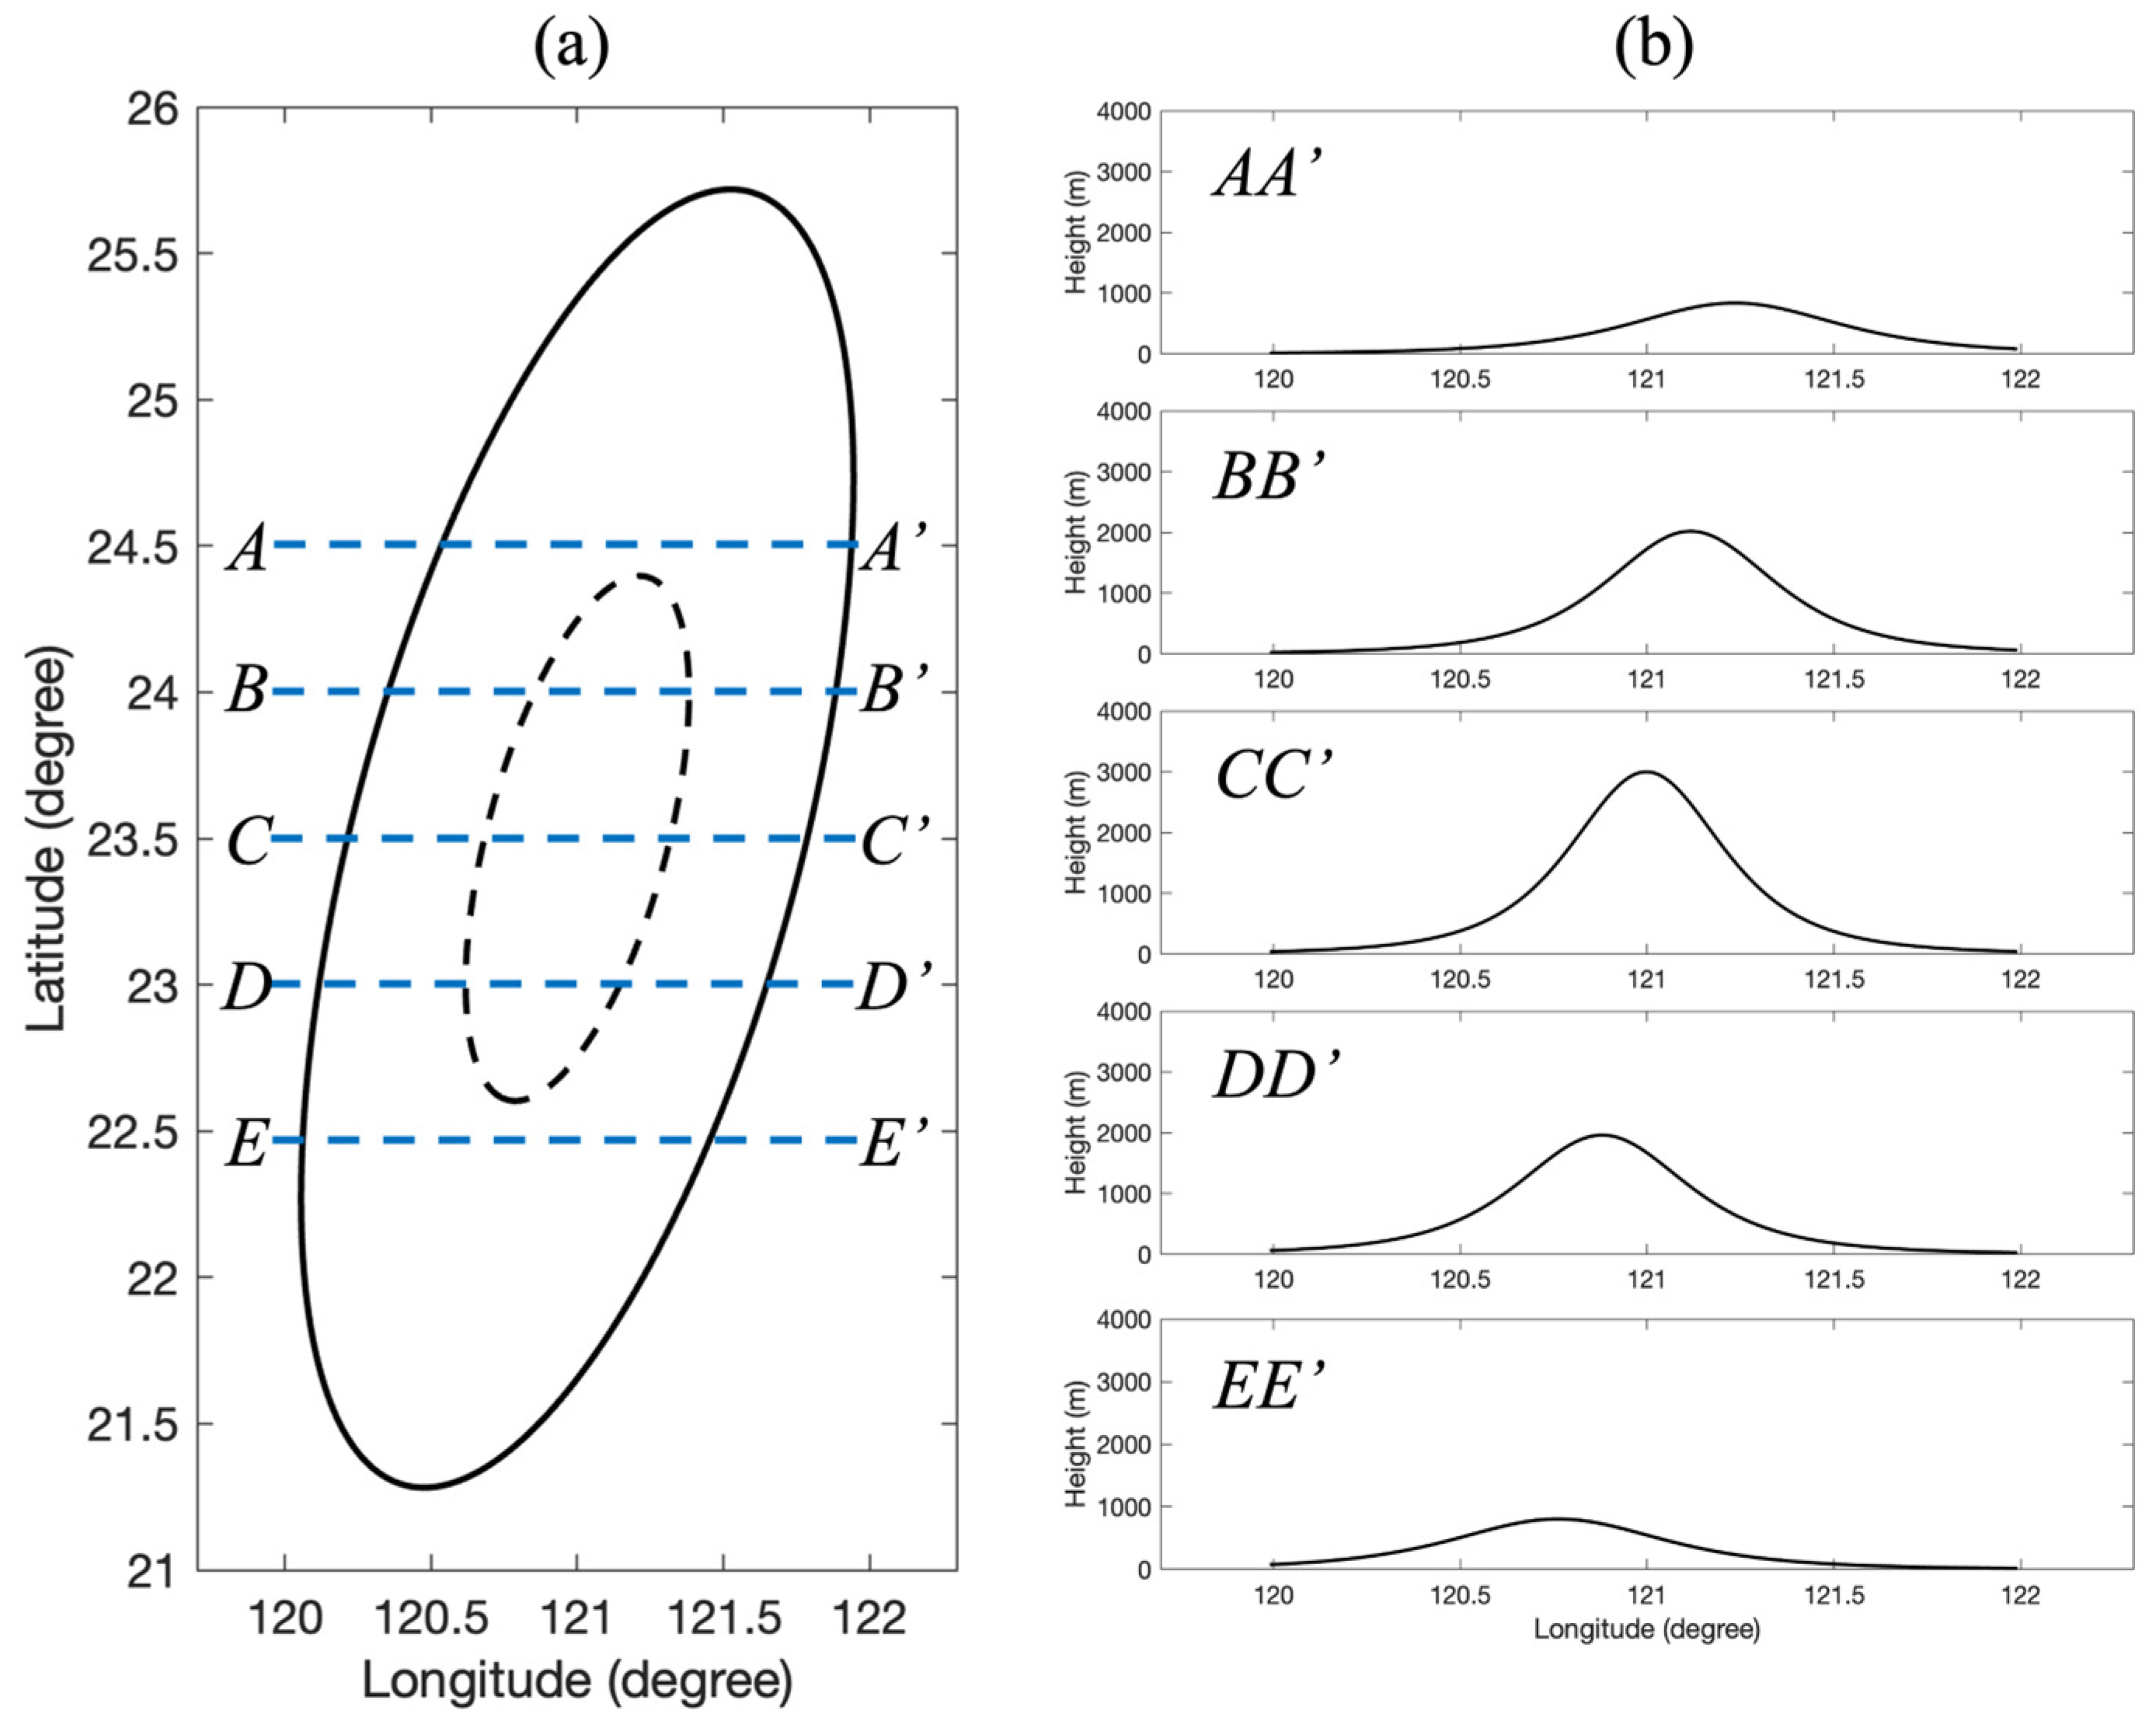
Figure 2a presents the topographic contours of the three-dimensional bell-shaped mountain. The solid black lines represent the 100-m elevation contours, while the dashed black lines indicate the 1000-m contours. This visualization highlights the mountain’s symmetrical shape and the gradual increase in elevation toward the center. Figure 2b shows the terrain cross-sections along the latitudinal direction at 24.5 ° , 24 ° , 23 ° and 22.5 °   N from north to south. These profiles illustrate the variation in elevation across different latitudes, providing insights into how the vortex could experience changes in topographic influence as it moves.

3.1.2. Typhoon-like Vortex Initialization

We initialize the typhoon-like vortex (vortex M) with parameters that approximate a moderate typhoon commonly observed in the Western North Pacific [32]. Observational data guide the choice of these parameters and aims to create a realistic representation of a typhoon-like vortex for our simulations.
Firstly, the relative vorticity ( ζ c ) at the vortex center is set to 4 × 10 4   s 1 , a value within the range commonly observed in typical Western North Pacific typhoons, ensuring the vortex strength accurately reflects real-world systems. Secondly, the maximum wind speed ( V m ) is set to 30 m/s, aligning with the wind speeds characteristic of moderate typhoons. Thirdly, the radius of maximum wind ( R m ) is specified as 150 km, consistent with the typical size of mature tropical cyclones in the region [35]. Fourthly, the unperturbed depth ( D ) is set to 10 km, representing the approximate depth of the troposphere where the primary circulation of a typhoon occurs. Lastly, the initial movement speed of the vortex ( V 0 ) is set to 6 m/s, matching the average translation speed of typhoons in this region [46].
The dynamic model employs a time step of 150 s to ensure numerical stability and temporal resolution. The terrain gradient is calculated on a grid with a spatial resolution of 250 m, capturing the fine-scale variations in topography that influence the vortex’s path.

3.1.3. Definition of Impinging Angle and Track Deflection

We define two key parameters to quantify the vortex–topography interaction: impinging angle ( γ ) and track deflection ( δ ). These parameters allow for a standardized comparison of how the terrain affects the vortex’s trajectory under different approach conditions.
The impinging angle ( γ ) is defined as the angle between the initial movement direction of the vortex and the normal to the central axis of the terrain, as shown in Figure 1a. This angle determines the degree to which the vortex encounters the terrain directly, varying from a head-on approach ( γ ~ 180 ° ) to a more oblique interaction ( 90 ° γ 180 ° ). Track deflection ( δ ), on the other hand, is defined as the meridional (north–south) deviation of the vortex’s trajectory from its expected path in the absence of topographic influence, occurring after the vortex interacts with the terrain. This parameter quantifies the topographic steering effect, directly measuring how much the terrain influences the vortex’s path [7].

3.2. Track Analysis of Vortex M with Varying Impinging Angles and Landing Positions

To understand how different angles of approach and landing positions affect the vortex trajectory, we perform simulations with varying impinging angles (γ) and initial vortex locations. These simulations aim to explore a range of possible interactions between the vortex and the idealized topography, providing insight into the sensitivity of track deflection to these factors.

3.2.1. Visualization of Vortex Tracks and Deflections

Figure 3 presents the simulated tracks of vortex M for a range of impinging angles and landing positions. Each panel in Figure 3 corresponds to a specific impinging angle (195°, 170°, 145°, and 120°), and within each panel, multiple tracks represent different initial landing positions of the vortex relative to the idealized mountain. Each scenario’s corresponding track deflections ( δ ) are also depicted, providing a quantitative measure of how much the topography alters the vortex’s path. The detailed calculation conditions are listed in Table 2.

3.2.2. Impact of Landing Position on Track Deflection

The simulations reveal a distinct relationship between the landing position of the vortex relative to the idealized mountain and the resulting track deflection (δ). This relationship can be explained by examining the rate of change of the dimensionless topographic height ( d h B * / d t * ), a key factor influencing the MAV and, consequently, the vortex’s path.
Vortices making central landfall (Cases ‘2’, ‘5’, ‘8’, and ‘11’) consistently exhibit larger track deflections, particularly when approaching the central region of the idealized mountain. The vortex paths display pronounced S-shaped curves in these cases, with significant southward and subsequent northward deviations. This behavior is attributed to the steeper terrain gradients in the central region, which cause more rapid changes in ( d h B * / d t * ). The intensified MAV in these scenarios leads to greater deflection as the vortex traverses the windward and leeward slopes. For example, case ‘11’, which makes landfall closest to the mountain peak, shows a significant track deflection of approximately 278 km, highlighting the strong influence of steep terrain gradients on vortex trajectory.
In contrast, vortices making northern and southern landfall (Cases ‘1’, ‘3’, ‘4’, ‘6’, ‘7’, ‘9’, ‘10’, and ‘12’) encounter relatively flat and gentle terrain, resulting in smaller track deflections. This is evident in cases ‘1’, ‘4’, ‘7’, and ‘10’ (northern landfall), as well as in cases ‘3’, ‘6’, ‘9’, and ‘12’ (southern landfall), where the vortex tracks remain predominantly westward with minimal meridional deviation. The gentler terrain gradients in these regions lead to smaller changes in ( d h B * / d t * ), thereby reducing the MAV influence and producing a more direct path.
As the vortex traverses the terrain, d h B * / d t * represents the rate at which the vortex experiences changes in elevation along its path. When the vortex moves over the windward side of the terrain, d h B * / d t * is positive, signifying an upward slope. Conversely, on the leeward side, where the terrain slopes downward, d h B * / d t * becomes negative. According to Equation (11), a positive d h B * / d t * corresponds to a negative MAV, leading to southward deflection, while a negative d h B * / d t * results in a positive MAV, driving a northward deflection.
The study’s focus on the rate of change of topographic height, aligning with previous findings [19,25,27,28,29,30], emphasizes the importance of accurately capturing the terrain’s gradient in modulating track deflection. This sensitivity analysis, employing an idealized bell-shaped mountain, provides a valuable baseline to understand the dynamic response of vortices to topographic variations.

3.2.3. Impact of Impinging Angle on Track Curvature

The simulation results show that as the impinging angle decreases (approaching a more oblique interaction with the terrain), the curvature of the S-shaped path generally increases. This effect is particularly evident for vortices passing through the central region of the idealized mountain (e.g., tracks ‘2’, ‘5’, ‘8’, and ‘11’).
This relationship between impinging angle and path curvature can be understood by considering the time the vortex interacts with the steepest terrain gradients. A lower impinging angle implies a more oblique approach, which causes the vortex to interact with the steep central slopes of the idealized mountain for a longer period.
As the vortex traverses this steep region at a shallower angle, it experiences more rapid changes in d h B * / d t * , leading to a more pronounced MAV response. This results in greater southward deflection on the windward side, followed by a more pronounced northward correction on the leeward side, ultimately enhancing the curvature of the S-shaped track.
By capturing the strong dependence of track deflection on impinging angle [24,27,28,29], the model can simulate the complex interactions between a vortex and the varying slopes of a terrain feature. This finding reinforces the model’s potential as a valuable tool for analyzing and predicting vortex behavior in real-world settings with complex, sloping terrain.

3.2.4. Summary of Results

The observed track deflections and their dependence on both the landing position and the impinging angle are consistent with the theoretical predictions of the dynamic model. The model emphasizes the significance of the rate of change of the dimensionless topographic height d h B * / d t * in determining the MAV and, consequently, the vortex path.
Equation (11) demonstrates that the MAV is directly influenced by the product of the vortex’s current velocity and the gradient of dimensionless topography. Steeper terrain gradients result in larger h B * , amplifying the MAV. Therefore, vortices encountering steeper terrain (central region) or approaching at shallower impinging angles (longer interaction with steep gradients) will exhibit more substantial track deflections.
Strong agreement between the predictions of the model and existing theoretical and numerical studies [11,12,19,28,29] demonstrates the robustness of the model and its ability to accurately capture the underlying dynamics of the vortex–topography interaction. This validation strengthens the study’s argument for accurately representing terrain gradients and incorporating the concepts of α and MAV in modeling vortex behavior.

4. Analysis of Typhoon-like Vortex Path over Taiwan Topography

4.1. Analysis of Taiwan Island Topography: General Trends and Cross-Sectional Characteristics

Figure 4 shows Taiwan’s topography with contour lines at 100 m and 1000 m elevations. Five latitudinal cross-sections (AA’, BB’, CC’, DD’, and EE’) are marked to illustrate topographic variations. The corresponding elevational profiles are shown on the right. Taiwan’s topography is characterized by a prominent CMR, exceeding 3000 m in elevation. The terrain slopes steeply eastward towards the Pacific Ocean and gradually descends westward toward the Taiwan Strait. This westward topographic slope is evident in all five elevational profiles (AA’ to EE’), with the steepest slopes observed in the central sections (CC’ and DD’).
CC’ (near 23.5° N) represents the central part of Taiwan, where the CMR reaches its maximum elevation, with peaks exceeding 3500 m. The terrain here is notable steep, characterized by sharp elevation gradients on both the windward and leeward sides, acting as a significant barrier to airflow and significantly impacting vortex tracks. DD’ (near 23° N) shows a southern segment of the CMR with multiple peaks around 3000 m. Although the topography exhibits slightly gentler slopes compared to CC’, it still presents substantial elevation differences that can affect atmospheric vortices. EE’ (near 22.5° N) represents the southernmost section with a decreasing trend in elevation and peaks generally below 2000 m. The terrain in this region is less pronounced than in the central and northern sections, with broader and more gradual slopes, resulting in weaker orographic impacts on vortex tracks.
Taiwan’s topography is dominated by a central spine of high, steep mountains, significantly influencing atmospheric dynamics, particularly for vortices approaching from the east. The central sections of Taiwan (CC’ and DD’) feature the steepest and highest elevations, playing a crucial role in altering vortex paths, which has been recognized as a major factor influencing typhoon track deflections [2,12,19,31,34].

4.2. Influence of Vortex Intensity on Track Deflection with Fixed Impinging Angle of 195°

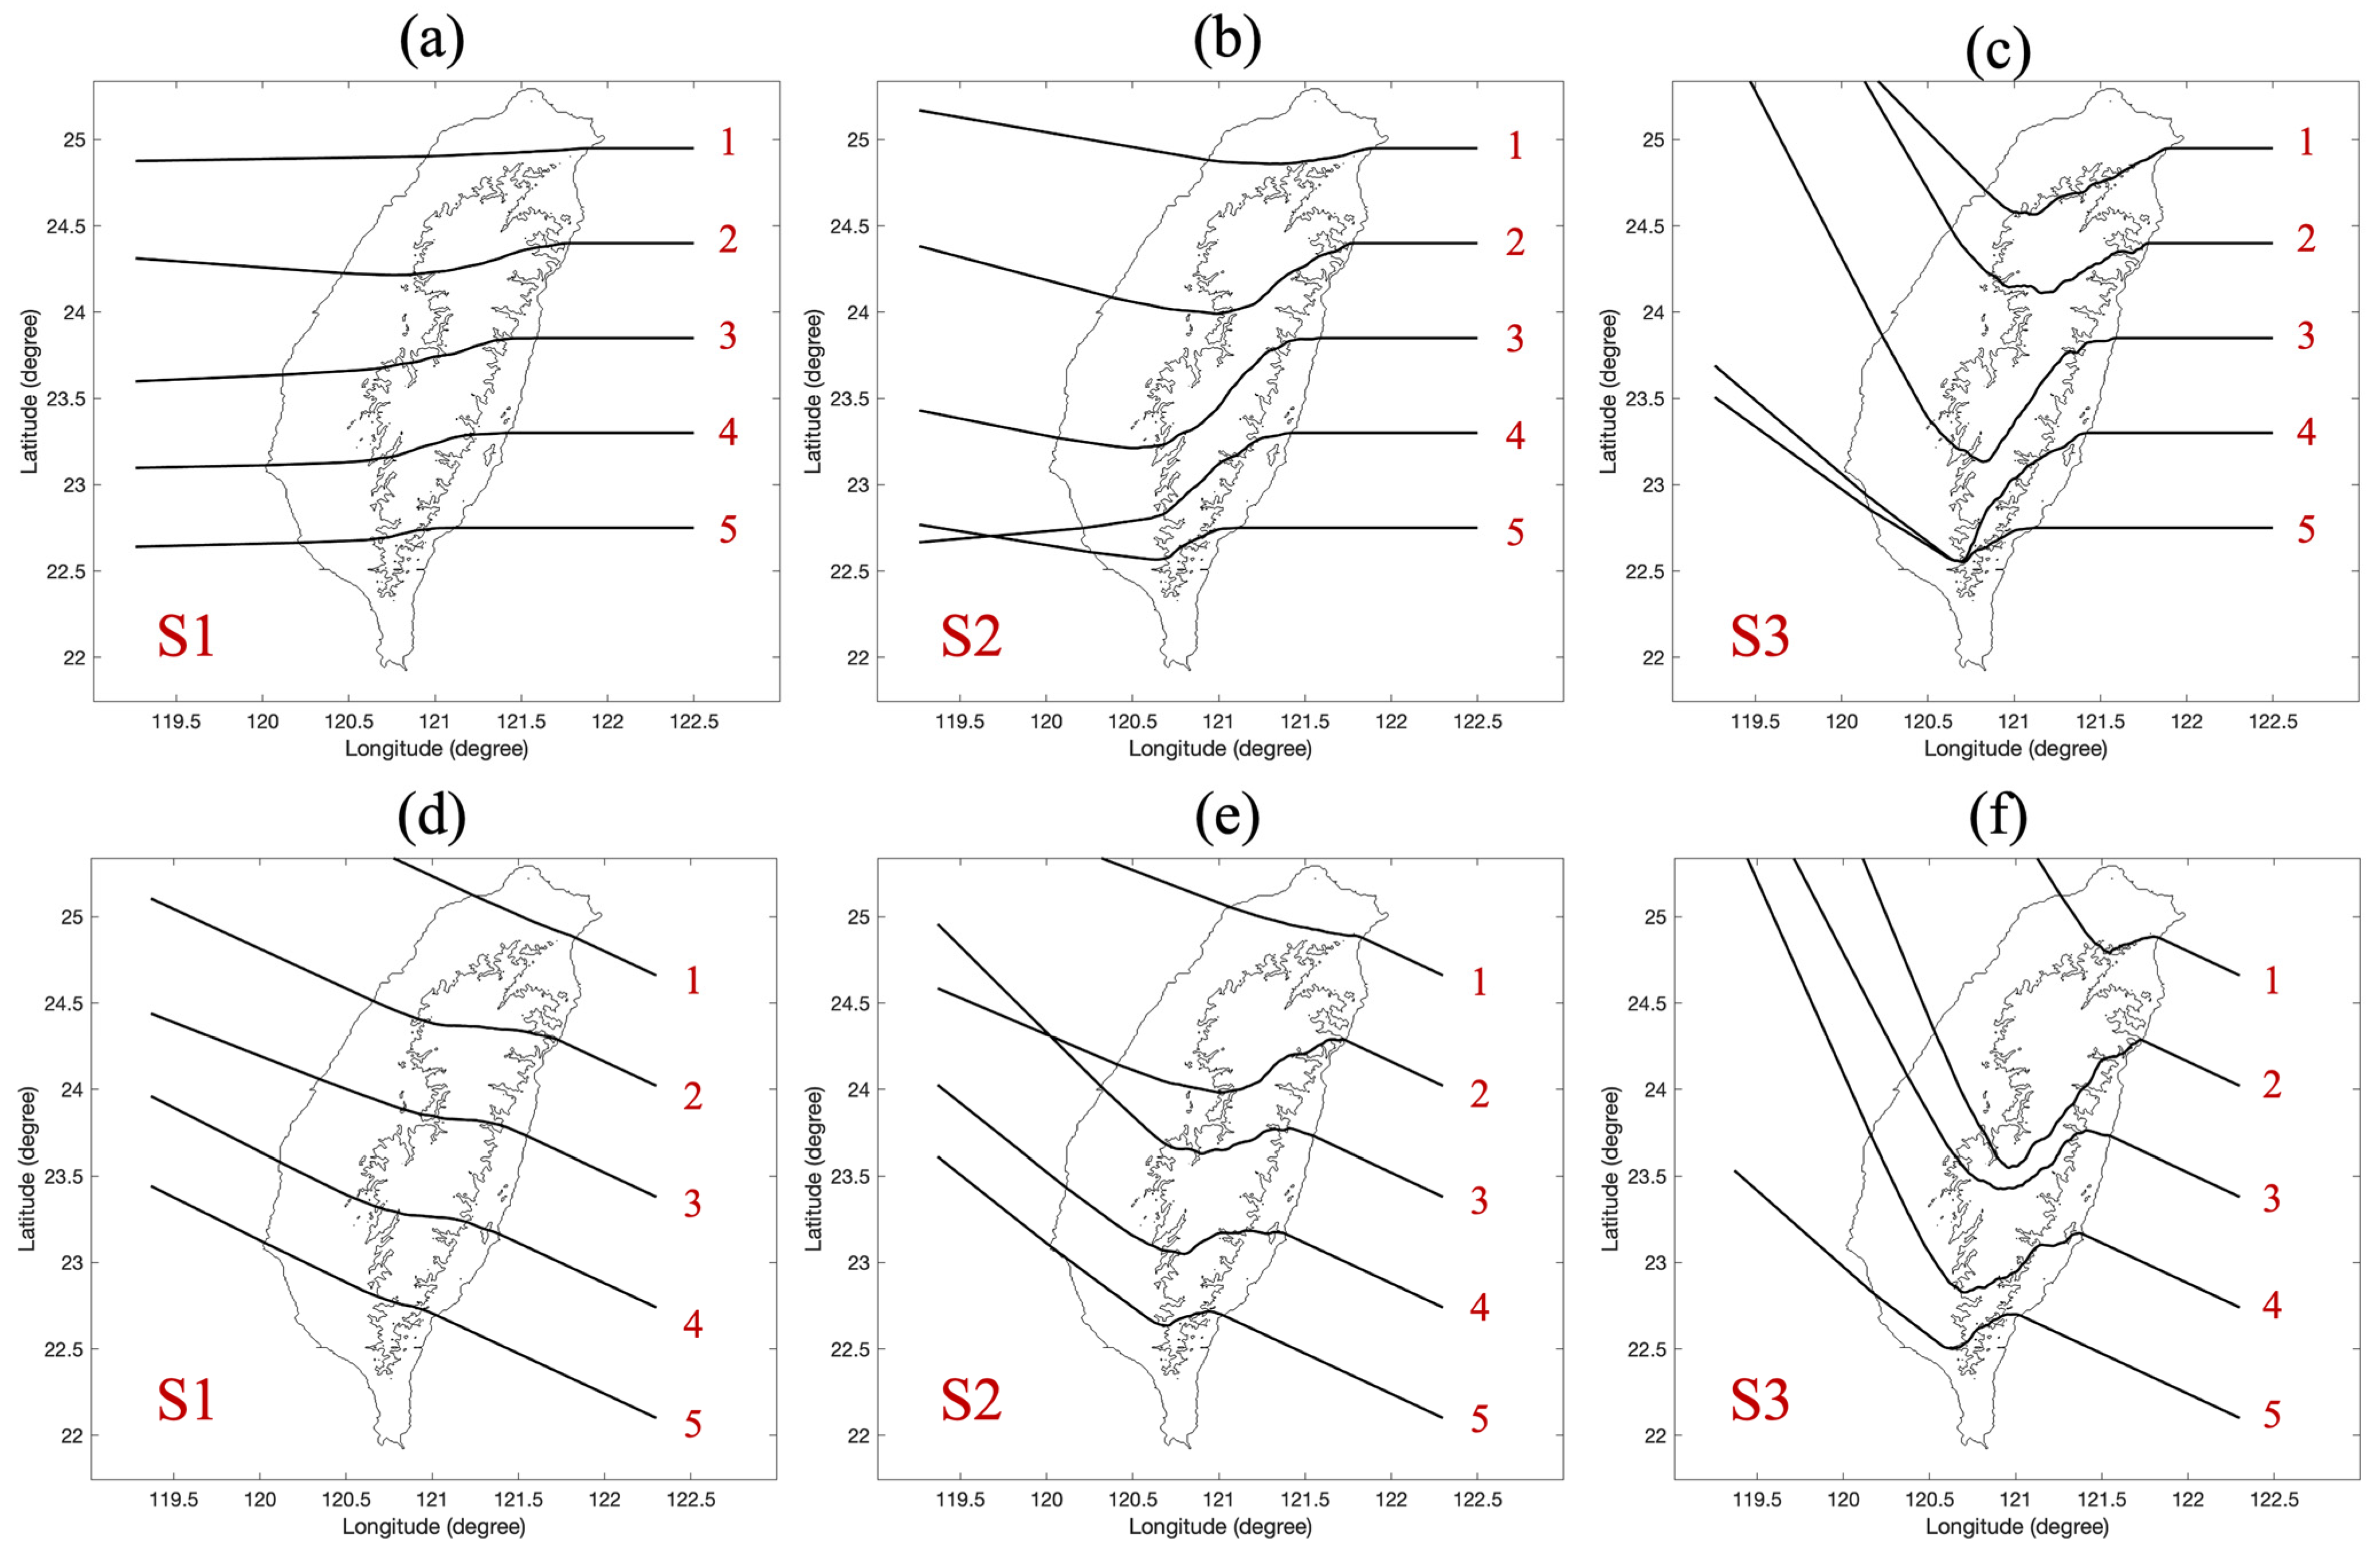
Figure 5a–c show the scanned tracks of vortices S1, S2, and S3, respectively, each calculated with a fixed impinging angle of 195°. Vortices S1, S2, and S3 have central relative vorticity ( ζ c ) of 2 × 10 4 s 1 , 4 × 10 4 s 1 , and 6 × 10 4 s 1 . The initial positions of the vortices are set at 122.5° E longitude, with starting latitudes from 22.75° N to 24.95° N, spaced at equal intervals of 0.55°. The detailed calculation conditions are listed in Table 2.
Examining the tracks alongside the five elevational profiles (AA’ to EE’) in Figure 4, we observe distinct patterns linked to the varying topography:
Tracks interacting with the CMR, particularly along profiles CC’ and DD’, show the most significant southward deflections, especially for the stronger vortices S2 and S3. This pattern is consistent with the steep eastern slopes and high elevations (exceeding 3000 m) characteristic of these profiles, which result in elevated ( β B * / β 0 * ) values ranging from 3.86 to 7.72 as the vortex intensity increases from S1 to S3 (as detailed in Table 2). The increase in α values from 18.0 to 92.4 with rising vortex intensity highlights the enhanced susceptibility to topographic steering, leading to more pronounced southward deflections. The steep terrain induces significant changes in ( d h B * / d t * ), generating a strong positive MAV and causing pronounced southward deviations.
Tracks passing over southern Taiwan (profile EE’) also exhibit notable deflections. Although the terrain here is less elevated than the CMR, it features a significant westward slope, as shown in profile EE’. This slope, combined with the intense circulation of vortex S3, causes a marked westward and then southward deflection, particularly visible in the southernmost track ‘5’ in Figure 5c. This demonstrates the sensitivity of even strong vortices to subtle topographic variations, particularly on their windward side.
Tracks bypassing the CMR (profiles AA’ and BB’) generally maintain a more stable westward trajectory with minimal southward deviation. This reduced response to topography is due to the lower elevations and gentler slopes encountered in the northern part of the island, resulting in weaker ( d h B * / d t * ) forcing and thus less pronounced track deflections.

4.3. Influence of Vortex Intensity on Track Deflection with Fixed Impinging Angle of 170°

Figure 5d–f depict the scanned trajectories of vortices S1, S2, and S3, respectively, impacting Taiwan at a fixed 170° impinging angle. A comparative examination of the tracks and elevational profiles (AA’-EE’ in Figure 4) reveals the following.
Across all vortex intensities, tracks interacting with the steep eastern slopes of the CMR (profiles CC’ and DD’) exhibit the most significant southward deflections, underscoring the CMR’s role as a defined barrier. The relatively shallow impinging angle of 170° facilitates a prolonged interaction with the terrain, enhancing this effect and demonstrating the strong steering influence of this topographic feature.
While the overall southward deflection remains consistent, subtle variations emerge based on vortex intensity. For weaker vortices (S1, Figure 5d), the tracks show a more gradual southward turn, indicating that the weaker circulation is less responsive to the rapid changes in ( d h B * / d t * ) encountered along the steep slopes. In contrast, stronger vortices (S2 and S3, Figure 5e,f) display a sharper and more abrupt southward deflection when encountering the CMR. This behavior aligns with their higher ( β B * / β 0 * ) values (5.15 and 7.72 for S2 and S3, respectively), indicating a stronger influence of terrain on their trajectories. The dynamic model effectively captures this pattern, predicting a more pronounced MAV response to ( d h B * / d t * ) variations for more intense vortices. This observation is further supported by the α values in Table 2, which increase from 18.0 for S1 to 92.4 for S3. The larger α values for stronger vortices suggest a greater sensitivity to terrain gradients, leading to the observed sharper and more abrupt southward deflections as they encounter the steep slopes of the CMR.
An evident north–south asymmetry in deflection can be seen when comparing tracks north and south of the CMR. Tracks passing north of the CMR exhibit minimal deflection, maintaining their initial westward trajectories. In contrast, those passing south of the range display a noticeable westward and southward shift, particularly in Figure 5f. This asymmetry underscores the influence of Taiwan’s sloping terrain west of the CMR (as reflected in profiles CC’ and DD’), contributing to southward deflection even in lower-elevation regions.
In short, by employing a shallower impinging angle, this analysis effectively examines the ability of the model to capture the prolonged interaction of vortices with the steep slopes of the CMR, a scenario often observed in real-world typhoon events [24,27,28,29]. The successful simulation of these prolonged interactions by the model, including nuanced variations based on the intensity of the vortex, strengthens its credibility and highlights its potential for analyzing and forecasting the behavior of typhoons in complex terrain.

4.4. Influence of Vortex Intensity on Track Deflection with Fixed Impinging Angle of 145°

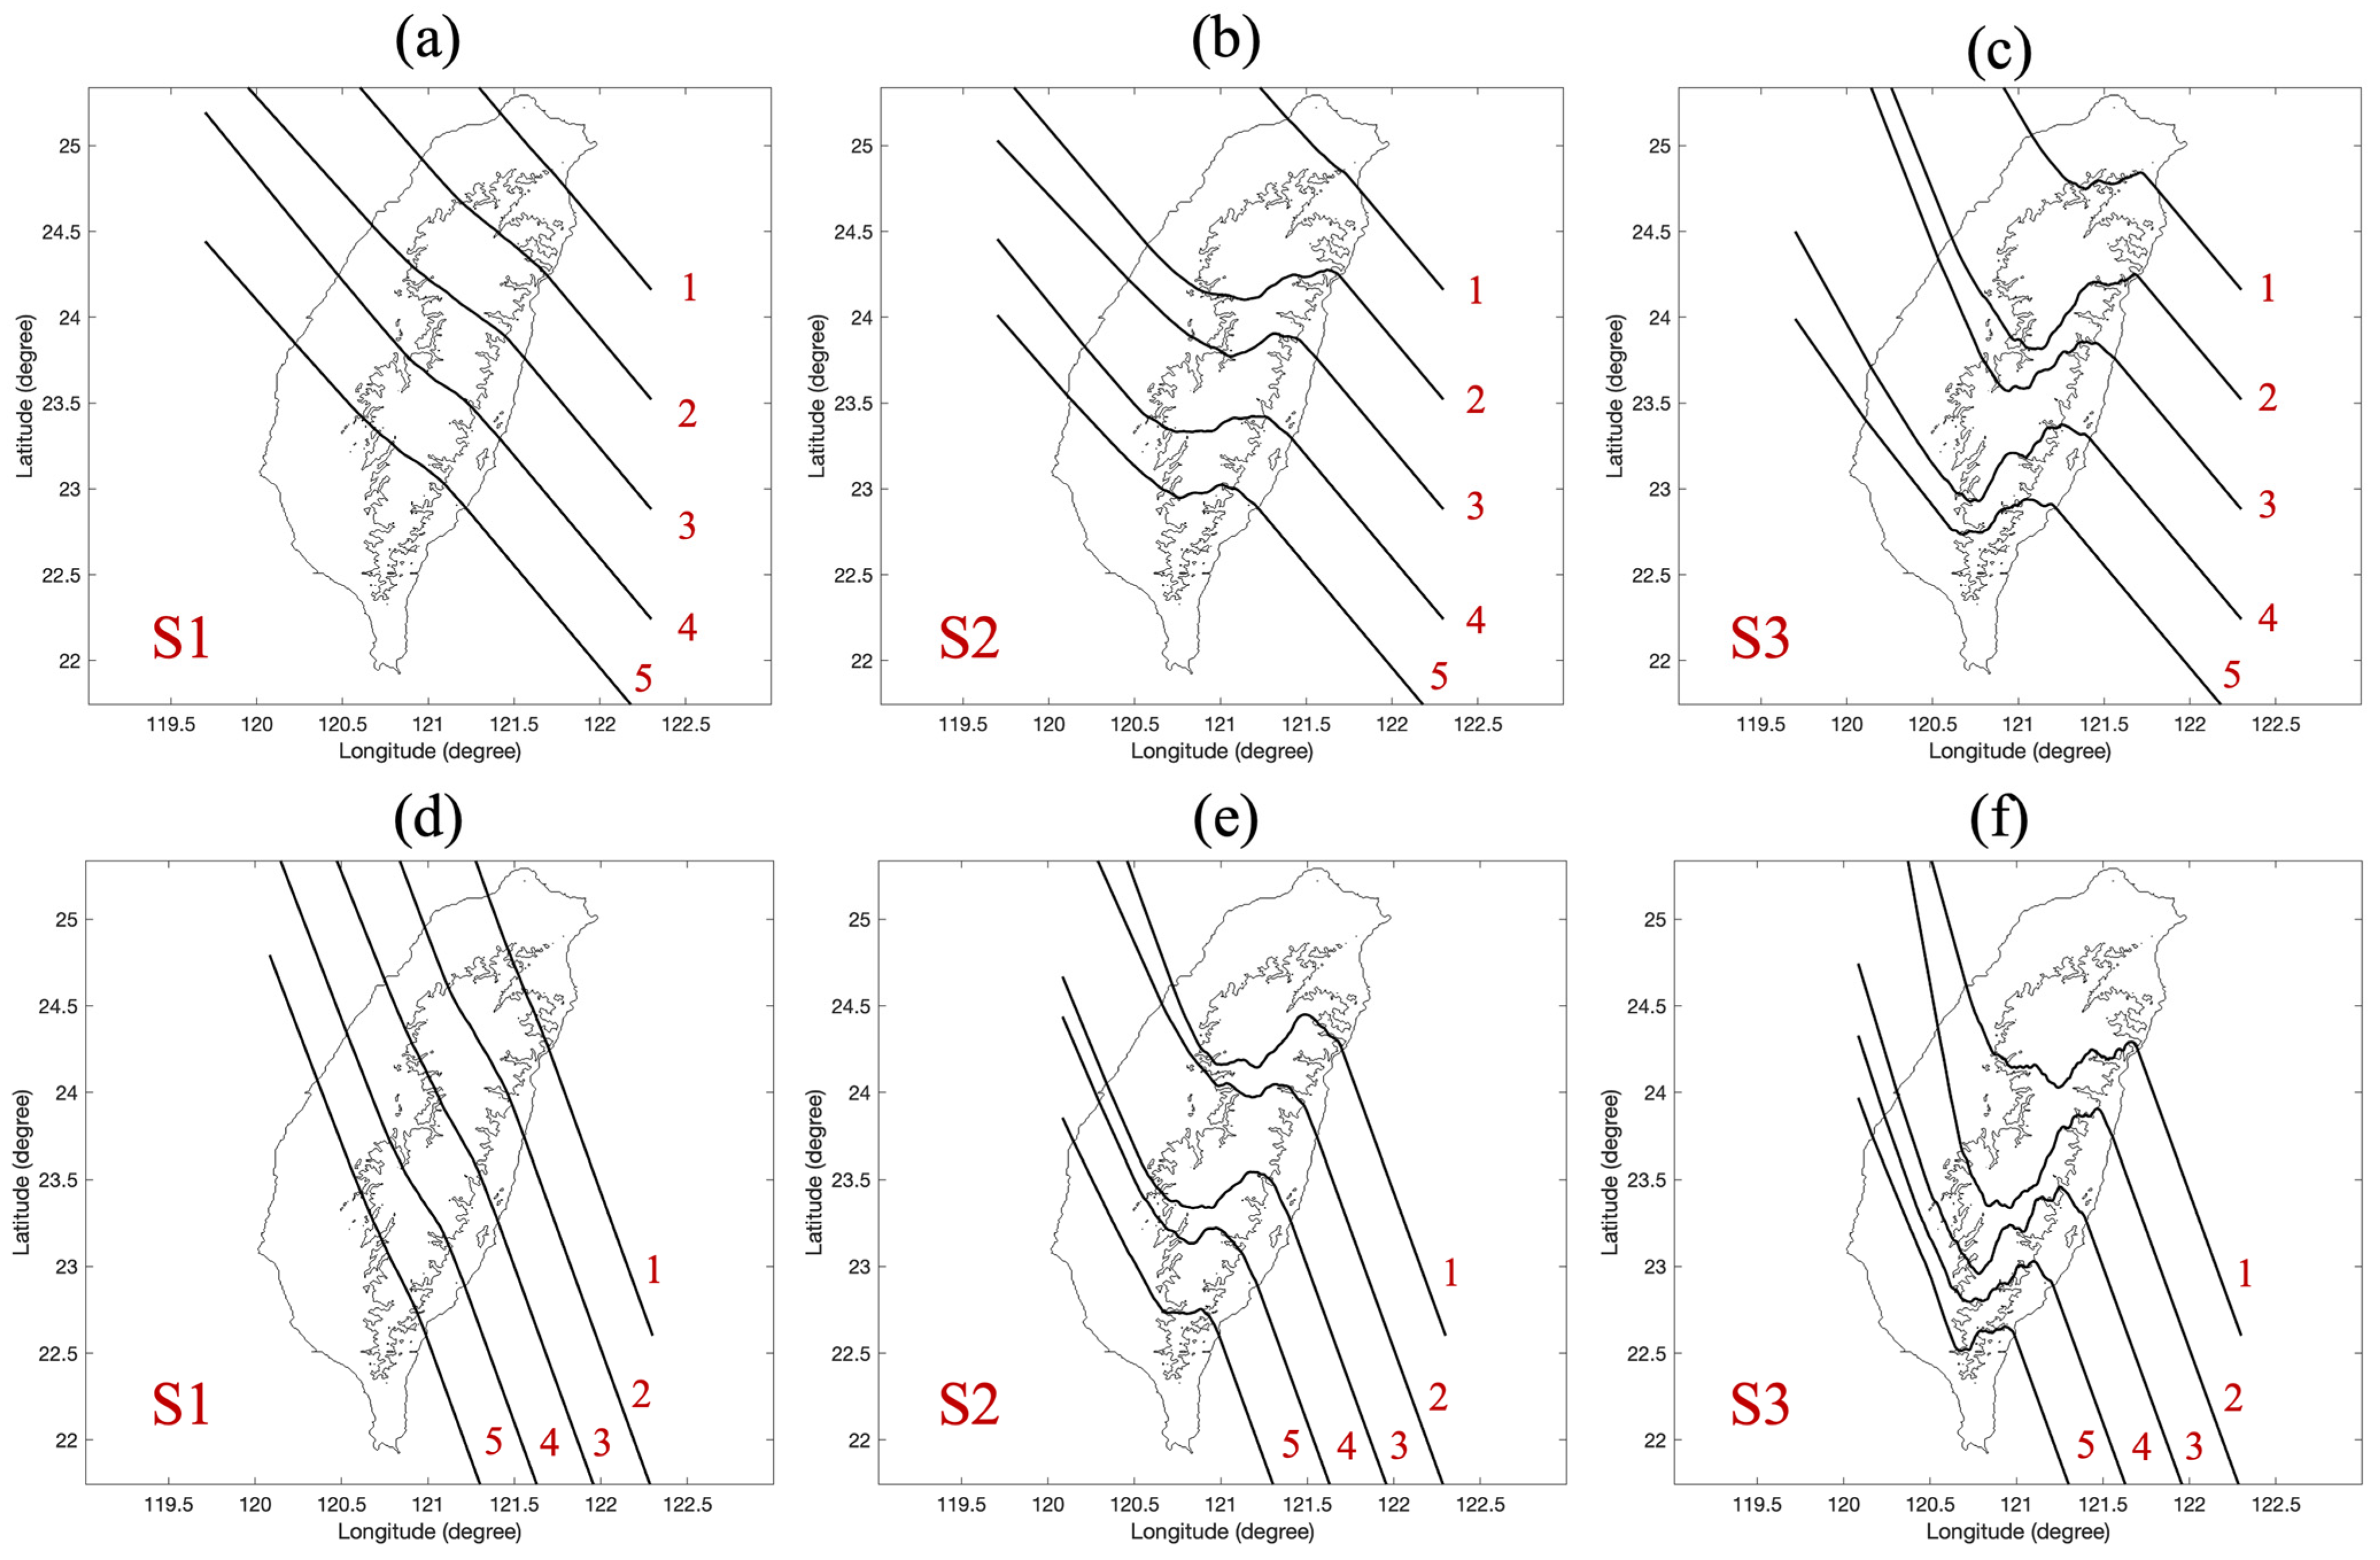
This analysis focuses on Figure 6a–c, which show the scanned trajectories of vortices S1, S2, and S3 (increasing intensity), respectively, approaching Taiwan at a 145° impinging angle. We explore how this shallower angle, combined with varying vortex strengths, affects track deflection, incorporating insights from Taiwan’s topographic profiles (Figure 4) and the dynamic model framework. The results show the following features.
A consistent pattern of enhanced southward deflection is evident across all three figures, particularly for tracks interacting with the central and southern sections of the CMR (profiles CC’ and DD’). This observation underscores the amplified steering influence of the topography at this shallower angle, where the vortex experiences a more prolonged interaction with the steep eastern slopes. The increasing values of ( β B * / β 0 * ) (ranging from 3.86 to 7.72 for S1 to S3) support this, suggesting that, as vortex intensity rises, the terrain effect becomes more pronounced, leading to more significant southward deflections. This is further corroborated by the increasing α values (from 32.1 to 92.4 for S1 to S3) shown in Table 2, indicating heightened sensitivity to topographic forcing. This results in more significant deflections southward, even with the shallower impinging angle.
The relationship between vortex intensity and deflection magnitude reveals that, while all vortices experience southward deflection, vortex strength ( ζ c ) influences the extent of this shift. The weaker vortex S1 (Figure 6a) shows a less pronounced shift compared to the more intense vortices S2 (Figure 6b) and S3 (Figure 6c). This aligns with the dynamic model, where a stronger vortex, characterized by a higher terrain adjustment coefficient (α), shows a more substantial MAV response to the same ( d h B * / d t * ) forcing, leading to a more significant southward deflection.
Even tracks passing south of Taiwan, which do not directly interact with the highest peaks (profile EE’), demonstrate the westward terrain influence, exhibiting a westward and then southward deflection. This highlights the impact of the westward-sloping terrain west of the central ridge, contributing to southward steering effects even at lower elevations.

4.5. Influence of Vortex Intensity on Track Deflection with Fixed Impinging Angle of 120°

This analysis focuses on Figure 6d–f, which illustrate scanned trajectories of vortices S1, S2, and S3 (increasing in intensity), respectively, approaching Taiwan at a 120° impinging angle. The results show the following features.
In all three figures and for all vortex intensities, a consistent pattern emerges, demonstrating topography as the dominant steering force. Taiwan’s topography serves as a major guiding influence. Even the weakest vortex (S1, Figure 6d) experiences a significant southward deflection, demonstrating the dominance of terrain over the vortex’s natural motion. This effect is attributed to the notably high ( β B * / β 0 * ) values (ranging from 3.86 to 7.72 for S5 to S3) at this shallow angle, indicating that the topographic beta effect ( β B * ) significantly exceeds the planetary beta effect ( β 0 * ). The α values listed in Table 2, all significantly greater than 1 (even for the weakest vortex S1, with α = 18.0), further confirm this dominance of terrain over the vortex’s intrinsic movement.
While all vortices exhibit substantial southward deflection, there is a subtle influence of vortex intensity. For the weaker vortex (S1, Figure 6d), the track follows a smoother southward path, closely hugging the eastern coastline, indicating a more passive response to the terrain. In contrast, the tracks of stronger vortices (S2 and S3, Figure 6e,f) display more pronounced oscillations as they are deflected southward. This is likely due to the stronger interaction between the intense circulation and the complex terrain, resulting in more dynamic and spatially variable ( d h B * / d t * ) forcing, and, consequently, a more fluctuating MAV response.
An analysis of the topographic profiles and track variability reveals that the consistent southward deflection aligns with the steep eastern slopes of the CMR, particularly profiles CC’ and DD’. Even tracks passing farther south, which interact with the gentler slopes of profile EE’, still exhibit significant southward turning, indicating the extensive influence of the terrain at this shallow angle.

4.6. A Comprehensive Analysis with Real and Idealized Terrain

The set of Figure 5a–f and Figure 6a–f present the scanned tracks of three typhoon-like vortices (S1, S2, and S3) interacting with Taiwan’s complex topography under varying impinging angles (195°, 170°, 145°, and 120°). The dynamic model captures how the dimensionless rate of change of the topographic height d h B * / d t * influences vortex paths, modulated by the vortex’s relative vorticity ζ c and impinging angles γ . Key observations and interpretations include:
  • Influence of Vortex Intensity ( ζ c ): Across all figures, stronger vortices (e.g., S3) exhibit the most pronounced S-shaped track deflections. These deflections occur due to larger topographic adjusting parameters ( α ), leading to significant MAV. The MAV is directly influenced by d h B * / d t * , where positive values correspond to compression on windward slopes, driving southward deflections, and negative values correspond to stretching on leeward slopes, causing northward corrections. Weaker vortices (e.g., S1) show minimal interaction, maintaining relatively straight paths due to subdued MAV responses.
  • Effect of Impinging Angle ( γ ): The impinging angle significantly alters the extent of interaction between the vortex and the terrain. Steeper impinging angles (e.g., 120° in Figure 6d–f) result in greater path curvature as the vortex spends more time engaging with the terrain. In contrast, shallower angles (e.g., 195° in Figure 5a–c) lead to less interaction, as the vortices traverse the terrain more perpendicularly, minimizing prolonged exposure to the topographic gradients.
  • Path Characteristics: The distinct S-shaped patterns observed in S3 are most evident under steeper impinging angles (Figure 6e,f). These figures show the dynamic response to terrain, characterized by strong deflections due to amplified MAV effects. Conversely, weaker vortices like S1 maintain near-linear paths across all angles, demonstrating that lower ζ c values dampen the influence of topographic variations.
  • The presence of “S-shaped curves” in typhoon tracks interacting with terrain, characterized by significant southward and subsequent northward deflections, is a recognized phenomenon in both observations and numerical simulations. As noted previously, real typhoons like Herb (1996) and Soudelor (2015) showcase these S-shaped tracks. Numerical studies, including [11,14,17], consistently demonstrate these deflections in their simulations of typhoons interacting with the CMR. The varying degrees of curvature observed in these tracks depend on factors like the vortex intensity, the terrain’s steepness, and, importantly, the impinging angle.
  • The relationship between the impinging angle and path curvature, as supported by the idealized simulations, probably finds backing in the work of Lin and Savage [16] and the studies it builds upon [7,14]. Specifically, Lin and Savage [16] show that shallower approach angles (smaller γ) lead to more pronounced deflections and a higher likelihood of track discontinuity due to increased vorticity stretching on the lee side. While not explicitly quantifying curvature, their categorization of track types (E, N, S, NE, SE) based on landfall and approach angle implicitly acknowledges the connection between shallower angles and greater deviations from the initial track, which often manifests as increased curvature. Therefore, while further research could quantify this relationship more precisely, the existing literature, including the work of Lin and Savage [16], supports the connection between shallower approach angles and increased path curvature in typhoon–terrain interactions.

4.7. Dynamic Model Validation: A Comparative Analysis of Simulated and Observed Typhoon Soudelor (2015) Tracks

4.7.1. Initial Condition Settings of Dynamic Model

To validate the dynamic model’s predictive capability for real typhoon tracks, we employed the following procedure to determine model parameters corresponding to observed typhoon characteristics: (1) The vortex intensity ( ζ c ) was determined from the typhoon’s maximum wind speed near the center ( V m a x ) and its corresponding radius ( R m a x ). (2) The maximum wind radius ( R m a x ) was estimated using the empirical formula [47] as
R m a x = 0.23 R 50 ,
where R 50 is the wind radius of 50 kt ( 25   m / s ).
(3) Assuming a solid-body rotation with uniform vorticity within the vortex core, ( ζ c ) was estimated by
ζ c = 2 V m a x / R m a x .
(4) Considering the characteristic scale of the overall vortex motion, a characteristic wind speed ( V m ) of 30 kt ( 15   m / s ) was selected, with its corresponding radius ( R m ) representing the characteristic vortex size.
The initial vortex translation speed ( V 0 ) was determined by referencing the typhoon track data. A time near the typhoon’s landfall over Taiwan was selected as the starting point for the dynamic model simulation. The magnitude of ( V 0 ) was estimated by averaging the translation speeds between data points immediately before and after the chosen starting time. The direction of ( V 0 ) was estimated as the bearing from the starting position to the typhoon’s landfall point.
Typhoon data were obtained from the Typhoon Database of the Central Weather Administration of Taiwan [9]. The comparison between the simulated and observed tracks focused on the period when the typhoon was approaching and interacting with Taiwan’s terrain, ensuring a meaningful comparison.
Typhoon Soudelor, the 13th typhoon in the 2015 Northwest Pacific typhoon season, made landfall near Hualien, Taiwan, between 7 and 8 August 2015. After traversing the Central Mountain Range, it exited over Yunlin County on the western coast. Soudelor’s circulation impacted the entire island, causing significant damage across various regions. Before landfall, Soudelor’s maximum sustained winds reached gusts of 48 m/s, and its gale-force winds (15 m/s) extended to a radius of 280 km.
For a detailed comparison of the track during landfall, hourly typhoon location data from the Taiwan Central Weather Administration’s radar and satellite centers were used, spanning from 1600 UTC on August 7th to 1200 UTC on August 8th. The initial typhoon center position was 23.75° N, 122.7° E. The average maximum wind speed near the center was approximately 48 m/s. Using Equation (16), R m a x was estimated to be approximately 23 km. Subsequently, Equation (17) yielded an initial ( ζ c ) of approximately 4.2 × 10 3 s 1 . The initial translation speed ( V 0 ) was estimated at 6.9 m/s, and the impinging angle ( γ ) was 175° (assuming a Taiwan island orientation angle θ of 15°). The radii of 15 m/s and 25 m/s winds were 300 km and 100 km, respectively.

4.7.2. Comparing Simulated and Observed Tracks of Typhoon Soudelor (2015)

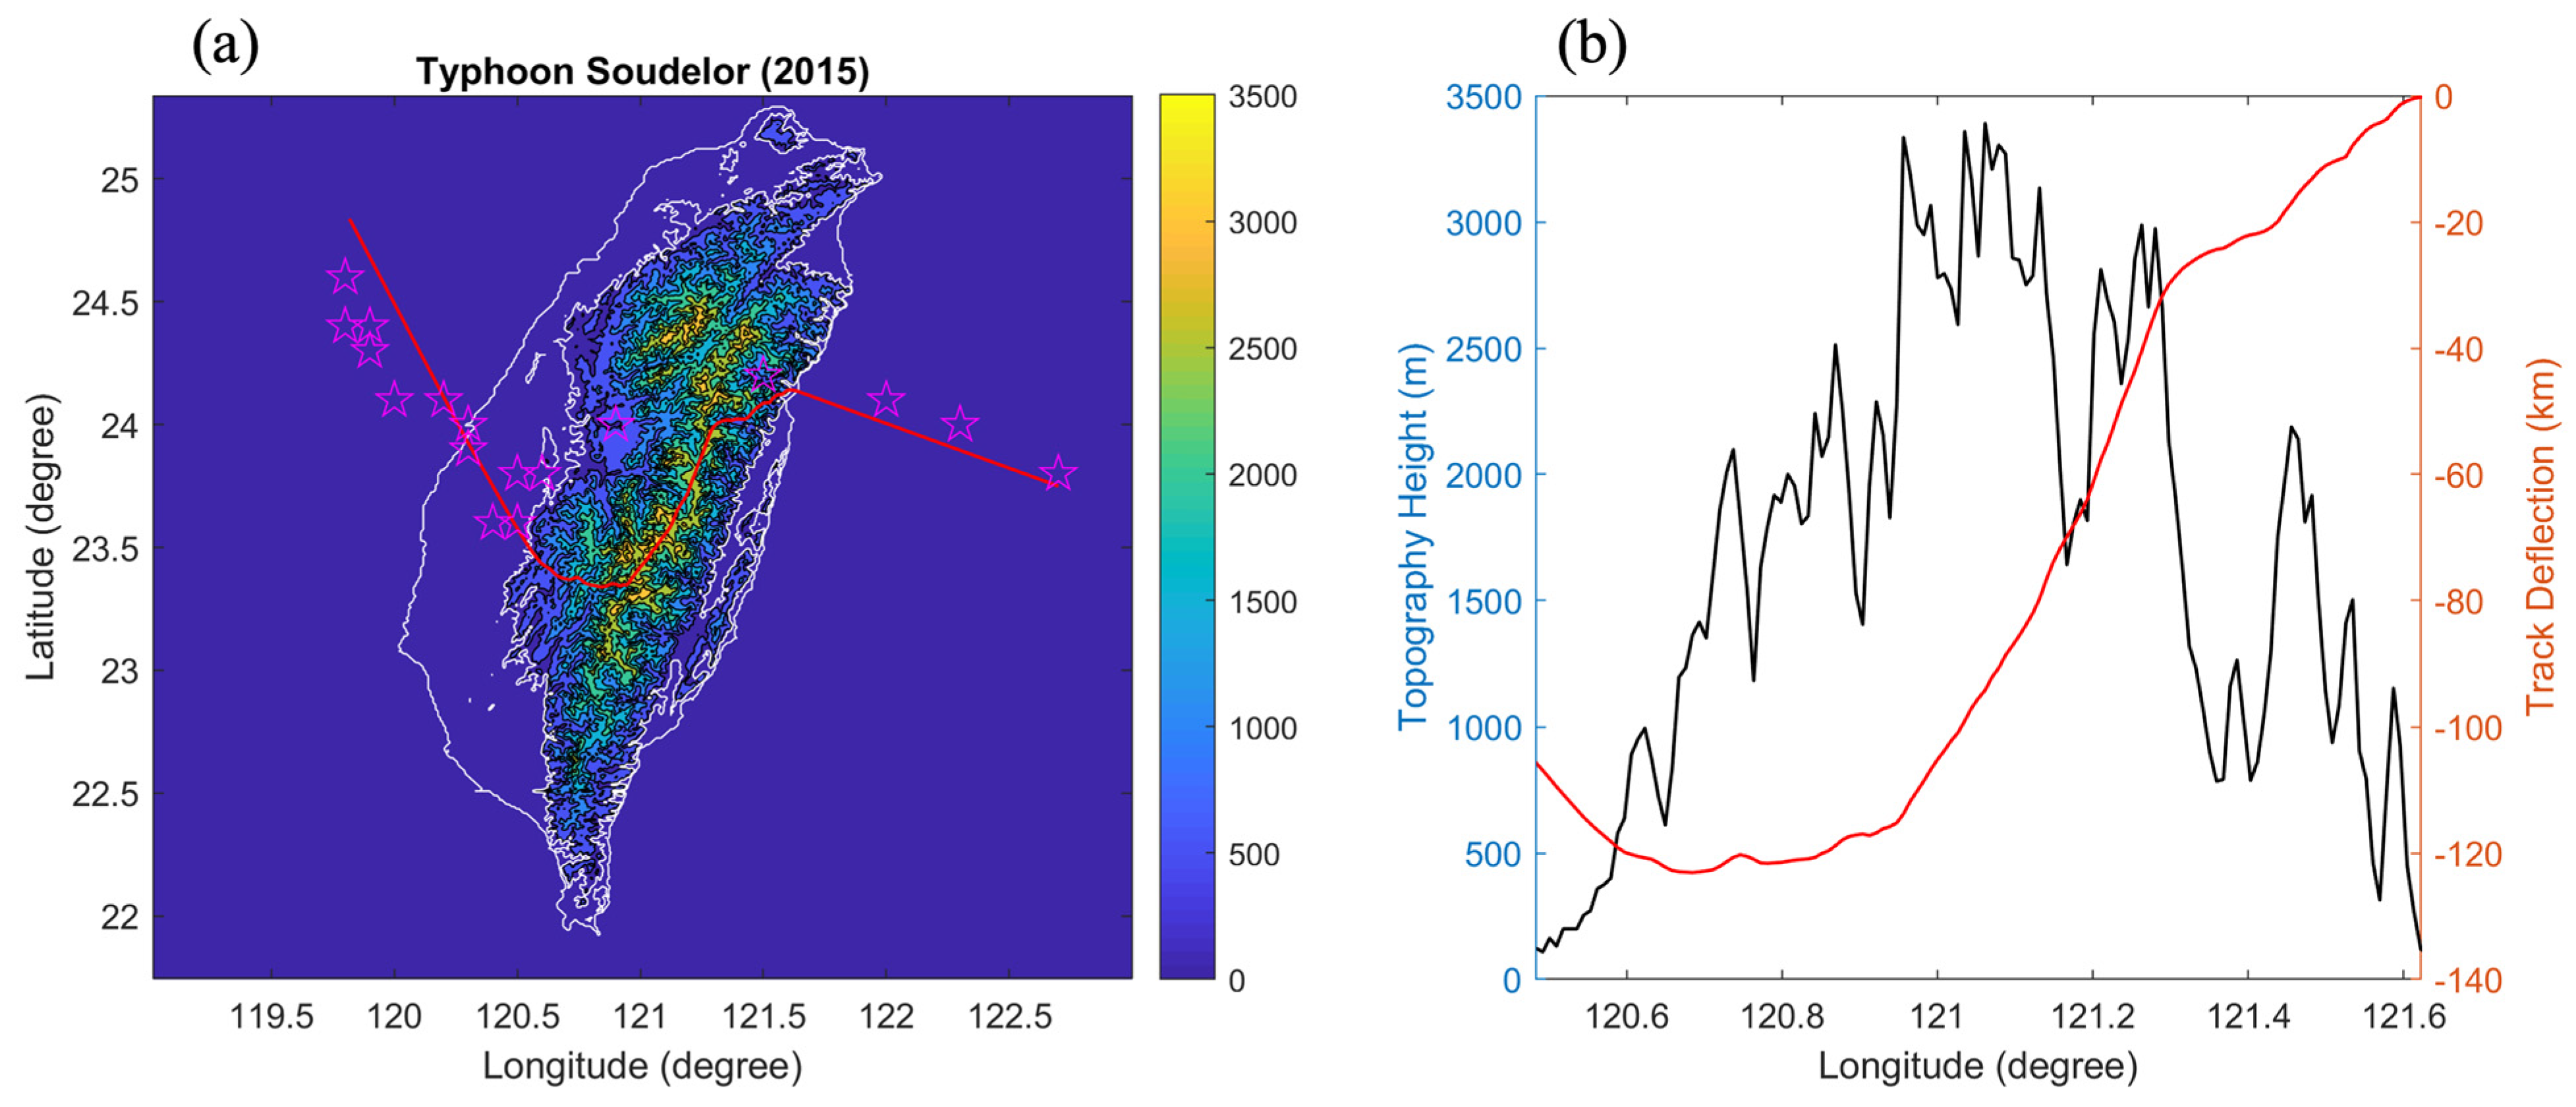
Figure 7a compares the dynamic model’s simulated track with the observed track of Typhoon Soudelor. The solid red line represents the simulated track, while the open pink stars denote the observed typhoon center positions. The simulated and observed tracks show good agreement. After making landfall near Hualien on the windward (eastern) side, the simulated track initially deflects southward, following the CMR towards the Yushan, and Alishan mountain ranges, exhibiting a clockwise turning motion around the terrain. Upon reaching the leeward (western) side, the simulated track gently curves northwestward downslope, eventually exiting Taiwan over Yunlin County.
Figure 7b presents the elevational profile along the simulated track during landfall, juxtaposed with the track deflection. As the typhoon ascends the windward slopes during landfall and its subsequent circling motion, the magnitude of track deflection increases with increasing terrain slope. Upon reaching the leeward side, the dimensionless topographic height change rate ( d h B * / d t * ) decreases, leading to a more gradual change in track deflection.
A notable discrepancy arises as the simulated and observed tracks traverse the CMR. However, the agreement improves significantly after the typhoon crosses the mountains. This deviation likely stems from the dynamic model’s simplifications, which neglect factors such as changes in vortex structure, terrain friction, and diabatic processes, all of which can influence typhoon tracks, particularly over high terrain.
Analyzing the simulated and observed tracks through the lens of ( d h B * / d t * ) and the dynamic model:
  • Windward Ascent and Southward Deflection: As Soudelor ascends the windward slopes, ( d h B * / d t * ) increases, leading to a strong positive MAV and the observed southward deflection. The magnitude of this deflection is consistent with the steep terrain encountered during landfall near Hualien, as illustrated in the elevational profile in Figure 7b.
  • Leeward Descent and Northward Adjustment: Upon reaching the leeward side, the decrease in ( d h B * / d t * ) weakens the positive MAV, allowing the track to gradually adjust northward, as seen in both the simulated and observed tracks.
  • Discrepancy over the Central Mountains: The deviation between the simulated and observed tracks over the highest terrain likely arises from the model’s simplified representation of the vortex. Factors like terrain friction and diabatic effects, absent in the model, become more significant over high mountains, contributing to the observed track differences.
  • Improved Agreement After Mountain Crossing: The improved agreement between the tracks after crossing the mountains suggests that the dynamic model captures the essential topographic steering mechanisms once the vortex moves away from the most complex terrain.
This comparison with Typhoon Soudelor demonstrates the dynamic model’s capability to capture the fundamental features of terrain-induced track deflection. While discrepancies exist, particularly over complex, high-elevation terrain, the model provides valuable insights into the role of ( d h B * / d t * ) and MAV in shaping typhoon tracks. Further model refinements incorporating additional physical processes will likely improve the model’s predictive skill in such challenging scenarios.

5. Conclusions

This study investigates the influence of topography on the trajectory of strong cyclonic vortices using a dynamic model based on the conservation of PV. The study develops a novel dynamic model that incorporates the α and the MAV to capture the vortex’s response to terrain variations.

5.1. A Novel Dynamic Model for Predicting Typhoon Tracks over Complex Terrain

This study presented a significant advancement in understanding and predicting typhoon–topography interactions through the development and validation of an innovative dynamic model. This model, grounded in the principle of potential vorticity (PV) conservation, offers a refined approach to capturing the complex interplay between a typhoon’s circulation and underlying terrain. Its key innovation lies in the incorporation of two crucial parameters: the topographic adjusting parameter (α) and the meridional adjusting velocity (MAV). Many previous studies on typhoon track deflection have also highlighted the role of topography in influencing typhoon tracks. For instance, [12] emphasized the significant impact of Taiwan’s Central Mountain Range on typhoon trajectories, while [7] examined the effects of terrain on the upstream deflection of typhoon tracks.
This finding aligns with the topographic beta drift concept observed in laboratory experiments and theoretical frameworks, particularly those described by [32,40], which highlight how cyclones tend to deflect northwestward over terrain, mirroring planetary beta drift effects. The application of α and MAV to capture nuanced terrain interactions enhances this foundational concept by allowing for real-time adjustments to terrain features.
The topographic adjusting parameter (α) quantifies the sensitivity of a typhoon’s trajectory to changes in terrain elevation. A higher α value indicates a greater susceptibility to topographic steering, resulting in more pronounced track deflections. Critically, α is not static but varies dynamically with both vortex intensity (represented by the product of the Rossby number R o v and non-dimensional relative vorticity ζ c * ) and the relative influence of topographic features ( β B * ) compared to the background planetary vorticity ( β 0 * ). This dynamic relationship captures the complex interplay between a typhoon’s inherent strength and the surrounding environmental conditions, which are crucial in determining the degree of topographic influence.
The MAV complements α by dynamically adjusting the vortex’s meridional (north–south) velocity in response to terrain variations. The MAV is directly proportional to both α and the rate of change of topographic height ( d h B * / d t * ) along the vortex’s path. This means that when a typhoon encounters steep terrain gradients, such as those found in Taiwan’s CMR, the MAV is amplified, leading to more pronounced northward or southward deflections. The explicit calculation of MAV allows for a more realistic and nuanced representation of a typhoon’s response to complex terrain, a feature often lacking in simpler track prediction models.
The model’s performance was rigorously validated using both idealized and realistic simulations. Initial tests with an idealized bell-shaped mountain confirmed the model’s ability to capture the fundamental dynamics of topographic steering. Subsequent simulations using Taiwan’s complex topography further demonstrated the model’s capability to realistically predict typhoon track deflections, highlighting the significant influence of the CMR. These findings underscore the model’s potential as a powerful tool for improving typhoon track forecasting and, consequently, enhancing disaster preparedness strategies [2,4,12,27,28,29,40]. This is also supported by the findings from the idealized simulations of [18], whose results indicated that topography, particularly that of Taiwan, significantly influences typhoon tracks.

5.2. Evaluating Model Performance with Idealized Topography

To assess the fundamental capabilities of the innovative dynamic model, a series of simulations were conducted using an idealized bell-shaped mountain. This simplified topography allowed for a controlled investigation into the core mechanisms of topographic steering, isolating the effects of terrain steepness, vortex intensity, and impinging angle without the added complexities of real-world terrain.
The simulations revealed a distinct relationship between the vortex’s landing position relative to the mountain and the resulting track deflection. Vortices making landfall near the mountain’s center, where terrain gradients are steepest, experienced the most significant deflections, often exhibiting pronounced S-shaped trajectories. This behavior directly corresponds to amplified MAV values due to the rapid changes in topographic height ( d h B * / d t * ) experienced by the vortex in these regions. Conversely, vortices making landfall further from the center, where slopes are gentler, exhibited smaller deflections and maintained more direct paths, reflecting the reduced influence of the MAV.
Further analysis revealed the crucial role of the impinging angle (γ) in modulating the interaction between the vortex and the terrain. Shallower impinging angles (smaller γ values), representing more oblique approaches, led to increased interaction time with the steepest portions of the terrain. This prolonged interaction resulted in greater deflections and more pronounced curvature in the vortex tracks. These findings underscore the importance of accurately representing both the terrain’s steepness and the vortex’s approach angle when predicting track deflections.
The results obtained from these idealized simulations served as a crucial first step in validating the dynamic model. The observed relationships between landing position, impinging angle, and track deflection aligned closely with the model’s predictions, confirming its ability to capture the fundamental physics of topographic steering. This validation provided a strong foundation for subsequent investigations using the more complex and realistic topography of Taiwan Island. Other studies using idealized terrain [12,15,16] have also demonstrated the influence of topographic features, such as landfall location and approaching angle, on typhoon track deflections.

5.3. Applying the Model to Real-World Complexity: Typhoon-like Tracks over Taiwan

Following the validation with idealized topography, the dynamic model’s performance was evaluated using the realistic, complex terrain of Taiwan Island. This application served as a critical test of the model’s ability to predict typhoon track deflections in a real-world scenario, where the intricate interplay between topography and vortex dynamics can lead to highly variable and often unpredictable track behavior [2,12,19,24,25,27,34].
Simulations were conducted using a range of typhoon-like vortices with varying intensities and approach angles, mirroring the diverse conditions encountered in actual typhoons impacting Taiwan. The results consistently highlighted the dominant role of the CMR in shaping vortex trajectories. The CMR’s steep eastern slopes acted as a significant barrier, deflecting tracks southward, particularly for those vortices approaching from the east. This southward deflection was most pronounced for stronger vortices and at shallower approach angles, further corroborating the findings from the idealized simulations and demonstrating the model’s ability to capture the interplay of these key factors.
A key observation from the Taiwan simulations was the marked north–south asymmetry in track deflections. Vortices passing north of the CMR experienced minimal deviation, largely maintaining their initial westward course. In contrast, those passing south of the CMR exhibited substantial westward and then southward deflections, influenced by the westward sloping terrain west of the mountain range. This asymmetry highlights the importance of capturing the detailed topographic features of a region when predicting typhoon tracks.
Compared to the idealized simulations, the tracks generated over Taiwan’s topography exhibited greater variability, reflecting the island’s intricate terrain features. Multiple peaks, valleys, and varying slopes created a complex distribution of d h B * / d t * , leading to dynamic fluctuations in the MAV and consequently, more intricate and variable track deflections. The model’s ability to capture this increased variability underscores its capacity to simulate real-world typhoon behavior in complex terrain. This successful application to Taiwan’s topography highlights the model’s potential as a valuable tool for improving typhoon track forecasting and enhancing disaster preparedness in regions characterized by complex terrain.
The real-world application of the dynamic model to Typhoon Soudelor (2015) further strengthens the conclusions drawn from the idealized simulations. Soudelor’s track, as simulated by the model, accurately reflected the dominant southward deflection induced by the CMR, particularly during the windward ascent phase. The model successfully captured the increasing magnitude of track deflection with increasing terrain slope, illustrating the direct link between d h B * / d t * and MAV. While some discrepancies emerged over the highest terrain, likely due to the model’s simplified representation of physical processes like terrain friction and diabatic effects, the overall agreement between the simulated and observed tracks, especially after the typhoon crossed the CMR, validates the model’s ability to capture the essential dynamics of topographic steering in a real-world scenario. This successful application to a specific typhoon case reinforces the model’s potential for improving real-time track forecasting and enhancing disaster preparedness strategies. Previous studies on typhoon interactions with Taiwan’s terrain, such as [4] have also highlighted the significance of topographic effects in typhoon track deflection, particularly when in proximity to the Central Mountain Range.
The model’s accurate simulation of Typhoon Soudelor’s track, particularly the pronounced southward deflection observed during its approach to Taiwan’s Central Mountain Range (CMR), echoes the deflection patterns discussed in observational studies by [7,8] and numerical simulations by [4], which underscore the significant steering effects induced by Taiwan’s steep eastern slopes. Additionally, the model captures the nuanced northward adjustment upon Soudelor’s descent, demonstrating a high degree of alignment with empirical observations that attribute such deflections to complex terrain influences.

5.4. Key Findings and Implications for Typhoon Track Forecasting

This study makes several key contributions to the understanding and prediction of typhoon track deflections in complex terrain. The development and validation of the innovative dynamic model, incorporating the topographic adjusting parameter (α) and the meridional adjusting velocity (MAV), provides a significant advancement in our ability to capture the complex interaction between typhoon vortices and underlying topography.

5.4.1. Key Findings

Dominant role of topography: Steep terrain gradients, exemplified by Taiwan’s Central Mountain Range (CMR), consistently deflect typhoon tracks, particularly inducing southward deviations. This underscores the critical need for accurate terrain representation in forecast models.
  • Influence of vortex intensity: Stronger vortices experience more pronounced deflections due to their enhanced sensitivity to topographic steering (larger α and MAV). This highlights the importance of accurately estimating and forecasting vortex intensity for reliable track prediction.
  • Impact of approach angle: Shallower approach angles amplify deflections due to prolonged interaction with steep terrain. This finding emphasizes the need to carefully consider the vortex’s initial trajectory and its orientation relative to topographic features.
  • North-south asymmetry in deflections: The significant difference in track deflections observed north and south of the CMR demonstrates the importance of capturing detailed topographic features to accurately predict track deviations.
  • Enhanced track variability in complex terrain: The increased variability in typhoon tracks simulated over Taiwan’s complex topography, compared to idealized terrain, underscores the model’s ability to capture the dynamic interplay between a vortex and its environment, a crucial aspect for realistic track forecasting.
  • Real-world validation with historical Typhoon: The model’s application to Typhoon Soudelor (2015) provided a crucial real-world test of its capabilities. The model successfully reproduced the observed southward deflection induced by the CMR, demonstrating the influence of steep terrain gradients and the resulting MAV on the typhoon’s trajectory. While minor discrepancies were noted, particularly over the highest terrain where simplified model physics likely played a role, the overall agreement between the simulated and observed tracks, especially after mountain crossing, highlights the model’s skill in capturing the dominant topographic steering effects. This successful real-world application reinforces the model’s potential for improving typhoon track forecasting and contributing to enhanced disaster preparedness strategies.
  • The study confirms that vortex intensity and structural attributes are critical in determining the extent of interaction with topography, as shown in other studies [17,40]. Stronger vortices exhibit more pronounced track deflections due to heightened sensitivity to terrain, consistent with the amplified deflection patterns modeled here. This finding is further substantiated by idealized simulations and real-case observations that emphasize intensity’s role in altering track dynamics across steep terrains like the CMR.

5.4.2. Implications and Future Directions

This research demonstrates the capability of the novel dynamic model to realistically simulate and predict typhoon track deflections over complex terrain. The model’s insights into the interplay between topographic steering, vortex intensity, and approach angle can significantly enhance typhoon track forecasting, particularly in regions like Taiwan where terrain plays a critical role. Future research can expand upon these findings by: Numerous other studies have also investigated various factors and mechanisms influencing typhoon tracks. For example, ref. [4] examined typhoons with ‘deflecting tracks’ near Taiwan, while [18] conducted idealized simulations to study the effect of terrain on typhoon tracks under different intensities of steering flow.
  • Incorporating model insights into ensemble forecasting techniques: The model can provide valuable information for ensemble forecasting systems, allowing for a more comprehensive assessment of potential track scenarios and their associated uncertainties [48,49].
  • Exploring the role of additional factors: Future studies can investigate the influence of other factors, such as atmospheric conditions and vortex structure, on track deflections [13,16,34,45,46,48].
  • Expanding model application to other regions: The model can be applied to other regions with complex terrain to further validate its performance and contribute to improved typhoon track prediction worldwide [17,25,27].
  • Real-world model validation and future applications: The successful application of the model to Typhoon Soudelor provides a strong foundation for future research and development. The model’s ability to capture the key features of Soudelor’s track, including the southward deflection and subsequent northwestward turn, highlights its potential for real-time forecasting applications. Future studies should focus on refining the model by incorporating more complex physical processes, such as terrain friction and diabatic effects, to further improve its accuracy, particularly in regions of high terrain. Furthermore, applying the model to other typhoon cases and geographical locations with complex terrain will provide valuable insights into its broader applicability and contribute to the development of more robust and geographically diverse typhoon track prediction systems.
  • This study’s model can serve as a foundational tool for ensemble forecasting and real-time applications, particularly for regions with complex terrain. The success in replicating Soudelor’s track highlights the potential for further validation in diverse geographical regions with similar topographical challenges, as suggested by other studies [11,21] that discuss terrain-sensitive vortex behavior and underscore the need for accurate terrain representation in track forecasting models.
The development of a dynamic model based on potential vorticity conservation is a significant contribution to the field, as it provides a robust framework for understanding the physical mechanisms driving track deflection. This approach aligns with the broader trend in typhoon research emphasizing the importance of potential vorticity dynamics in accurately predicting typhoon motion [28,50]. The findings are particularly relevant to operational forecasting and disaster preparedness, especially in regions like Taiwan, where topography plays a significant role. Other studies, such as those by [9] and [11], have also investigated the influence of terrain on typhoon tracks, particularly near Taiwan, underscoring the significance of this topic.
To sum up, the development of a dynamic model based on PV conservation is a significant contribution to the field, as it provides a robust framework for understanding the physical mechanisms driving track deflection. This approach aligns with the broader trend in typhoon research emphasizing the importance of PV dynamics in accurately predicting typhoon motion [28,50]. These findings are particularly relevant for operational forecasting and disaster preparedness, especially in regions like Taiwan where terrain plays a significant role.

Funding

This research was funded by the National Natural Science Foundation of China, under Grant No. 42275064.

Institutional Review Board Statement

Not applicable.

Informed Consent Statement

Not applicable.

Data Availability Statement

Data are unavailable due to privacy or ethical restrictions.

Acknowledgments

H.-C.C. would like to express his sincere gratitude to Chin-Chou Chu and Chien-Cheng Chang of the National Taiwan University for their invaluable guidance and support during the early stages of this research. The author is also deeply indebted to the late Shih-Ting Wang of the Central Weather Administration of Taiwan, whose extensive research on typhoons in Taiwan profoundly inspired this study. His work continues to influence the direction of this research. H.-C.C. also wishes to extend his appreciation to Kwan-Tun Lee of the National Taiwan Ocean University for his valuable insights and feedback. Finally, H.-C.C. expresses his thanks to Kenji Kawaike of the Disaster Prevention Research Institute at Kyoto University for hosting his research visit and facilitating academic exchanges, which greatly contributed to the successful completion of this manuscript.

Conflicts of Interest

The author declares no conflicts of interest.

References

  1. Kepert, J.D. Tropical Cyclone Structure and Dynamics. In World Scientific Series on Asia-Pacific Weather and Climate; World Scientific: Singapore, 2010; Volume 4, pp. 3–53. ISBN 978-981-4293-47-1. [Google Scholar]
  2. Lin, Y.-L. Mesoscale Dynamics, 1st ed.; Cambridge University Press: Cambridge, UK, 2007; ISBN 978-0-521-00484-8. [Google Scholar]
  3. Wu, C.-C.; Kuo, Y.-H. Typhoons Affecting Taiwan: Current Understanding and Future Challenges. Bull. Amer. Meteor. Soc. 1999, 80, 67–80. [Google Scholar] [CrossRef]
  4. Hsu, L.-H.; Su, S.-H.; Fovell, R.G.; Kuo, H.-C. On Typhoon Track Deflections near the East Coast of Taiwan. Mon. Wea. Rev. 2018, 146, 1495–1510. [Google Scholar] [CrossRef]
  5. Shieh, S.L.; Wang, S.T.; Cheng, M.D.; Yeh, T.C. Tropical Cyclone Tracks over Taiwan and Its Vicinity for the One Hundred Years 1897 to 1996; Central Weather Bureau: Taipei, Taiwan, 1998; p. 497. [Google Scholar]
  6. Wang, S.T. An Integrated Study of the Impact of the Orography in Taiwan on the Movement, Intensity, Structure, Wind and Rainfall Distribution of Invading Typhoons; Chinese National Science Council: Taipei, Taiwan, 1992; p. 285. [Google Scholar]
  7. Yeh, T.-C.; Elsberry, R.L. Interaction of Typhoons with the Taiwan Orography. Part I: Upstream Track Deflections. Mon. Wea. Rev. 1993, 121, 3193–3212. [Google Scholar] [CrossRef]
  8. Yeh, T.-C.; Elsberry, R.L. Interaction of Typhoons with the Taiwan Orography. Part II: Continuous and Discontinuous Tracks across the Island. Mon. Wea. Rev. 1993, 121, 3213–3233. [Google Scholar] [CrossRef]
  9. Jian, G.-J.; Teng, J.-H.; Wang, S.-T.; Cheng, M.-D.; Cheng, C.-P.; Chen, J.-H.; Chu, Y.-J. An Overview of the Tropical Cyclone Database at the Central Weather Bureau of Taiwan. Terr. Atmos. Ocean. Sci. 2022, 33, 26. [Google Scholar] [CrossRef]
  10. Peng, L.; Wang, S.-T.; Shieh, S.-L.; Cheng, M.-D.; Yeh, T.-C. Surface Track Discontinuity of Tropical Cyclones Crossing Taiwan: A Statistical Study. Mon. Weather. Rev. 2012, 140, 121–139. [Google Scholar] [CrossRef]
  11. Huang, K.-C.; Wu, C.-C. The Impact of Idealized Terrain on Upstream Tropical Cyclone Track. J. Atmos. Sci. 2018, 75, 3887–3910. [Google Scholar] [CrossRef]
  12. Huang, Y.-H.; Wu, C.-C.; Wang, Y. The Influence of Island Topography on Typhoon Track Deflection. Mon. Weather. Rev. 2011, 139, 1708–1727. [Google Scholar] [CrossRef]
  13. Gong, Y.; Li, Y.; Zhang, D.-L. A Statistical Study of Unusual Tracks of Tropical Cyclones near Taiwan Island. J. Appl. Meteorol. Climatol. 2018, 57, 193–206. [Google Scholar] [CrossRef]
  14. Lin, Y.-L.; Chen, S.-Y.; Hill, C.M.; Huang, C.-Y. Control Parameters for the Influence of a Mesoscale Mountain Range on Cyclone Track Continuity and Deflection. J. Atmos. Sci. 2005, 62, 1849–1866. [Google Scholar] [CrossRef]
  15. Liu, L.; Lin, Y.-L.; Chen, S.-H. Effects of Landfall Location and Approach Angle of an Idealized Tropical Cyclone over a Long Mountain Range. Front. Earth Sci. 2016, 4, 14. [Google Scholar] [CrossRef]
  16. Lin, Y.-L.; Savage, L.C. Effects of Landfall Location and the Approach Angle of a Cyclone Vortex Encountering a Mesoscale Mountain Range. J. Atmos. Sci. 2011, 68, 2095–2106. [Google Scholar] [CrossRef]
  17. Tang, C.K.; Chan, J.C.L. Idealized Simulations of the Effect of Taiwan and Philippines Topographies on Tropical Cyclone Tracks. Quart. J. Royal Meteoro. Soc. 2014, 140, 1578–1589. [Google Scholar] [CrossRef]
  18. Tang, C.K.; Chan, J.C.L. Idealized Simulations of the Effect of Taiwan Topography on the Tracks of Tropical Cyclones with Different Sizes. Quart. J. Royal Meteoro. Soc. 2016, 142, 793–804. [Google Scholar] [CrossRef]
  19. Hsu, L.-H.; Kuo, H.-C.; Fovell, R.G. On the Geographic Asymmetry of Typhoon Translation Speed across the Mountainous Island of Taiwan. J. Atmos. Sci. 2013, 70, 1006–1022. [Google Scholar] [CrossRef]
  20. Huang, C.-Y.; Chen, C.-A.; Chen, S.-H.; Nolan, D.S. On the Upstream Track Deflection of Tropical Cyclones Past a Mountain Range: Idealized Experiments. J. Atmos. Sci. 2016, 73, 3157–3180. [Google Scholar] [CrossRef]
  21. Lin, Y.-L.; Han, J.; Hamilton, D.W.; Huang, C.-Y. Orographic Influence on a Drifting Cyclone. J. Atmos. Sci. 1999, 56, 534–562. [Google Scholar] [CrossRef]
  22. Lin, Y.-L.; Chen, S.-H.; Liu, L. Orographic Influence on Basic Flow and Cyclone Circulation and Their Impacts on Track Deflection of an Idealized Tropical Cyclone. J. Atmos. Sci. 2016, 73, 3951–3974. [Google Scholar] [CrossRef]
  23. Yeh, T.-C.; Hsiao, L.-F.; Chen, D.-S.; Huang, K.-N. A Study on Terrain-Induced Tropical Cyclone Looping in East Taiwan: Case Study of Typhoon Haitang in 2005. Nat. Hazards 2012, 63, 1497–1514. [Google Scholar] [CrossRef]
  24. Wu, C.-C.; Li, T.-H.; Huang, Y.-H. Influence of Mesoscale Topography on Tropical Cyclone Tracks: Further Examination of the Channeling Effect. J. Atmos. Sci. 2015, 72, 3032–3050. [Google Scholar] [CrossRef]
  25. Bender, M.A.; Tuleya, R.E.; Kurihara, Y. A Numerical Study of the Effect of Island Terrain on Tropical Cyclones. Mon. Wea. Rev. 1987, 115, 130–155. [Google Scholar] [CrossRef]
  26. Lin, Y.-L.; Ensley, D.B.; Chiao, S.; Huang, C.-Y. Orographic Influences on Rainfall and Track Deflection Associated with the Passage of a Tropical Cyclone. Mon. Wea. Rev. 2002, 130, 2929–2950. [Google Scholar] [CrossRef]
  27. Wei-Jen Chang, S. The Orographic Effects Induced by an Island Mountain Range on Propagating Tropical Cyclones. Mon. Wea. Rev. 1982, 110, 1255–1270. [Google Scholar] [CrossRef]
  28. Chan, J.C.L.; Ko, F.M.F.; Lei, Y.M. Relationship between Potential Vorticity Tendency and Tropical Cyclone Motion. J. Atmos. Sci. 2002, 59, 1317–1336. [Google Scholar] [CrossRef]
  29. Schär, C.; Smith, R.B. Shallow-Water Flow Past Isolated Topography. Part II: Transition to Vortex Shedding. J. Atmos. Sci. 1993, 50, 1401–1412. [Google Scholar] [CrossRef]
  30. Adem, J. A Series Solution for the Barotropic Vorticity Equation and Its Application in the Study of Atmospheric Vortices. Tellus 1956, 8, 364–372. [Google Scholar] [CrossRef]
  31. Carnevale, G.F.; Kloosterziel, R.C.; Van Heijst, G.J.F. Propagation of Barotropic Vortices over Topography in a Rotating Tank. J. Fluid Mech. 1991, 233, 119–139. [Google Scholar] [CrossRef]
  32. Chan, J.C.L. The Physics of Tropical Cyclone motion. Annu. Rev. Fluid Mech. 2005, 37, 99–128. [Google Scholar] [CrossRef]
  33. Fiorino, M.; Elsberry, R.L. Some Aspects of Vortex Structure Related to Tropical Cyclone Motion. J. Atmos. Sci. 1989, 46, 975–990. [Google Scholar] [CrossRef]
  34. Chan, J.C.L.; Williams, R.T. Analytical and Numerical Studies of the Beta-Effect in Tropical Cyclone Motion. Part I: Zero Mean Flow. J. Atmos. Sci. 1987, 44, 1257–1265. [Google Scholar] [CrossRef]
  35. Holland, G.J. An Analytic Model of the Wind and Pressure Profiles in Hurricanes. Mon. Wea. Rev. 1980, 108, 1212–1218. [Google Scholar] [CrossRef]
  36. Brand, S.; Blelloch, J.W. Changes in the Characteristics of Typhoons Crossing the Island of Taiwan. Mon. Wea. Rev. 1974, 102, 708–713. [Google Scholar] [CrossRef]
  37. Chen, H.-C. Interaction of Barotropic Vortices over Topography Based on Similarity Laws: Rotating Tank Experiment and Shallow-Water Simulation. Arab. J. Geosci. 2022, 15, 276. [Google Scholar] [CrossRef]
  38. Chen, H.-C.; Chu, C.-C.; Chang, C.-C. A Dynamic Model for Strong Vortices over Topography on a β Plane. In Advances in Engineering Mechanics—Reflections and Outlooks; World Scientific: Vancouver, BC, Canada, 2005; pp. 669–680. [Google Scholar]
  39. Chen, H.-C. Sensitivity Analysis of Strong Cyclone Track Deflection over Isolated Topography: Exploring the Impact of Vortex Impinging Direction and Strength. In Proceedings of the ECAS 2023, Online, 15–30 October 2023; MDPI: Basel, Switzerland, 2023; p. 1. [Google Scholar]
  40. Kuo, H.-C.; Williams, R.T.; Chen, J.-H.; Chen, Y.-L. Topographic Effects on Barotropic Vortex Motion: No Mean Flow. J. Atmos. Sci. 2001, 58, 1310–1327. [Google Scholar] [CrossRef]
  41. Chen, H.-C.; Leu, J.-H.; Liu, Y.; Xie, H.-S.; Chen, Q. A Validated Study of a Modified Shallow Water Model for Strong Cyclonic Motions and Their Structures in a Rotating Tank. Math. Probl. Eng. 2021, 2021, 5529601. [Google Scholar] [CrossRef]
  42. Masuda, A.; Marubayashi, K.; Ishibashi, M. A Laboratory Experiment and Numerical Simulation of an Isolated Barotropic Eddy in a Basin with Topographic β. J. Fluid Mech. 1990, 213, 641. [Google Scholar] [CrossRef]
  43. Chen, H.-C.; Leu, J.-H.; Lin, Y.-L.; Liu, H.-P.; Huang, C.-L.; Chen, H.-S.; Lan, T.-S. Cyclonic Motion and Structure in Rotating Tank: Experiment and Theoretical Analysis. Sens. Mater. 2021, 33, 2385. [Google Scholar] [CrossRef]
  44. Pedlosky, J. Geophysical Fluid Dynamics; Springer New York: New York, NY, USA, 1987; ISBN 978-0-387-96387-7. [Google Scholar]
  45. Chan, J.C.L. Physical Mechanisms Responsible for Track Changes and Rainfall Distributions Associated with Tropical Cyclone Landfall. In Oxford Handbook Topics in Physical Sciences; Oxford Handbooks Editorial Board, Ed.; Oxford University Press: Oxford, UK, 2017; ISBN 978-0-19-069942-0. [Google Scholar]
  46. Chan, J.C.L.; Kepert, J.D. Global Perspectives on Tropical Cyclones: From Science to Mitigation. In World Scientific Series on Asia-Pacific Weather and Climate; World Scientific: Singapore, 2010; Volume 4, ISBN 978-981-4293-47-1. [Google Scholar]
  47. Takagi, H.; Wu, W. Maximum Wind Radius Estimated by the 50 Kt Radius: Improvement of Storm Surge Forecasting over the Western North Pacific. Nat. Hazards Earth Syst. Sci. 2016, 16, 705–717. [Google Scholar] [CrossRef]
  48. Lin, Y.-F.; Wu, C.-C.; Yen, T.-H.; Huang, Y.-H. Typhoon Fanapi (2010) and Its Interaction with Taiwan Terrain—Evaluation of the Uncertainty in Track, Intensity and Rainfall Simulations. J. Meteorol. Soc. Jpn. Ser. II 2020, 98, 93–113. [Google Scholar] [CrossRef]
  49. Wu, C.-C.; Lien, G.-Y.; Chen, J.-H.; Zhang, F. Assimilation of Tropical Cyclone Track and Structure Based on the Ensemble Kalman Filter (EnKF). J. Atmos. Sci. 2010, 67, 3806–3822. [Google Scholar] [CrossRef]
  50. Wu, L.; Wang, B. A Potential Vorticity Tendency Diagnostic Approach for Tropical Cyclone Motion. Mon. Wea. Rev. 2000, 128, 1899–1911. [Google Scholar] [CrossRef]
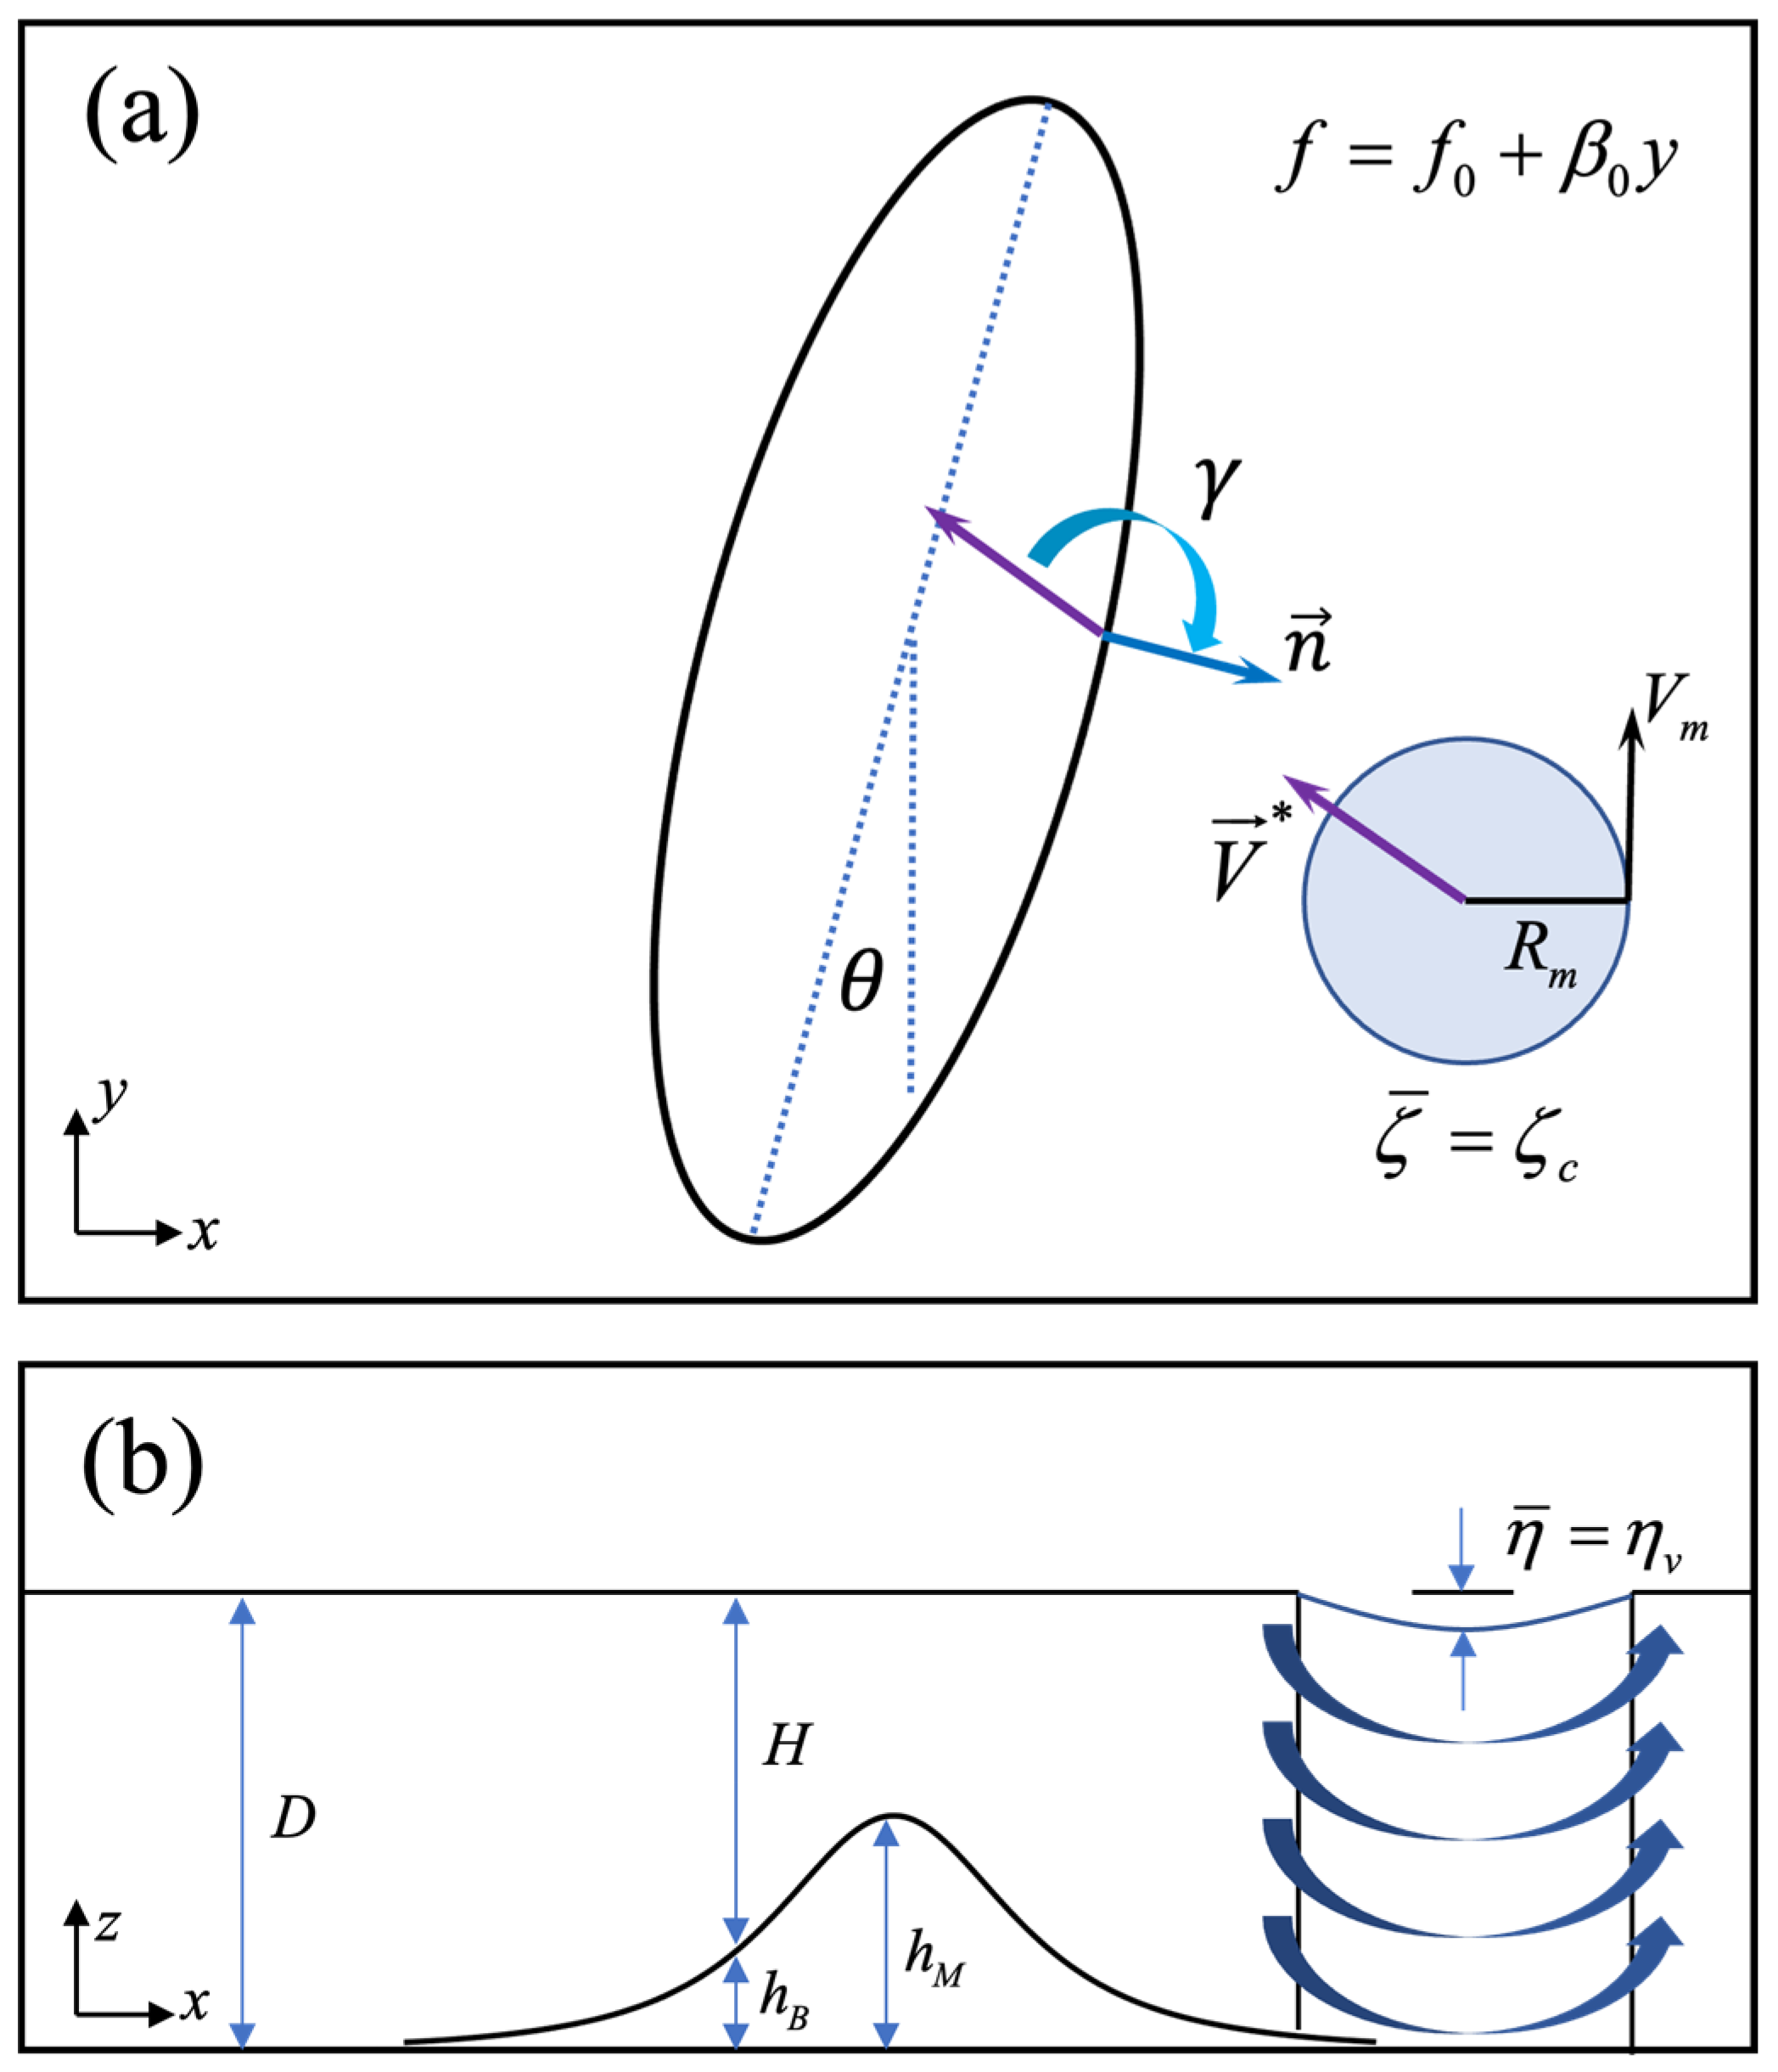
Figure 1. Schematic of the dynamic model that illustrates the interaction between a cyclonic vortex and isolated topography. (a) The vortex approaches the terrain at an impinging angle γ . The vortex has a radius of maximum winds R m and a maximum azimuthal velocity V m , interacting with a bell-shaped mountain of maximum height h M and base height h B . (b) Cross-sectional profile of the topography along the vortex path. D represents the unperturbed fluid depth, and H is the total fluid depth accounting for topography and surface effects. η v denotes the maximum free surface depression caused by the vortex. θ is the inclined angle of topography.
Atmosphere 15 01372 g001
Figure 2. (a) The 3D bell-shaped mountain’s topography shows the latitudinal cross sections AA’ to EE’. Solid contour lines represent 100-m intervals, whereas dashed lines mark 1000-m elevations. (b) Cross-sectional topographic profiles along each of the five latitudes. These profiles illustrate the steep elevation of the CMR, peaking above 3000 m, with the highest elevations near the CC’ and DD’ sections, showing strong variation in terrain across the island.
Atmosphere 15 01372 g002
Figure 3. Tracks of vortex M passing over isolated topography for different impinging angles: (a) 195°, (b) 170°, (c) 145°, and (d) 120°. The corresponding track deflections (δ) are also shown. Numbers 1–12 represent the name of cases, respectively. The dashed lines represent the tracks and deflections for the northern landfall cases (1, 4, 7, and 10). The solid lines show the tracks and deflections for the central landfall cases (2, 5, 8, and 11). The dashed-dotted lines correspond to the tracks and deflections for the southern landfall cases (3, 6, 9, and 12).
Atmosphere 15 01372 g003
Figure 4. (a) Topography of Taiwan: Contour lines representing elevations of 100 m (solid lines) and 1000 m (dashed lines) are shown. Five latitudinal cross-sections (AA’, BB’, CC’, DD’, and EE’) are marked. (b) Elevational profiles: Topographic profiles along the five cross-sections indicated in panel (a) are displayed.
Atmosphere 15 01372 g004
Figure 5. Simulated tracks (scanned trajectories) of vortices interacting with the realistic topography of Taiwan at varying initial latitudes but fixed impinging angles. Each panel represents a different vortex central relative vorticity ( ζ c ): (a) S1 ( 2 × 10 4 s 1 ), (b) S2 ( 4 × 10 4 s 1 ), (c) S3 ( 6 × 10 4 s 1 ). The impinging angle (γ) for the panels (ac) is 195°. Panels (df) use the same vortex intensities as (ac), respectively, but with an impinging angle of 170°. Numbers 1–5 are scanned tracks of vortices impinging from north to south latitudes. S1, S2 and S3 are names of vortices.
Atmosphere 15 01372 g005
Figure 6. The figure is similar to Figure 5 but illustrates tracks for shallower impinging angles. Panels (ac) display the tracks for vortices S1, S2, and S3, respectively, with a fixed impinging angle of 145°. Panels (df) present the corresponding tracks for the same vortices, but with an impinging angle of 120°. Numbers 1-5 are scanned tracks of vortices impinging from north to south latitudes. S1, S2 and S3 are names of vortices.
Atmosphere 15 01372 g006
Figure 7. Comparison of the dynamic model’s simulated track with the observed track of Typhoon Soudelor (2015). (a) Simulated track (red solid line) and observed typhoon center positions (open pink stars) overlaid on the topography of Taiwan. (b) Elevational profile (black solid line) along the simulated track and the corresponding track deflection (red solid line). Track deflection is defined as the southward deviation of the simulated track from a straight westward path.
Atmosphere 15 01372 g007
Table 1. Key Mechanisms of track deflection for typhoon–topography interactions. The table summarizes the principal mechanisms affecting typhoon track deflections due to complex topography, particularly Taiwan’s CMR. Mechanisms include orographic blocking, channeling effects, topographic beta drift, and cyclonic looping, with studies employing observational analysis, numerical simulations, idealized models, and laboratory experiments.
MechanismDescriptionResearch MethodKey References
Orographic BlockingOccurs when mountain ranges, like Taiwan’s Central Mountain Range, block a typhoon’s lower-level flow, leading to track deflections or slowed movement. Factors such as cyclone intensity, approach angle, and mountain height affect the degree of deflection, with frequent northward or southward shifts observed.Observational analysis, numerical simulations, idealized modeling, laboratory experiments[4,7,21,37]
Channeling EffectDescribes the acceleration of low-level winds as they are funneled through narrow valleys or gaps between the typhoon center and mountainous terrain, such as Taiwan’s Central Mountain Range. This effect creates a northerly jet on the terrain-facing side of the cyclone, which can influence track deflection, especially contributing to a southward movement as the cyclone approaches the terrain.Observational studies, idealized modeling[12,24]
Topographic Beta DriftBased on the “local northwest rule” observed in laboratory and numerical studies, topographic beta drift describes how cyclonic vortices tend to drift northwestward when moving over sloping terrain. This drift resembles the planetary beta effect, with the cyclone exhibiting clockwise movement as it ascends windward slopes and descends leeward slopes.Laboratory experiments, numerical simulations, theoretical models[32,37,38,39,40]
Vortex Intensity and StructureCyclone intensity and structural features, such as core definition and wind radius, affect topographic interactions. Stronger, well-structured cyclones experience more pronounced deflections, often displaying asymmetric flow changes when interacting with terrain like Taiwan’s Central Mountain Range.Idealized simulations, real-case simulations, sensitivity experiments[12,17,18,19,25,26,27]
Impinging AngleThe angle of a typhoon’s approach to terrain affects track deflection. Shallow angles lead to prolonged interactions and greater deflection, often southward, while steeper angles result in less deviation.Idealized models, real-case simulations, sensitivity studies[15,16,24,27,28,29]
Terrain-induced Vorticity Effect/Loop EffectWhen a cyclone encounters mountainous terrain, it generates additional vorticity due to slopes and irregular topography. This added vorticity can alter the cyclone’s path, often causing deflection or looping near the terrain, as seen around Taiwan’s Central Mountain Range.Laboratory experiments, numerical simulations, observational analysis[12,21,22,23,32,37,41]
Laboratory ExperimentsLaboratory experiments use rotating tanks to simulate cyclonic interactions with terrain, showing predictable deflections. Vortices exhibit clockwise ascent on windward slopes and descent on leeward sides, aligning with the “local northwest rule” for topographic influence.Rotating tank experiments; numerical simulations[32,37,41,42,43]
Table 2. Simulation parameters for vortex tracks over topography. The table displays the vortex intensity ( R o v ζ c * ), maximum wind speed ( V m ), radius of maximum wind ( R m ), vortex Rossby number ( R o v ), planetary Beta number ( β 0 * ), topographic Beta number ( β B * ), the ratio of β B * and β 0 * ( β B * / β 0 * ), topographic adjusting parameter (α), and impinging angle (γ) for various simulated scenarios. Figures correspond to specific sections within the manuscript.
FigureVortex V m   ( m s 1 ) R m ( k m ) ζ c ( s 1 ) R o v R o v ζ c * β B * β 0 * β B * / β 0 * α γ ( ° )
3(a)M301500.00043.77.30.0820.0165.1542.8195
3(b)M301500.00043.77.30.0820.0165.1542.8170
3(c)M301500.00043.77.30.0820.0165.1542.8145
3(d)M301500.00043.77.30.0820.0165.1542.8125
5(a)S1202000.00021.83.70.1640.0433.8618.0195
5(b)S2301500.00043.77.30.0820.0165.1542.8195
5(c)S3301000.00065.511.00.0550.0077.7292.4195
5(d)S1202000.00021.83.70.1640.0433.8618.0170
5(e)S2301500.00043.77.30.0820.0165.1542.8170
5(f)S3301000.00065.511.00.0550.0077.7292.4170
6(a)S1202000.00021.83.70.1640.0433.8618.0145
6(b)S2301500.00043.77.30.0820.0165.1542.8145
6(c)S3301000.00065.511.00.0550.0077.7292.4145
6(d)S1202000.00021.83.70.1640.0433.8618.0120
6(e)S2301500.00043.77.30.0820.0165.1542.8120
6(f)S3301000.00065.511.00.0550.0077.7292.4120
7Typhoon Soudelor153000.00420.976.80.4270.1283.35260.3175
For comparison, all parameters are calculated with reference to a latitude of 22° N.
Disclaimer/Publisher’s Note: The statements, opinions and data contained in all publications are solely those of the individual author(s) and contributor(s) and not of MDPI and/or the editor(s). MDPI and/or the editor(s) disclaim responsibility for any injury to people or property resulting from any ideas, methods, instructions or products referred to in the content.