Article

Simulated Directional Wave Spectra of the Wind Sea and Swell under Typhoon Mangkhut

1
South China Institute of Environmental Sciences, Guangzhou 510655, China
2
Guangzhou Marine Geological Survey, Guangzhou 511458, China
3
School of Marine Sciences, Sun Yat-sen University, Guangzhou 510275, China
4
Southern Marine Science and Engineering Guangdong Laboratory (Zhuhai), Guangzhou 510275, China
*
Author to whom correspondence should be addressed.
Atmosphere 2024, 15(10), 1174; https://doi.org/10.3390/atmos15101174
Submission received: 27 August 2024 / Revised: 23 September 2024 / Accepted: 27 September 2024 / Published: 30 September 2024
(This article belongs to the Special Issue Typhoon/Hurricane Dynamics and Prediction (2nd Edition))

Abstract

:
A third-generation wave model is driven by the synthetic wind field combined with the revised Holland wind and surface wind product from the National Centers for Environmental Prediction (NCEP). The temporal and spatial characteristics of the wind waves and swell during the typhoon are studied, as well as the responses of their wave energy spectra to the source terms. The results show that the typhoon waves have a more complicated asymmetric structure than the wind field, and the maximum significant wave height is always located on the right side of the direction along which the typhoon is moving, where wind waves are dominant, due to the extended fetch. The nonlinear wave–wave interaction helps to redistribute the energy of the wind seas at a high frequency to the remotely generated swells at a low frequency, ensuring that the typhoon wave’s energy spectrum remains unimodal. This process occurs in regions without extended fetch, and a similar continued downshift in frequency as the wave–wave interaction occurs for the wind input as well when the waves outrun the typhoon, due to the nonlinear coupling between the wind and growing swells.

1. Introduction

Tropical cyclones are extreme meteorological events that can generate complex and disastrous ocean waves propagating toward shorelines. This can destroy port and coastal structures and threaten marine transportation and aquaculture. Therefore, studying the characteristics and evolution of waves induced by tropical cyclones is significant for wave forecasts, port transportation, disaster prevention, and coastal engineering protection.
The first deployment of wave buoys in tropical cyclone wave observations dates back to the 1970s and was carried out by the US National Oceanic and Atmosphere Administration (NOAA)’s National Data Buoy Center [1]. Subsequently, with the breakthroughs of satellite- and aircraft-based technology, in situ and remotely sensed tropical cyclone generated wave data could be accessed. A series of parameterized and statistical methods, such as artificial neural networks and auto-regressive methods, were then established for TW prediction [2,3,4,5]. However, earlier parameterization and statistics based on historical wave data often ignore the dynamic mechanisms of tropical cyclones and cannot effectively describe the characteristics of the swell far from the central area of the typhoon. As an alternative, fetch-limited scaling, which takes the mechanism of sea-wave generation into account, can be used in defining the wave field, but it requires a large amount of data to obtain the equivalent fetch [6,7,8].
Numerical simulations are an important method that is widely used for tropical cyclone wave research and forecasting [9,10]. Numerical wave models have reached the third generation, with models such as SWAN, WAM, and WAVEWATCH III. These solve the directional frequency wave action spectrum by parameterizing the source terms, such as wave growth by wind, nonlinear wave–wave interaction, and wave dissipation, which are crucial in the open sea. The MIKE21 SW used in this paper is also a third-generation spectral wave model based on non-structural grids, which is well adjusted to the topography of the study area [11], and the model performs as well as SWAN [12]. Many studies have used MIKE21 SW to investigate the wave characteristics generated by a tropical cyclone, where the waves are either driven by parametric vortex models or the numerically reanalyzed wind field, with some considering a combination of the two [13,14,15]. The accuracy of tropical cyclone wave models depends significantly on the input wind field. Xu et al. [16] used the reanalysis NCEP wind in SWAN to simulate the ocean surface waves, finding that the accuracy of the wave model could be enhanced by introducing swell and Stokes drift feedback to the input wind. Parametric vortex models represent one of the most common methods to determine the wind field [17,18,19,20,21]. Semiempirical vortex models that contain a small number of parameters can be used to describe the main characteristics of tropical cyclones [7,8]. As research deepens, asymmetry has gradually been introduced into the calculation of tropical cyclone vortices [22,23,24,25]. This paper utilizes a synthetic wind field combined with the revised Holland et al. [20] (hereafter H10) wind model and the NCEP surface wind product to drive the wave model, where the central area and far-field wind speeds of the tropical cyclone can both be considered.
Numerous previous studies have provided information on the distribution of the directional wave spectra under tropical cyclone conditions [7,26,27,28,29,30], where the concept of the “extended” or “trapped” fetch proposed by King and Shemdin [31] is adopted. This concept states that, to the right of the tropical cyclone, the wave direction approximately aligns with the direction of propagation of the tropical cyclone. As a result, the waves propagate forward with the tropical cyclone and hence remain within the intense wind region for an extended period. However, the waves will always tend to downshift in frequency and outrun the tropical cyclone, with the exception of very fast-moving storm systems due to the nonlinear process [7]. Such nonlinear interactions contribute to the shape stabilization of the directional wave spectra of the tropical cyclone, rather than the wind input and wave dissipation, while the latter two functions are important in determining the total energy [27]. The wave spectra will maintain a unimodal distribution within eight times the radius of the maximum wind speed from the storm center [32]. This is because the nonlinear wave–wave interactions result in a cascade of energy from the wind sea to the remotely generated spectral peak [30]. However, further exploration is needed to determine the conditions under which this energy cascade occurs. Therefore, we aim to provide more detailed information via numerical simulations on how the source terms, especially the nonlinear interaction, affect the wind wave and swell energy, as well as their induction mechanisms.
Typhoon Mangkhut was the most powerful and catastrophic tropical cyclone in China, occurring in 2018. It hit the Philippines and, subsequently, the coast of Guangdong Province in China, causing roughly USD 3.77 billion in damage. Due to its widespread devastation, the name Mangkhut was abandoned by the World Meteorological Organization (WMO) in 2019. Because of its long duration, huge waves, and severe effects, many scholars have used it as an example to study the wave-induced Stokes drift, storm surge, and impacts on the marine environment, such as the sea surface temperature [33,34,35]. Two in situ THW1-1 gravity-type wave buoys deployed in the northern South China Sea (SCS) by the Guangzhou Marine Geological Survey observed the wave changes during Mangkhut. Therefore, taking Mangkhut as an example, a typhoon wave (TW) model is established. A description of the wave model and synthetic typhoon wind field is given in Section 2. The results of the modeled temporal and spatial distributions of the wind sea and swell are presented in Section 3, while the wave spectra and source terms are further investigated, followed by conclusions in Section 4.

2. Materials and Methods

The TWs were modeled using the MIKE21 SW module. This model is based on the wave action conservation equation and uses the wave action density N (σ, θ) as the control variable to describe the waves. The independent variables of the model are the relative wave frequency σ (Hz) and wave direction θ (°). The relationship between the wave function density and wave energy spectral density E (σ, θ) is
N (σ, θ) = E (σ, θ)/σ
In the spherical coordinate system, the governing equation—that is, the conservation equation of wave action—can be expressed as [36,37]
N t + c λ N λ + c o s 1 φ c φ c o s φ N φ + c σ N σ + c θ N θ = S t o t σ
where t represents time (s), λ is longitude (°), φ is latitude (°), and c λ , c φ , c σ , and c θ represent the propagation velocity of the wave interaction density (m2/s) in the λ, φ, σ, and θ spaces, respectively, which are all calculated using linear wave theory. S t o t represents the source and sink terms expressed in terms of the energy density, including many physical processes, such as the wind energy input, seafloor friction, whitecapping, wave breaking, and wave–wave nonlinear interactions. In deep water, the right-hand side of Equation (2) is dominated by three terms, S t o t S i n + S n l + S d s (as input by wind, four wave nonlinear interactions, and dissipation, respectively).
The wind input Sin represents the generation of energy by wind and is calculated as
S i n f , θ = m a x   ( α , γ E f , θ )
where α represents the linear growth of the wind and is obtained following the approach of Ris [38]. For young wind seas, most of the stress is determined by momentum transfer from wind to waves, whereas, for old seas, there is hardly any coupling. As a consequence, the nonlinear growth rate γ of waves by wind depends on the sea’s state to some degree, and its description is based on the work of Janssen [39]. The waves continue to grow under the sustained function of wind. When the wave steepness reaches a certain level, the waves break, generating whitecap dissipation. The formula of Sds was originally proposed by Hasselmann [40] and has been continually modified and improved [36,41]. The third generation of the wave model generally uses the discrete interaction approximation (DIA) method to find parametric solutions to Snl [42]. The mathematical expression for Snl in MIKE21 SW is taken from Komen et al. [36].
Due to the large difference between the mechanism of wind waves and swells and their external performance characteristics, we used a 2D method to separate the two wave systems. This method is based on the wind–wave energy transfer relationship proposed by Komen et al. [43]. The swell wave components are defined as those components fulfilling the following wave-age based criterion:
U 10 c   c o s ( θ p θ w ) < 0.83
where U 10 is the wind speed of 10 m, c is the wave phase velocity, θ p is the wave propagation direction, and θ w is the wind direction.

2.1. Construction of the Typhoon Wind Field

Observing the wind speed during a typhoon across the whole area is not easy. At present, the typhoon pressure field is calculated based on the principle of a universal wind gradient, using a theoretical pressure or empirical model. This paper uses the common typhoon wind field model proposed by Holland et al. [20]. Based on the work of Schloemer [44], a modified rectangular hyperbola of the following form was proposed by Holland (1980) [17]:
P s r = P c + P · e ( R / r ) b s
where P s is the surface pressure (hPa) at a distance r from the typhoon center; P c is the central pressure of the typhoon (hPa); P = P n P c is the central pressure drop (hPa) from ambient pressure (generally 1013 hPa); R is the maximum wind speed radius (km) of the typhoon; the exponent b s is a scaling parameter that determines the proportion of the pressure gradient near the maximum wind radius. Holland et al. [20] represented the cyclostrophic wind speed V H as
V H r = [ 100 b s P ( R / r ) b s ρ a e ( R / r ) b s ] x  
where ρ a is the density of air (1.29 kg/m3). The equation for exponent b s [20] is as follows:
b s = 4.4 × 10 5 P 2 + 0.01 P + 0.03 P t 0.014 φ + 0.15 V f m x a + 1.0
where φ is the latitude (°) of the typhoon center; V f m is the translating velocity of the typhoon center (m/s); and P / t indicates the temporal intensity change in units of hPa h−1. According to Holland et al. [20], allowing x to vary with the radius can reproduce both the core and external wind structures of typhoons. The exponent x a = 0.6 ( 1 P / 215 ) , and the exponent x can be expressed as
x ( r ) = 0.5 0.5 + ( r R ) x ( r n ) 0.5 r n R
An adjusted exponent x ( r n ) is introduced to fit the peripheral observation at radius r n . Asymmetry, following Xie et al. [22] and Tamizi et al. [25], is considered by adding half the vector of V f m to the vortex, since the H10 wind fields defined by Equations (5)–(8) above are symmetric, which obviously does not correspond to the reality.
To solve Equations (5)–(8) above, the following data are required: the central pressure, the radius of the maximum winds, and the cyclone translation speed. The data are derived from the typhoon’s best track published by the China Meteorological Administration. The passage of Mangkhut is shown in Figure 1, where W1808 and W1809 are the wave buoy positions deployed (marked as a solid triangle). Unfortunately, the W1809 data transfer was terminated on September 10 because the buoy was damaged for unknown reasons.
The H10 wind field model has been widely used to determine the surface wind for tropical cyclones. Compared with the other common parametric wind field models, it produces the best agreement with observations [45]. Nonetheless, no background flow is considered in the model, which leads to the underestimation of the peripheral wind [7,8]. To address this issue, the typhoon wind field calculated by Holland’s theoretical model and the NCEP sea surface wind field data were superimposed with a certain weight coefficient. The NCEP sea surface wind field data have a time interval of 6 h and a horizontal resolution of 0.5° × 0.5° at the height of 10 m above sea level, and they can be downloaded from https://rda.ucar.edu/datasets/ds094-0/ accessed on 15 October 2018. In order to unify their resolution with the model grid and Holland wind field, they were interpolated to 0.1° × 0.1°. The weighting formula is as follows [46]:
V n e w = V H 1 e + e V n c e p
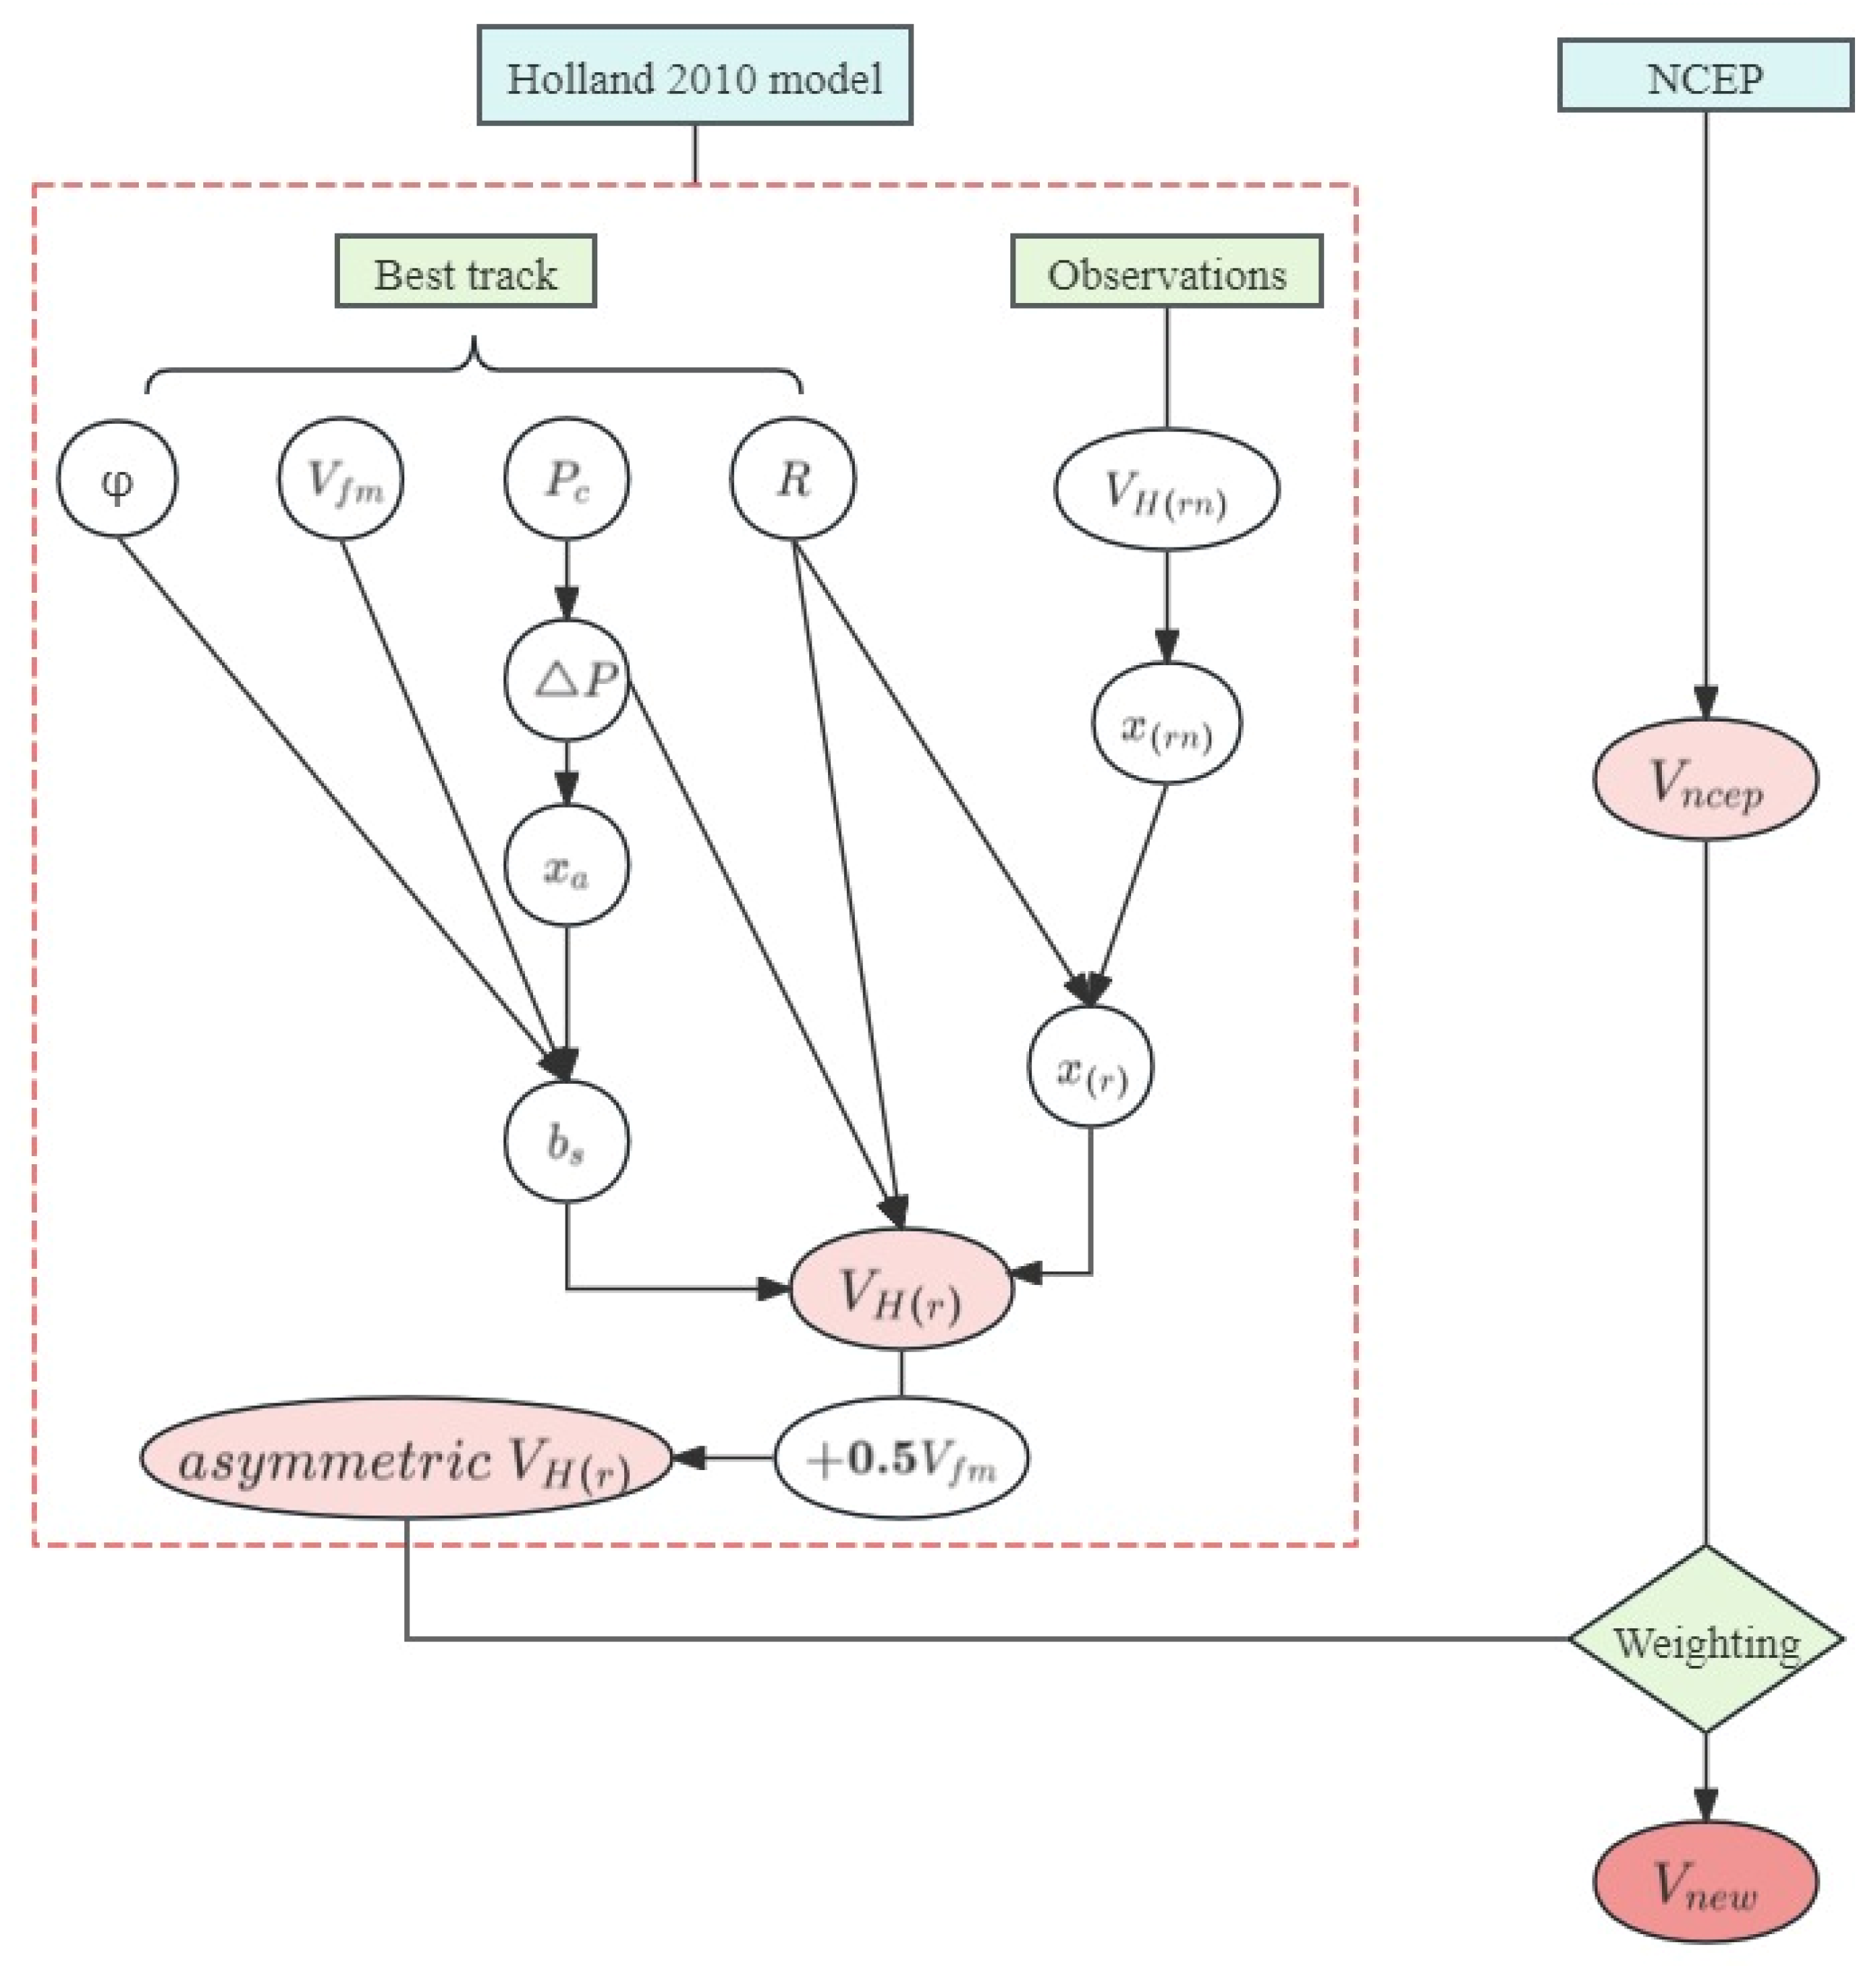
Parameter e is the weight coefficient calculated by e = C 4 / 1 + C 4 , where C represents the scope of the typhoon as C = r/(nR). The coefficient n is generally 9 or 10 [47]. In this paper, n takes a value of 9. The weight coefficient e varies with the distance from the calculation point to the typhoon center. This can ensure that the wind field calculated by the typhoon model is used near the typhoon, the NCEP wind field is used far from the typhoon center, and there is a smooth transition between both. The method of constructing an asymmetric synthetic wind field as described above can be summarized as in the conceptual diagram shown in Figure 2. This model is primarily based on the H10 wind field model. A new wind field was synthesized by introducing asymmetry and combining it with the NCEP wind field using certain weights.
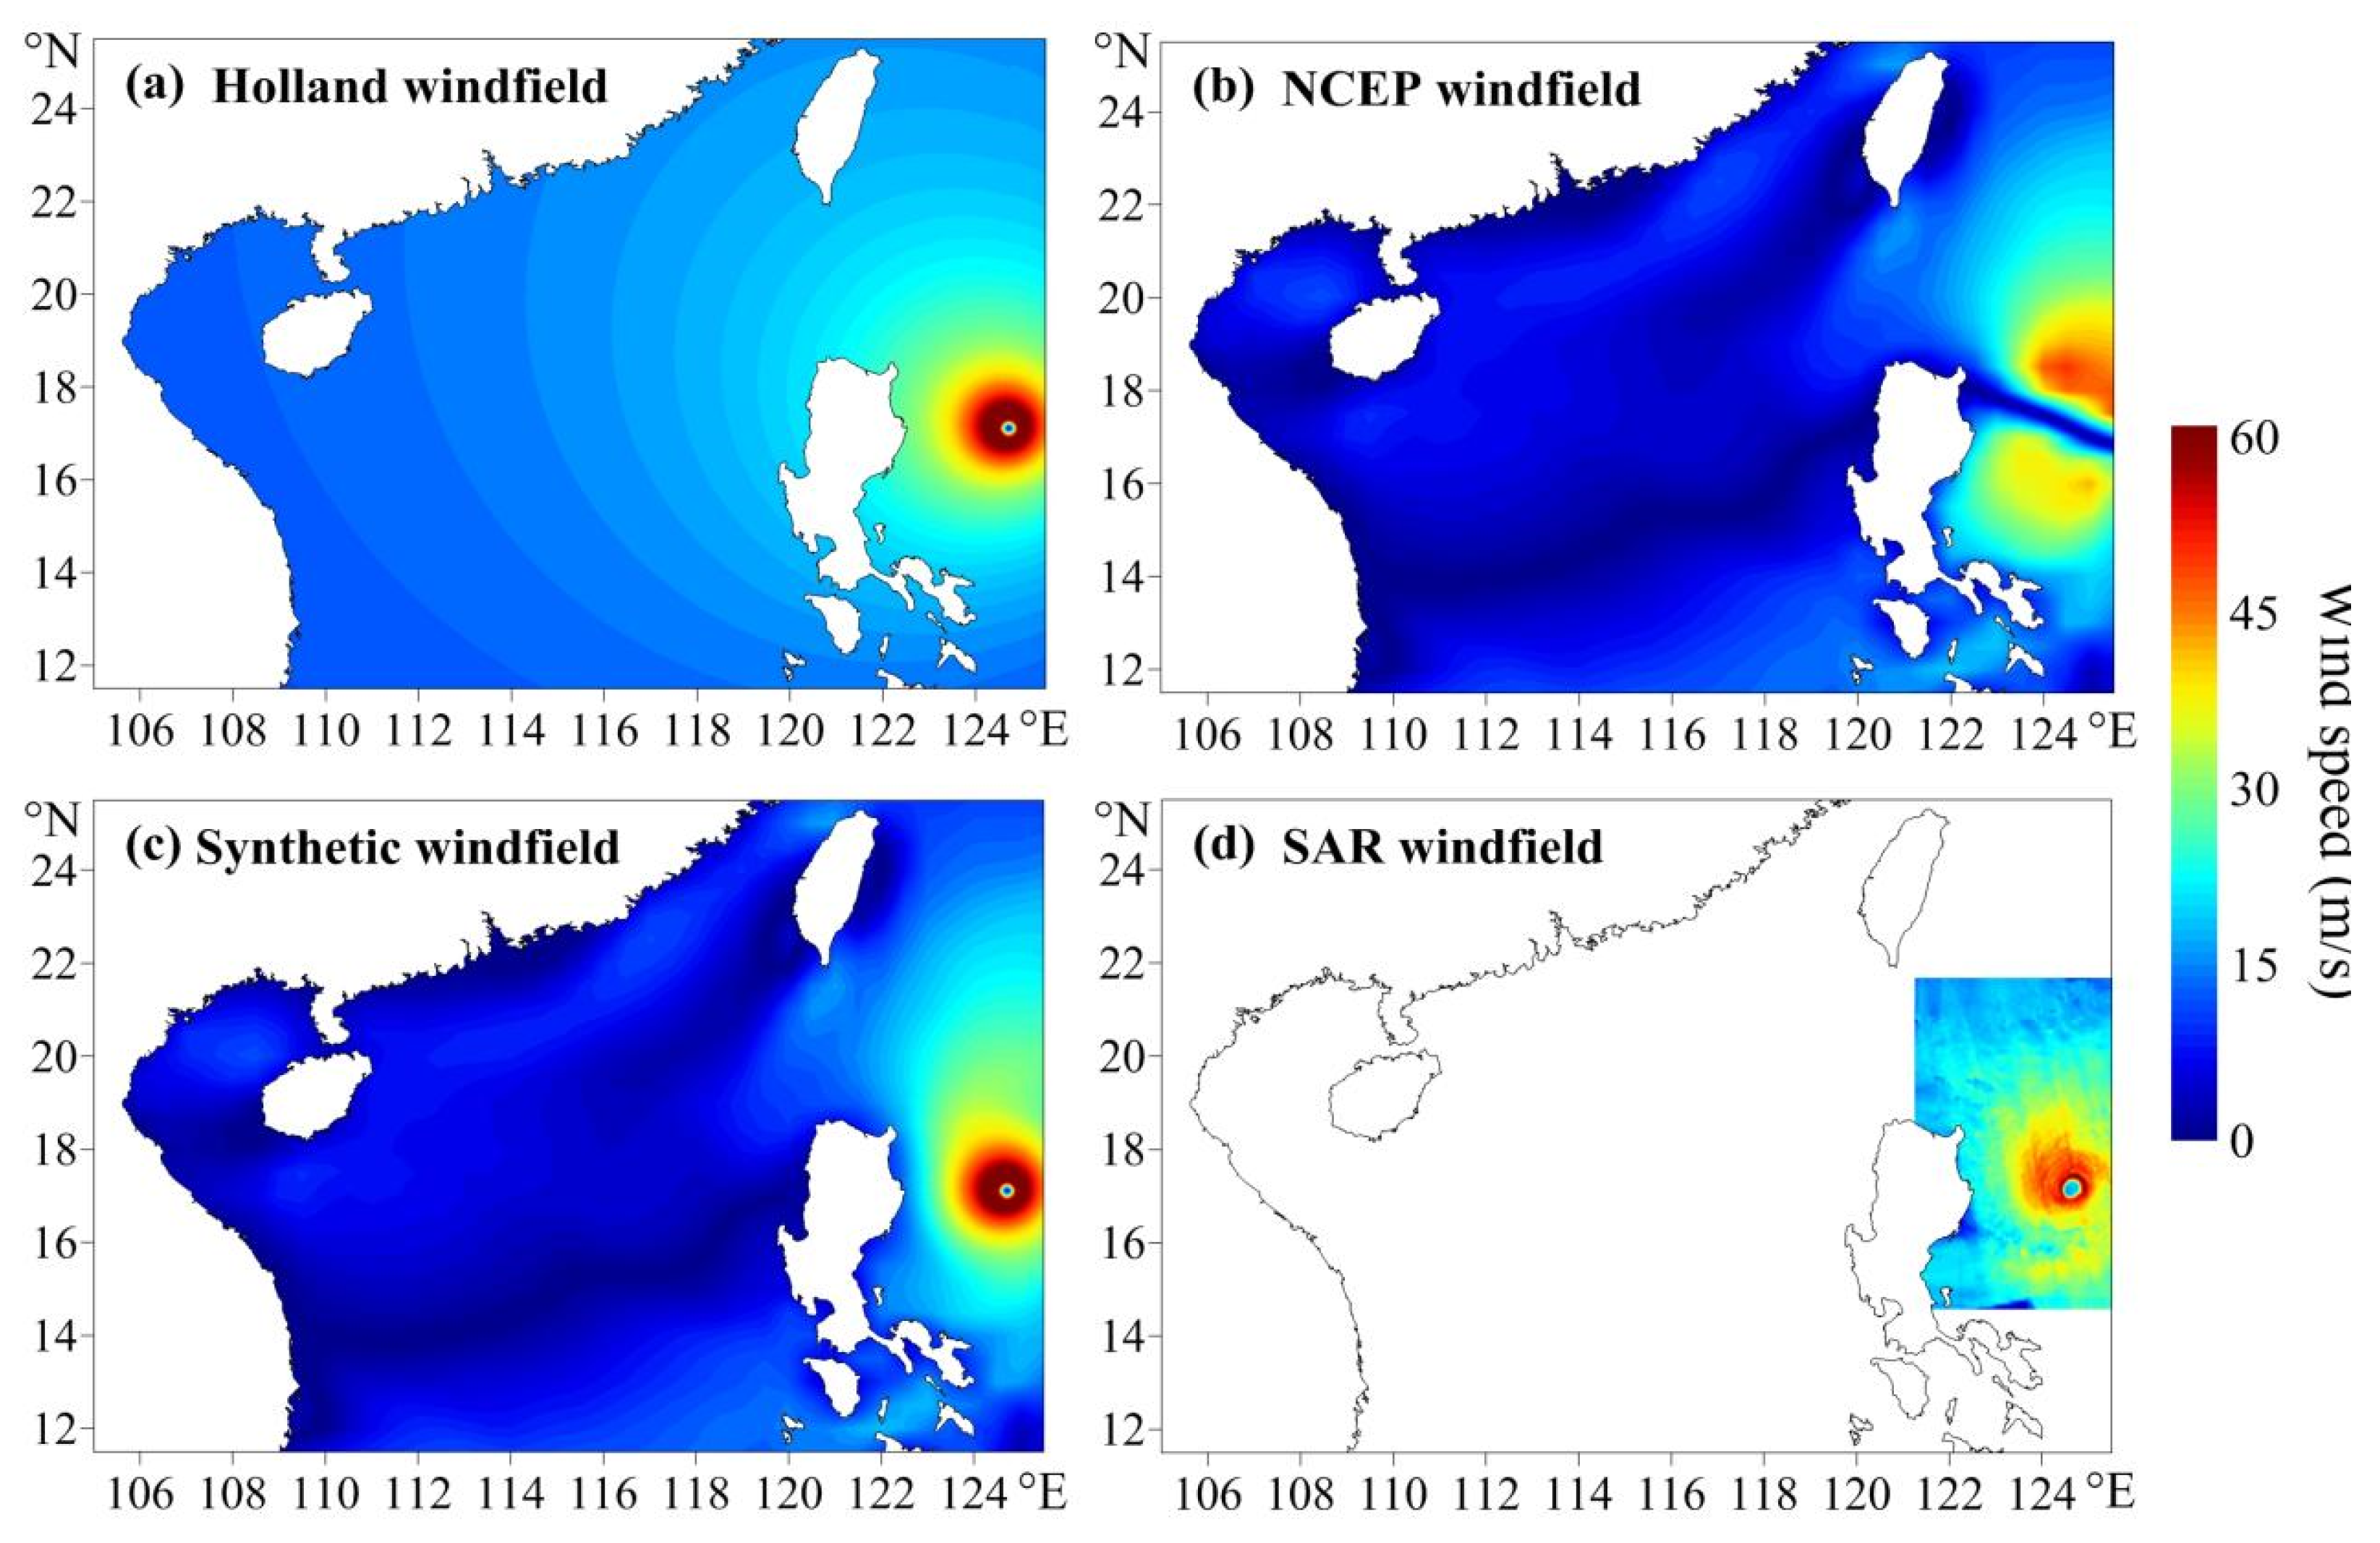
Snapshots of the revised H10 wind field, NCEP wind field, synthetic wind field, and satellite wind field are shown in Figure 3. The satellite wind field observed by synthetic aperture radar (SAR) was obtained from https://cyclobs.ifremer.fr/app/tropical accessed on 18 February 2024. The revised Holland wind field is spatially asymmetric, the strongest winds lie to the right of the translation vector, and the wind speed at the typhoon eye (i.e., r < R) is weaker than that at the periphery. The NCEP wind field near the typhoon center deviates greatly from the SAR observation, having a wider low-speed range in the direction of the translating typhoon. This is because the NCEP wind field, as well as the satellite wind field, is obtained through interpolation based on the six-hourly NCEP reanalysis data. Due to the low wind speed at the center and the fast movement speed of the typhoon, a low-speed band appears in Figure 3b. The synthetic wind field combines the characteristics of the two wind fields and has good consistency with the SAR satellite wind field data.
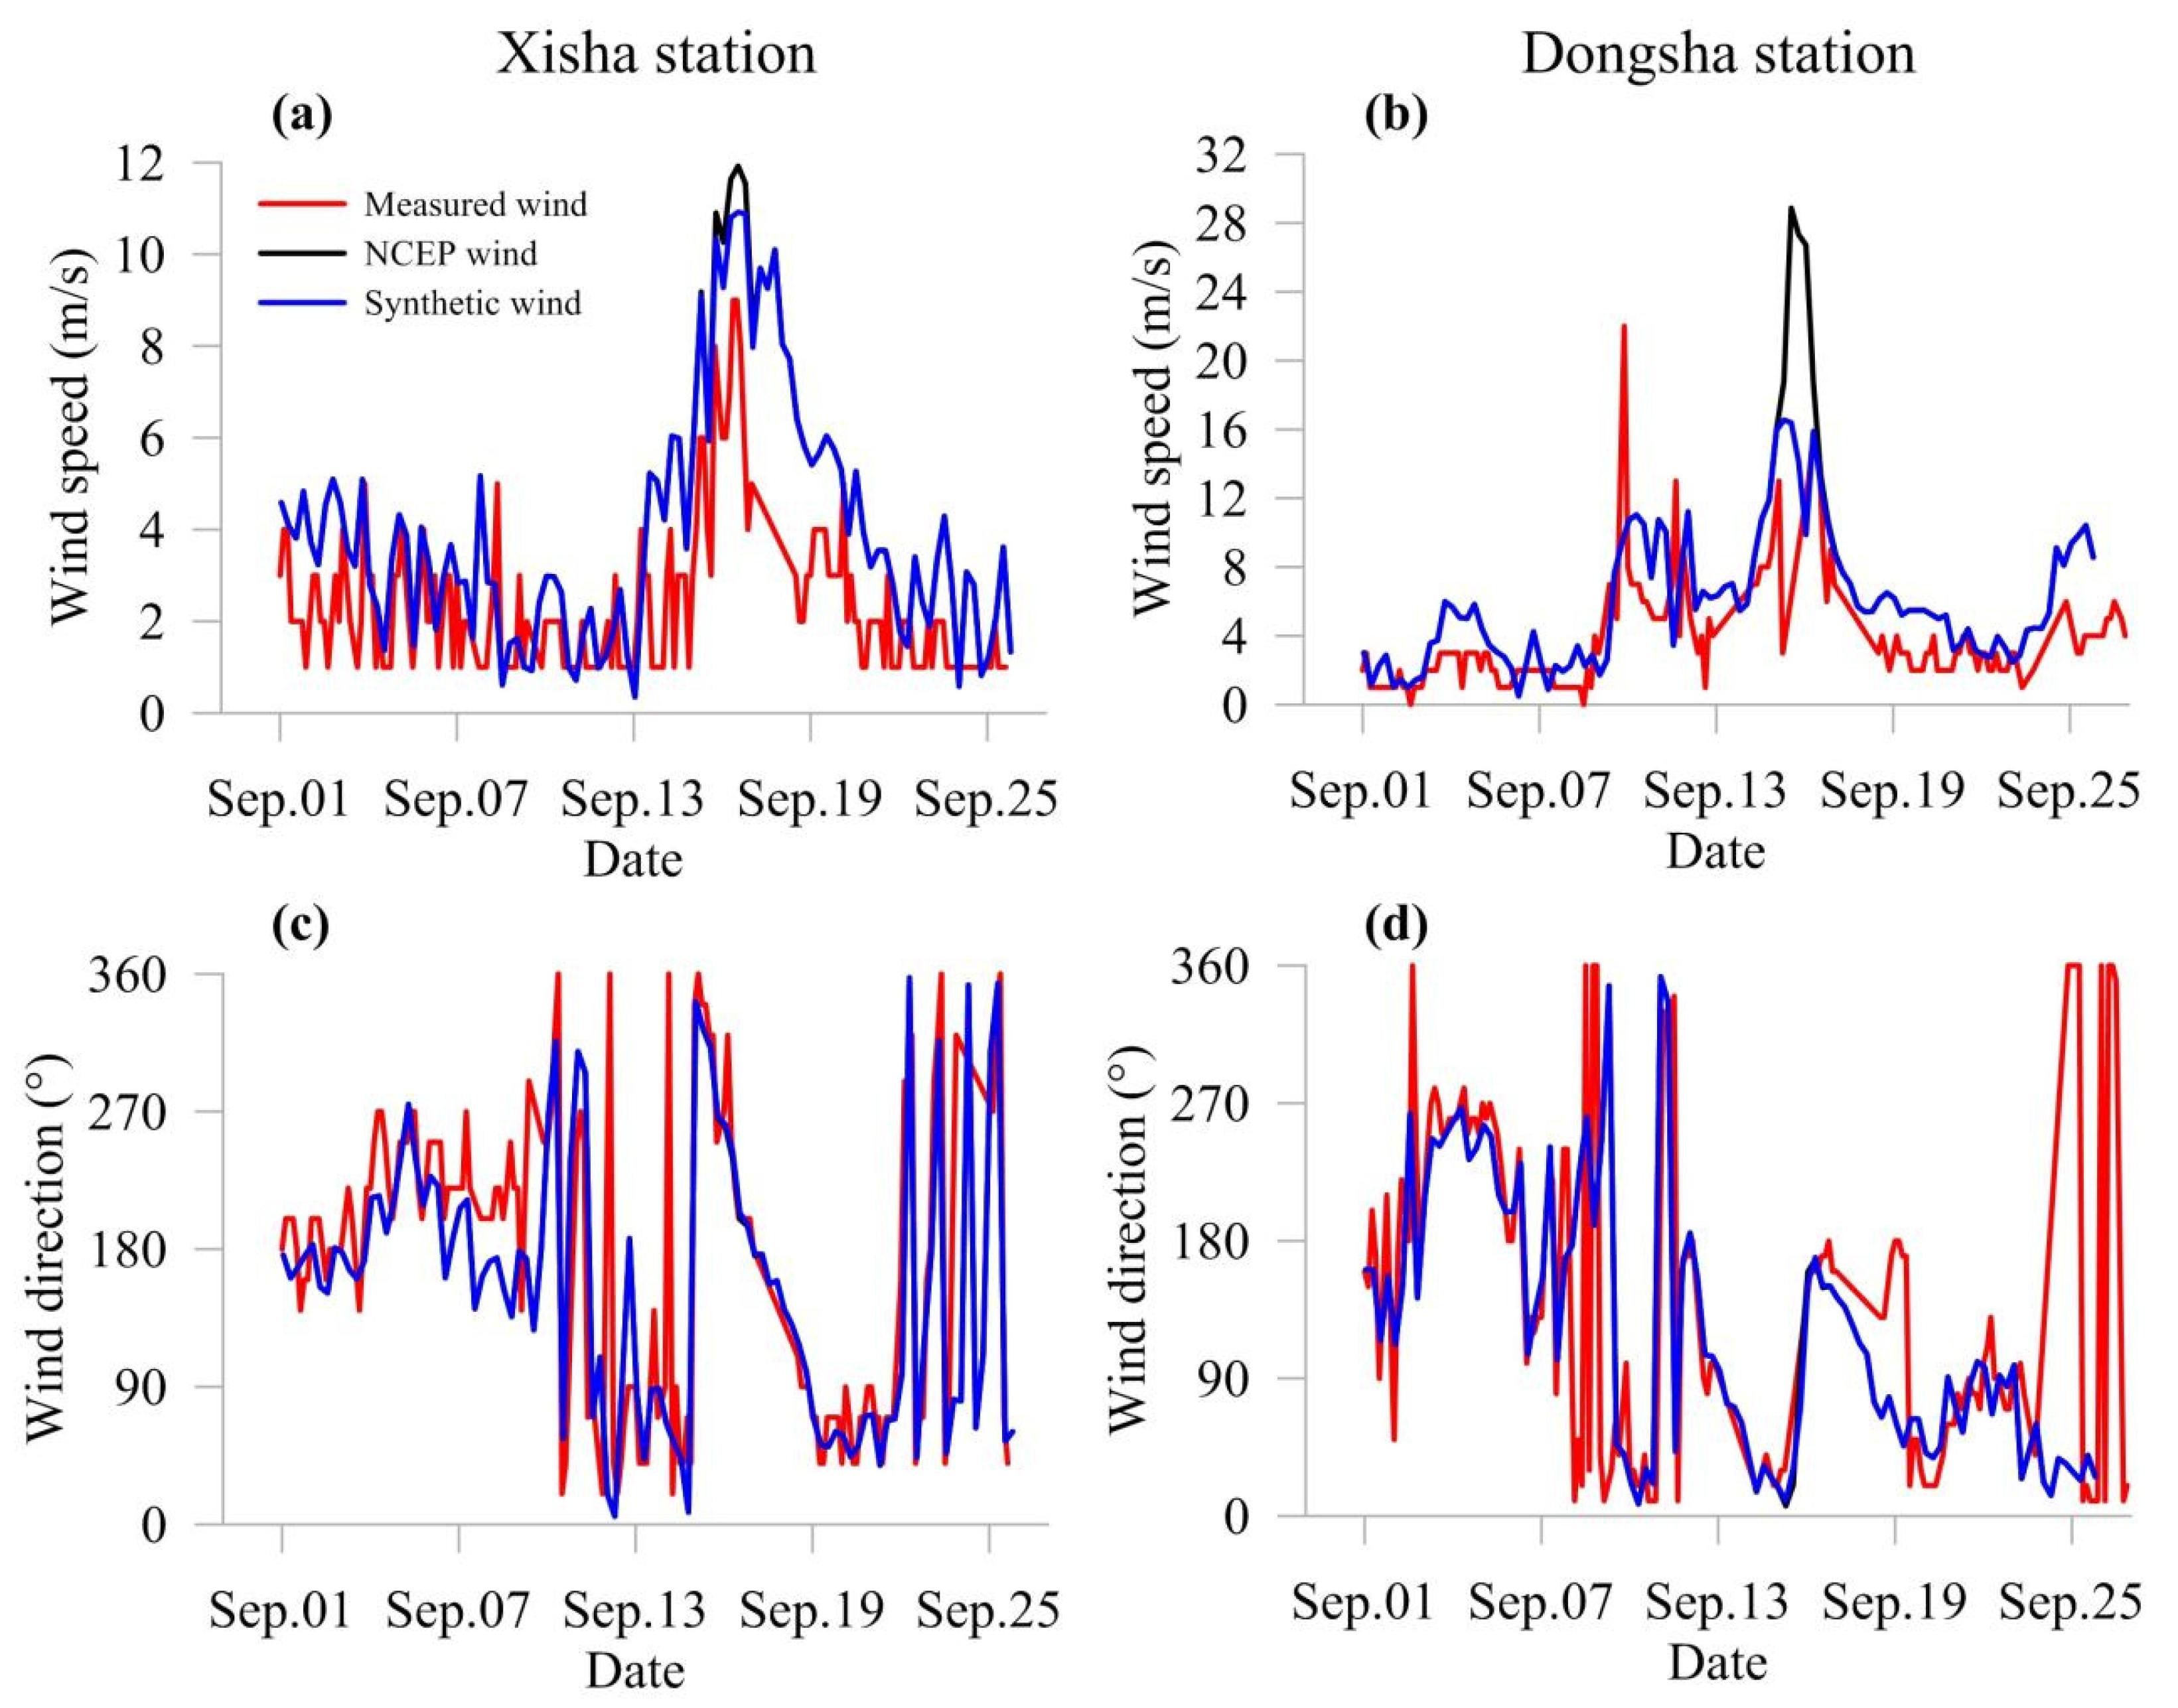
To verify the rationality and superiority of the synthetic wind field, a comparison of the wind speeds and wind directions is performed between the NCEP, synthetic, and measured winds in Figure 4. The wind measurement data were download from the NOAA hourly and sub-hourly climate monitoring database (available online at https://www.ncei.noaa.gov/maps/daily/ accessed on 30 October 2018). It can be seen that the wind direction of the NECP wind field is consistent with the measured value, but the peak wind speed is significantly greater than the measured value; it is even doubled. Through superimposing the parametric typhoon wind field calculated by the revised H10 model and the NCEP sea surface wind field data, the peak typhoon wind speed of the synthetic wind field approximates the measured wind field. After the typhoon, the revised H10 wind field is empty, and the synthetic wind field is equal to the NCEP wind field. The overestimation of the NCEP wind speed contributes to the longer duration of strong winds for the synthetic wind field relative to the measured values shown in Figure 4a. Overall, the synthetic wind field and the measured wind field have good consistency in both the wind speed and direction, with higher accuracy than the NCEP wind field. This means that, by combining the wind field calculated from the typhoon pressure field and that measured by remote sensing or after modeling, the wind field far from the central area after typhoon generation and attenuation can also be well considered.

2.2. Model Setup

The model domain covers the entire SCS, ranging from 104° E to 126° E and 10° N to 26° N. The coastline data were obtained from the Global Self-consistent, Hierarchical, High-Resolution Geography (GSHHG) database. The bathymetry data (seen in Figure 1) were obtained from the global land and ocean elevation data ETOPO1, with a spatial resolution of one arcminute.
The simulation covers the period from 1 September 2018 to 25 September 2018, with a time step of 10 min. Its resolution is approximately between 10 and 20 km. The number of grid nodes is 19,563, and the number of grid elements is 33,812. The wave frequency range is 0.055 to 0.542 and is divided into 25 distributions with an increment factor of 1.1. The direction is divided into 16 segments. Considering the time lag of the seawater motion to the wind, the spin-up period is set to 1 h. The sea surface wind directly drives the wave without incident waves. No swell from outside enters the domain. Tide effects are not currently included because they are comparatively weak during the typhoon period.
The accuracy of the modeled significant wave height (SWH) and mean wave period (MWP) can be quantified by the bias and root mean square error (RMSE) as follows:
B i a s ( x , y ) = 1 n i = 1 n ( x i y i )  
r m s e ( x , y ) = 1 n i = 1 n ( x i y i ) 2
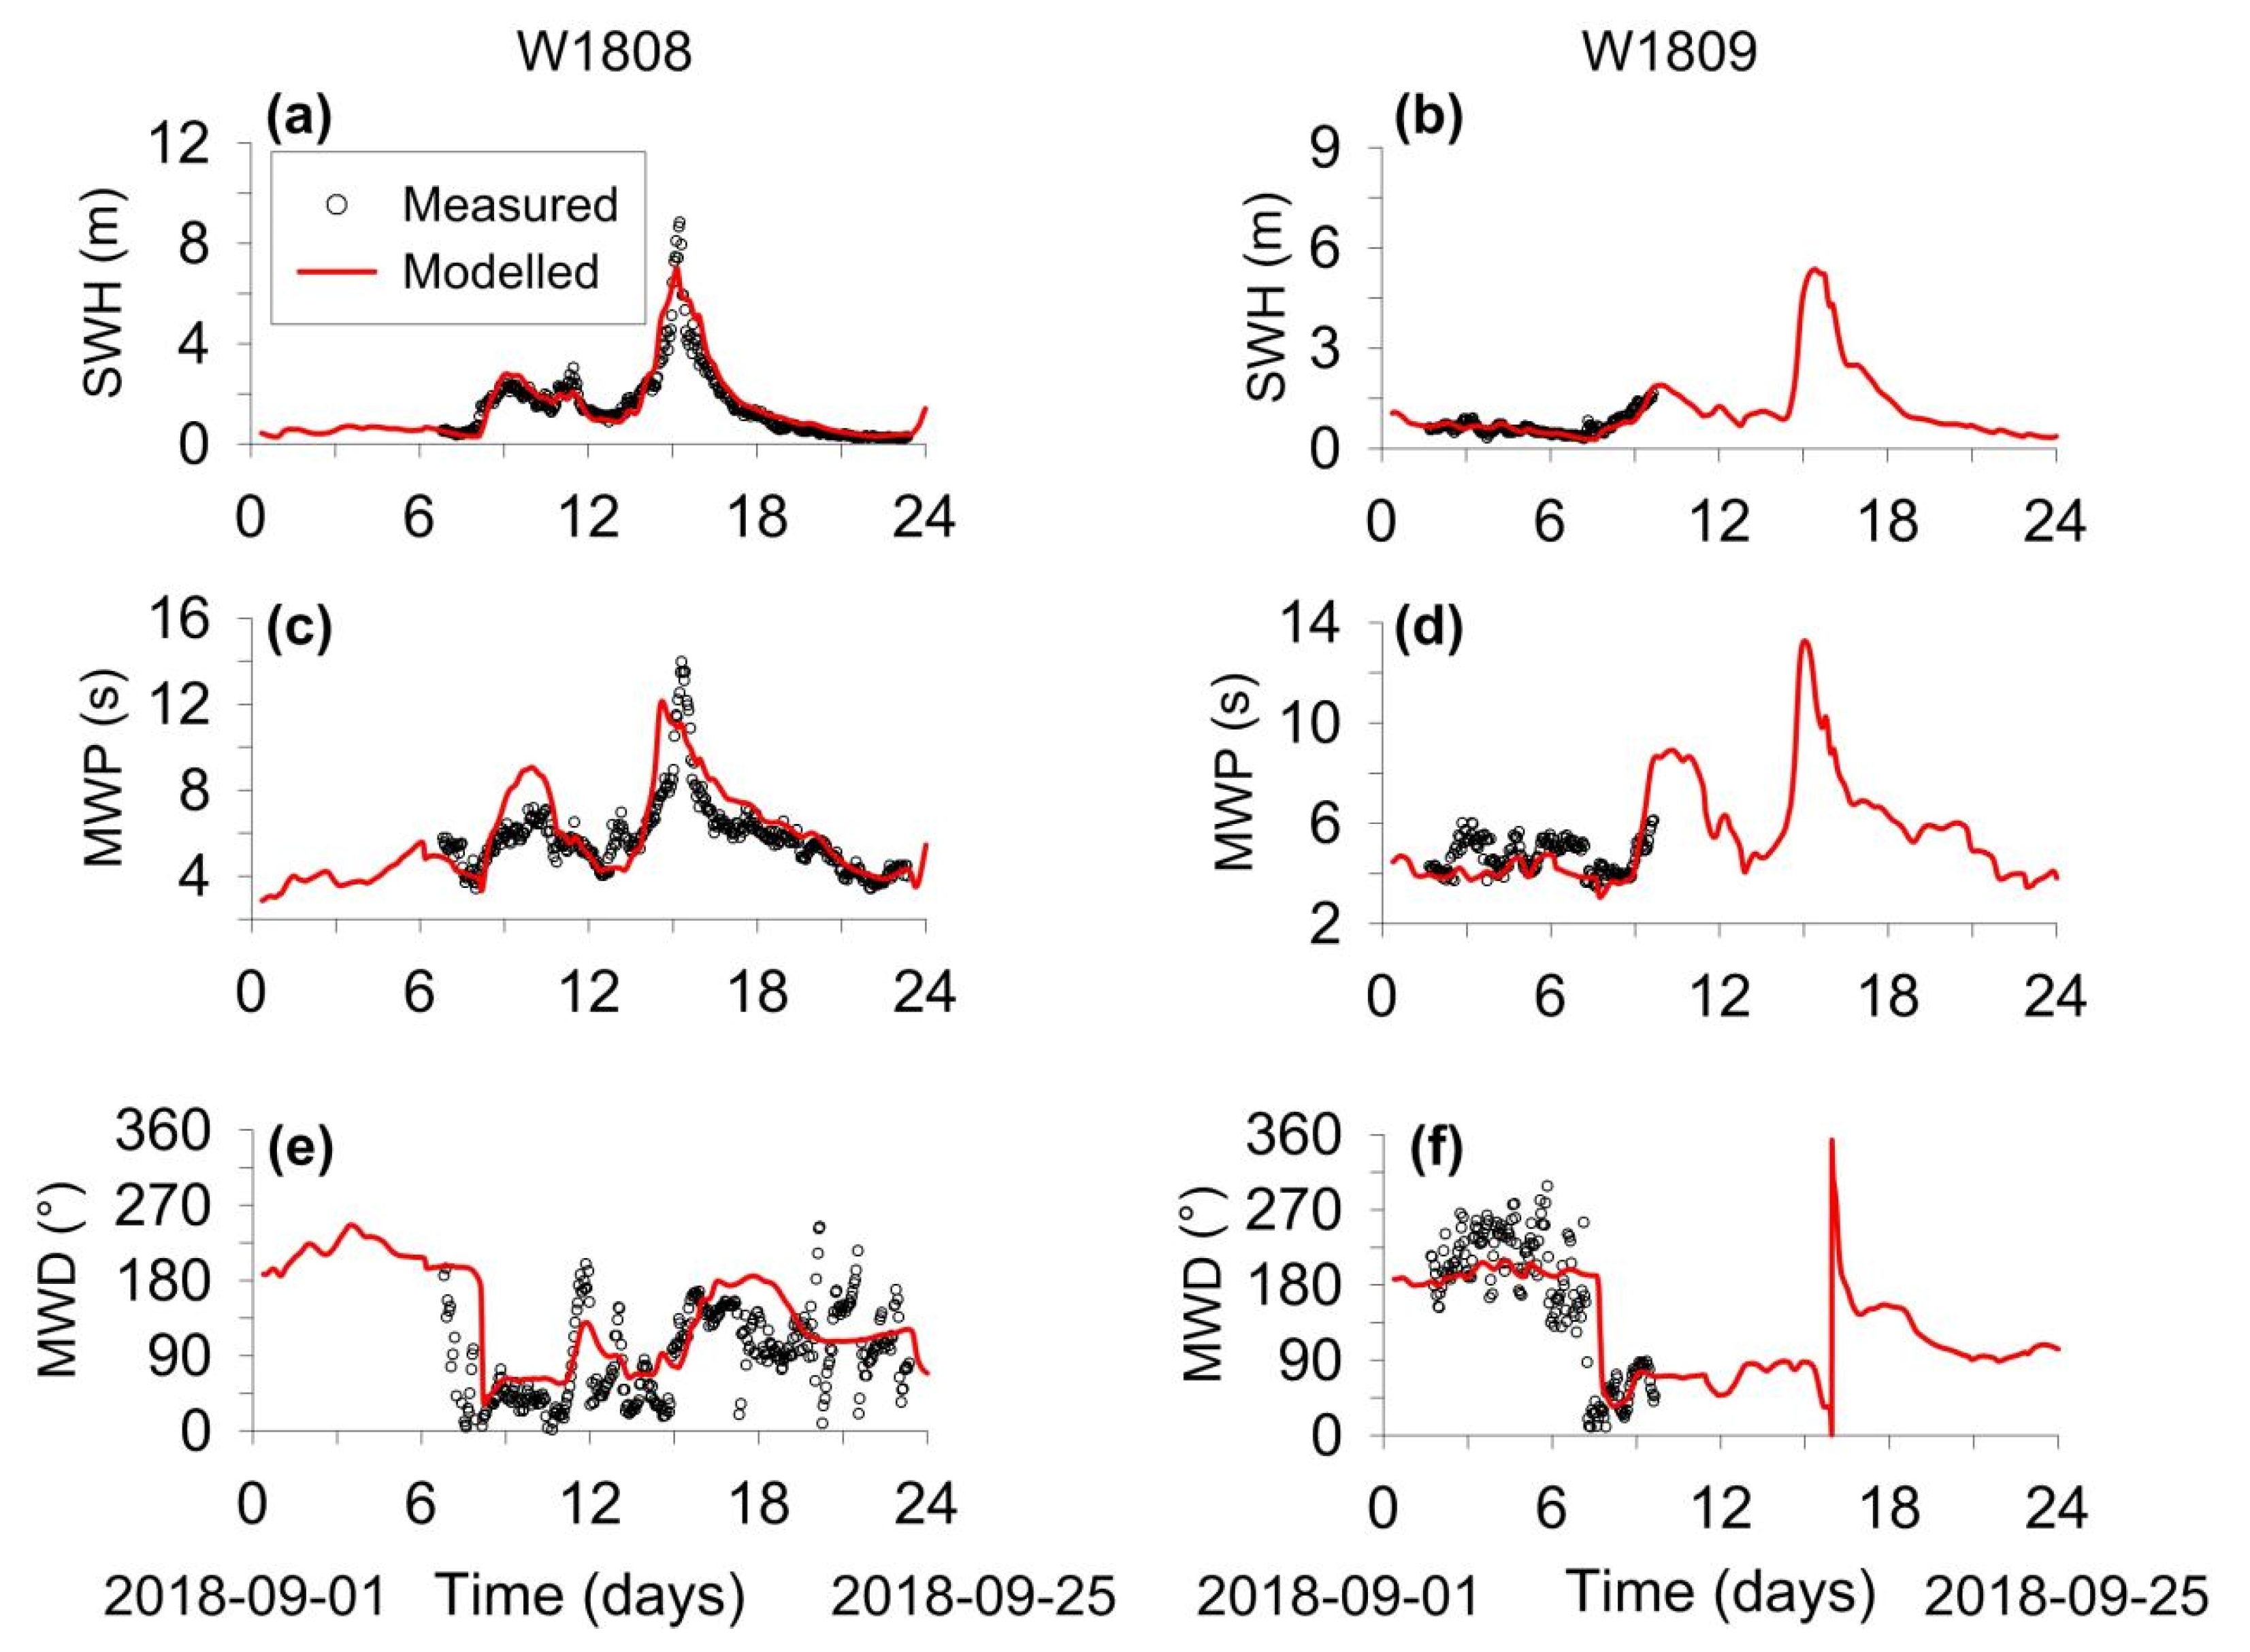
where x and y represent the simulation results and the measured data, respectively. The above error estimation is meaningless for the mean wave direction (MWD), as 0 degrees and 360 degrees are equal. The modeled waves generally agree with the observations, with a small bias and RMSE. The largest mean biases and RMSEs for SWH are 0.162 m and 0.528 m, respectively, and they are −0.541 s and 1.314 s for MWP, respectively. There is large variability in the observed MWDs, but the model can still roughly capture the mean variations in the observations (Figure 5).

3. Results

3.1. TW Parameters

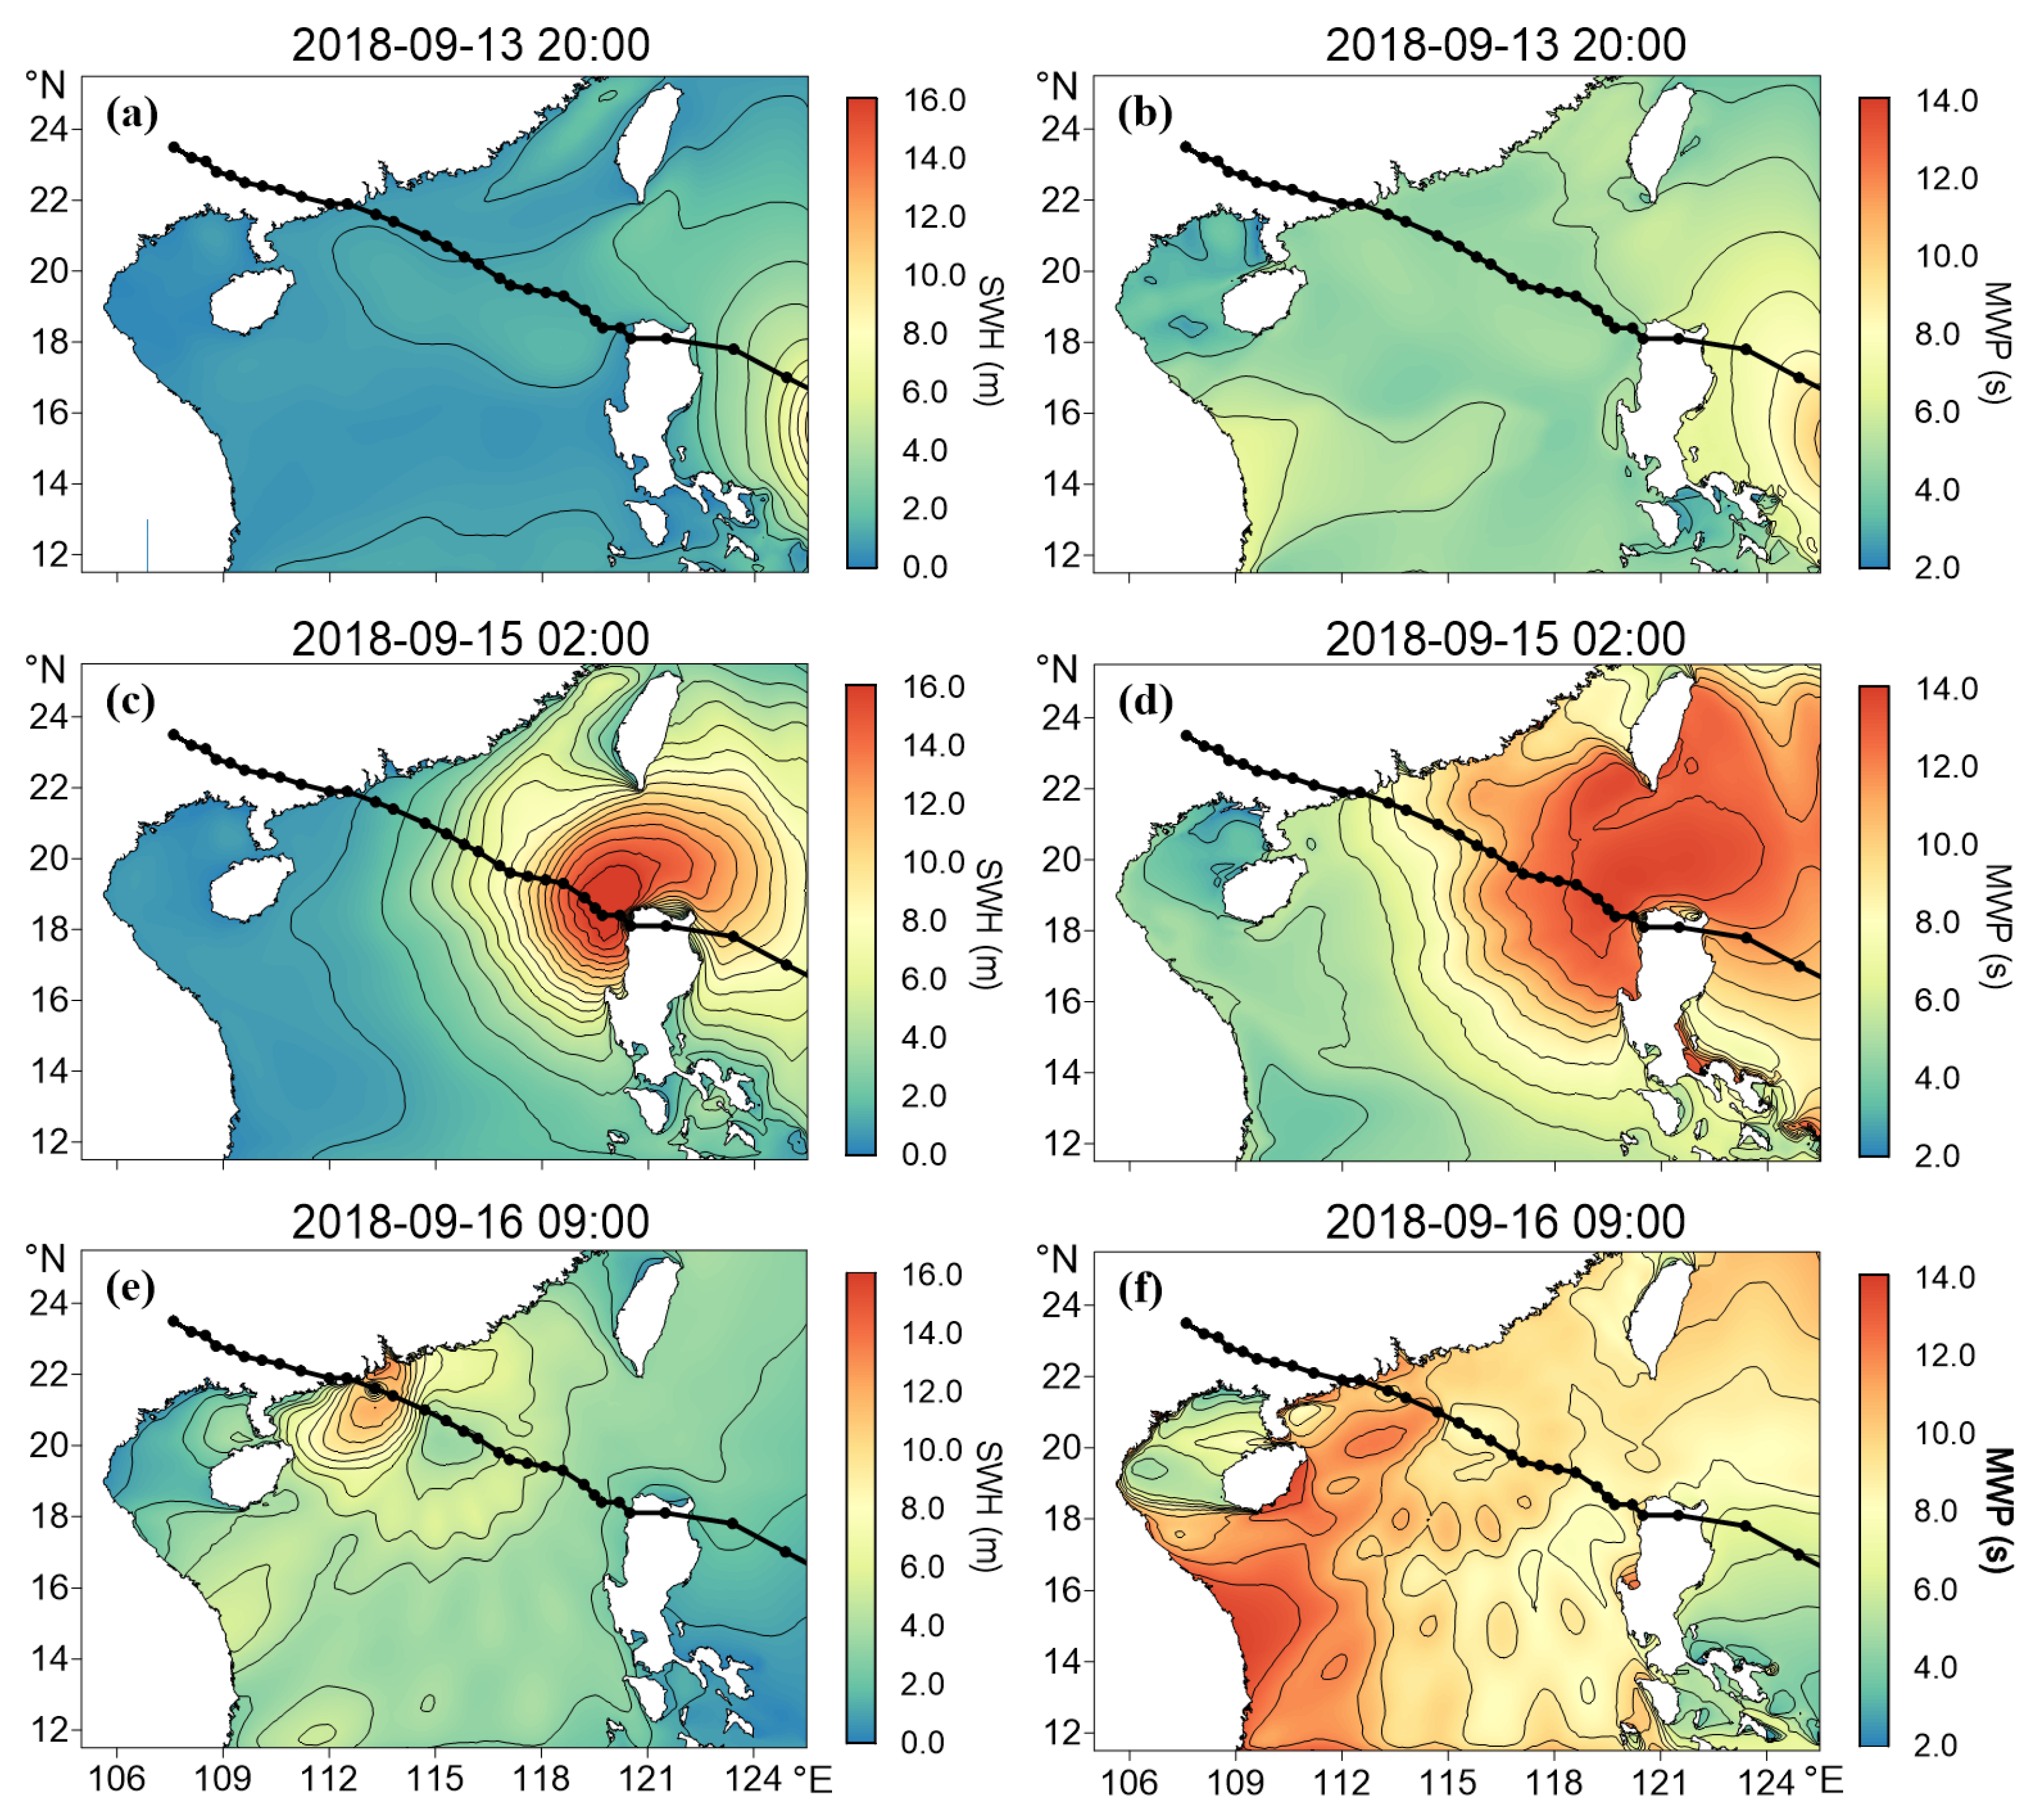
After forming in the northwestern Pacific Ocean, the typhoon entered the eastern part of the SCS through the Luzon Strait and crossed the Philippines, causing huge economic losses along the coastal zones. The typhoon strengthened in the SCS and finally made landfall at Haiyan Town, Taishan. Figure 6 shows the spatial distribution of the SWH and MWP corresponding to the generation, propagation, and landing process of the Mangkhut TWs. The maximum central SWH increases from 6 m to 16 m. As with the wind field, the higher the wave height, the steeper its spatial gradient. The spatial distribution patterns of the MWP during the generation and propagation process are consistent with the SWH. The core areas of both are around the typhoon center. Part of the long-period swell rapidly spreads westward to Hainan and Eastern Vietnam due to the dispersion as the wave refracts along the shoreline when landing. At this stage, the distribution patterns of the SWH and MWP are different because the maximum SWH is still mainly controlled by the huge wind seas near Taishan, while the maximum MWP of the total waves is controlled by the long-term swells, which have already been refracted to the coast of Vietnam.
The results in Figure 6 also show a certain deviation between the maximum simulated SWH and the typhoon center, which follows from the consistent understanding that the maximum SWH is always located on the right side of the translating typhoon [23,28,29].
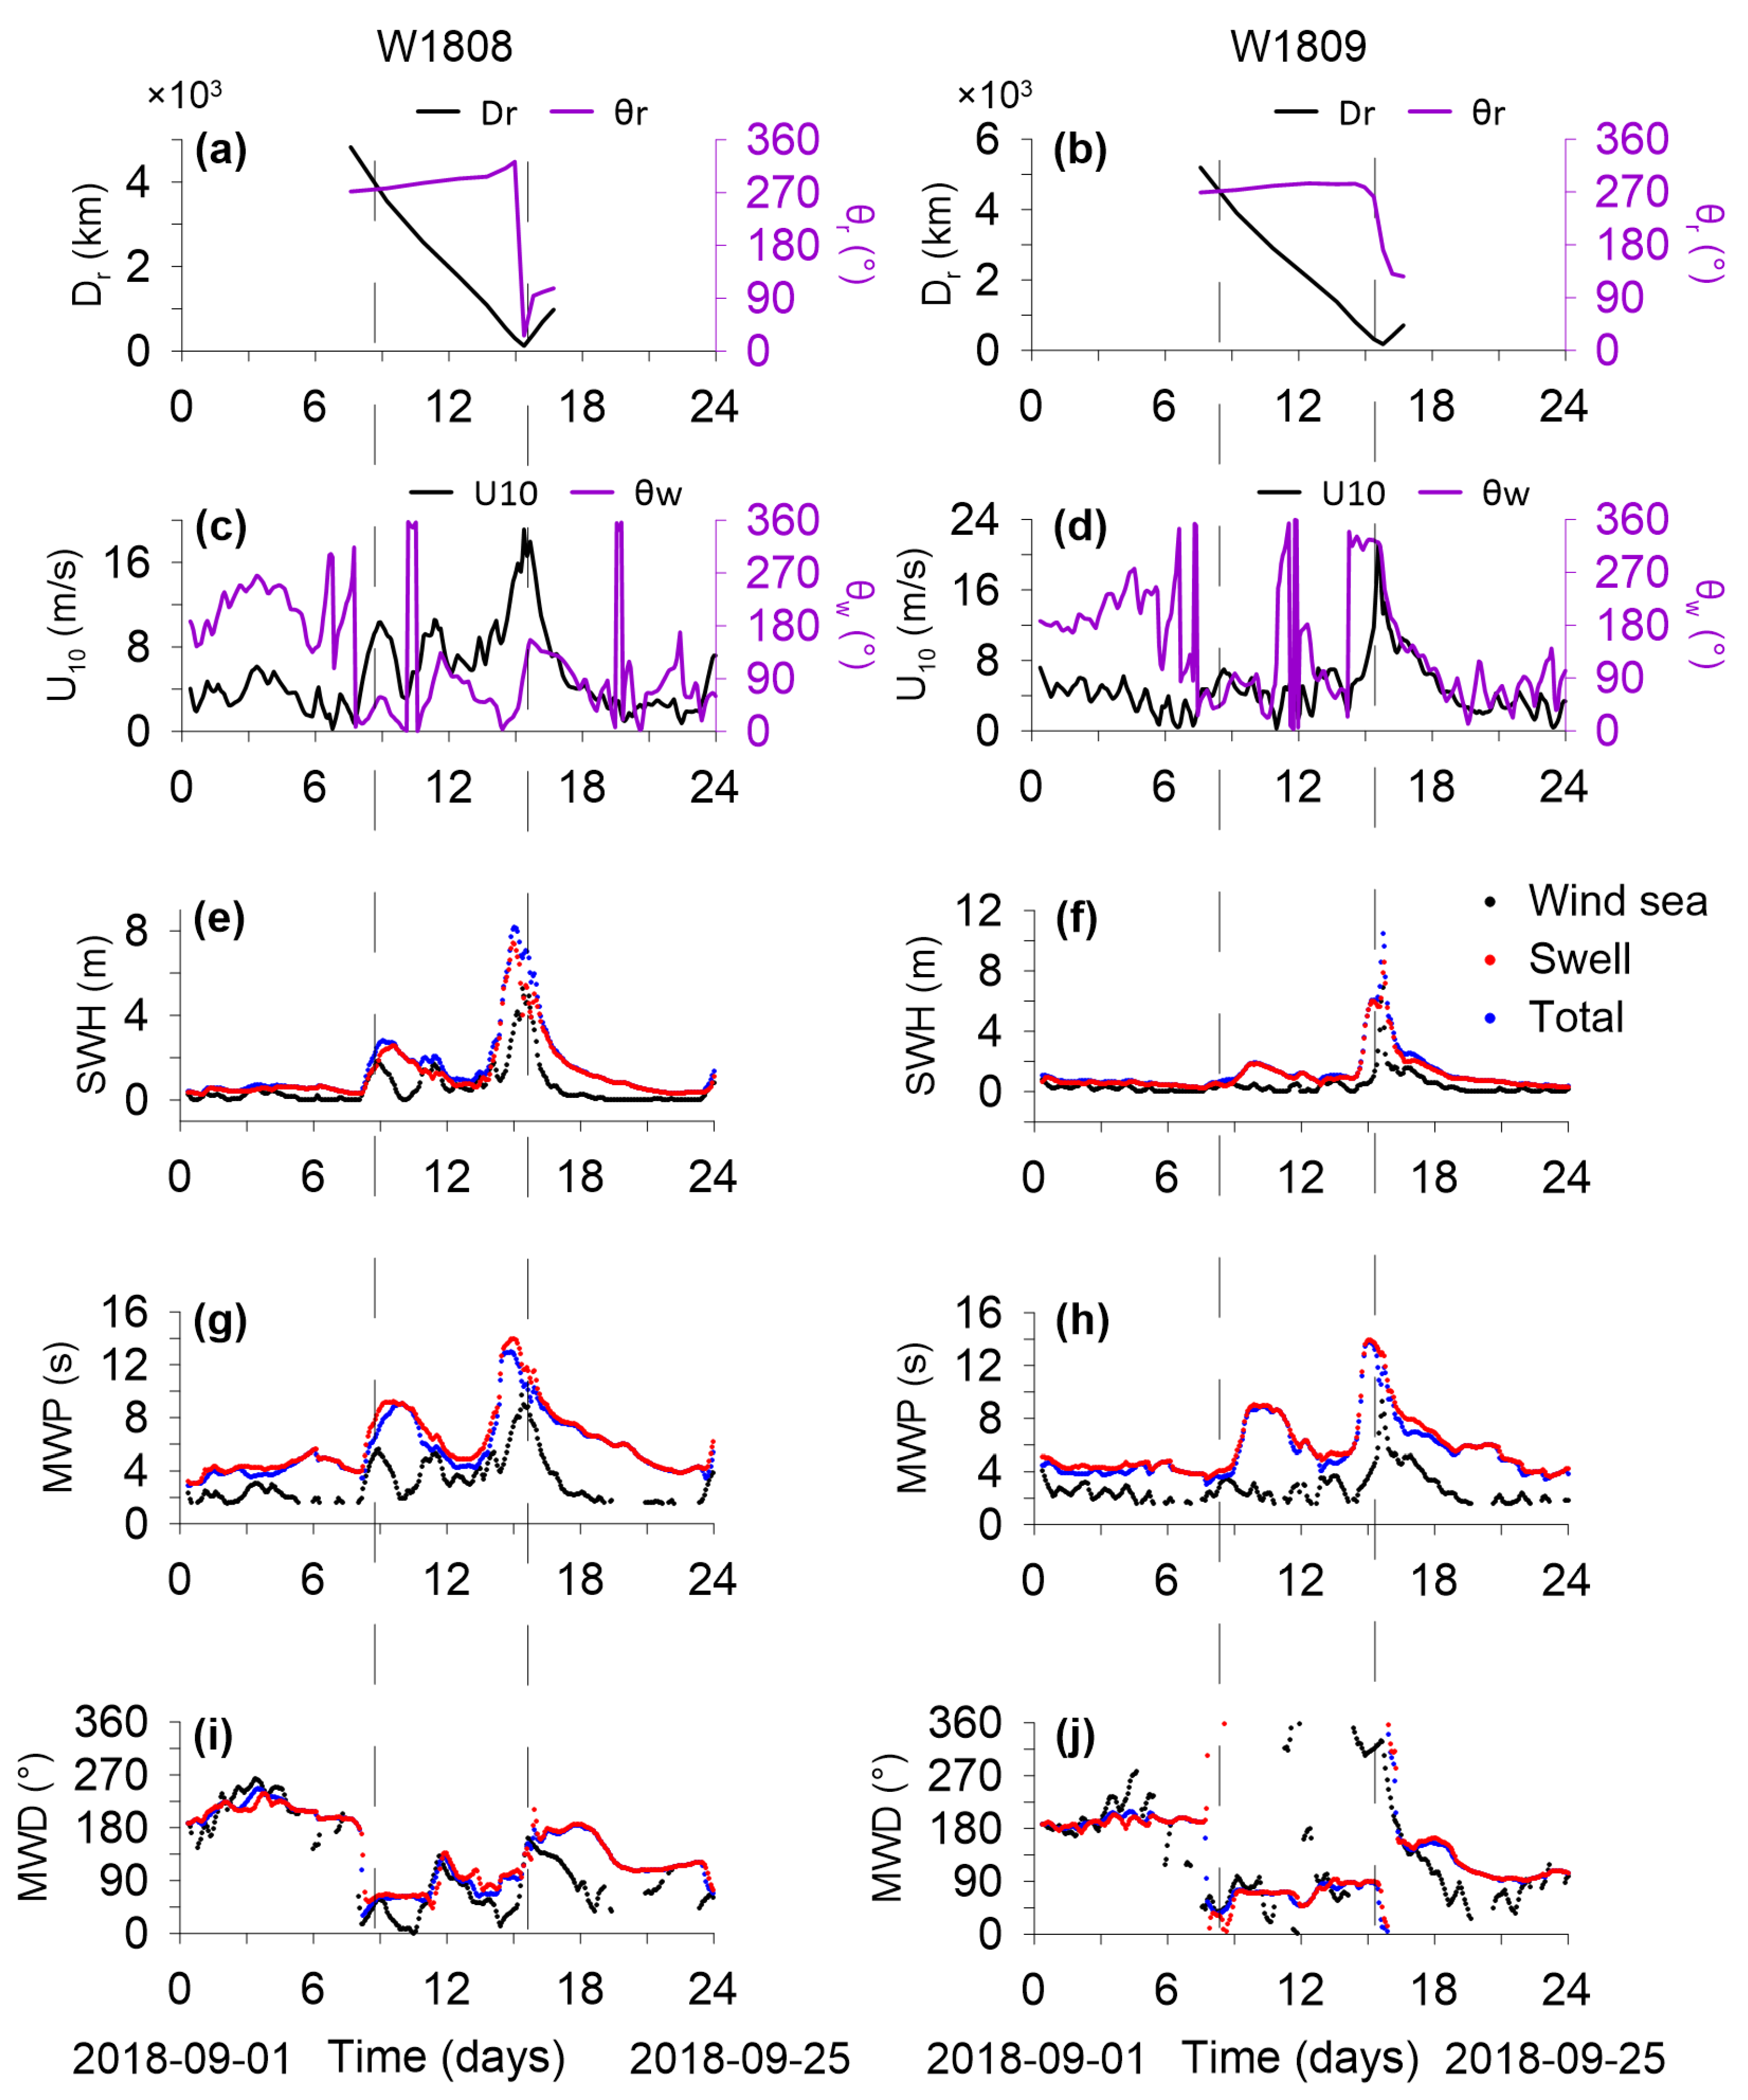
The simulated wind and wave processes at the two buoy stations are shown in Figure 7, where Figure 7a,c,e,g,i correspond to station W1808; Figure 7b,d,f,h,j correspond to station W1809; Figure 7a,b show the straight-line distance and azimuth angle of the buoy from the typhoon center; Figure 7c,d show the wind speed and direction; Figure 7e,f show the SWHs; Figure 7g,h show the MWPs; and Figure 7i,j show the MWDs. The general SWH before September 7 is no more than 0.8 m, the period is about 4 s, and the wave direction is between 180° and 270°. At the early stage of the typhoon’s outbreak, the buoy stations are on the northwestern side, far away from the typhoon center, and the corresponding wave direction is between 0° and 90°. As the typhoon center advances towards the mainland, when the buoys are closest to the typhoon center, the SWH and MWP reach their maximum values. At the same time, the wind sea gives its greatest contribution. After this, the azimuth angles of the buoys relative to the typhoon center turn southeast, and the corresponding MWD turns by 90° to 180° as the typhoon makes landfall. The wave energy gradually decays. The wave period returns to normal when the typhoon’s energy is completely consumed. The wave direction, meanwhile, rotates counterclockwise at a certain angle and becomes eastward. In general, the SWH and MWP of the wind sea and swell increase with the enhancement in the wind speed, of which the latter has a longer period. In addition, the buoys were more than 3000 km away from the center of Typhoon Mangkhut during 8–12 September and were unaffected by the typhoon. The peak SWH and MWP were due to the influence of Typhoon Barijat.

3.2. Spatial Distribution of the Wave Spectra

The TW characteristics at the buoy stations vary with the distance and azimuth relative to the typhoon center. The typhoon wave field has obvious asymmetry in space. Therefore, further wave spectrum analysis is required at different orientations and distances to the typhoon center.
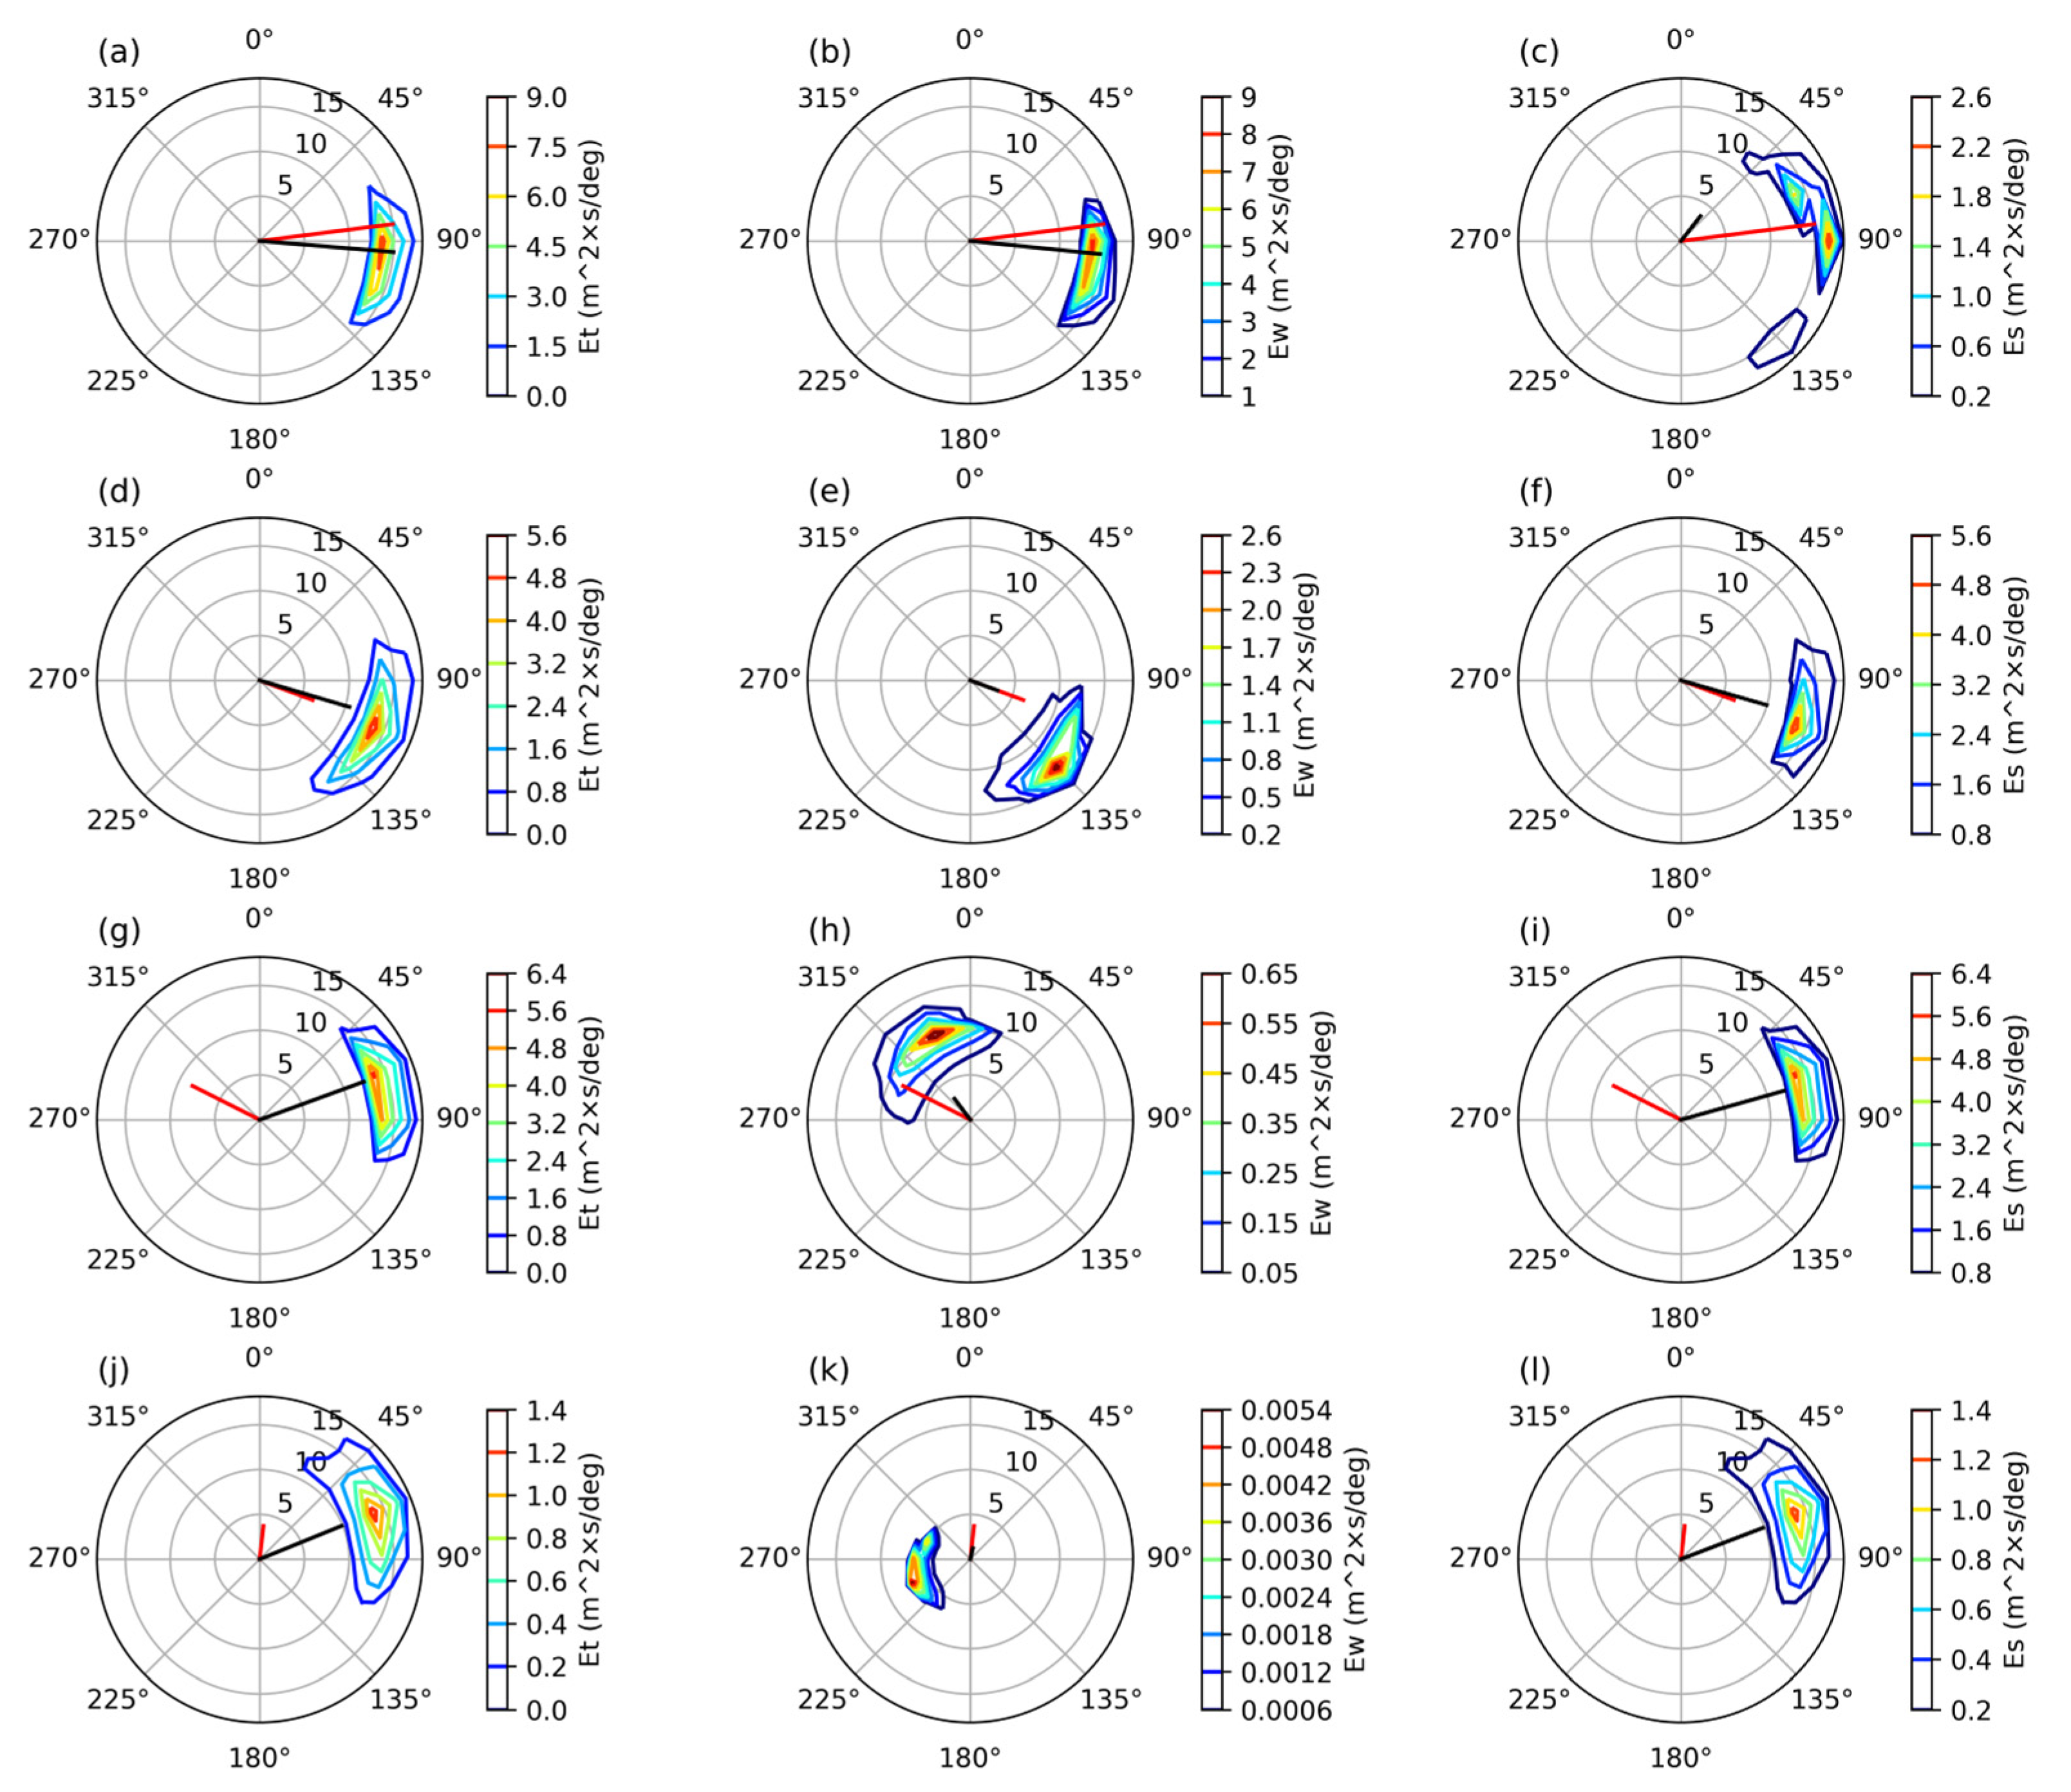
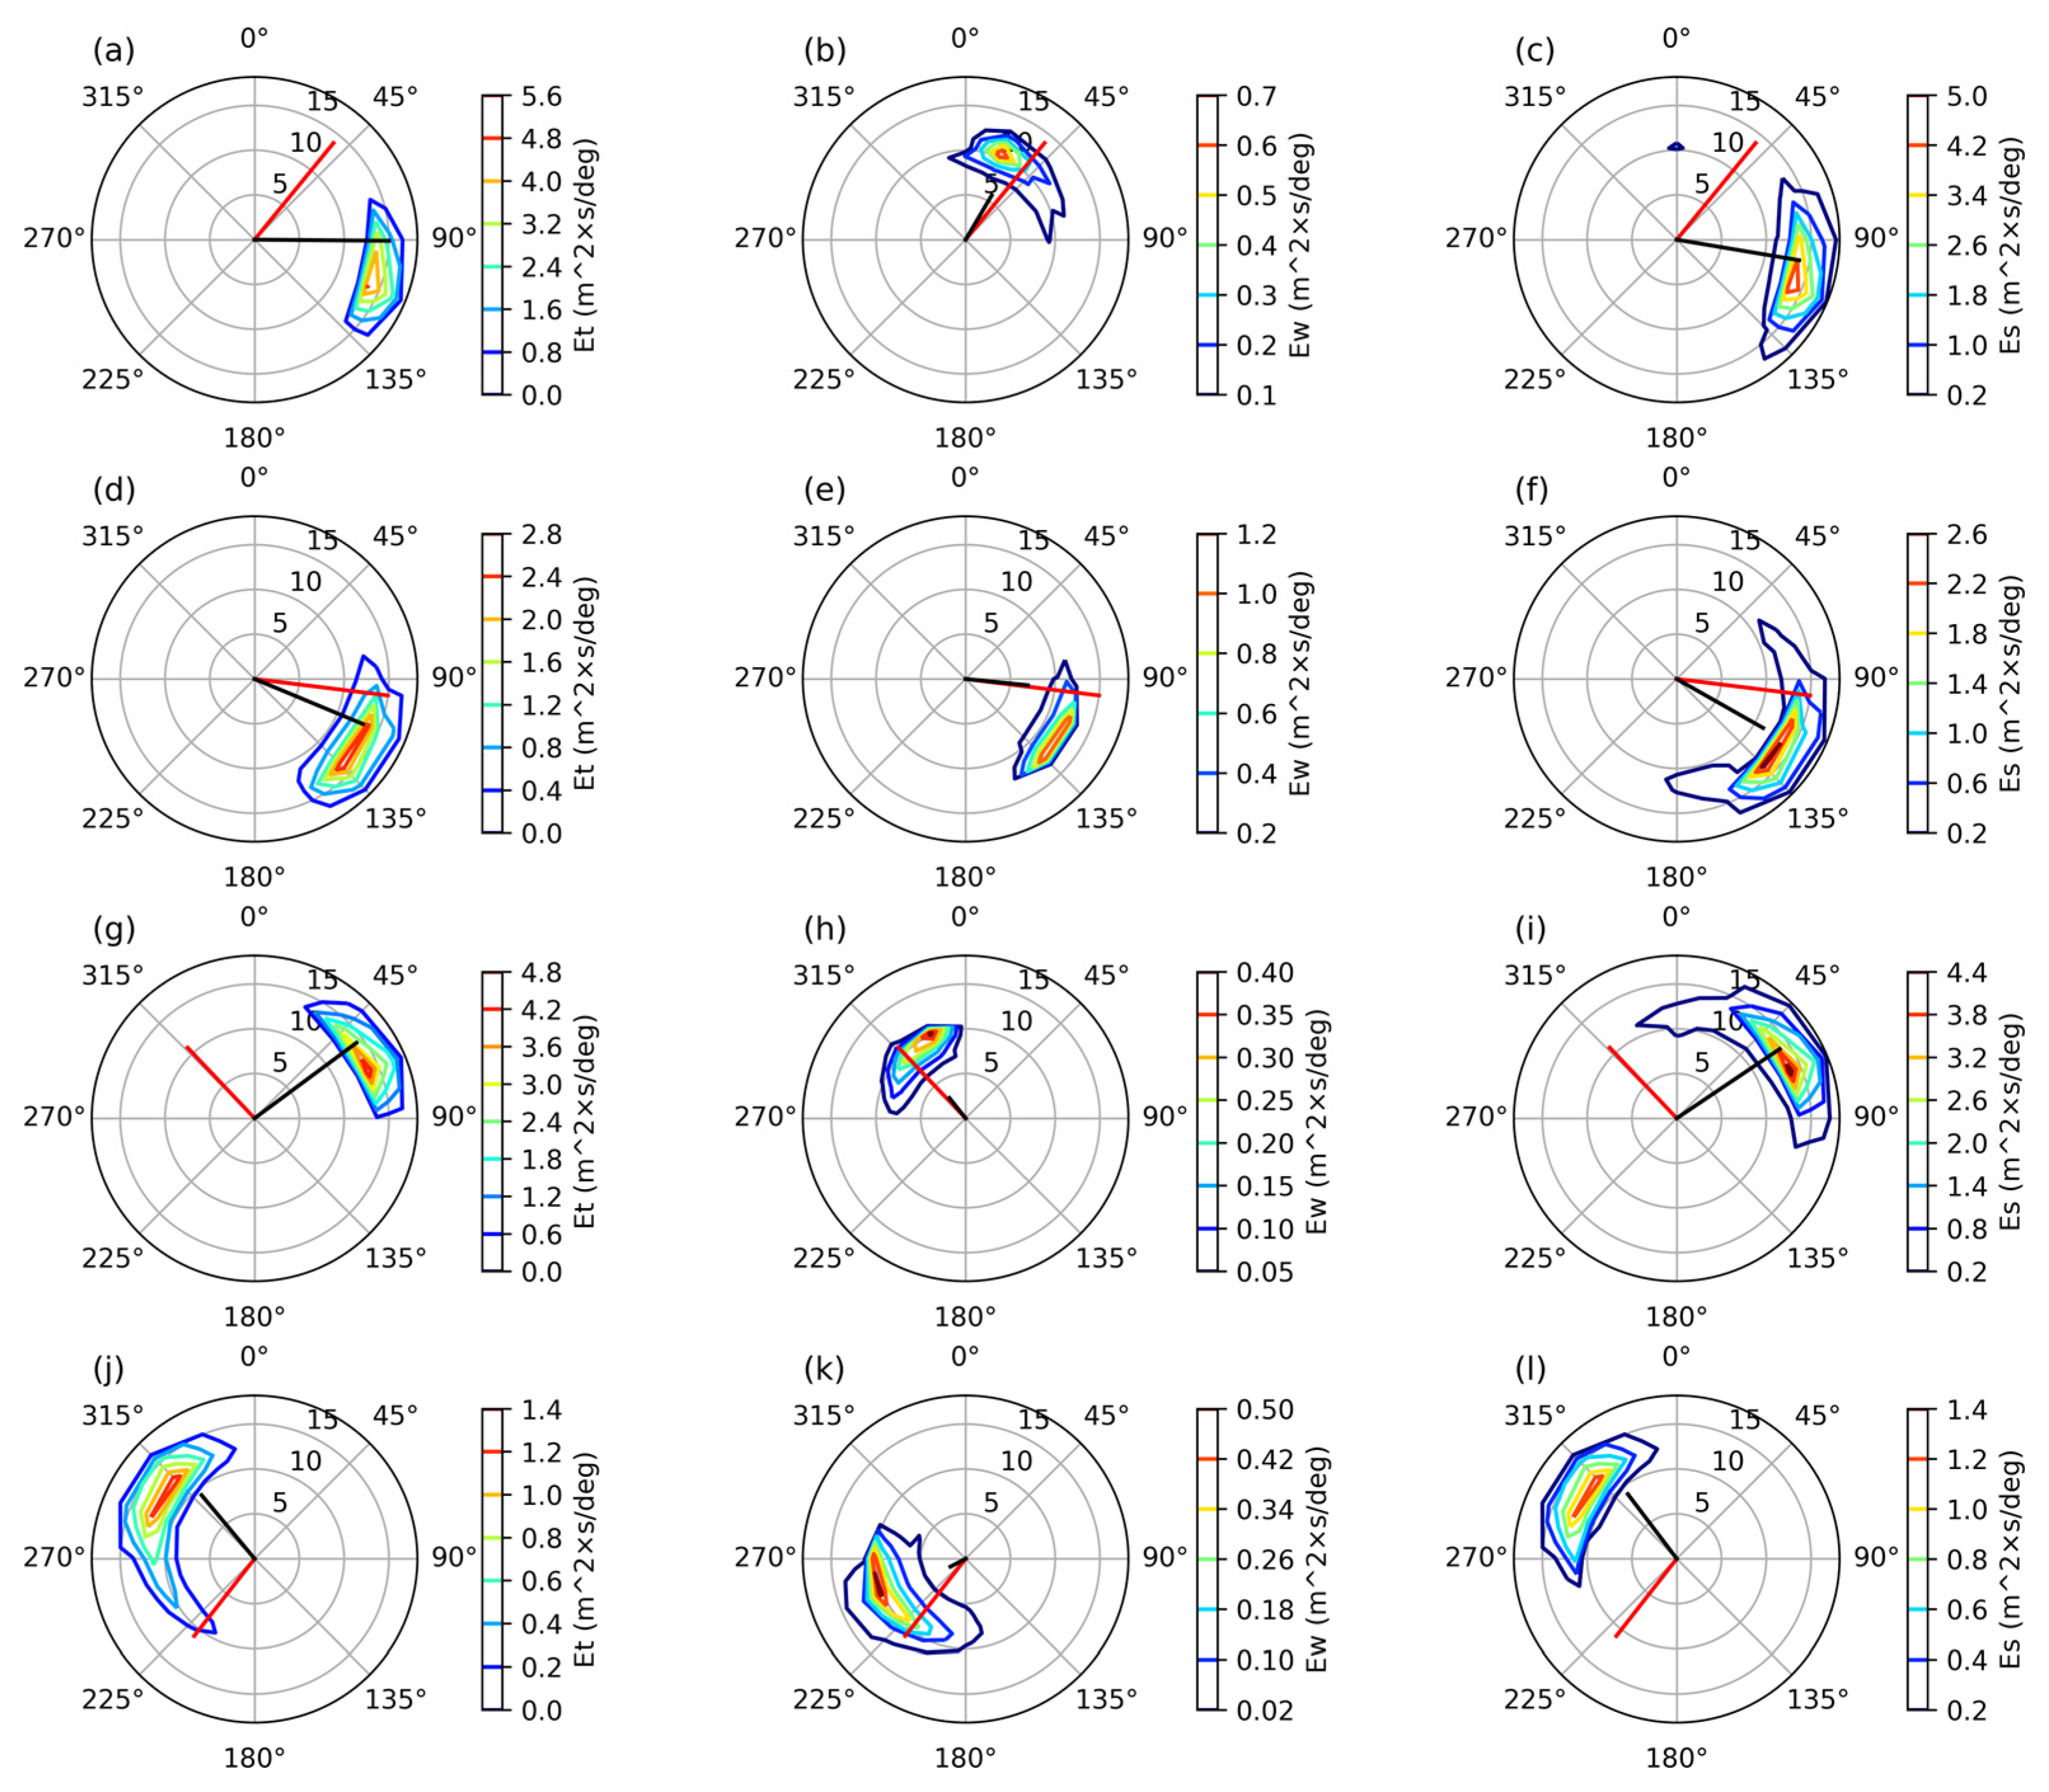
A more detailed understanding of the directional properties of TWs can be gained by comparing the wind sea and swell spectrum characteristics in four quadrants at different distances from the typhoon center. The data are projected onto a new frame of reference. The feature point P (118.6° E, 19.3° N), with a central pressure, radius of maximum wind, and translating speed of 945 hPa, 29.2 km, and 7.8 m s–1 (Figure 1), representing the typhoon center, is the coordinate origin. Prf, Prr, Plf, and Plr stand for the right–forward, right–rear, left–forward, and left–rear quadrants, respectively, in terms of the typhoon’s propagating direction. The distance to the storm center is scaled by the radius of the maximum wind speed, Rmax. Figure 8 and Figure 9 show the wave energy spectra 2.5 Rmax and 7.5 Rmax away from the typhoon center, respectively. The columns from left to right correspond to the total wave spectrum E t, wind sea spectrum E w, and swell spectrum E s, respectively. The red and black solid lines represent the wind direction and wave direction. The results show that the wind speed in the right–forward quadrant is the strongest, while the wind speed in the opposite direction is less than 8 m/s, almost a quarter of this value. Due to the introduction of asymmetry in the H10 wind field, there is an inflow in the wind field. The right–forward quadrant is mainly controlled by the wind sea when the distance is 2.5 Rmax; the wind direction is almost the same as the wave direction, and the wave energy is the maximum among all quadrants. In contrast, the swell controls the left–rear quadrant, and the wind sea is negligible. The wind direction differs from the wave direction by 60° in this quadrant, and the wave energy is minimal, consistent with the results of Xu et al. [48]. This is because the typhoon rotates counterclockwise in the northern hemisphere due to the Coriolis force, causing the rotation and movement direction to be superimposed in the right quadrant and opposite in the left quadrant. The dominant waves generated at the right of the storm center propagate more rapidly than the storm itself. Consequently, ahead of the typhoon center, the wave field is combined with the remotely generated waves radiating out from the intense wind region to the right of the typhoon center and locally generated wind sea. Thus, an extended fetch exists to the right of the storm and the opposite occurs on the left of the typhoon. Moreover, the wave spectra in the left–forward quadrant are swell-dominated, with a difference of 138° between the wind and wave directions. The above results reconfirm the results of Young [27], i.e., the dominant waves in the left–forward and left–rear quadrants propagate from the right–forward quadrant because the wave group velocity is faster than the typhoon’s moving speed. However, unlike in Young’s results [27], the right–rear quadrant is controlled by the wind sea and the swell, although the wind direction is nearly the same as the wave direction. The wave energy in this quadrant is close to that in the left–forward quadrant. The locally generated waves and remotely generated swells seem to contribute to the wave spectra together. The waves propagating from the right–forward quadrants cannot be ignored here either. This characteristic is also validated in the case of Xu et al. [48]. When the distance from the typhoon center is 7.5 Rmax, the wave energy of swells is significantly enhanced because the intensity of the local wind rapidly decreases (Figure 8).
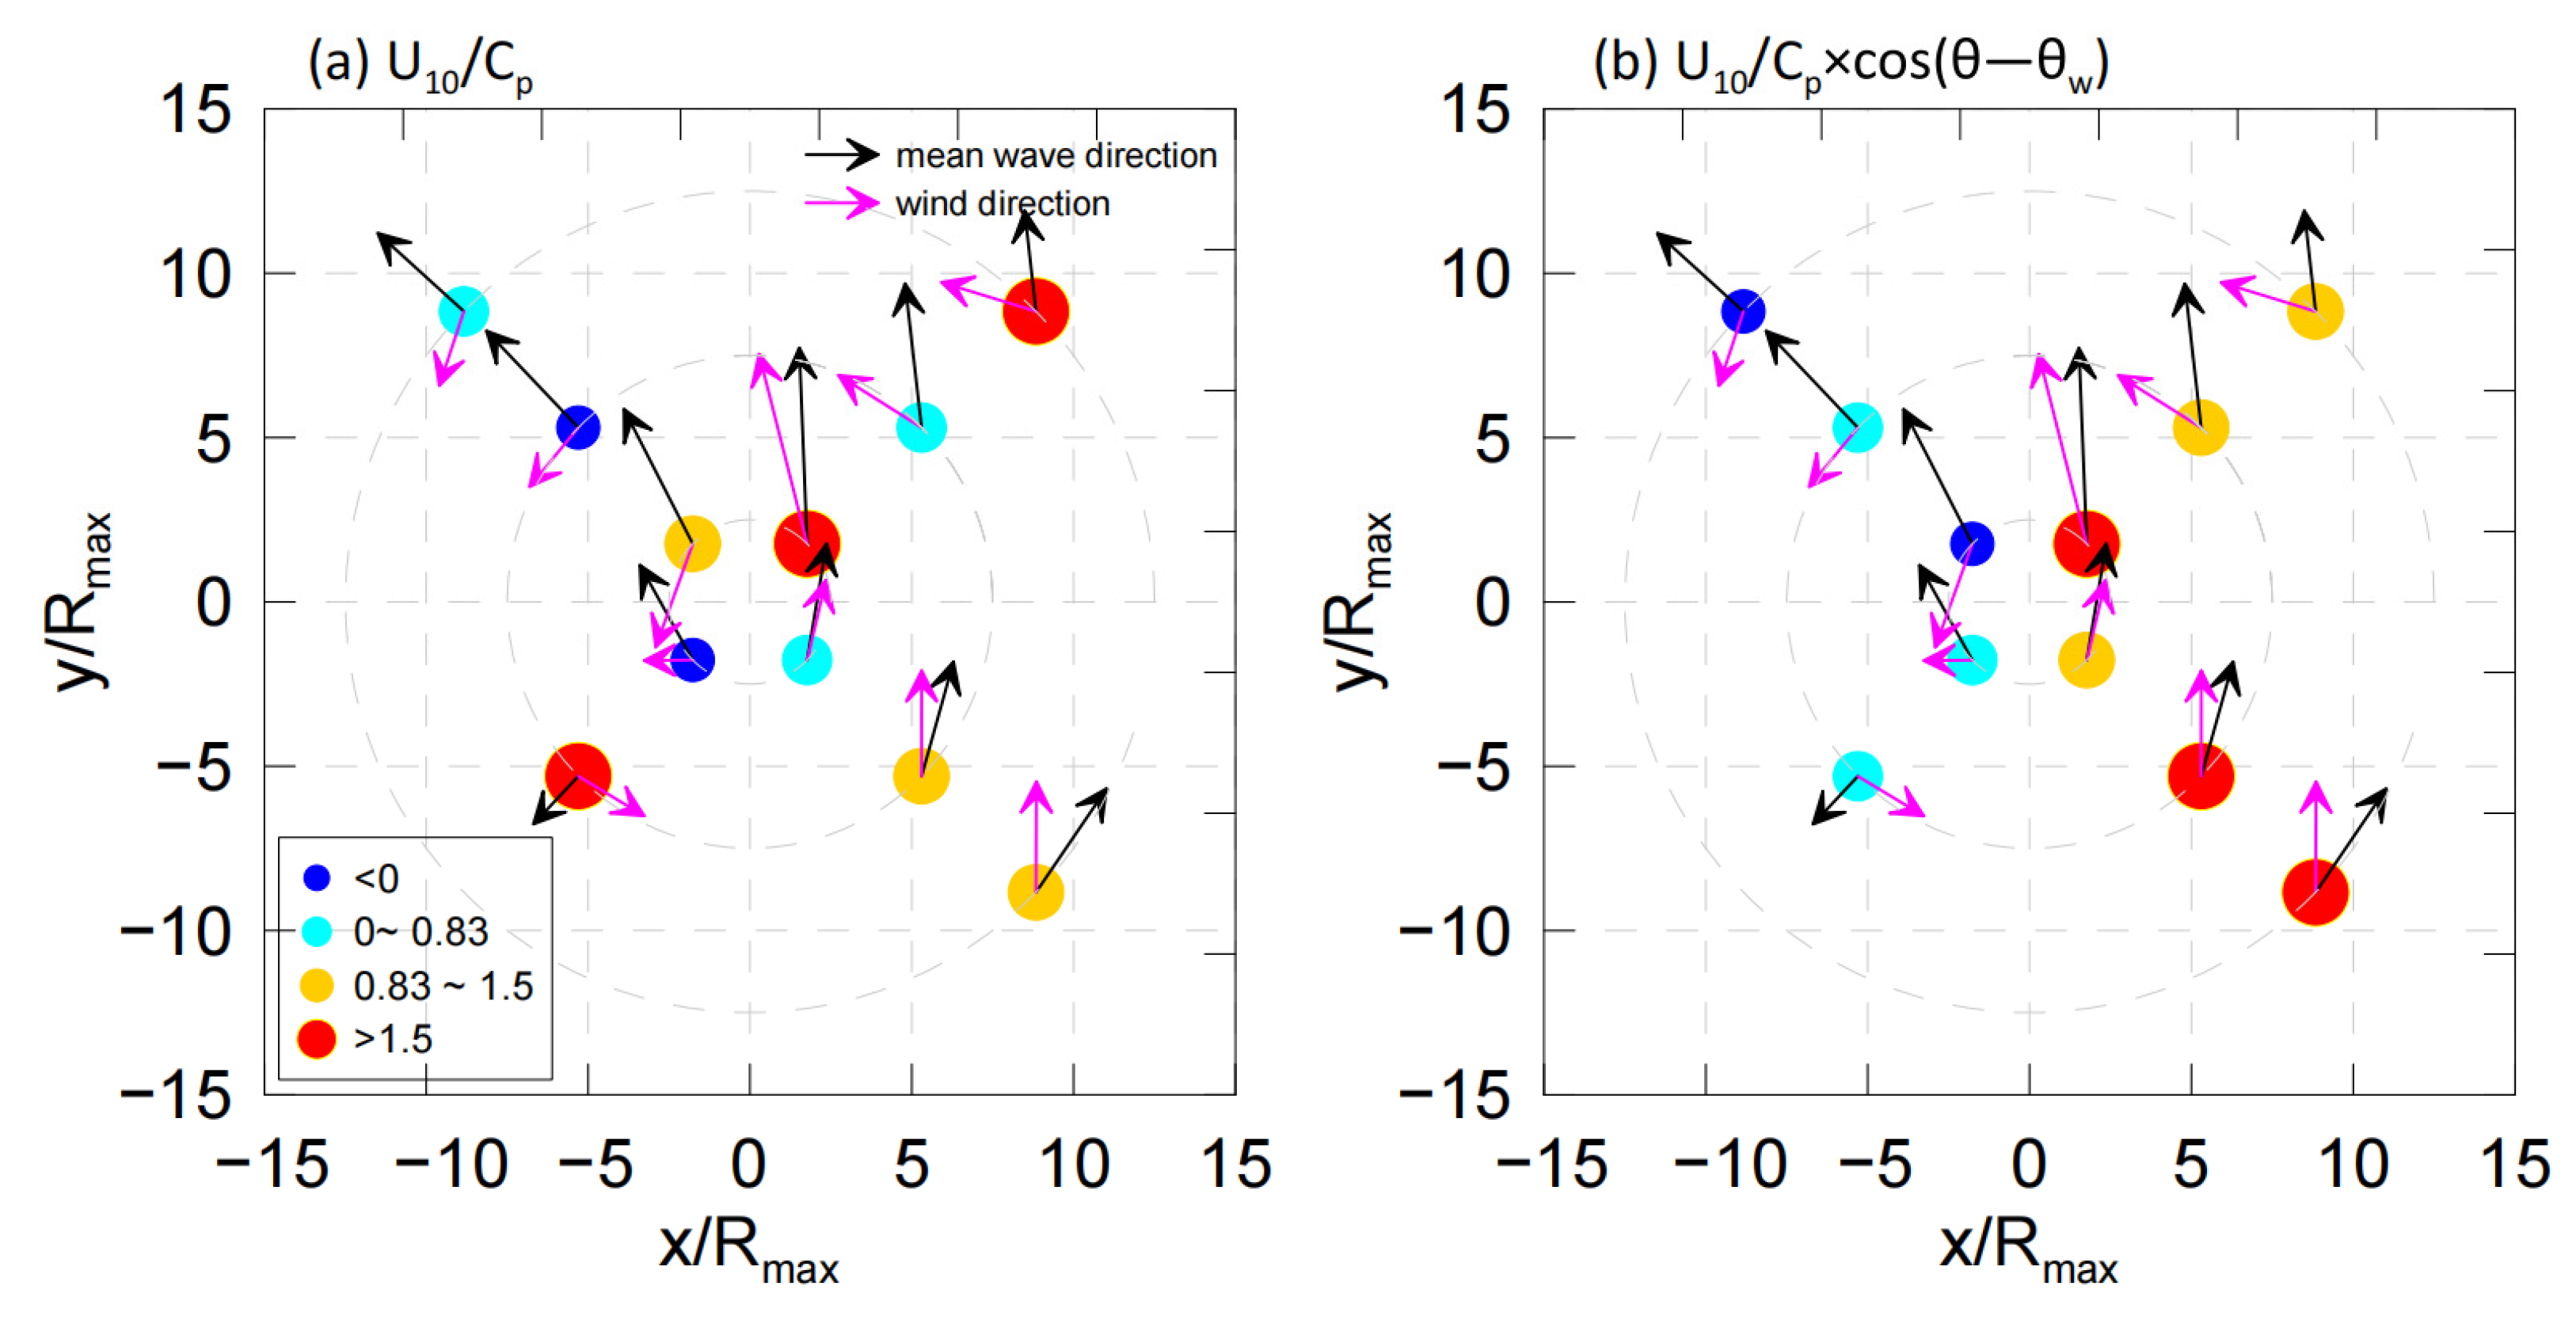
The dimensionless peak frequency v = f p U 10 / g can be used to distinguish between the relative strength of the wind sea and swell in a region following classic fetch-limited theory [49,50]. A growing wind sea is assumed to occur when v > 0.13, which is equivalent to U10/Cp > 0.83; otherwise, the region is controlled by swell [48]. The fetch-limited theory assumes that the typhoon is a steady, strong wind moving at a certain speed. For a given wind speed, when the moving speed of the typhoon is rarely small, the wave group in the front quadrant of the typhoon center propagates faster, and the direction of the swell and the wind wave is the same. The two are distinguished by the reciprocal of the wave age U 10 / C P ( C P is the wave group phase velocity under the spectral peak frequency). When the moving speed of the typhoon is close to the wave group’s propagation speed, the typhoon’s swell is captured, causing the wind wave to resonate with the propagated swell from the previous moment [31,51]. As the moving speed of the typhoon further strengthens, the wave group lags behind the typhoon, there is no swell propagation in the front quadrant, and the maximum significant wave height decreases. Different from the spectrum of the fetch-limited wind wave, the actual typhoon is rotatable and unsteady and there is a certain angle between the wind wave and the swell direction. Xu et al. [48] believe that when the wind speed is less than 35 m s−1, the area less than 5 Rmax away from the typhoon center is the main functional zone of the typhoon; wind waves are generally the dominant waves, and the wave energy conforms to the fetch-limited theory, while it is underestimated by it when dominated by swells ( v > 0.13). Based on the above considerations, a comparison was performed between the wave age U10/Cp defined by the fetch-limited theory and the criteria used by the model, i.e., the relative wave age U 10 / C p   c o s ( θ p θ w ) in Figure 10. The waves in the right–rear quadrant spread to the northeast, while those in the right and left–forward quadrants propagate to the northwest since the wind rotates counterclockwise. When the component of the wave velocity in the wind direction is negative, i.e., the wind speed intersects with the wave velocity at an obtuse angle, U10/Cp can no longer be used to describe the relative strength of wind waves and swells. For example, in the left–forward quadrant at 2.5 Rmax, where the angle of intersection between the wind direction and wave direction exceeds 90°, the wind does not contribute much to the TWs’ energy, as shown in Figure 8h. For Typhoon Mangkhut, the values of the relative wave age reveal that the waves are mainly dominated by the wind seas on the right side of the typhoon’s movement direction, while the other side is dominated by swells, which can also be seen from Figure 8 and Figure 9.
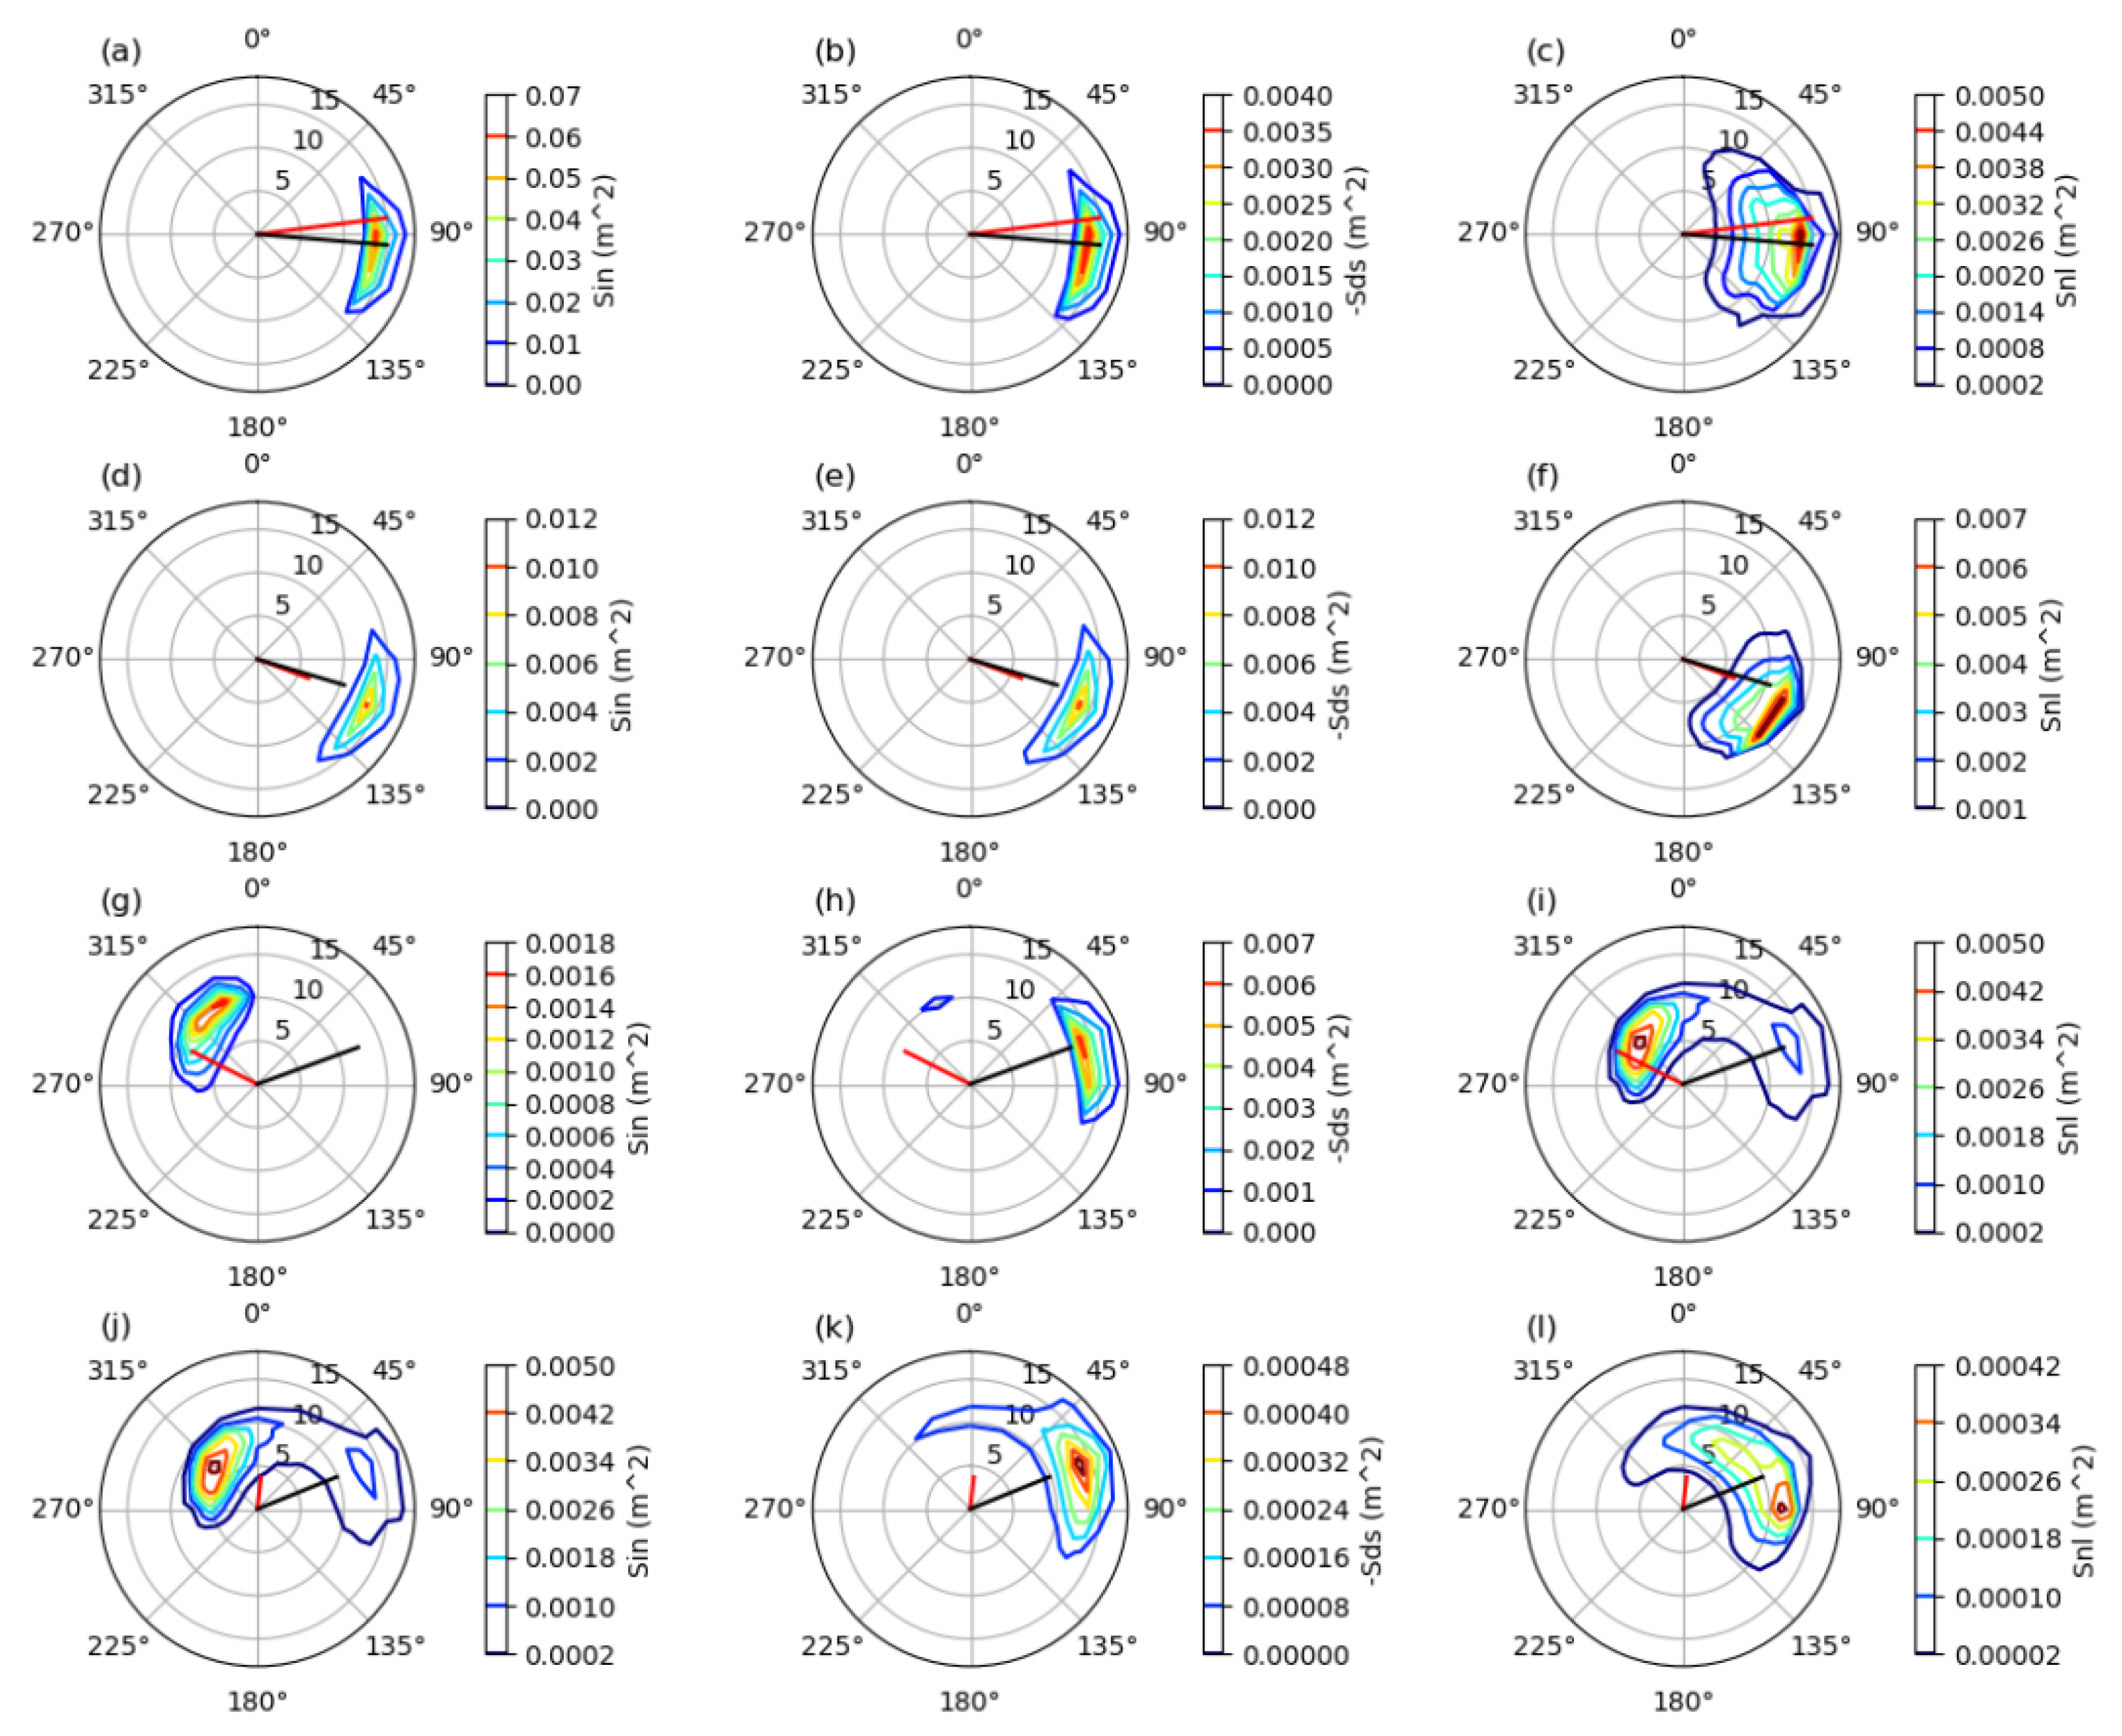
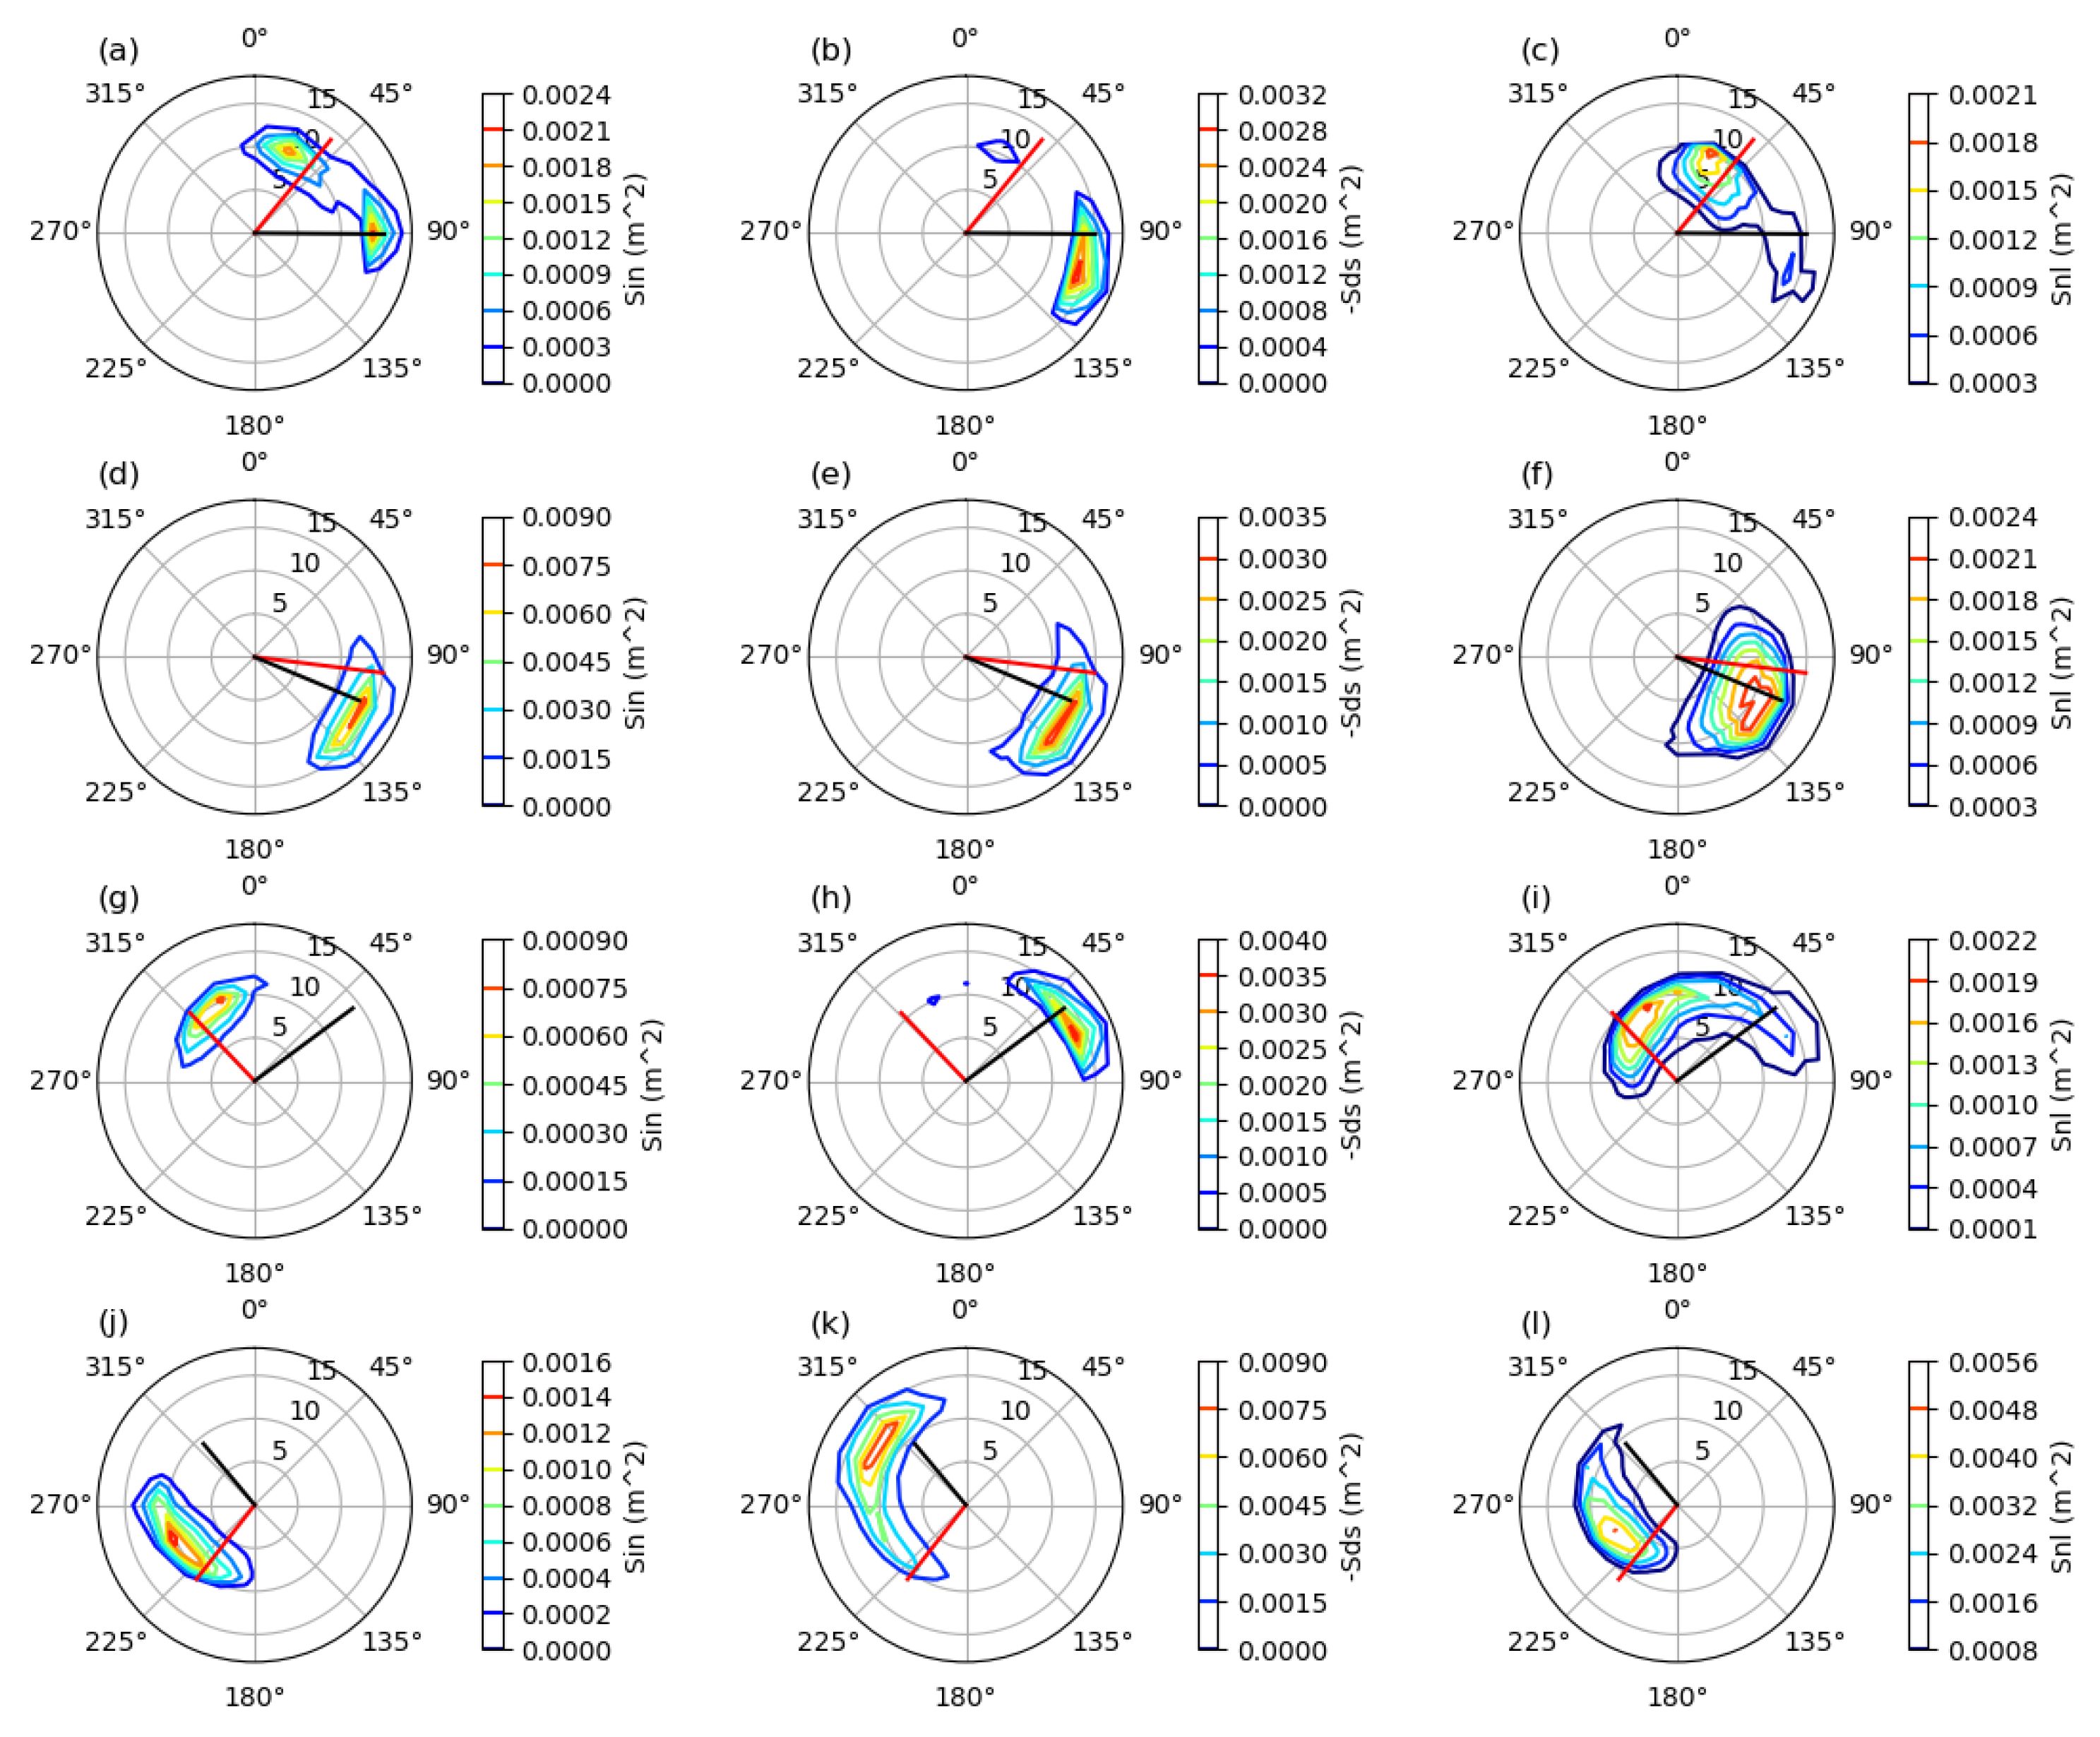
The temporal and spatial variation of the wave energy spectrum is mainly determined by the source terms. In the deep sea, the wind input term Sin, the whitecap dissipation term Sds, and the fourth-order wave–wave nonlinear interaction term Snl are mainly considered. Figure 11 and Figure 12 show the source term spectra in the four quadrants of 2.5 Rmax and 7.5 Rmax away from the typhoon center. The directional spectrum distributions of all source terms are similar in the right–forward quadrant (Figure 11a–c), right–rear quadrant at 2.5 Rmax (Figure 11d–f), and right–rear quadrant at 7.5 Rmax (Figure 12d–f), where the wave direction approximately aligns with the wind direction and propagates slower than the wind, i.e., the values of U 10   c o s ( θ p θ w ) C p are greater than zero, as shown in Table 1. This fits with the understanding of the extended fetch mentioned before. The Sin values in these regions are larger than that where there is an energy adjustment process from high to low frequencies in the two-dimensional directional spectrum of Snl (Figure 11i,l and Figure 12c,i,l). This process of energy balance causes the spectrum to appear smooth, which is called an “energy ridge” by Tamizi et al. [30]. The high-frequency peak corresponds to the locally generated wind sea, with a peak wave period Tp generally less than 10 s, and the low-frequency peak is consistent with the remotely generated swells whose peak wave periods are between 13 s and 15 s. Taking Figure 11i as an example, referring to Figure 8d–f, the peak wave period of the higher-frequency wind sea is 9.6 s, and the peak wave period of the lower-frequency swell is 13.9 s. This scenario, in which the “energy ridge” occurs, can be divided into two cases. In one, the wave group outruns the storm at a direction of less than 90°, which means that the values of U 10   c o s ( θ p θ w ) C p are negative, while the values of c o s ( θ p θ w ) are positive. Under this condition, the wind input Sin also exhibits a continued downshift in frequency like the wave–wave nonlinear interactions, as shown in Figure 11j and Figure 12a. This is because, in addition to generating wind seas directly, the atmosphere can input energy into the sea surface through resonance and coupling mechanisms in a nonlinear way when the wave age is relatively young; thus, the remotely generated swell can continue to grow. The energy transition also appears in the same continuous form (ridge) as the wave–wave nonlinear interactions. In the other case, where the angle of intersection between the wind direction and the wave direction exceeds 90°, the wind inputs only produce a local wind sea and will no longer have any effect on the swell (Figure 11g and Figure 12g,j). The wave–wave nonlinear interactions are the only source that balances the energy of the wind sea and remotely generated swell to ensure a unimodal TW energy spectrum. Moreover, the waves in these regions stay in the strong wind for a shorter period of time (as opposed to the extended fetch); as a result, the wind input Sin is relatively smaller than in the other regions. The dissipation Sds contributes less to maintaining a unimodal wave spectral distribution, and its magnitude depends on the steepness of the wave and the momentum input of the wave’s windward side.

4. Discussion and Conclusions

The synthesized wind field of the revised H10 wind and NCEP wind can effectively simulate wind speeds during typhoons. Driven by this, the time series of significant wave heights simulated by MIKE21 SW are basically consistent with the measured values of the buoys. This paper simulates the wave response process and analyzes the energy balance mechanism of a supertyphoon, namely Mangkhut.
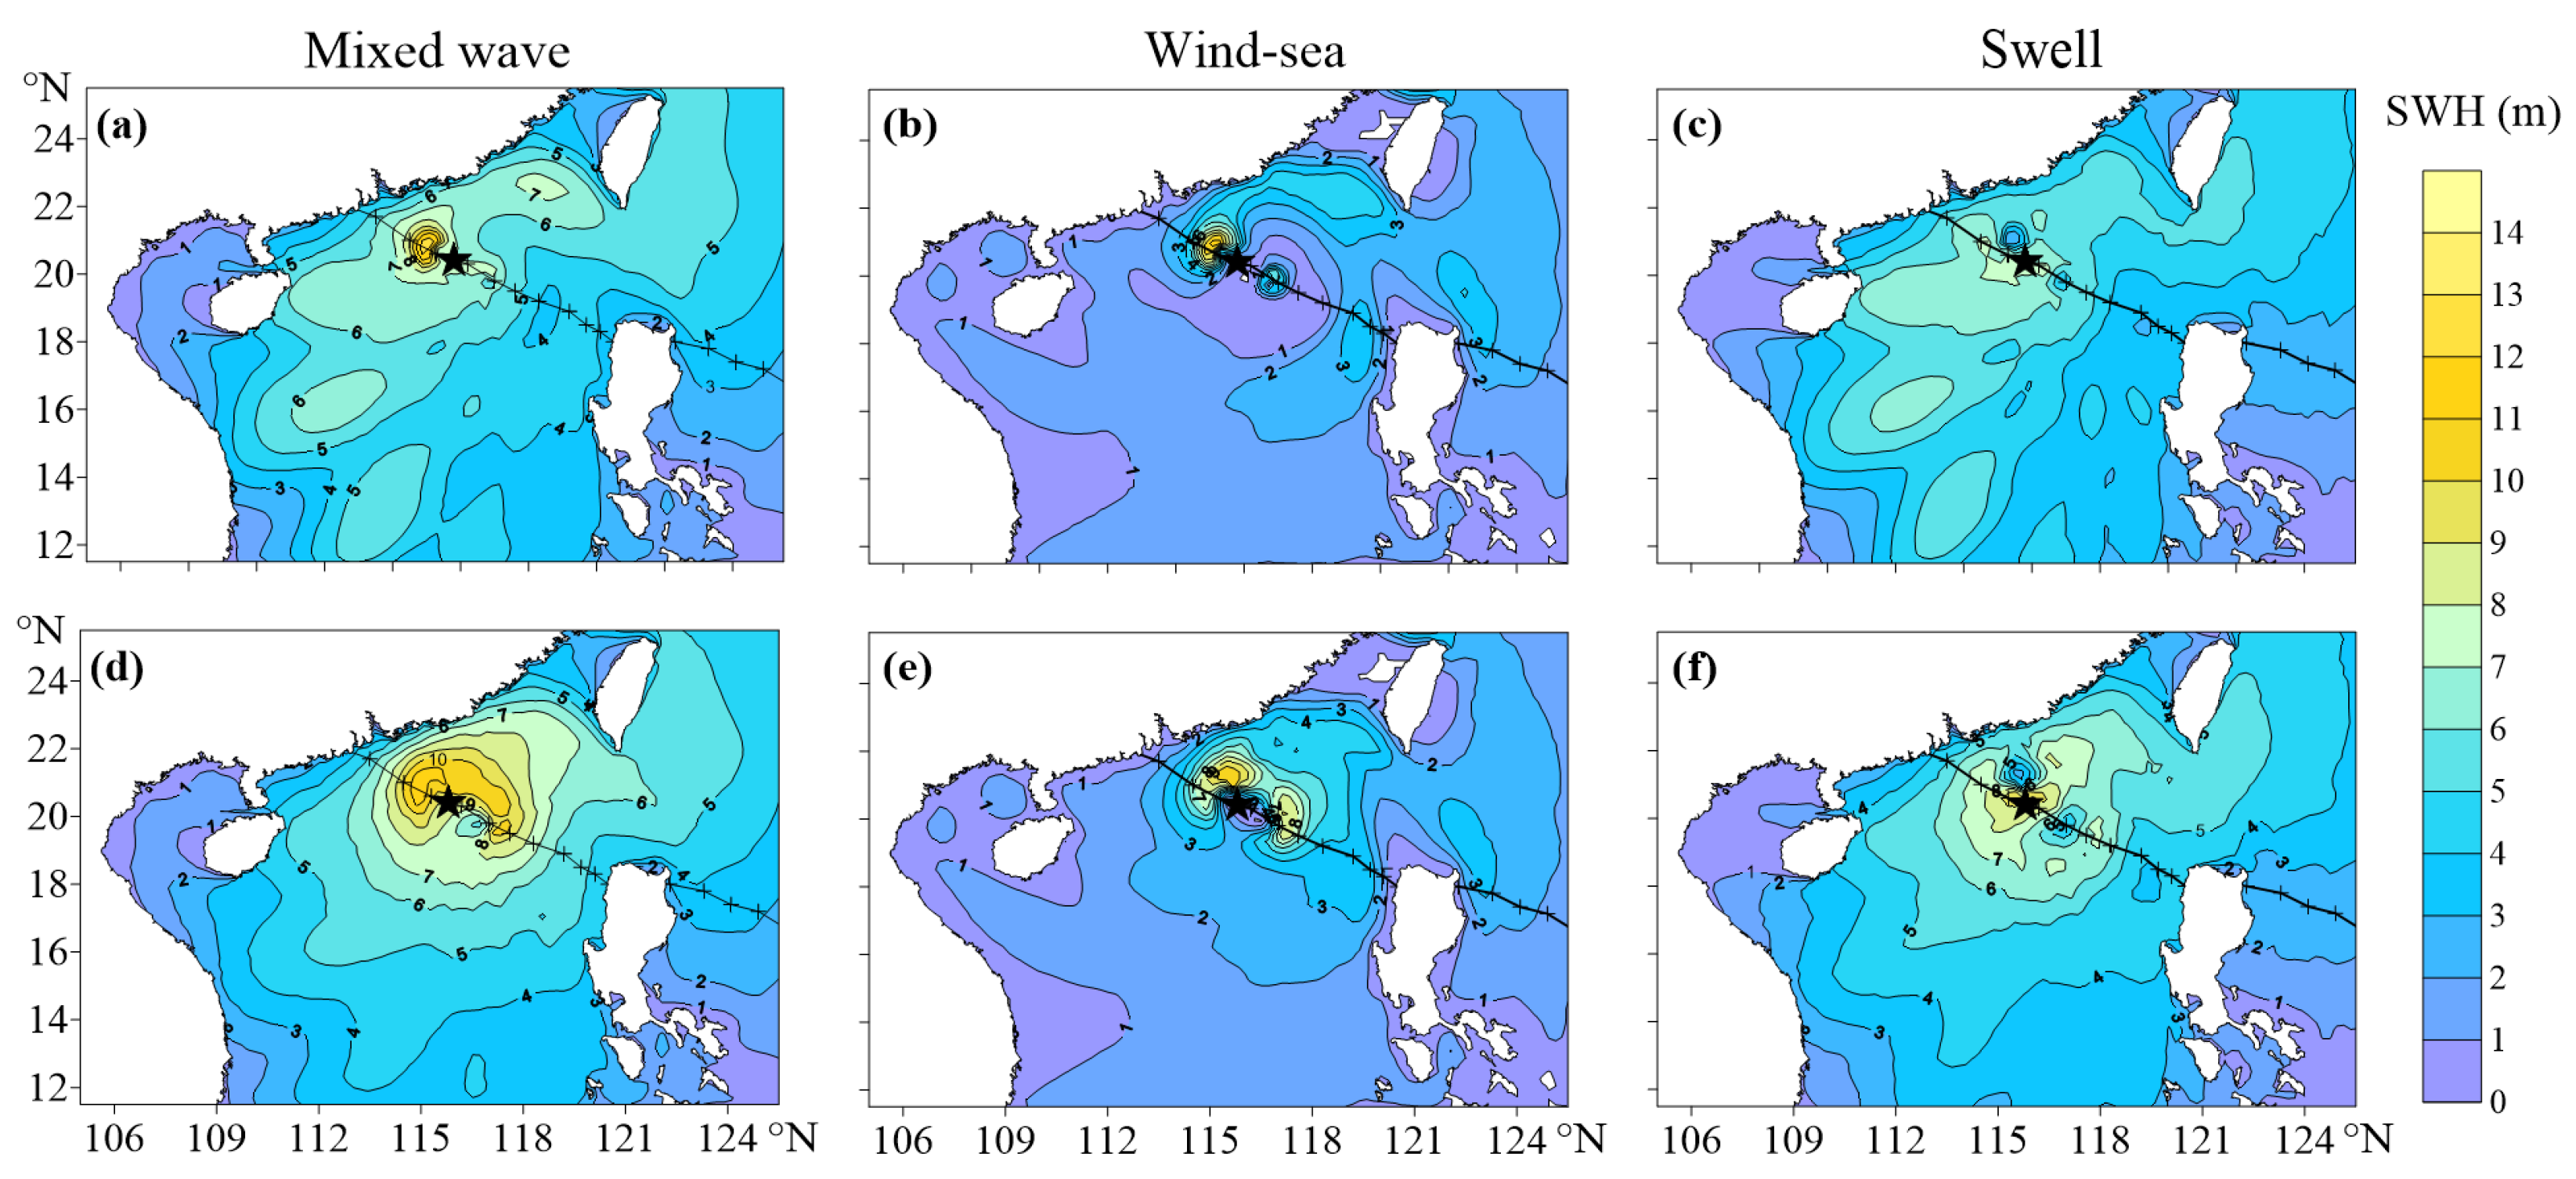
The typhoon waves mainly change with the relative position and orientation to the typhoon center and have a spatially asymmetric structure. According to Liu et al. [23], even in the case of symmetrical wind fields, the typhoon’s translation will contribute to the asymmetric structure of the wave field. The total contribution depends on the intensity of the typhoon. As the intensity of the typhoon increases, the relative significance of the influence of the translation speed on the asymmetric structure of the wave field decreases. In this article, a synthetic wind field combined with the symmetric wind field proposed by Holland [20] and the NCEP wind field is also constructed. The simulated typhoon waves shown in Figure 13d–f confirm that, due to the translation of typhoons, the generated waves caused by the symmetric wind field have an asymmetric structure as well. This asymmetry in the TWs with respect to the wind field can be explained by the concept of “extended” or “trapped” fetch mentioned before [51,52,53]. In this representation, waves generated to the right (northern hemisphere) of the typhoon center propagate forward with the storm and hence stay in the strong wind region for an extended period (the extended fetch), and the opposite will occur at the left of the storm. For a strong typhoon like Mangkhut, the degree of asymmetry of the wave field is greater than the wind field, which can result in a large-scale reduction in the wind waves in the left–rear quadrant (Figure 13b). Moreover, the extreme SWH of the wind sea is stronger than the swell, while the influence range of the wind wave is smaller than that of the swell. This is because the wind wave rapidly decays with the distance to the typhoon center.
The criterion of the wave age U10/Cp = 0.83, as proposed by the limited fetch theory, cannot distinguish the wind seas and swells very well, especially when the component of the wave velocity is negative in the wind direction, which was also found by Xu et al. [48] and Tamizi et al. [30]. This is because the typhoon simulated in this paper is rotatable and moves unsteadily, and the local wind seas may intersect with the remotely generated swells at a certain angle. Based on the relative wave age of U10/Cp c o s ( θ p θ w ) = 0.83, the waves are mainly dominated by the wind seas on the right side of the typhoon’s movement direction, while the other side is dominated by swells. This conforms to the understanding that an extended fetch exists to the right of the storm, and a shortened fetch occurs on the left.
The nonlinear wave–wave interactions transfer the energy from local wind seas at a high frequency (Tp < 10 s) to remotely generated swells at a low frequency (13 s < Tp < 15 s) in regions without an extended fetch. This process smooths the spectrum, which forms a ridge. When the angle between the waves and winds exceeds 90°, the typhoon will not only have no effect on the swells but will also bring negative effects, i.e., causing the waves to stay under intense winds for a shorter period of time. Such nonlinear wave–wave interactions are the only source of energy redistribution under this condition. However, when the angle between the waves and winds is less than 90° and the wave group runs faster than the typhoon, the wind input appears to transfer in a continuous downshift in frequency, as with the nonlinear interactions between the waves. This is because, in addition to local wind seas, wind energy is also further input to the remotely generated swells.
Although there have been many studies on directional wave spectra and source terms, few have further linked the concept of limited fetch to the source terms. Young [27] and Tamizi et al. [30] stated that the nonlinear terms contribute to a continuous energy transfer from high-frequency wind seas to remotely generated low-frequency waves, even if they are separated by more than 90°. The essence of this feature seems to be that the energy transfer by nonlinear wave–wave interactions occurs when the waves are not in a trapped fetch. Moreover, this paper points out that there is a smooth energy adjustment process for the wind energy input when the waves outrun the typhoon.
Of course, it is also necessary to recognize the shortcomings of this work, i.e., the results of this article represent a case analysis of the waves generated by Typhoon Mangkhut. More cases are needed to support the conclusions above. In addition, the wave buoys are used here for the first time for experimental observation, and there are still issues, such as halts in their operation for certain periods for unknown reasons and missing original spectral data.

Author Contributions

Conceptualization, M.H.; methodology, Y.Y. and M.H.; validation, Y.N.; formal analysis, Y.Y.; investigation, M.H. and Y.N.; writing—original draft preparation, Y.Y.; writing—review and editing, M.H. and C.Q.; funding acquisition, M.H. and Y.Y. All authors have read and agreed to the published version of the manuscript.

Funding

This research was funded by the China Geological Survey (CGS; No. DD20242792); Guangxi Key Research and Development Program (GuiKeAB22035065); and Environmental Protection Bureau of Liwan District, Guangzhou (PM-hx002-202310-0489).

Institutional Review Board Statement

Not applicable.

Informed Consent Statement

Not applicable.

Data Availability Statement

The best track of Typhoon Mangkhut is available at https://tcdata.typhoon.org.cn/zjljsjj.html (accessed on 26 September 2024). The newest version of MIKE21 is available for download at https://www.mikepoweredbydhi.com/download/mike-2024 (accessed on 26 September 2024). The NCEP wind fields are available at https://rda.ucar.edu/datasets/d094000/ (accessed on 26 September 2024). The SAR wind fields are available at https://cyclobs.ifremer.fr/app/tropical (accessed on 26 September 2024). The observed wind fields from NOAA are available at https://www.ncei.noaa.gov/maps/daily/ (accessed on 26 September 2024).

Acknowledgments

We thank the crews of the Hai Yang Di Zhi Shi Hao ship for their great efforts in wave buoy deployment on the No. 201809 cruise.

Conflicts of Interest

The authors have no conflicts of interest to declare.

References

  1. Forristall, G.Z.; Ward, E.G.; Cardone, V.J.; Borgmann, L.E. The directional spectra and kinematics of surface gravity waves in Tropical Storm Delia. J. Phys. Oceanogr. 1978, 8, 888–909. [Google Scholar] [CrossRef]
  2. Wright, C.W.; Walsh, E.J.; Vandemark, D.; Krabill, W.B.; Garcia, A.W.; Houston, S.H.; Powell, M.D.; Black, P.G.; Marks, F.D. Hurricane directional wave spectrum spatial variation in the open ocean. J. Phys. Oceanogr. 2001, 31, 2472–2488. [Google Scholar] [CrossRef]
  3. Walsh, E.J.; Wright, C.W.; Vandemark, D.; Krabill, W.B.; Garcia, A.W.; Houston, S.H.; Murillo, S.T.; Powell, M.D.; Black, P.G.; Marks, F.D. Hurricane directional wave spectrum spatial variation at landfall. J. Phys. Oceanogr. 2002, 32, 1667–1684. [Google Scholar] [CrossRef]
  4. Babovic, V.; Sannasiraj, S.A.; Chan, E.S. Error correction of a predictive ocean wave model using local model approximation. J. Mar. Syst. 2005, 53, 1–17. [Google Scholar] [CrossRef]
  5. Jain, P.; Deo, M.C. Real-time wave forecasts off the western Indian coast. Appl. Ocean Res. 2007, 29, 72–79. [Google Scholar] [CrossRef]
  6. Hwang, P.A.; Fan, Y. Effective fetch and duration of tropical cyclone wind fields estimated from simultaneous wind and wave measurements: Surface wave and air–sea exchange computation. J. Phys. Oceanogr. 2017, 47, 447–470. [Google Scholar] [CrossRef]
  7. Young, I.R. A review of parametric descriptions of tropical cyclone wind-wave generation. Atmosphere 2017, 8, 194. [Google Scholar] [CrossRef]
  8. Grossmann-Matheson, G.; Young, I.R.; Alves, J.; Meucci, A. Development and validation of a parametric tropical cyclone wave height prediction model. Ocean Eng. 2023, 283, 115353. [Google Scholar] [CrossRef]
  9. Ou, S.-H.; Liau, J.-M.; Hsu, T.-W.; Tzang, S.-Y. Simulating typhoon waves by SWAN wave model in coastal waters of Taiwan. Ocean Eng. 2002, 29, 947–971. [Google Scholar] [CrossRef]
  10. Rogers, W.E.; Kaihatu, J.M.; Hsu, L.; Jensen, R.E.; Dykes, J.; Holland, K.T. Forecasting and hindcasting waves with the SWAN model in the Southern California Bight. Coast. Eng. 2007, 54, 1–15. [Google Scholar] [CrossRef]
  11. Divinsky, B.V.; Kosyan, R.D. Parameters of wind seas and swell in the Black Sea based on numerical modeling. Oceanologia 2018, 60, 277–287. [Google Scholar] [CrossRef]
  12. Fonseca, R.B.; Gonçalves, M.; Guedes Soares, C. Comparing the performance of spectral wave models for coastal areas. J. Coast. Res. 2017, 33, 331–346. [Google Scholar] [CrossRef]
  13. Tang, J.; Shi, J.; Li, X.; Deng, B.; Jing, M. Numerical simulation of typhoon waves with typhoon wind model. Trans. Oceanol. Limnol. 2013, 2, 24–30. [Google Scholar]
  14. Allahdadi, M.N.; Chaichitehrani, N.; Allahyar, M.; McGee, L. Wave Spectral Patterns during a Historical Cyclone: A Numerical Model for Cyclone Gonu in the Northern Oman Sea. Open J. Fluid Dyn. 2017, 7, 131–151. [Google Scholar] [CrossRef]
  15. Pan, D.; Wan, J.; Zhou, C. Numerical simulation of wave based on Typhoon Mangkhut. J. Waterw. Harb. 2021, 42, P194–P199. (In Chinese) [Google Scholar]
  16. Xu, F.; Perrie, W.; Toulany, B.; Smith, P.C. Wind-generated waves in Hurricane Juan. Ocean Model. 2007, 16, 188–205. [Google Scholar] [CrossRef]
  17. Holland, J.G. An analytic model of the wind and pressure profiles in hurricanes. Mon. Weather Rev. 1980, 108, 1212–1218. [Google Scholar] [CrossRef]
  18. Willoughby, H.E.; Darling, R.W.R.; Rahn, M.E. Parametric representation of the primary hurricane vortex. Part II: A new family of sectionally continuous profiles. Mon. Weather Rev. 2006, 134, 1102–1120. [Google Scholar] [CrossRef]
  19. Holland, J.G. A revised hurricane pressure–wind model. Mon. Weather Rev. 2008, 136, 3432–3445. [Google Scholar] [CrossRef]
  20. Holland, J.G.; Belanger, I.J.; Fritz, A. A revised model for radial profiles of hurricane winds. Mon. Weather Rev. 2010, 12, 4393–4401. [Google Scholar] [CrossRef]
  21. Lin, N.; Chavas, D. On hurricane parametric wind and applications in storm surge modeling. J. Geophys. Res. Atmos. 2012, 117, D09120. [Google Scholar] [CrossRef]
  22. Xie, L.; Bao, S.; Pietrafesa, L.J.; Foley, K.; Fuentes, M. A real-time hurricane surface wind forecasting model: Formulation and verification. Mon. Weather Rev. 2006, 134, 1355–1370. [Google Scholar] [CrossRef]
  23. Liu, H.; Xie, L.; Pietrafesa, L.J.; Bao, S. Sensitivity of wind waves to hurricane wind characteristics. Ocean Model. 2007, 18, 37–52. [Google Scholar] [CrossRef]
  24. Zhang, J.; Uhlhorn, E.W. Hurricane sea surface inflow angle and an observation-based parametric model. Mon. Weather Rev. 2012, 140, 3587–3605. [Google Scholar] [CrossRef]
  25. Tamizi, A.; Young, I.R.; Ribal, A.; Alves, J.-H. Global scatterometer observations of the structure of tropical cyclone wind fields. Mon. Weather Rev. 2020, 148, 4673–4692. [Google Scholar] [CrossRef]
  26. Moon, I.J.; Ginis, I.; Hara, T.; Tolman, H.L.; Wright, C.W.; Walsh, E.J. Numerical simulation of sea surface directional wave spectra under Hurricane wind forcing. J. Phys. Oceanogr. 2003, 33, 1680–1706. [Google Scholar] [CrossRef]
  27. Young, I.R. Directional spectra of hurricane wind waves. J. Geophys. Res. 2006, 111, C8020. [Google Scholar] [CrossRef]
  28. Hu, K.; Chen, Q. Directional spectra of hurricane-generated waves in the Gulf of Mexico. Geophys. Res. Lett. 2011, 38, L19608. [Google Scholar] [CrossRef]
  29. Tamizi, A.; Young, I.R. The Spatial Distribution of Ocean Waves in Tropical Cyclones. J. Phys. Oceanogr. 2020, 50, 2123–2139. [Google Scholar] [CrossRef]
  30. Tamizi, A.; Alves, J.H.; Young, I.R. The Physics of Ocean Wave Evolution within Tropical Cyclones. J. Phys. Oceanogr. 2021, 7, 2373–2388. [Google Scholar] [CrossRef]
  31. King, D.B.; Shemdin, O.H. Radar observations of hurricane wave directions. In Proceedings of the 16th International Conference on Coastal Engineering, Hamburg, Germany, 27 August–3 September 1978. [Google Scholar]
  32. Young, I.R. Observations of the spectra of hurricane generated waves. Ocean Eng. 1998, 25, 261–276. [Google Scholar] [CrossRef]
  33. Li, M.; He, Y.; Liu, G. Atmospheric and oceanic responses to Super Typhoon Mangkhut in the South China Sea: A coupled CROCO-WRF simulation. J. Oceanol. Limnol. 2023, 41, 1369–1388. [Google Scholar] [CrossRef]
  34. Wu, Z.; Gao, K.; Chen, J.; Zhang, H.; Deng, B.; Jiang, C.; Liu, Y.; Lyu, Z.; Yan, R. Typhoon-induced ocean waves and stokes drift: A case study of Typhoon Mangkhut (2018). China Ocean Eng. 2024, 38, 711–724. [Google Scholar] [CrossRef]
  35. Zhang, Z.; Song, Z.; Zhang, D.; Hu, D.; Yu, Z.; Yue, S. Tide–surge interactions in Lingdingyang Bay, Pearl River Estuary, China: A case study from Typhoon Mangkhut, 2018. Estuaries Coasts 2024, 47, 330–351. [Google Scholar] [CrossRef]
  36. Komen, G.J.; Cavaleri, L.; Doneland, M.; Hasselmann, K.; Hasselmann, S.; Janssen PA, E.M. Dynamics and Modelling of Ocean Waves; Cambridge University Press: Cambridge, UK, 1994. [Google Scholar]
  37. Young, I.R. Wind Generated Ocean Waves; Elsevier Ocean Engineering Book Series; Bhattacharyya, R., McCormick, M.E., Eds.; Elsevier: Amsterdam, The Netherlands, 1999; Volume 2. [Google Scholar]
  38. Ris, R.C. Spectral Modelling of Wind Waves in Coastal Areas. Ph.D. Thesis, Delft University of Technology, Delft, The Netherlands, 1997. [Google Scholar]
  39. Janssen PA, E.M. Quasi-linear theory of wind wave generation applied to wave forecasting. J. Phys. Oceanogr. 1991, 21, 1631–1642. [Google Scholar] [CrossRef]
  40. Hasselmann, K. On the spectral dissipation of ocean waves due to white capping. Bound.-Layer Meteorol. 1974, 6, 107–127. [Google Scholar] [CrossRef]
  41. Janssen PA, E.M. Wave induced stress and the drag of airflow over sea waves. J. Phys. Oceanogr. 1989, 19, 745–754. [Google Scholar] [CrossRef]
  42. Hasselmann, S.; Hasselmann, K. Computation and parameterizations of non-linear energy transfer in a gravity-wave spectrum, part 1: A new method for efficient computations of the exact non-linear transfer integral. J. Phys. Oceanogr. 1985, 15, 1369–1377. [Google Scholar] [CrossRef]
  43. Komen, G.J.; Hasselmann, K.; Hasselmann, K. On the existence of a fully developed wind-sea spectrum. J. Phys. Oceanogr. 1984, 14, 1271–1285. [Google Scholar] [CrossRef]
  44. Schloemer, R.W. Analysis and Synthesis of Hurricane Wind Patterns over Lake Okechobee, Florida; Hydromet. Rep. 31; US Department of Commerce: Washington, DC, USA, 1954.
  45. Kalourazi, M.Y.; Siadatmousavi, S.M.; Yeganeh-Bakhtiary, A.; Jose, F. WAVEWATCH-III source terms evaluation for optimizing hurricane wave modeling: A case study of Hurricane Ivan. Oceanologia 2021, 63, 194–213. [Google Scholar] [CrossRef]
  46. Carr, L.E., III; Elsberry, R.L. Models of tropical cyclone wind distribution and Beta-effect propagation for application to tropical cyclone track forecasting. Mon. Weather Rev. 1997, 125, 3190–3209. [Google Scholar] [CrossRef]
  47. Zhang, Z.; Qi, Y.; Shi, P.; Li, C. Application of an optimal interpolation wave assimilation method in South China Sea. J. Trop. Oceanogr. 2003, 4, 34–41. (In Chinese) [Google Scholar]
  48. Xu, Y.; He, H.; Song, J.; Hou, Y.; Li, F. Observations and modeling of typhoon waves in the South China Sea. J. Phys. Oceanogr. 2017, 47, 1307–1324. [Google Scholar] [CrossRef]
  49. Donelan, M.A.; Hamilton, J.; Hui, W.H. Directional spectra of wind-generated waves. Philos. Trans. R. Soc. Lond. Ser. A 1985, 315, 509–562. [Google Scholar]
  50. Hasselmann, K.; Barnett, T.P.; Bouws, E.; Carlson, H.; Cartwright, D.E.; Enke, K.; Ewing, J.A.; Gienapp, A.; Hasselmann, D.E.; Kruseman, P.; et al. Measurements of wind wave growth and swell decay during the Joint North Sea Wave Project (JONSWAP). Dtsch. Hydrogr. Z. 1973, 8A, 95. [Google Scholar]
  51. Young, I.R. Parametric hurricane wave prediction model. J. Waterw. Port Coast. Ocean Eng. 1988, 114, 637–652. [Google Scholar] [CrossRef]
  52. Young, I.R.; Burchell, G.P. Hurricane generated waves as observed by satellite. Ocean Eng. 1986, 23, 761–776. [Google Scholar] [CrossRef]
  53. Young, I.R.; Vinoth, J. An ‘extended fetch’ model for the spatial distribution of tropical cyclone wind-waves as observed by altimeter. Ocean Eng. 2013, 70, 14–24. [Google Scholar] [CrossRef]
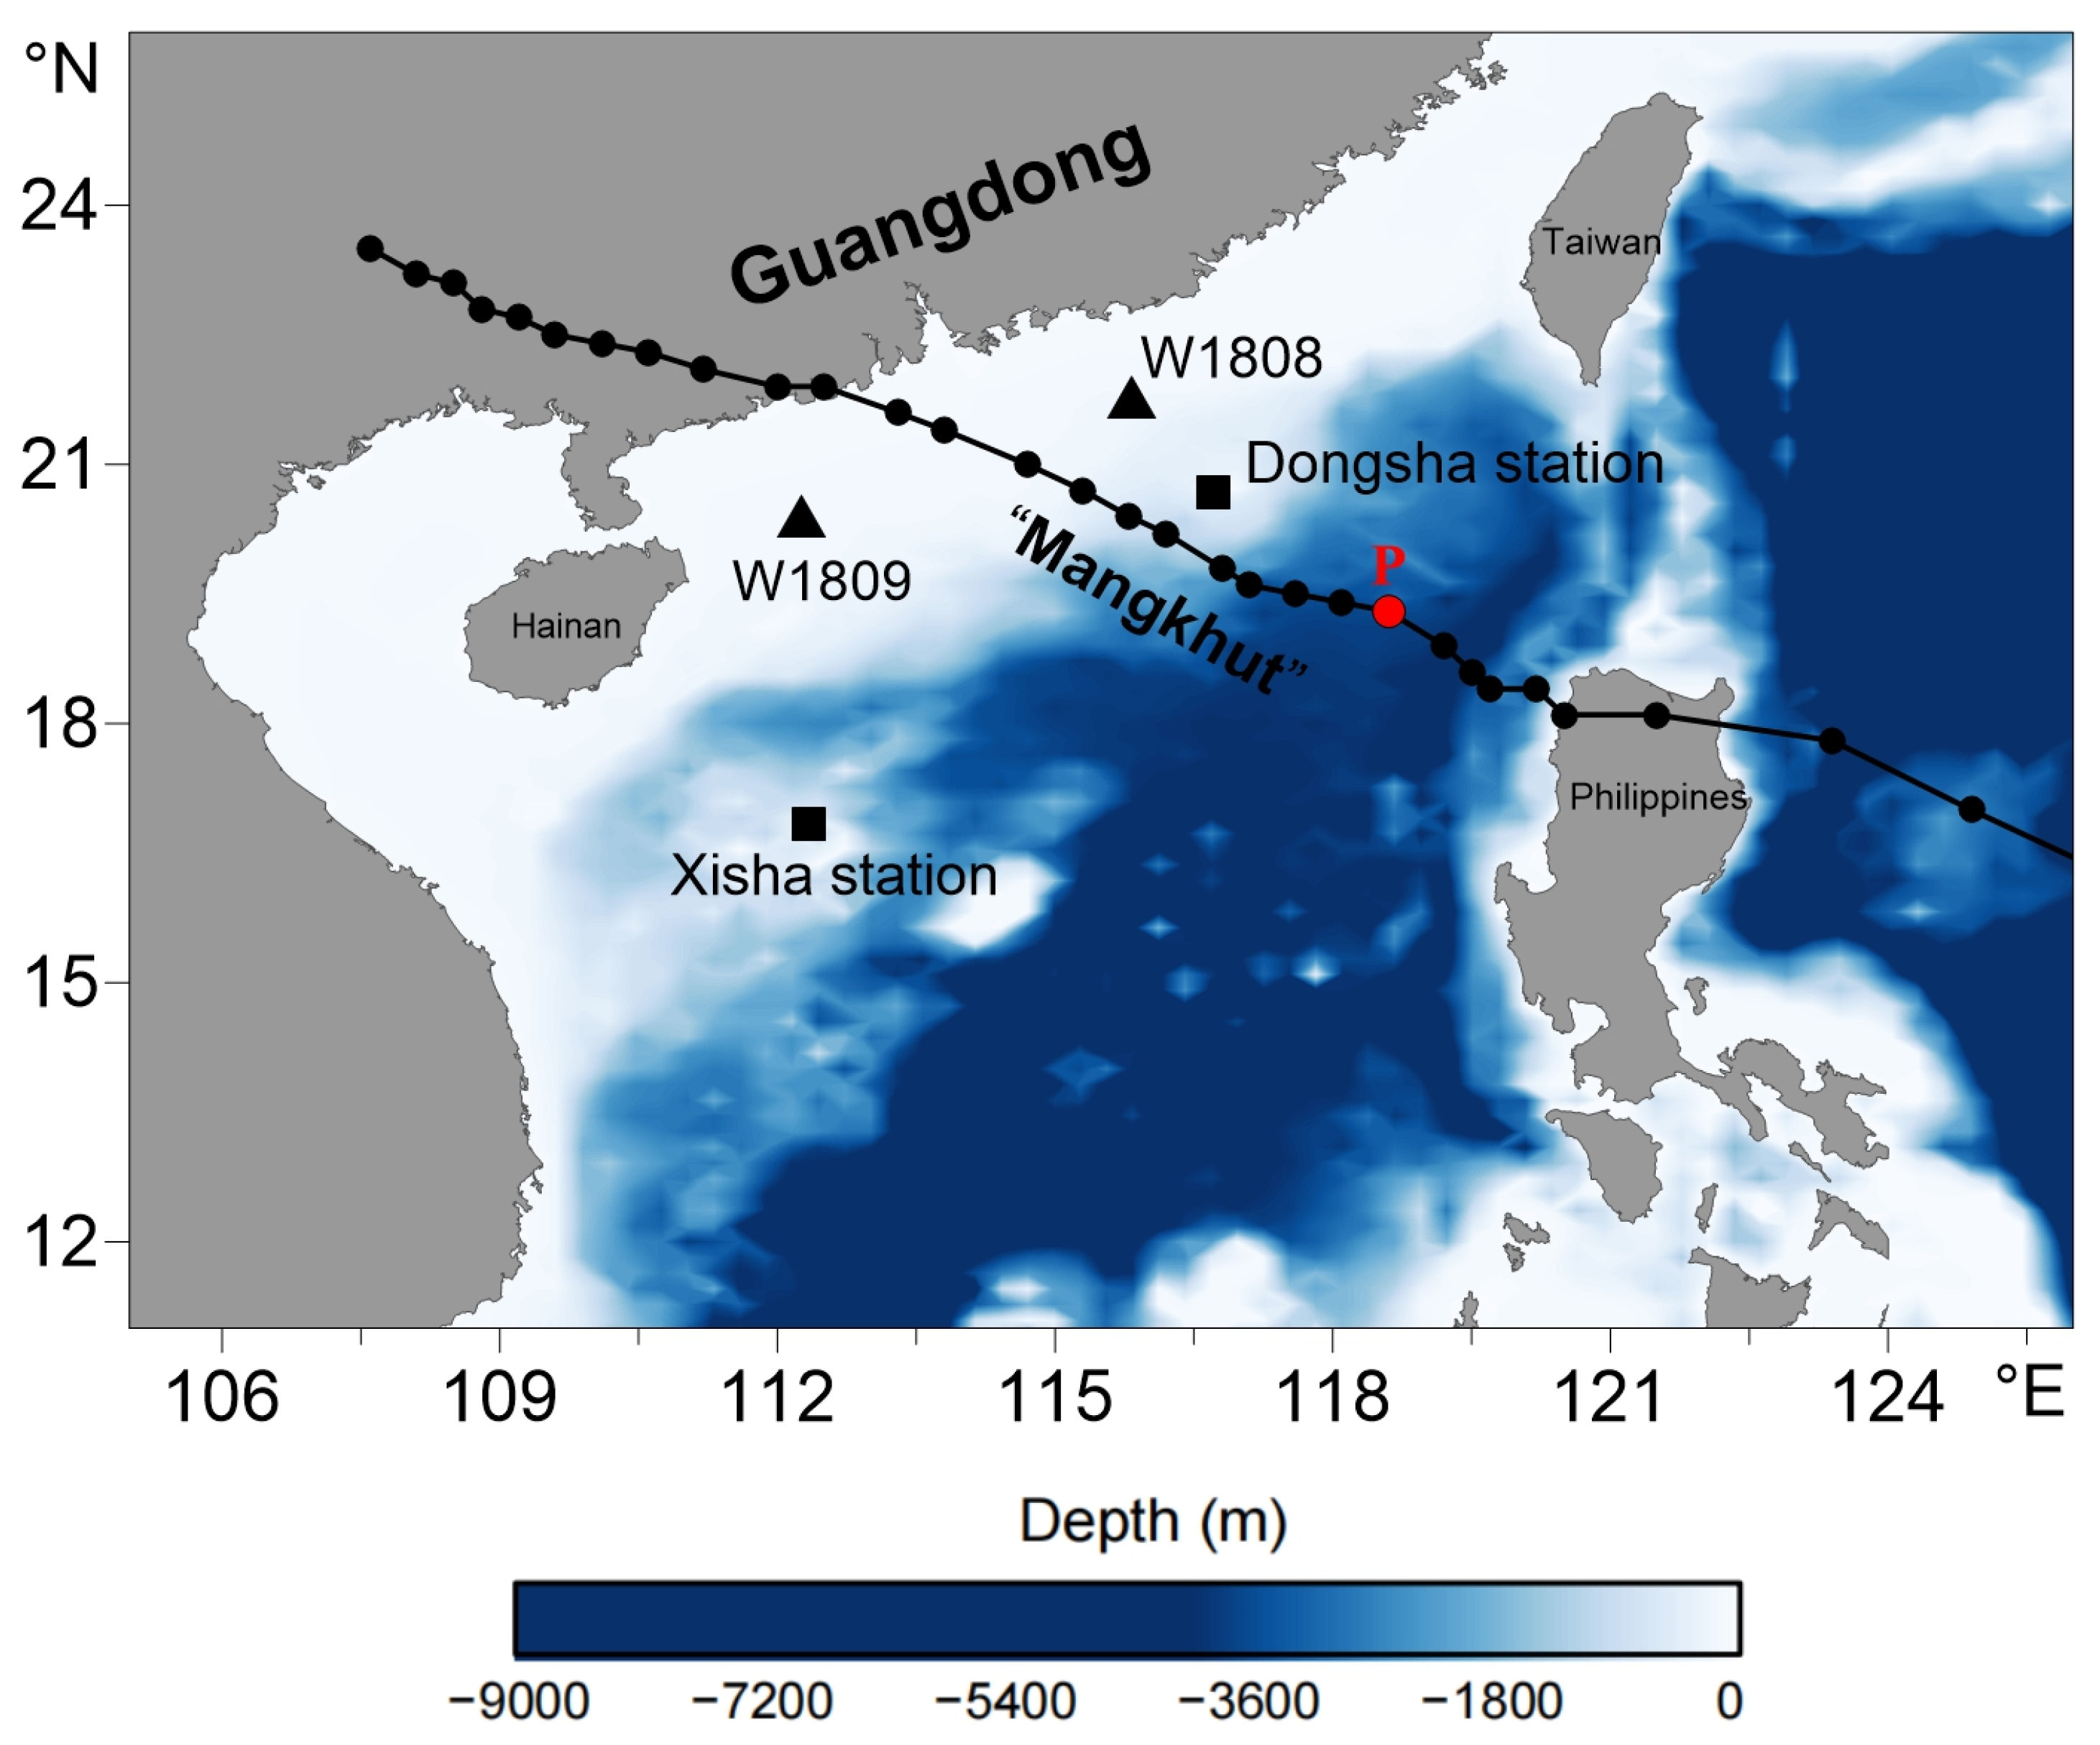
Figure 1. The regional water depth, the typhoon’s best track (solid black dots), the wave buoy stations (triangle marks), and the wind observation stations (square marks). The red solid mark is a characteristic point used to analyze the typhoon wave directional spectrum.
Atmosphere 15 01174 g001
Figure 2. A model diagram for the construction of a synthetic wind field.
Atmosphere 15 01174 g002
Figure 3. (a) The typhoon wind field from the revised H10 wind model, (b) the NCEP reanalysis wind field, (c) the synthetic wind field, and (d) the SAR wind field.
Atmosphere 15 01174 g003
Figure 4. Comparison of the (a,b) wind speed and (c,d) wind direction from the synthetic (blue line), measured (red line), and NCEP (black line) wind fields. The left and right columns correspond to the Xisha and Dongsha islands, respectively.
Atmosphere 15 01174 g004
Figure 5. Comparison of the simulated and measured (a,b) significant wave height, (c,d) mean wave period, and (e,f) mean wave direction. The left and right columns correspond to the positions of wave buoys W1808 and W1809, respectively.
Atmosphere 15 01174 g005
Figure 6. Spatial distribution of SWH (left) and MWP (right) during the typhoon’s (a,b) generation, (c,d) propagation, and (e,f) landfall.
Atmosphere 15 01174 g006
Figure 7. The simulated time series of (a,b) the distance Dr and relative angle θr from the buoys to the typhoon center, (c,d) the wind speed at 10 m height U10 and wind direction θw, (e,f) the significant wave height, (g,h) the mean wave period, and (i,j) the mean wave direction for the simulated wind sea and swell components in the typhoon waves. The left and right columns correspond to the W1808 and W1809 stations, respectively.
Atmosphere 15 01174 g007
Figure 8. The two-dimensional energy spectra of the total wave Et (left), the wind sea Ew (middle), and the swell Es (right) in (ac) station Prf, (df) station Prr, (gi) station Plf, and (jl) station Plr at 2.5 Rmax from the typhoon center. The solid black line corresponds to the wave direction, the solid red line corresponds to the wind direction, and the line length represents the relative magnitude of the wind speed and significant wave height.
Atmosphere 15 01174 g008
Figure 9. The two-dimensional energy spectra of the total wave Et (left), the wind sea Ew (middle), and the swell Es (right) in (ac) station Prf, (df) station Prr, (gi) station Plf, and (jl) station Plr at 7.5 Rmax from the typhoon center. The solid black line corresponds to the wave direction, the solid red line corresponds to the wind direction, and the line length represents the relative magnitude of the wind speed and significant wave height.
Atmosphere 15 01174 g009
Figure 10. The spatial distribution of (a) the wave age, U 10 / C p , and (b) U 10 / C p   c o s ( θ p θ w ) . The data are projected onto a frame with the typhoon’s forward direction as 0°, and the typhoon center is the origin. The solid black arrow indicates the relative wave direction, and the solid magenta arrow is the relative wind direction. The length of the coordinate axis is based on the maximum wind speed radius.
Atmosphere 15 01174 g010
Figure 11. The spectra of the wind input term Sin (left), the whitecap dissipation term Sds (middle), and the nonlinear interaction term Snl (right) in (ac) station Prf, (df) station Prr, (gi) station Plf, and (jl) station Plr at 2.5 Rmax from the typhoon center. The solid black line corresponds to the wave direction, the solid red line corresponds to the wind direction, and the line length represents the relative size of the wind speed and the significant wave height.
Atmosphere 15 01174 g011
Figure 12. The spectra of the wind input term Sin (left), the whitecap dissipation term Sds (middle), and the nonlinear interaction term Snl (right) in (ac) station Prf, (df) station Prr, (gi) station Plf, and (jl) station Plr at 7.5 Rmax from the typhoon center. The solid black line corresponds to the wave direction, the solid red line corresponds to the wind direction, and the line length represents the relative size of the wind speed and the significant wave height.
Atmosphere 15 01174 g012
Figure 13. The simulated significant wave height distribution of the mixed wave (left column), wind sea (middle column), and swell (right column) based on the (ac) asymmetric wind fields, and (df) the symmetric wind field.
Atmosphere 15 01174 g013
Table 1. The parameters of the wind and waves in the feature points.
NQuadrantr θ p θ w U 10 C p c o s ( θ p θ w ) U 10 c o s ( θ p θ w ) C p
1right–forward2.5 Rmax94.7182.7631.8212.550.9818.58
2right–rear2.5 Rmax106.51110.2913.378.751.004.59
3left–forward2.5 Rmax69.94296.7417.8310.35−0.68−22.56
4left–rear2.5 Rmax67.906.397.888.260.48−4.50
5right–forward7.5 Rmax90.4639.2215.9610.070.63−0.08
6right–rear7.5 Rmax112.5997.0517.178.800.967.75
7left–forward7.5 Rmax53.45316.5212.459.50−0.12−11.00
8left–rear7.5 Rmax320.13218.0912.516.18−0.21−8.79
Disclaimer/Publisher’s Note: The statements, opinions and data contained in all publications are solely those of the individual author(s) and contributor(s) and not of MDPI and/or the editor(s). MDPI and/or the editor(s) disclaim responsibility for any injury to people or property resulting from any ideas, methods, instructions or products referred to in the content.