Article

Attenuation of Ultraviolet Radiation by Aerosols and Clouds in Beijing Area in 2005–2020

1
College of Chemistry and Chemical Engineering, Dezhou University, Dezhou 253023, China
2
State Key Laboratory of Atmospheric Boundary Layer Physics and Atmospheric Chemistry, Institute of Atmospheric Physics, Chinese Academy of Sciences, Beijing 100029, China
3
Shandong Provincial Key Laboratory of Monocrystalline Silicon Semiconductor Materials and Technology, Dezhou 253023, China
4
Heilongjiang Ecological Meteorological Center, Heilongjiang Meteorological Bureau, Harbin 150010, China
5
College of Resources and Environment, Northeast Agricultural University, Harbin 150010, China
*
Authors to whom correspondence should be addressed.
Atmosphere 2024, 15(3), 311; https://doi.org/10.3390/atmos15030311
Submission received: 23 January 2024 / Revised: 24 February 2024 / Accepted: 28 February 2024 / Published: 29 February 2024
(This article belongs to the Special Issue Aerosol Cloud Radiation Interactions)

Abstract

:
Ultraviolet radiation (UV) has strong chemical and biological effects on human health and ecosystems, and it plays an important role in the atmospheric environment by affecting photochemical processes, etc. Clouds and aerosols are the main factors affecting UV radiation and analyzing the quantitative impact of them on UV radiation is of great significance. Using the observation data of UV radiation in Beijing from 2005 to 2020, as well as the data of aerosol optical depth (AOD), single scattering albedo (SSA), and other related parameters, this paper simulated the surface UV radiation in two scenarios of cloudless without aerosol and cloudless with aerosol based on the TUV (Tropospheric Ultraviolet-Visible model), and quantitatively evaluated the attenuation of UV radiation by aerosol and cloud in the Beijing area. The results show that UV radiation is more sensitive to changes in AOD. Fixing the SSA value to 0.9, when the AOD increases from 0.2 to 1.0, the UV radiation decreases from 21.16 W/m2 to 12.64 W/m2 at 12:00; when AOD is maintained at 0.64, the SSA increases from 0.7 to 0.95, and the UV radiation increases from 14.55 W/m2 to 19.91 W/m2. The average annual attenuation rates of ultraviolet radiation by aerosols and clouds from 2005 to 2020 are 30.64% and 40.22%, respectively; the monthly averaged attenuation rates are 30.48% and 42.04%, respectively; and the daily averaged attenuation rates are 31.02% and 50.45%, respectively.

1. Introduction

Ultraviolet radiation (UV) is the component of solar radiation with a wavelength range of around 100–400 nm, which can be divided into UVA (315–400 nm), UVB (280–315 nm), and UVC (less than 280 nm) according to the different wavelength bands [1]. All UVC and 90% of UVB can be absorbed by ozone when passing through the atmosphere, and the remaining small amount of UVB and UVA reaches the surface [2]. The energy of the earth mainly comes from solar radiation, and some researchers have pointed out that UV radiation accounts for only about 8% of solar radiation [3], but it plays an important role in the atmospheric environment, human health, and ecosystems [4]. Moderate UV radiation promotes the synthesis of vitamin D in the human body, enhances the immunity system, helps prevent rickets and osteoporosis, and also protects the human stratum corneum and dermis [5]. However, excessive UV radiation can damage the human skin and immune system, causing diseases such as skin cancer and cataracts [6]. Meanwhile, UV radiation damages individual plants and animals by breaking chemical bonds in proteins. Excessive UV radiation can also inhibit photosynthesis in plants, which in turn affects the size of plant leaf area and plant growth [7]. UV radiation can impair the normal development and reproduction of aquatic organisms, thus affecting the entire aquatic ecosystem [8]. Because of its strong chemical and biological effects and its impact on the surrounding environment and human health, UV radiation has gradually become a hot spot in ecology and its environmental effects. Therefore, analyzing the quantitative impact of relevant factors on UV radiation is of great significance.
Clouds and aerosols are the main factors affecting UV radiation [9]. In recent years, scholars began to pay more attention to the effects of clouds and pollutants on UV radiation. Many scholars use numerical models to simulate the impact of aerosols on radiation [10,11]. In 2004, Chinese and American scientists quantitatively analyzed the effects of aerosols on the surface UV radiation in northern China by tropospheric aerosol observations over East Asia [12,13,14]. Ji et al. [15] analyzed the negative correlation between solar UV radiation, cloudiness, and relative humidity, and the positive correlation with visibility in the Guiyang area. Ding et al. [16] derived a correlation coefficient of up to −0.72 between UV radiation intensity and PM2.5 through data analysis. Deng et al. [17] applied the TUV radiative transfer model and quantitatively analyzed the attenuation of aerosol on surface UV radiation under sunny conditions in the Guangzhou area, the results show that the annual average attenuation rate of 340 nm UV radiation by aerosol optical depth (AOD) has reached 68%.
In this paper, the effects of clouds and aerosols on the surface UV radiation in Beijing in the past 16 years are investigated by using the UV radiation observation data in Beijing from 2005 to 2020, the aerosol-related parameter data (AOD, single scattering albedo (SSA)) from the AERONET aerosol observation network, and the TUV radiation transport model.

2. Data and Methods

2.1. Observation Sites and Equipment

The UV radiation data were provided by the observatory in the Institute of Atmospheric Physics (IAP) of the Chinese Academy of Sciences (CAS) in Beijing, with coordinates 116.37° E, 39.97° N. There is no direct industrial pollution emission in this area. The UV radiation observation device was a CUV3 radiation meter made by Kipp and Zonen (The Netherlands). The measurement range is 0.29 to 0.40 μm with an accuracy of ±5%. The broadband solar radiation (Rs) was obtained by a CM-11 radiometer (Kipp and Zonen, Delft, Netherlands) with a measurement range of 0.3 to 3 μm and an uncertainty of less than 3%. In order to ensure the validity of the data, quality control of the UV radiation was carried out as follows: firstly, at night, when there is almost no UV radiation, all UV radiation data at solar altitude angles of less than 0° were excluded. Secondly, to eliminate errors caused by the cosine effect of the observing instruments, data for solar altitude angles less than 5° were excluded. Thirdly, the extraterrestrial UV radiation should be greater than the observed UV radiation at the same geographical location, and unqualified data are directly excluded [18]. Fourth, the ratio of UV to Rs should be in the range of 2 to 7 percent to exclude unqualified data outside the range [19].
Currently, aerosol optical property parameters are available from high spatial and temporal resolution satellite and ground-based monitoring. AERONET (AErosol RObotic NETwork, https://aeronet.gsfc.nasa.gov/ (accessed on 30 July 2020)) program is a federation of ground-based remote sensing aerosol networks established by NASA and PHOTONS (PHOtométrie pour le Traitement Opérationnel de Normalisation Satellitaire; Univ. of Lille 1, CNES, and CNRS-INSU) and is greatly expanded by network and collaborators from national agencies, institutes, universities, individual scientists, and partners. It provides globally distributed observations of spectral AOD, inversion products, and precipitable water in diverse aerosol regimes. Version 3 AOD data are computed for three data quality levels: Level 1.0 (unscreened), Level 1.5 (cloud-screened and quality-controlled), and Level 2.0 (quality-assured) [20]. The data used in this paper are from AERONET Beijing station (116.38° E, 39.98° N) at level 1.5 from 2005 to 2020, excluding cloud impacts. AOD and SSA data are selected in the band of 440 nm. The aerosol-related parameters used in this study are downloaded from the AERONET, including aerosol optical depth, single-scattering albedo, solar zenith angle, column ozone concentration, NO2, and surface albedo.

2.2. TUV Radiation Transfer Modes

2.2.1. Introduction to the Modes

The TUV (Tropospheric Ultraviolet and Visible Radiation Model) is an atmospheric radiative transfer model developed by researchers such as Madronieh and Floeke from the National Center for Atmospheric Research (NCAR) in the United States to calculate tropospheric ultraviolet radiation and partial visible light radiation [21]. The model uses the pseudosphere two-stream approximation or the multi-stream discrete coordinate method to solve the radiative transfer equations, and the model wavelengths are taken in the range of 121–735 nm, which allows the calculation of UV irradiance and the photochemical radiative fluxes. The model can calculate UV irradiance, photochemical radiation flux, photolysis rate of molecules, and biological effect weight radiation, as well as a number of irradiance indicators related to biological activity (UV coefficients, DNA damage, vitamin D yield, etc.). The TUV radiative transfer model calculates the UV radiation clear sky values with an error of only about 5 percent [22].

2.2.2. Input Parameters

The TUV model requires three types of parameters to be input during operation. The first type is basic information, such as time, longitude, latitude, wavelength, etc.; the second type is the information of ground parameters, such as surface albedo, air pressure, ozone column content, etc., and the third type is aerosol parameters such as the aerosol optical depth, single scattering albedo, the asymmetry factor, etc. The aerosol-related parameters as well as ozone column concentration elected in this study were downloaded from the AERONET aerosol observation network (https://aeronet.gsfc.nasa.gov/ (accessed on 19 January 2024)), including aerosol optical thickness, single scattering albedo, and wavelength index. The effects of aerosols and clouds on the surface UV radiation are quantitatively assessed by varying the parameters.

2.3. Attenuation Rate

In this paper, Equation (1) is used to calculate the atmospheric attenuation rate of UV radiation:
A R a t m o s p h e r e = ( U V 1 U V 3 ) / U V 1 × 100 %
The attenuation rate of UV radiation by aerosols is given in Equation (2):
A R a e r o s o l = ( U V 1 U V 2 ) / U V 1 × 100 %
The attenuation rate of cloud to UV radiation is shown in Equation (3):
A R c l o u d = ( U V 2 U V 3 ) / U V 2 × 100 %
where UV1 represents the UV radiation simulated by the TUV radiative transfer model for the cloudless and aerosol-free case, UV2 represents the UV radiation simulated by the TUV radiative transfer model for the cloudless with aerosol case, and UV3 represents the actual observed UV radiation.

3. Results

3.1. Sensitivity Analysis of UV Radiation

Surface UV radiation can be influenced by aerosols in the atmosphere [4,23]. The sensitivity of UV radiation to AOD and SSA was conducted through the radiative transfer model by keeping the other parameter settings to background values, changing only AOD or SSA.

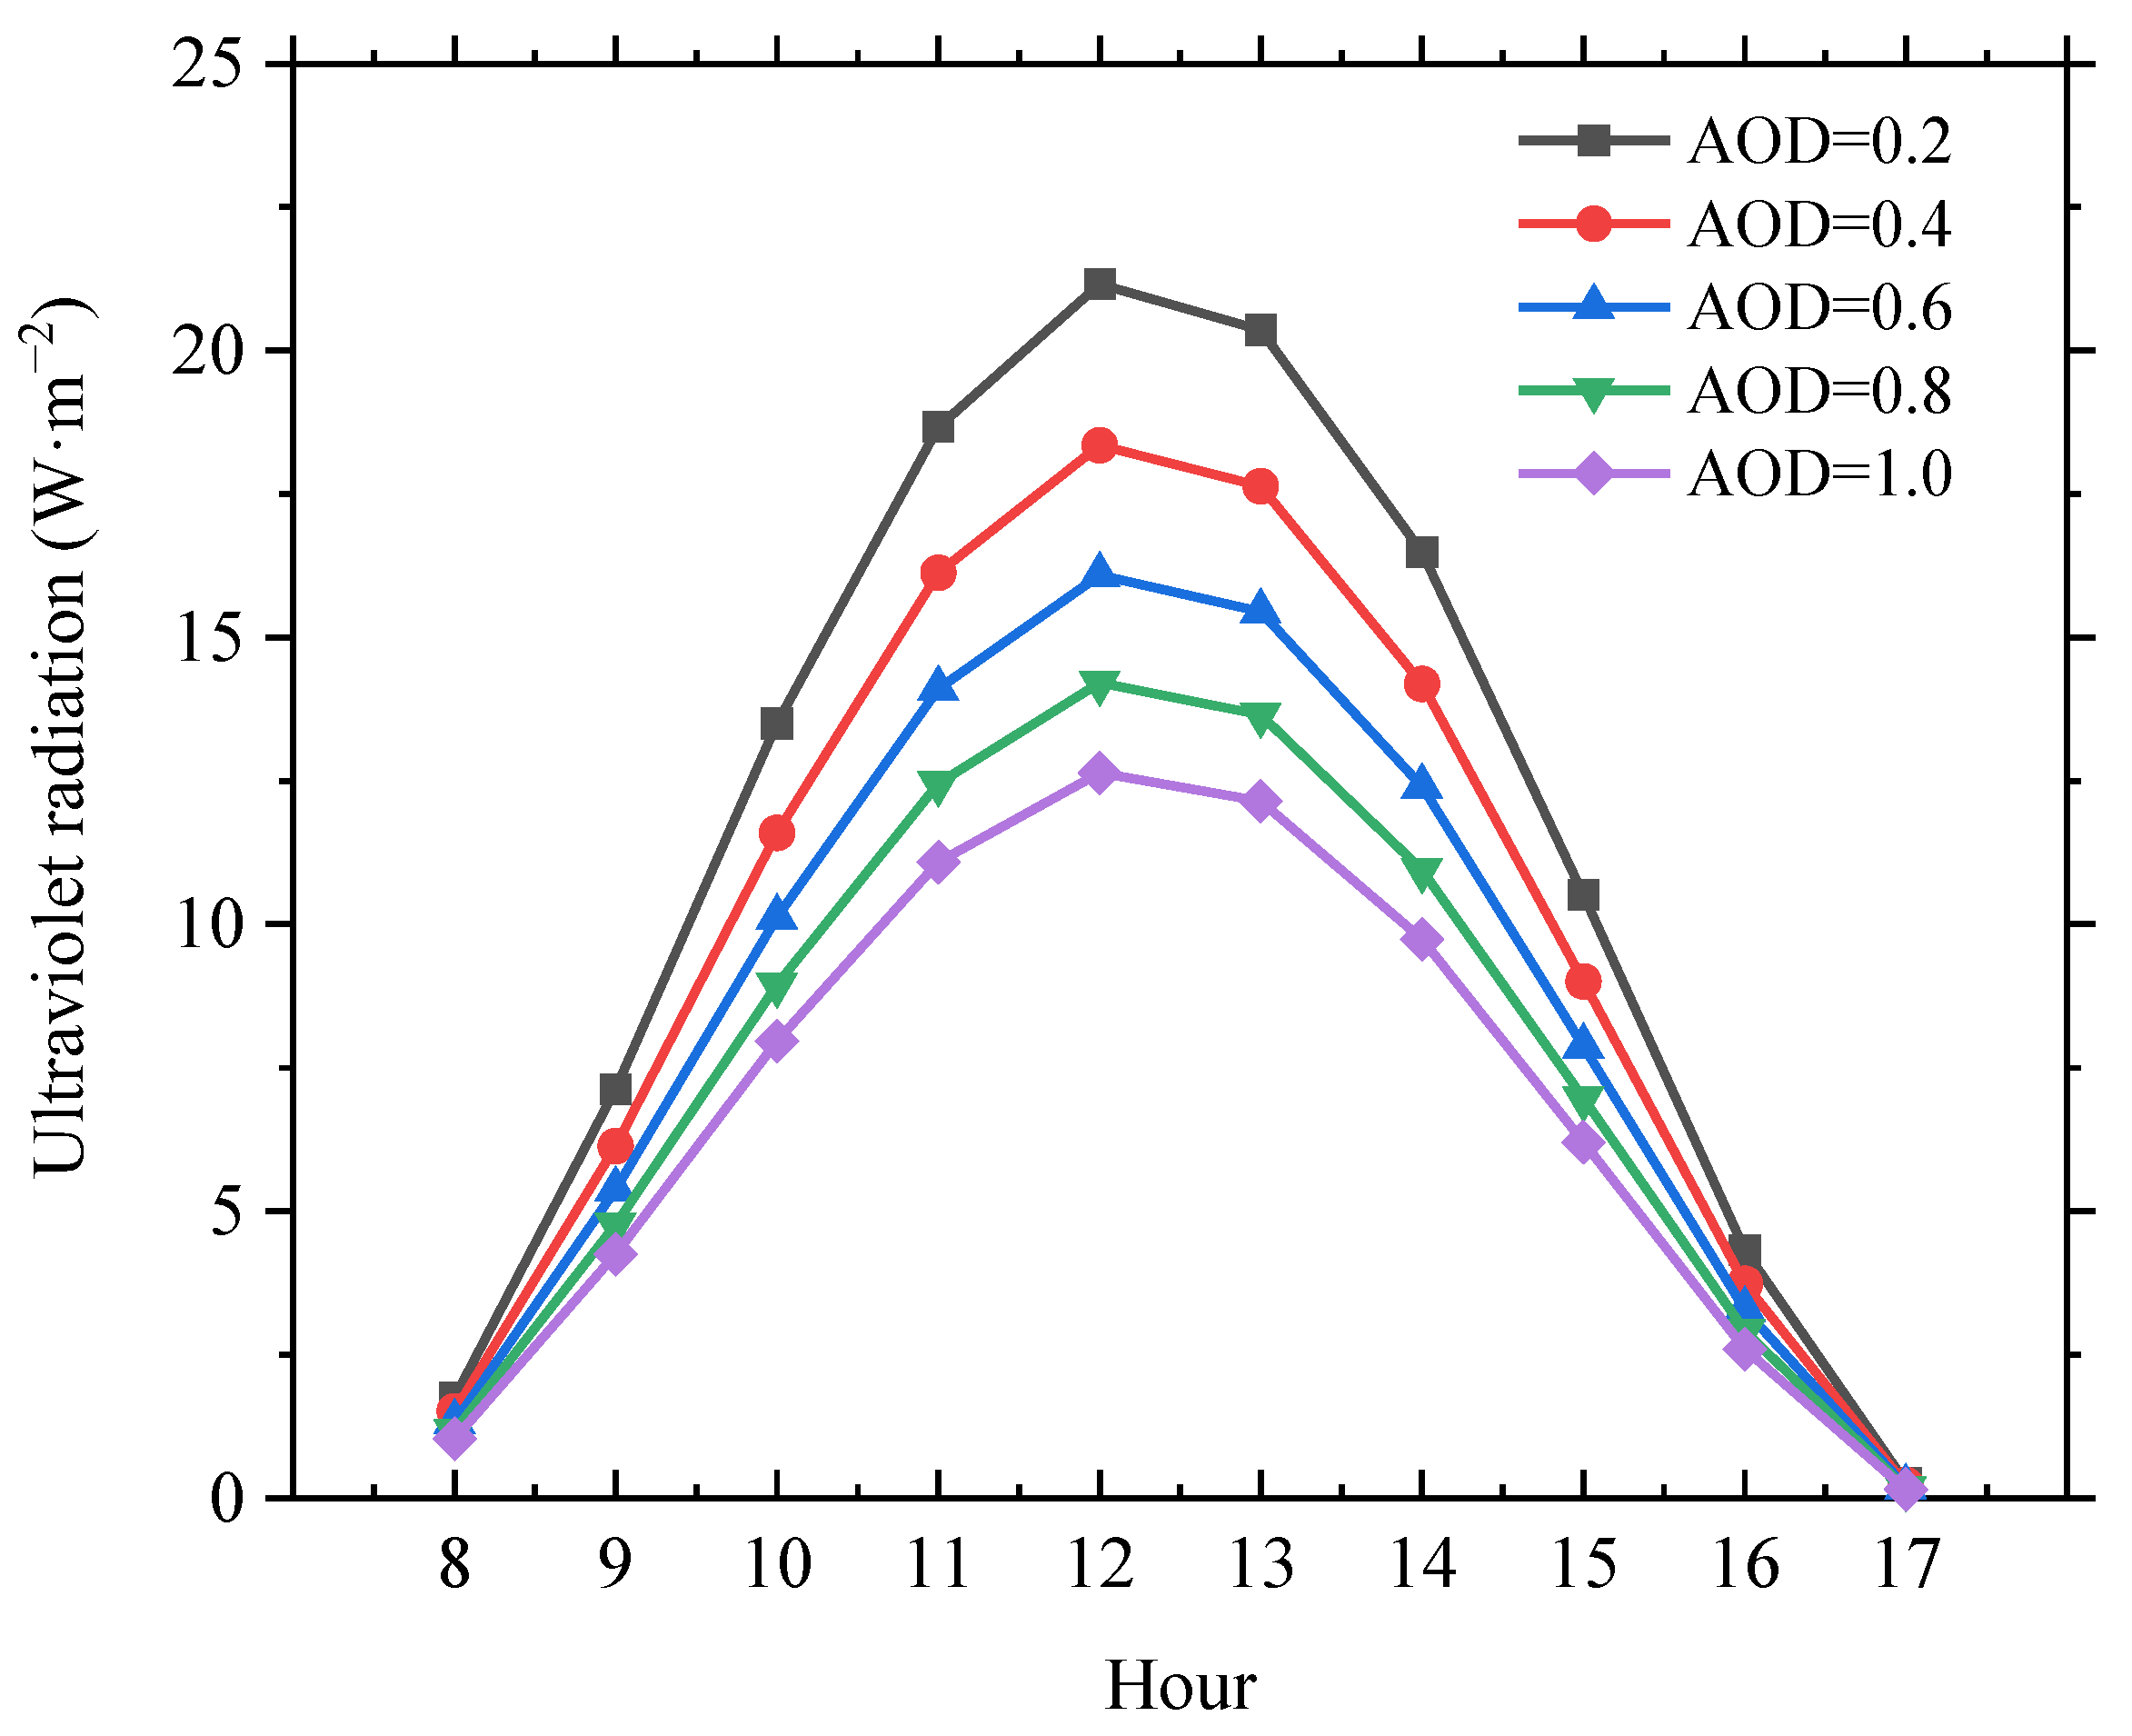
3.1.1. Sensitivity of UV Radiation to AOD

The annual mean SSA in Beijing from 2005 to 2020 was 0.9, so the SSA was kept constant at 0.9, with surface albedo (0.153), O3 column concentration (334.409), NO2 column concentration (0.899), and Ångström exponent (1.058) keeping constant and the diurnal UV radiation was simulated by the TUV radiative transfer model within the AOD range of 0.2–1.0. The results show that UV radiation under different AOD values exhibits a “single peak” characteristic, with approximately symmetrical curves on both sides (shown in Figure 1). The UV radiation gradually increased before 12:00 (all timestamps relate to local time), peaked at 12:00, and gradually decreased after 12:00, exhibiting a pattern of small in the morning, small in the evening, and large in the noon.
From 8:00 to 17:00, with the increase in AOD, the difference in hourly UV radiation also follows the pattern of small in the morning and evening, and large at noon. That is, at 12:00, the difference between the UV radiation at AOD 1.0 and that at AOD 0.2 is the largest, and the difference in UV radiation before 12:00 gradually increases, reaching its peak at 12:00, and the difference in UV radiation gradually decreases after 12:00. As the AOD increases, the hourly UV radiation attenuation rates are manifested as follows: from 8:00 to 17:00, when the AOD increases from 0.2 to 1.0, the attenuation rates of the UV radiation are 40.57%, 40.39%, 41.08%, 47.4%, 44.99%, 40.39%, 40.9%, 40.91%, 40.05%, and 44.44%, respectively. The maximum attenuation rate of UV radiation was observed at 11:00 (47.4%) and about 12:00 (44.99%). The attenuation rate of UV radiation was the smallest at 16:00 (40.05%).

3.1.2. Sensitivity of UV Radiation to SSA

Aerosols affect the radiation balance through scattering or absorption of light; therefore, SSA is closely related to radiation [24,25,26]. The annual average value of AOD, surface albedo, O3 column concentration, NO2 column concentration, and Ångström exponent in Beijing from 2005 to 2020 was 0.64, 0.153, 334.409, 0.899, and 1.058, respectively, so these parameters were set as constant, and the value of SSA fluctuates between 0.7 and 0.95. The UV radiation was simulated by the TUV radiative transfer model within the SSA range of 0.7–0.95. The results show that the daily variation of UV radiation is the same as that of the simulated AOD in the range of 0.2 to 1.0, with the curve showing a “single-peak” distribution and reaching the peak at 12:00 (shown in Figure 2). With the increase in SSA, the UV radiation also increased.
From 8:00 to 17:00, with the increase in SSA, the difference in hourly UV radiation also follows the pattern of small in the morning and evening and large at noon, the difference in UV radiation between SSA 0.95 and 0.7 is the largest at 12:00. The difference of the UV radiation before 12:00 increases gradually, and it reaches the peak at 12:00. After 12:00, the UV radiation difference gradually decreases. Specifically, from 8:00 to 17:00, when the SSA increased from 0.7 to 0.95, the hourly difference in UV radiation was 0.53 W/m2, 2.12 W/m2, 3.75 W/m2, 4.86 W/m2, 5.35 W/m2, 5.2 W/m2, 4.4 W/m2, 3.02 W/m2, 1.3 W/m2, and 0.07 W/m2, respectively. The hourly growth rate of UV radiation as the SSA increases is specified as follows: from 8:00 to 17:00, when the SSA increases from 0.7 to 0.95, the growth rate of UV radiation is in the following order: 46.45%, 45.94%, 42.05%, 38.33%, 36.78%, 37.26%, 39.77%, 44.08%, 46.45%, and 41.76%.

3.2. Attenuation of Ultraviolet Radiation by Aerosols and Clouds

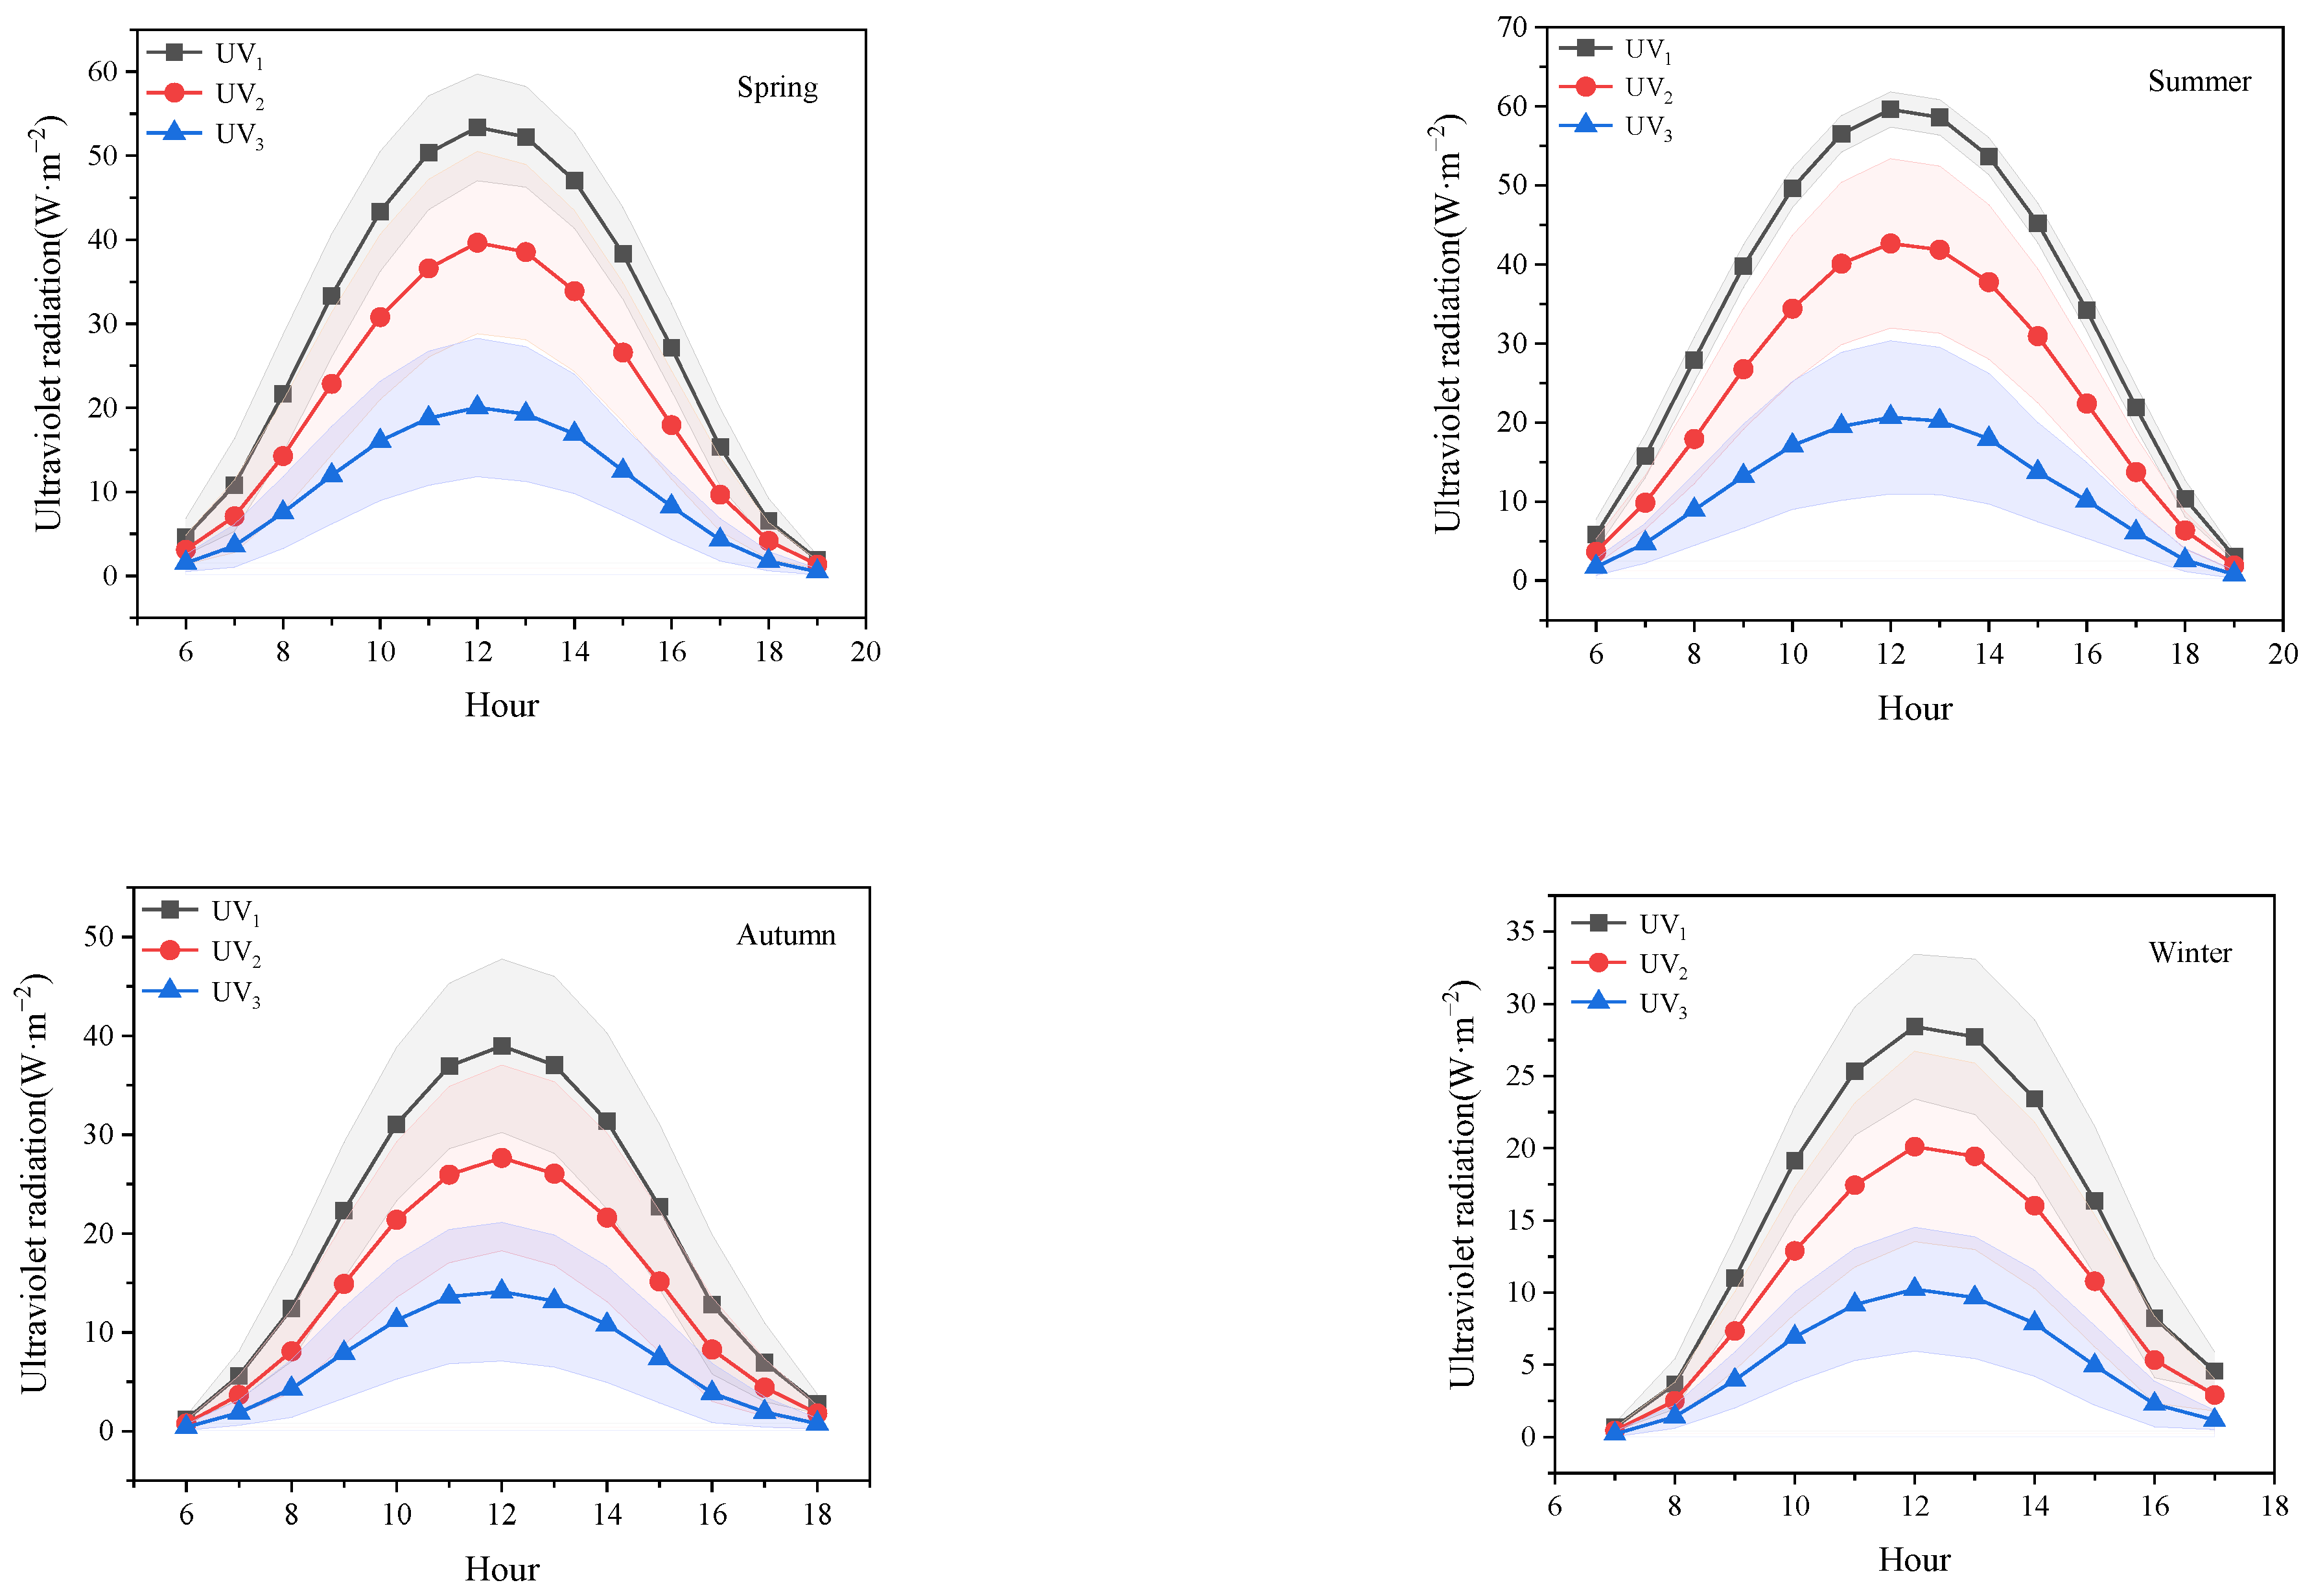
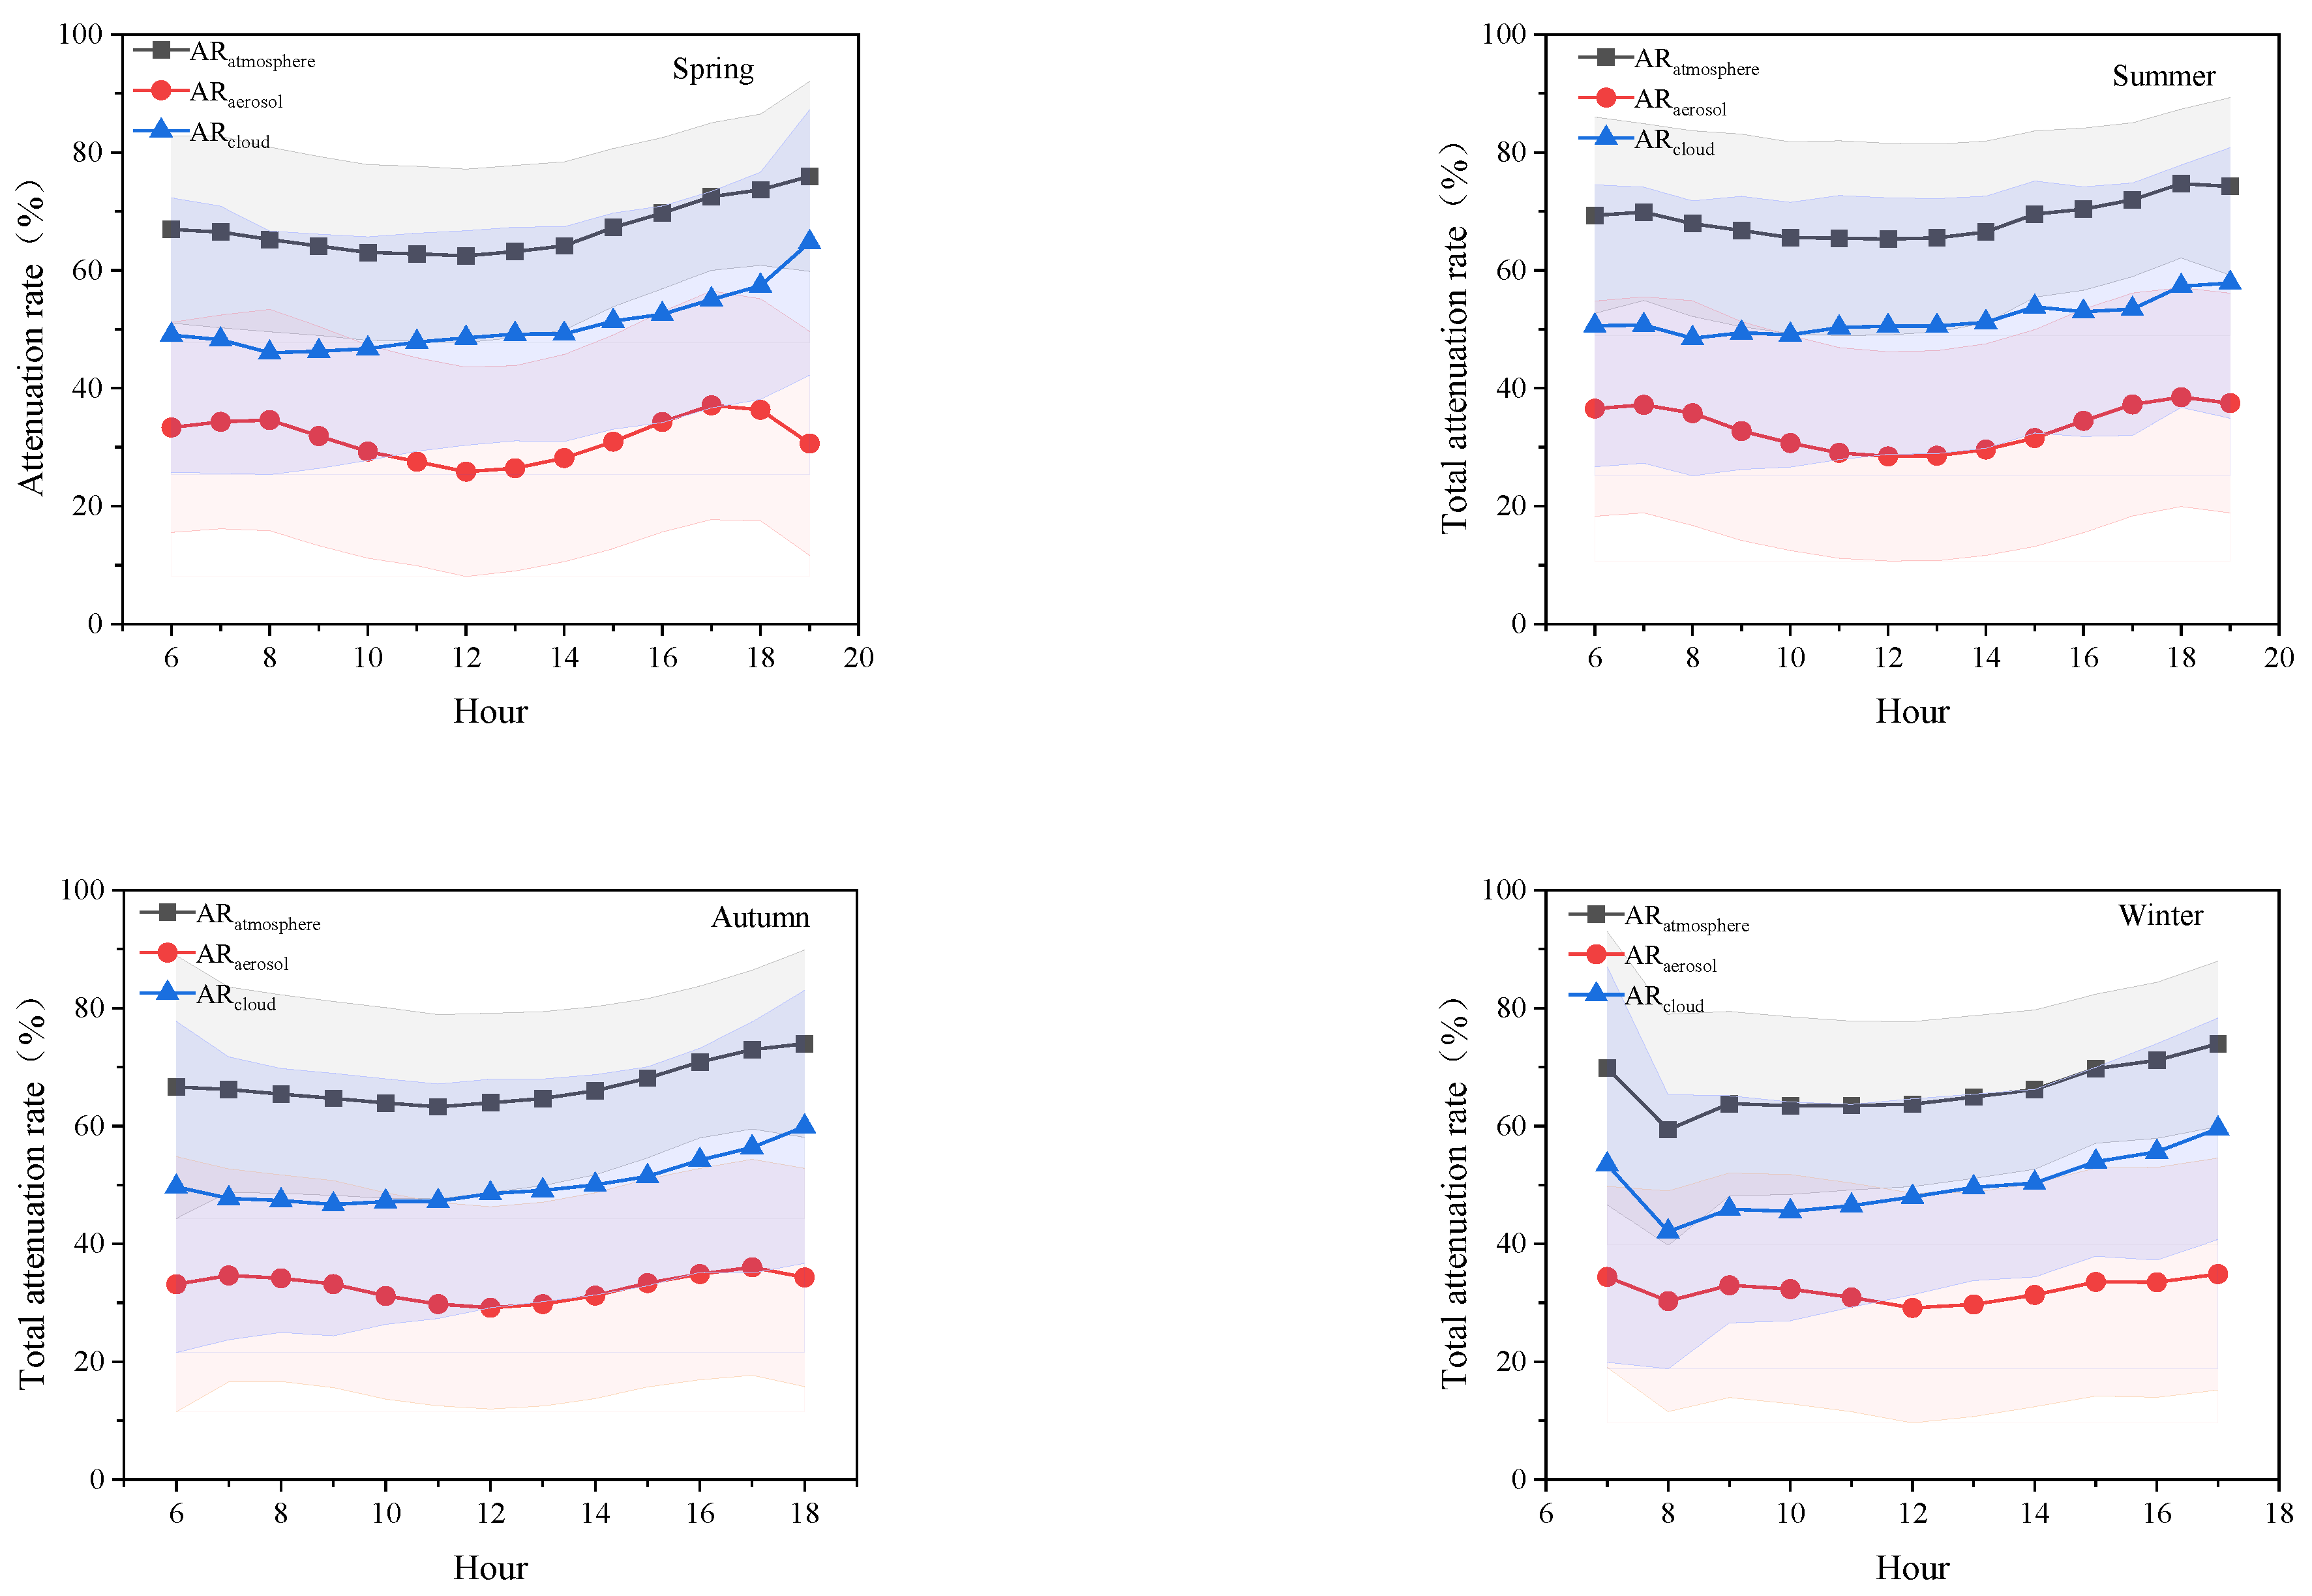
3.2.1. Characteristics of Daily Variations in Aerosol and Cloud Attenuation of UV Radiation

The blue lines in Figure 3 show the daily variation of UV radiation under normal observation, and all the daily variations of UV radiation in the four seasons show a “single-peak” pattern, which is small in the morning and evening and large in the noon, mainly due to the significant influence of UV radiation by the solar altitude angle. UV radiation is the smallest in the morning at 6:00 in spring, summer, and autumn or 7:00 in winter and it increases continuously with the gradual increase in the solar altitude angle and reaches the maximum at 12:00 noon (20.03 W/m2 in spring, 20.65 W/m2 in summer, 14.11 W/m2 in autumn, and 10.23 W/m2 in winter). Then with the decrease in the solar altitude angle, the UV radiation decreases gradually, reaching a minimum at 19:00 (in spring and summer), 18:00 (in autumn), or 17:00 (in winter) and the overall curve shows a parabolic shape, roughly symmetrical. The black lines in Figure 3 show the UV radiation simulated by the TUV radiation transfer model under the conditions of cloudless and aerosol free. As the figure shows, UV1 is consistent with the daily variation pattern of UV3, both for the “single peak” pattern change, small in the morning and evening and large at midday. The maximum UV1 is 53.37 W/m2 (spring), 59.60 W/m2 (summer), 38.98 W/m2 (autumn), and 28.42 W/m2 (winter), respectively, indicating that the attenuation of UV radiation by the actual atmosphere (clouds and aerosols) is quite obvious during the day. The red lines in Figure 3 show the daily variation of UV radiation without clouds and with aerosols simulated by the TUV radiative transfer model, which also shows a “single peak” pattern as that of actual observed UV radiation and of UV radiation under cloudless and aerosol-free conditions. The maximum values of the red curves in the four seasons reach at 12:00, too, which are 39.65 W/m2 in spring, 42.65 W/m2 in summer, 27.64 W/m2 in autumn, and 20.12 W/m2 in winter. The maximum values of UV radiation under cloudless and aerosol free conditions in the four seasons are the largest among the three kinds of UV radiation presented in Figure 3, followed by UV radiation under cloudless with aerosol conditions, demonstrating that both cloud and aerosols played the weakening roles in surface UV radiation.
The daily averaged ARatmosphere is shown as the black line in Figure 4, with average values of 66.96%, 68.79%, 67.09%, and 67.39% in spring, summer, autumn, and winter, respectively. The total attenuation of UV radiation is relatively weak in the afternoon, but stronger in the morning and evening. Specifically, the attenuation of ultraviolet radiation by aerosols shows a bimodal pattern, with stronger attenuation occurring around 8:00 and around 17:00. The trend of this bimodal pattern is especially pronounced in spring, summer, and autumn. The average ARaerosol in a day of four seasons is 31.47% (spring), 33.41% (summer), 32.72% (autumn), and 32.56% (winter), respectively. The ARcloud (the blue lines in Figure 4) are weaker than ARatmosphere and stronger than ARaerosol, which are 50.86%, 51.87%, 50.51%, and 51.21% in spring, summer, autumn, and winter, respectively. The ARcloud is relatively weak in the morning, followed by an increase in attenuation, and reaches its maximum value in the evening. It can be seen that the attenuation of UV radiation by the atmosphere is smaller than the sum of the individual attenuation by aerosols and clouds, rather than simply adding the latter two together.

3.2.2. Characteristics of Monthly Variations in the Attenuation of UV Radiation by Aerosols and Clouds

The high temperature and rainy days in the summer of Beijing make it easy for aerosol particles to moisture absorption and growth, resulting in an increase in aerosol particle concentration and strong attenuation of ultraviolet radiation. The blue line in Figure 5 shows the monthly variation of UV3, and the monthly average UV radiation in Beijing from 2005 to 2020 is 9.06 W/m2. The monthly variation appears as a “single peak” pattern, and the seasonal change characteristics are large in summer and small in winter. From the specific months, the highest and lowest values of UV radiation appeared in June (12.17 W/m2) and December (5.4 W/m2), respectively. The reason for this pattern of change is that during the Earth’s revolution, the position of the Sun in the northern and southern hemispheres changes during the year, causing seasonal changes. The average value of UV radiation is 10.63 W/m2 in spring (March to May), where there is more haze and dust in the northern region, leading to more particulate pollution days, and Beijing is often affected by sandstorms, so less UV radiation reaches the ground. The average value of UV radiation in summer (June–August) is 11.42 W/m2. In summer, Beijing is in a high-temperature and high-humidity environment, which contributes to the anthropogenic generation of aerosols and the growth of particulate matter, resulting in higher particulate matter mass concentrations in summer. However, Beijing has a rainy summer, and the wet deposition process can effectively remove particulate matter, the particulate matter concentration is lower than in spring, and more UV radiation reaches the ground than in spring. The mean value of UV3 in autumn (September to November) is 8.2 W/m2. Biomass burning generates a large number of aerosols in autumn. Meanwhile, Beijing enters the heating period from November, which increases the emissions of precursors and leads to an increase in secondary pollutants, making the particulate matter concentration reach the highest level of the year, leading to a large decrease in the amount of UV radiation that reaches the ground. The average value of UV radiation in winter (December to February) is 6.03 W/m2. The beginning of full-scale heating in Beijing in winter keeps the particulate matter concentration at a high level, and less UV radiation reaches the ground than in autumn.
The UV1 (shown by the black line in Figure 5) also shows seasonal variations with “large summer and small winter”. The results show that the maximum UV radiation is in July (30.44 W/m2), followed by June (30.12 W/m2) and December (11.89 W/m2). The maximum value of simulated UV radiation is 18.27 W/m2 more than that of actual observed, and the minimum value of simulated UV radiation is 6.49 W/m2 more than that of actual observed. The simulated mean values of UV radiation in spring, summer, autumn, and winter by the TUV model are 27.15 W/m2, 29.66 W/m2, 19.99 W/m2, and 14.39 W/m2, respectively. The simulated values of UV radiation in the four seasons are higher than the observed values by 16.52 W/m2, 18.24 W/m2, 11.79 W/m2, and 8.36 W/m2, respectively. The difference in UV radiation in the four seasons illustrates that the actual atmospheric attenuation of UV radiation is obvious. These attenuations are mainly caused by aerosols and clouds.
The monthly variation of UV2 (red line in Figure 5) gradually increases from January to May and decreases from May to December. Although the UV radiation reaches the maximum value in May (21.93 W/m2) and the minimum value in December (8.43 W/m2), the overall trend still shows larger value in summer and smaller in winter, and the mean values of UV radiation simulated by the TUV model are 19.40 W/m2, 20.16 W/m2, 13.77 W/m2 and 10.00 W/m2 in spring, summer, autumn and winter, respectively, which are 7.75 W/m2, 9.50 W/m2, 6.22 W/m2, and 4.39 W/m2 less than UV1 in that season. The difference in UV radiation between the four seasons indicates that the attenuation of UV radiation by aerosols is weaker than that by the atmosphere.
The average monthly ARatmosphere (the black line in Figure 6) has an average value of 59.72%. The overall attenuation rate varied between 54.57% and 64.85%, with an increasing trend from January to July and a decreasing trend from July to December; the monthly average ARatmosphere was greatest in July (64.85%), followed by May (62.42%), and smallest in December (54.57%). The red line in Figure 6 shows the monthly mean ARaerosol, which has a mean value of 30.48%. This is a reduction of 29.24% compared to the actual average monthly ARatmospherel. The overall attenuation rate varies from 27.19% to 33.63%, with the maximum aerosol attenuation of UV radiation in July (33.63%), followed by the second highest in June (31.91%), and the minimum attenuation in May (27.19%). The maximum ARaerosol in summer is due to the high temperature and humid environment which promotes the generation of secondary aerosols. The blue line in Figure 6 shows the monthly average ARcloud, which has an average value of 42.04%. This is a decrease of 17.68% compared to the actual monthly mean ARatmosphere and an increase of 11.56% compared to the monthly mean ARaerosol. The overall attenuation rate varied between 35.91 and 48.39%. The maximum attenuation rate occurred in May (48.39%), followed by April (43.44%), and the minimum in December (35.91%).

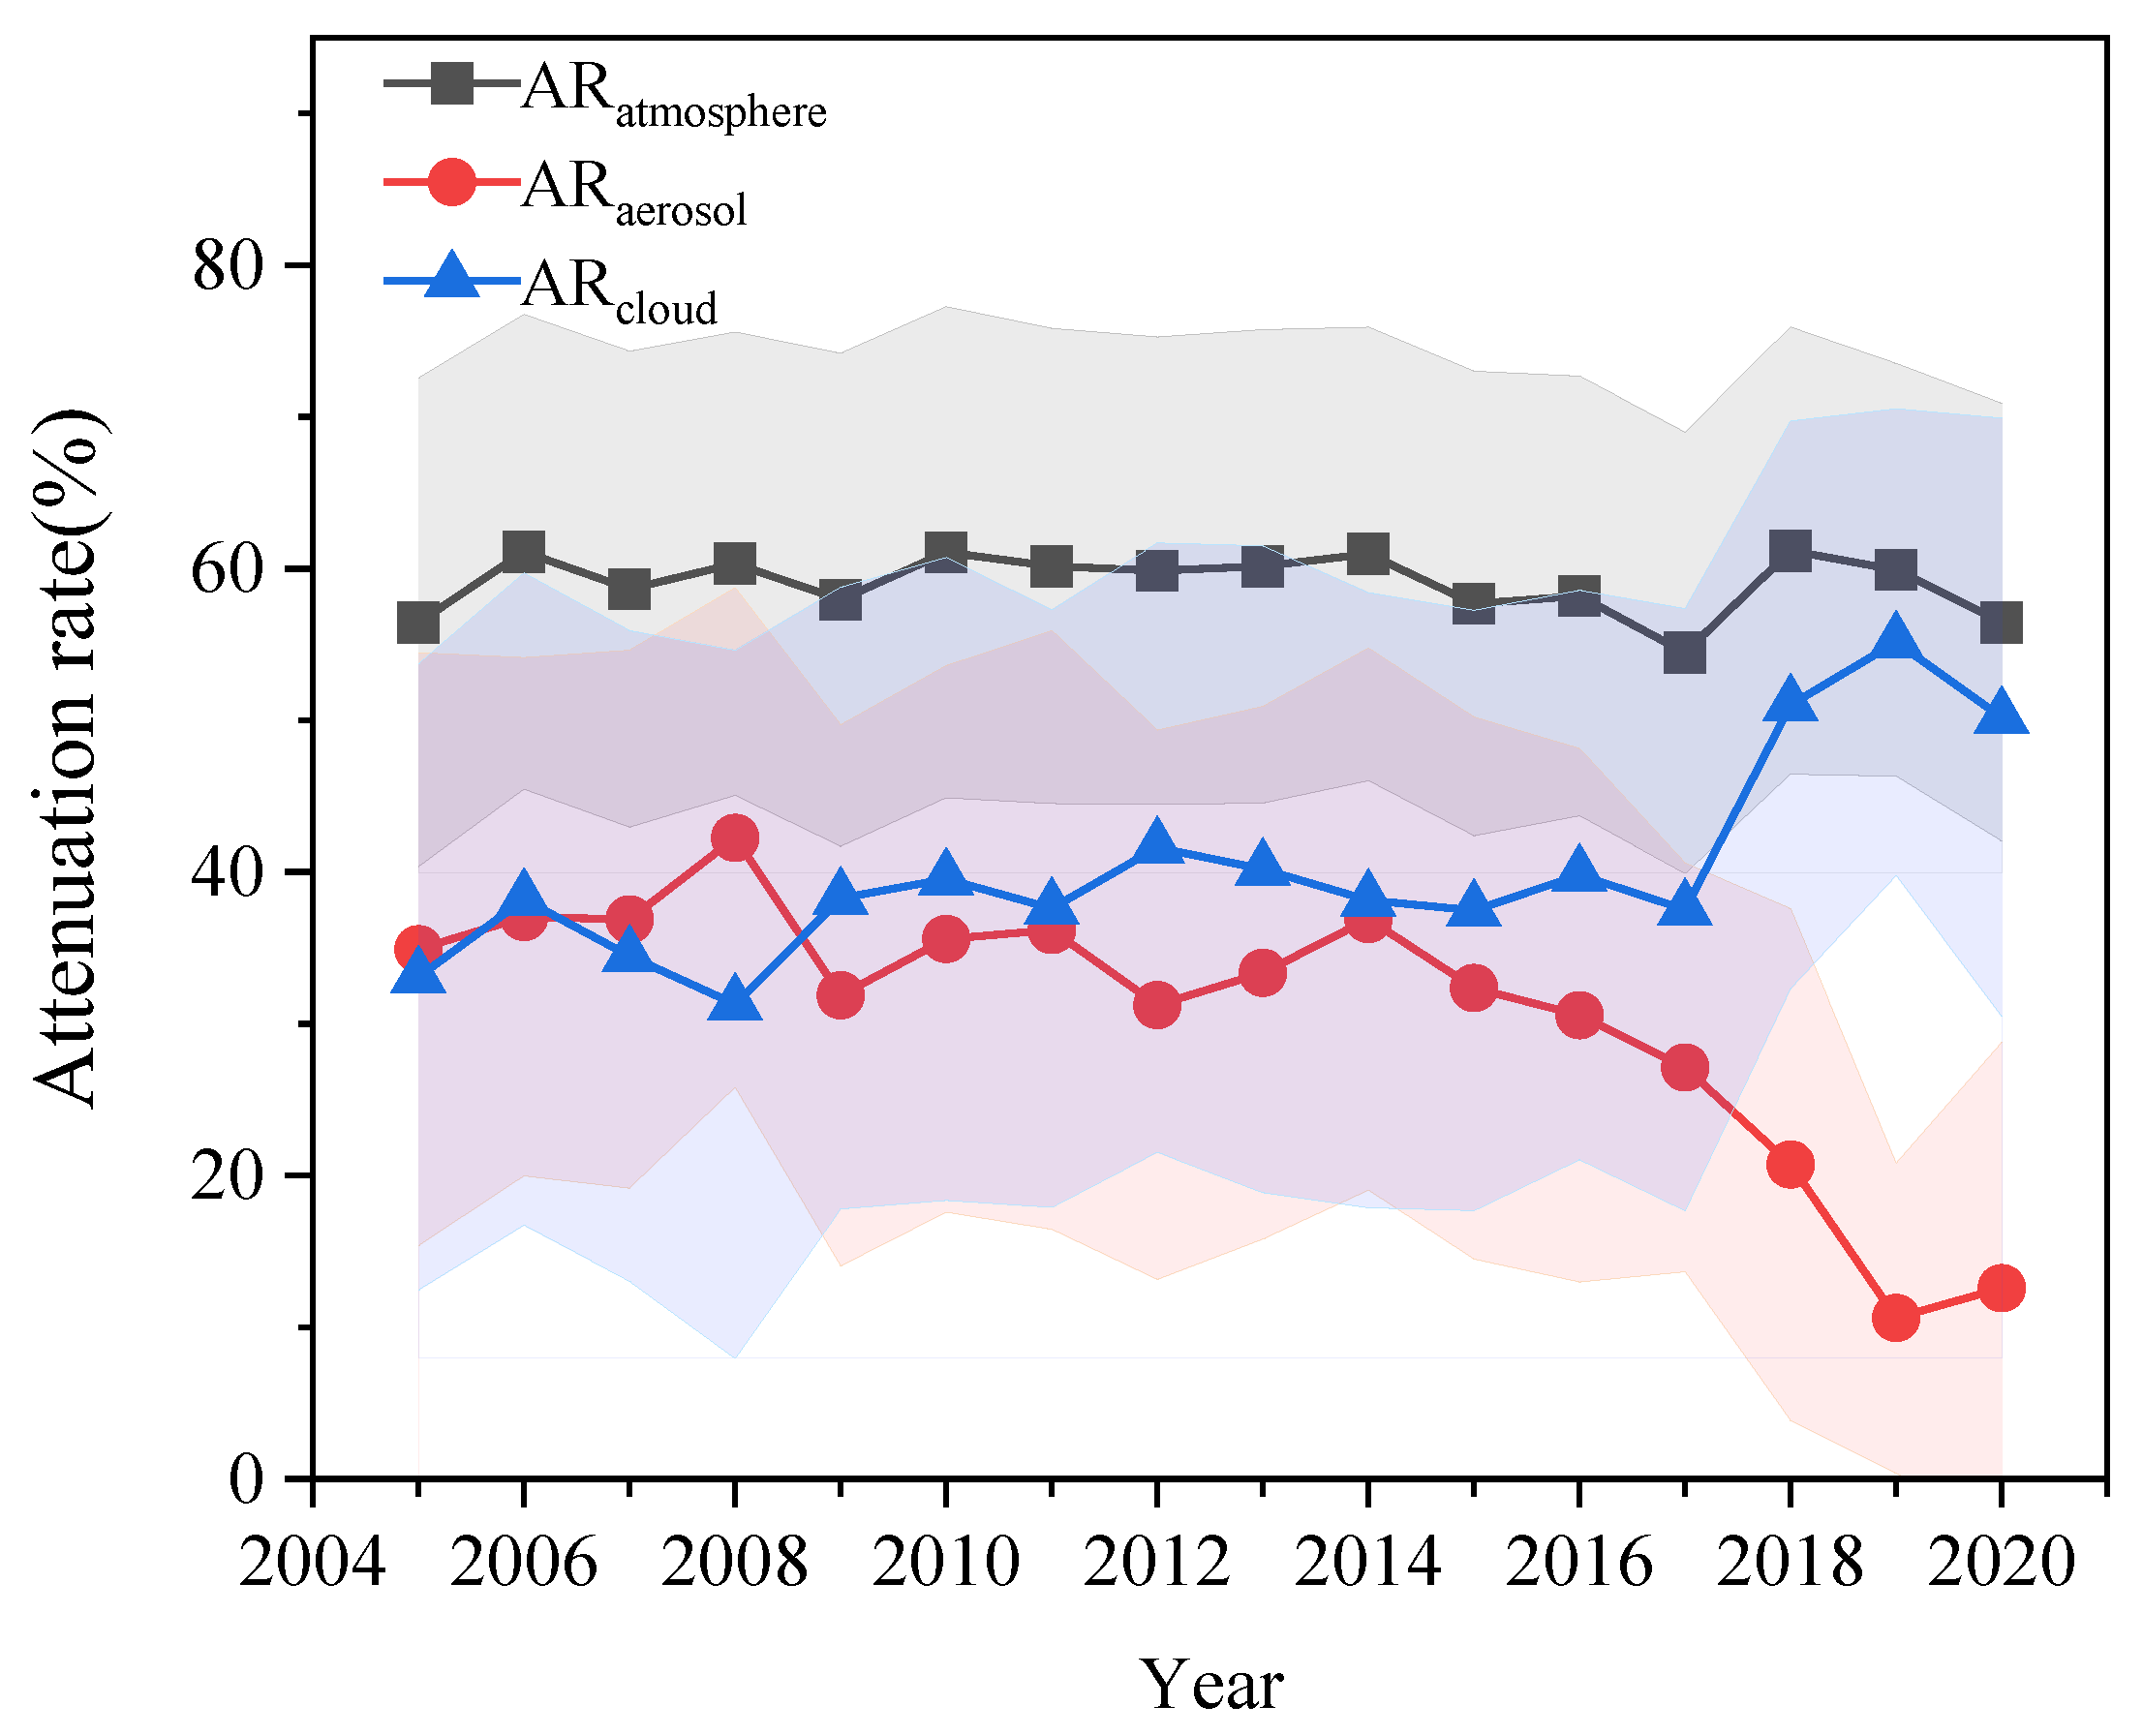
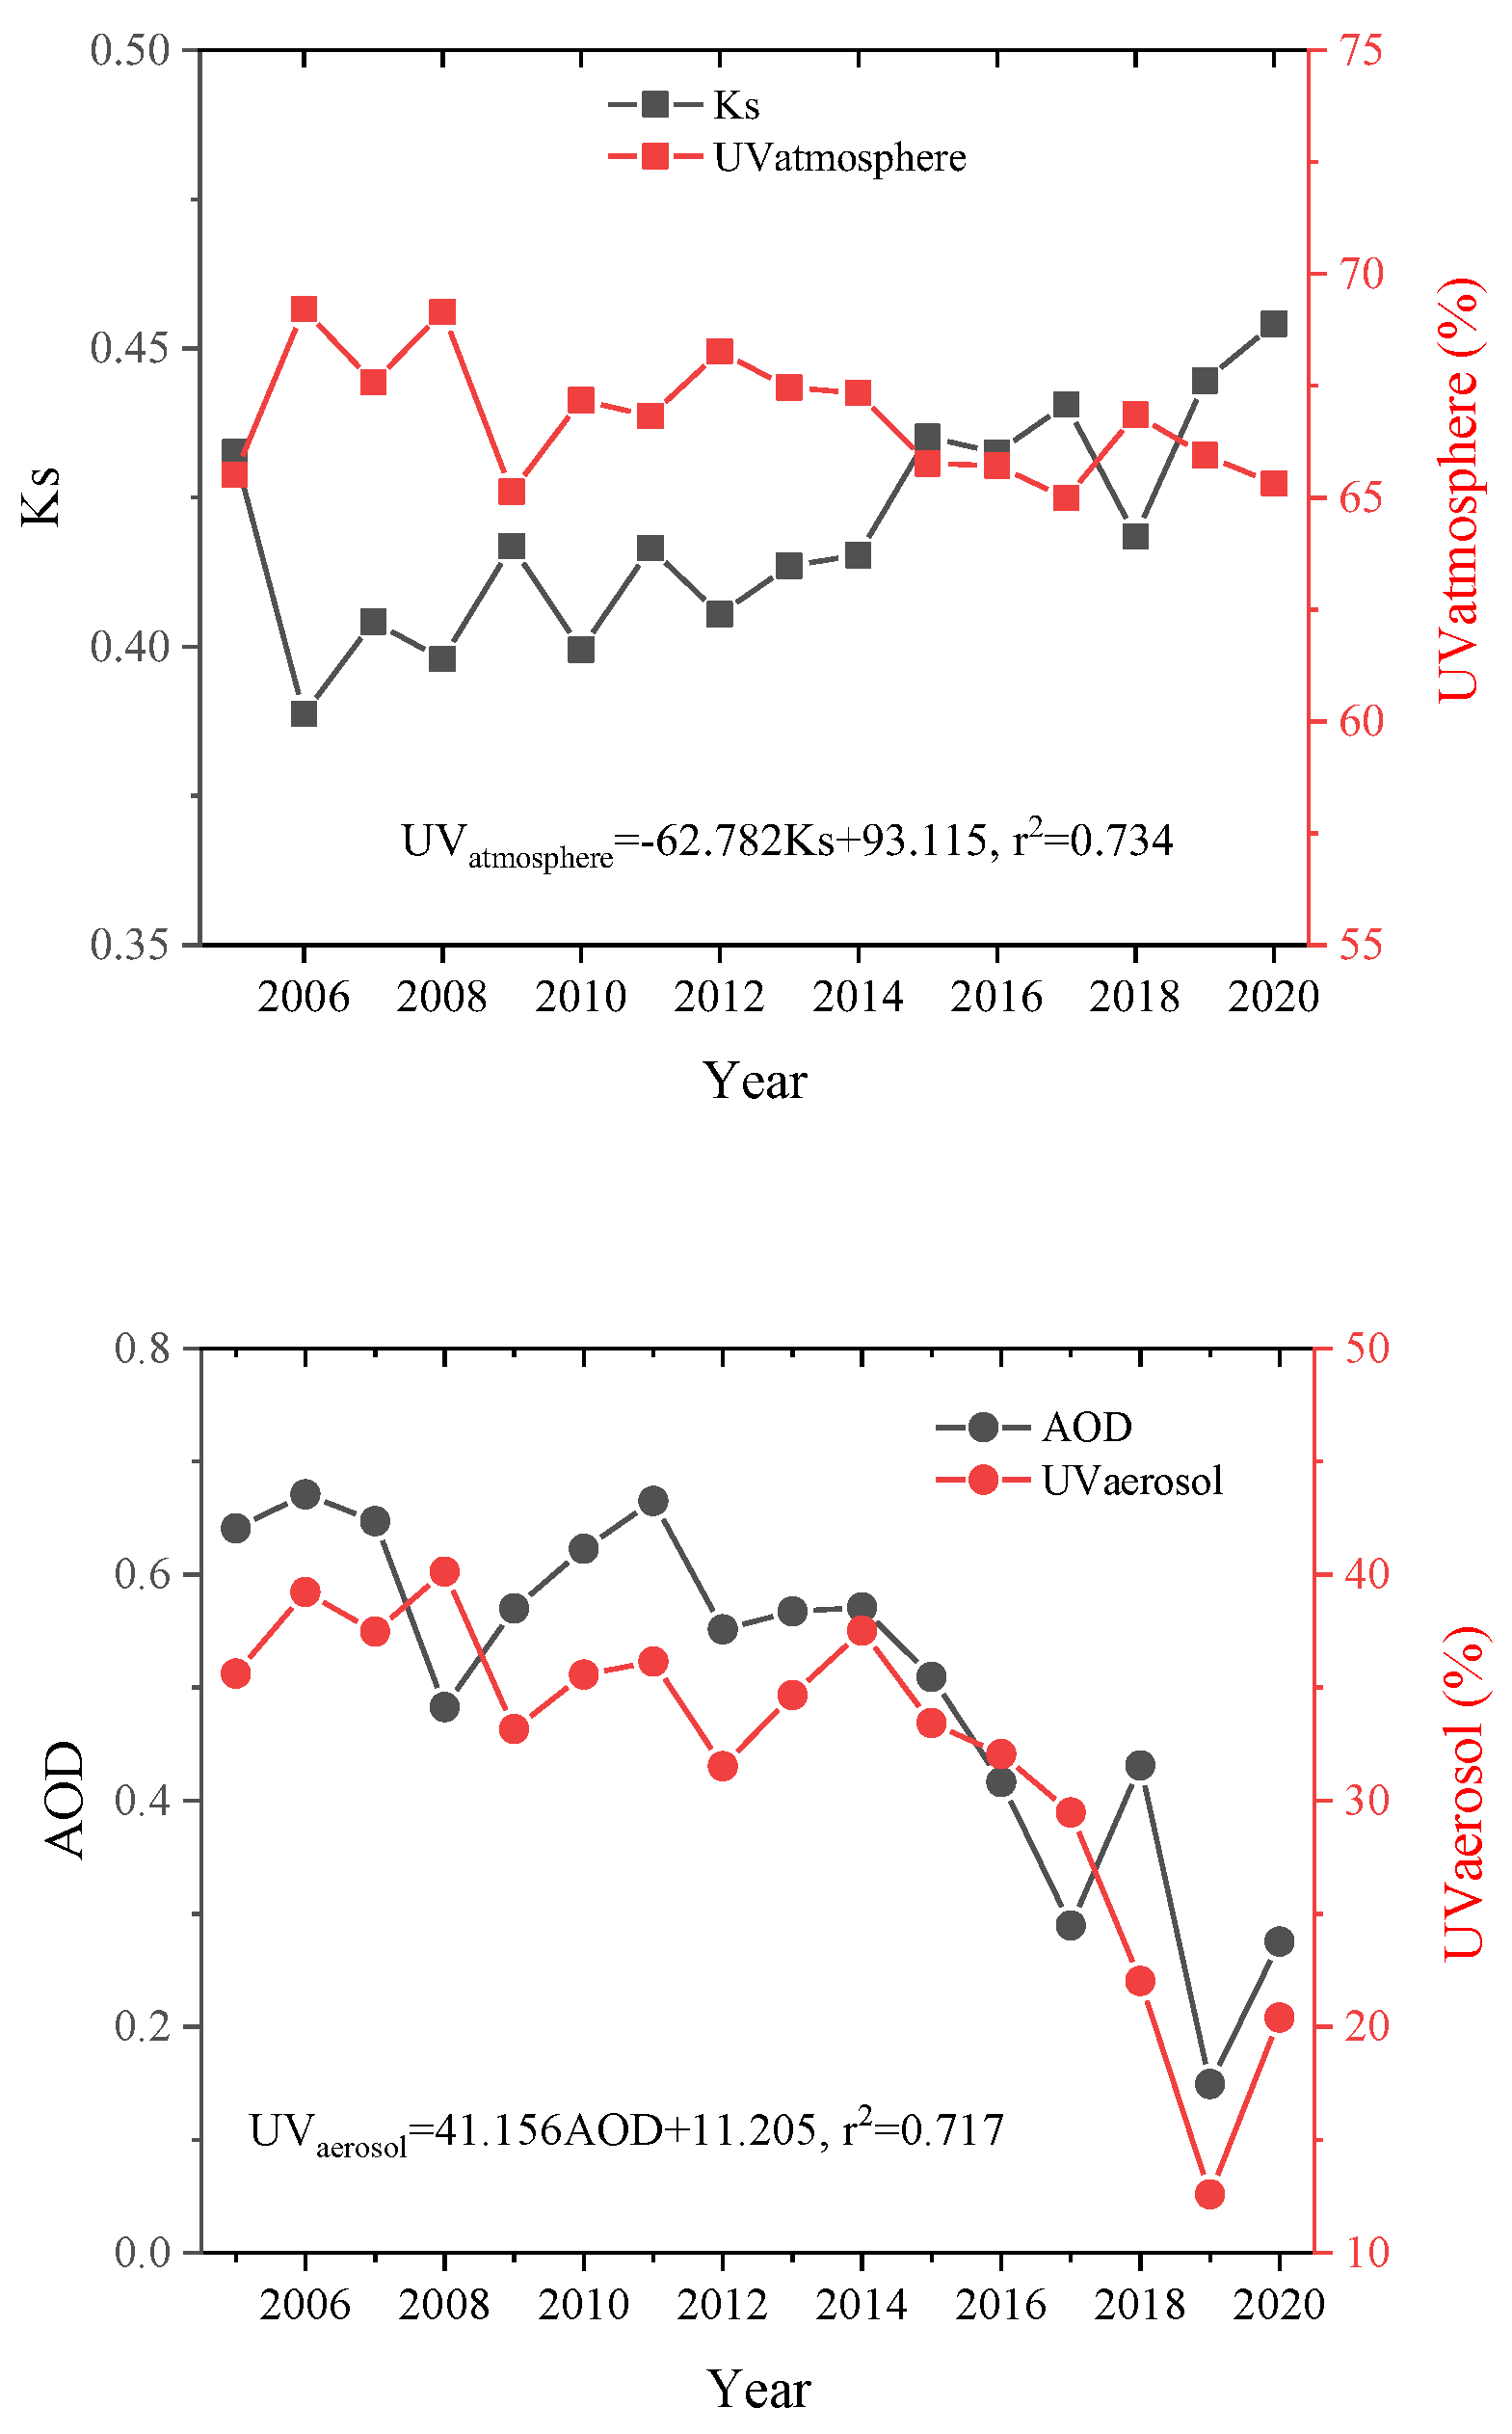
3.2.3. Characteristics of Annual Changes in Attenuation of UV Radiation by Aerosols and Clouds

The annual variation of UV3 from 2005 to 2020 is shown as the blue line in Figure 7, and the annual average value of UV radiation is 9.74 W/m2, with an overall upward trend. The UV radiation in Beijing from 2005 to 2020 is higher than that in Seoul from 2004 to 2013 [27], which was 7.7 W·m−2 shown in Table 1. The UV radiation reached the first high value (10.35 W/m2) in 2005, and then declined in 2006 compared to 2005 because of the occurrence of dust storms in 2006. In 2008, the Olympic Games were held in Beijing and strict emission standards for air pollutants were set, so the annual average value of UV radiation was relatively high around 2008 [28]. However, from 2010 to 2013, the annual mean value of UV radiation was relatively low, because after the financial crisis, the pursuit of rapid development led to higher concentrations of pollutants, the surface UV radiation was reduced, and the promulgation of the Action Plan on Air Pollution Prevention and Control in 2013 led to the improvement of air quality. The annual mean value of UV radiation showed an upward trend, reaching the highest value in 2017. The annual average value of UV radiation from 2018 to 2020 is lower than that of 2017 but also increases steadily.
The black line in Figure 7 shows the UV1 from 2005 to 2020, and a comparative analysis shows that there is a significant difference between UV1 and UV3, which suggests that the attenuation of the surface UV radiation level by the actual atmosphere (clouds and aerosols) is very significant. Under cloudless and aerosol free conditions, the annual average value of surface UV radiation from 2005 to 2020 is 23.77 W/m2, which is 14.03 W/m2 more than the annual average value of UV radiation under normal observation. The annual surface UV radiation fluctuates around ±0.2 W/m2 per year, with the maximum value occurring in 2019 (23.99 W/m2), and the minimum value in 2017 (23.68 W/m2), and the difference between the maximum and minimum values is 0.31 W/m2. The red line in Figure 7 shows the UV2 from 2005 to 2020, with an annual mean value of 16.49 W/m2, which is 7.28 W/m2 less than the simulated mean value of the UV1. Although there is a significant difference compared to the ideal situation, it is 6.75 W/m2 more than the average observed UV radiation, indicating that the attenuation of UV radiation by aerosols is weaker than that of the atmosphere, although it is obvious. The year 2006 was when UV radiation was at a low level (14.97 W/m2) due to the influence of sandstorms (Shao et al., 2006), and the annual mean UV radiation showed an overall decreasing trend during the period of 2006–2008, and from 2008 to 2013, due to the Olympic Games and the financial crisis. The annual mean value of UV radiation was in an up-and-down fluctuating process. From 2013 to 2020, the annual mean UV radiation showed a rapid increasing trend, and the UV radiation reached the maximum value by 2019 (21.45 W/m2), and the next highest value by 2020 (20.8 W/m2). This is due to the fact that the 2013 Atmospheric Administration has not been able to achieve the maximum value. This is due to the promulgation of the Action Plan on Air Pollution Prevention and Control in 2013, the aerosol concentration in Beijing is getting lower and lower, resulting in an increase in the surface UV radiation year by year, which is consistent with the results of the study by Tang et al. [29].
The annual average ARatmosphere from 2005 to 2020 is shown as the black line in Figure 8. The annual average of the ARatmosphere is 66.76%. This is similar to the averaged attenuation rate in Guangdong in Table 1 (75% [17]), but much higher than that in Lhasa (18% [18]) and Seoul (75% [27]). The overall attenuation rate varied between 64.99% and 69.21%, with a small range of fluctuation. The ARatmosphere reached the maximum in 2006 (69.21%), followed by the second highest value in 2008 (69.14%), and the smallest ARatmosphere in 2017 (64.99%). The clearness index (Ks) is introduced here, which is calculated by the ratio of Rs to the solar irradiance flux at the top of the atmosphere (R0) [18]. Rs is observed in Beijing from 2005 to 2020, and R0 is a function of longitude, latitude, date, and time. The relationship between Ks and ARatmosphere is shown in Figure 9, which presents an opposite form of change, confirming the rationality of the above conclusions.
The average annual ARaerosol (red line in Figure 8) is 31.94%, which is 34.82% less compared to that of the actual atmosphere. This indicates that aerosols are less capable of attenuating surface UV radiation than the actual atmosphere. The overall attenuation rate varies from 12.59% (in 2019) to 40.12% (in 2008), with a difference of 27.53% between the maximum value and the minimum value. The attenuation rate fluctuates up and down from 2005 to 2020, but the overall trend is decreasing. The relationship between AOD and ARaerosol (Figure 9) shows similar changes in annual characteristics, which could confirm the attenuation effect of UV radiation by aerosols. A comparison shows that the gradual decrease in aerosol concentration after the promulgation of the Action Plan on Air Pollution Prevention and Control leads to a decrease in attenuation rate.
According to the blue line in Figure 8, it can be seen that the average annual ARcloud is 40.22% from 2005 to 2020, and the overall attenuation rate varies from 31.29% to 55.16%. In 2019, the attenuation rate of cloud to UV radiation was the largest (55.16%), while in 2008, the attenuation rate was the lowest (31.29%), with a difference of 23.87% between the maximum and the minimum values. From 2005 to 2017, when the Ks increases, the attenuation rate of clouds on the surface UV radiation decreases. In 2017~2018, the clear-sky index had the largest decreasing trend, resulting in the largest increasing trend of ARcloud in 2018.

4. Conclusions

(1)
UV radiation is negatively correlated with AOD and positively correlated with SSA; the sensitivity of UV radiation to AOD is greater than that of SSA.
(2)
Comparison of UV3 with UV1 shows that the annual averaged ARatmosphere is 56.46%, with the attenuation rate ranging from 54.47% to 61.17%; the monthly averaged attenuation rate is 59.72%, ranging from 54.57% to 64.85%; the daily average attenuation rate is 65.81%; and the overall fluctuation range is 63.95% to 70.69%.
(3)
Comparing the simulations of UV1 and UV2, it is found that the annual averaged attenuation rate, monthly average attenuation rate, and daily averaged attenuation rate of aerosol on surface UV radiation are 30.64%, 30.48%, and 31.02%, respectively, and the attenuation rate of aerosol on UV radiation is at a maximum at 8:00 (35.34%), followed by 9:00 (32.68%), and minimum at 12:00 (28.12%).
(4)
The attenuation effect of clouds on UV radiation is stronger than that of aerosols, and its annual averaged attenuation rate, monthly averaged attenuation rate, and daily averaged attenuation rate on UV radiation are 40.22%, 42.04%, and 50.45%, respectively.
The quantitative effects of clouds and aerosols on ultraviolet radiation were calculated separately through a sensitivity test, without discussing the interaction between clouds and aerosols. Further in-depth research can be conducted to explore the quantitative contribution of the interaction between clouds and aerosols to UV radiation.

Author Contributions

Conceptualization, S.Z., H.X. and B.H.; data curation, S.Z., H.X. and B.H.; formal analysis, S.Z., H.X. and B.H.; methodology, S.Z.; validation, S.Z.; visualization, S.Z.; writing, S.Z.; review & editing, S.Z., H.X. and B.H.; software, S.W.; investigation, S.W. and Y.S.; project administration, B.H.; supervision B.H. and Y.S.; resources, S.Z. and B.H. All authors have read and agreed to the published version of the manuscript.

Funding

This research was funded by [National Key Research and Development Program of China] grant number [2022YFC3700705], [Natural Science Foundation of China] grant number [42075184], [National Beijing Natural Science Foundation] grant number [8202050], and [Natural Science Foundation for Young Scientists of Shandong Province (CN)] grant number [ZR2022QD140].

Institutional Review Board Statement

Not applicable.

Informed Consent Statement

Not applicable.

Data Availability Statement

Data available on request due to restrictions (e.g., privacy, legal or ethical reasons). The data presented in this study are available on request from the corresponding author (accurately indicate status).

Conflicts of Interest

The authors declare no conflict of interest.

References

  1. Bai, J.; Wang, G. Variation trends of solar UV radiation in Beijing during 1979–1996. Chin. J. Atmos. Sci. 1998, 22, 709–717. (In Chinese) [Google Scholar]
  2. Hu, B.; Wang, Y.; Liu, G. Variation characteristics of ultraviolet radiation derived from measurement and reconstruction in Beijing, China. Tellus B 2010, 62, 100–108. [Google Scholar] [CrossRef]
  3. Gueymard, C. The sun’s total and spectral irradiance for solar energy applications and solar radiation models. Sol. Energy 2004, 76, 423–453. [Google Scholar] [CrossRef]
  4. Kerr, J.B. Understanding the factors that affect surface ultraviolet radiation. Opt. Eng. 2005, 44, 041002. [Google Scholar] [CrossRef]
  5. Vieth, R. Critigue of the considerations for establishing the tolerable upper intake level for vitaminD: Critical need for revision upwards. J. Nutr. 2006, 136, 1117–1122. [Google Scholar] [CrossRef]
  6. Wu, T. Surface sunny ultraviolet radiation and biological effect. Meteorology 2021, 27, 54–57. (In Chinese) [Google Scholar]
  7. Peng, Q.; Zhou, Q. Ecological significance of enhanced UV-B radiation in secondary metabolism. Chin. J. Ecol. Agric. 2009, 17, 610–615. (In Chinese) [Google Scholar] [CrossRef]
  8. Browman, H. Assessing the impacts of solar ultraviolet radiation on the farly life stages of crustacean zooplankton and ichthyoplankton in marine coastal systems. Estuaries 2003, 26, 30–39. [Google Scholar] [CrossRef]
  9. Coakley, J.; Cess, R.; Yurevich, F. The effect of tropospheric aerosols on the earth’s radiation budget: A parameterization for climate models. J. Atmos. Sci. 1983, 40, 116–138. [Google Scholar] [CrossRef]
  10. Jerez, S.; Palacios-Peña, L.; Gutiérrez, C.; Jiménez-Guerrero, P.; López-Romero, J.M.; Pravia-Sarabia, E.; Montávez, J.P. Sensitivity of surface solar radiation to aerosol–radiation and aerosol–cloud interactions over Europe in WRFv3.6.1 climatic runs with fully interactive aerosols. Geosci. Model Dev. 2021, 14, 1533–1551. [Google Scholar] [CrossRef]
  11. Douglas, A.; L’Ecuyer, T. Quantifying variations in shortwave aerosol-cloud-radiation interactions using local meteorology and cloud state constraints. Atmos. Chem. Phys. 2019, 19, 6251–6268. [Google Scholar] [CrossRef]
  12. Li, Z.; Chen, H.; Cribb, M.; Dickerson, R.; Holben, B.; Li, C.; Lu, D.; Luo, Y.; Maring, H.; Shi, G.; et al. Overview of the East Asain study of tropospheric aerosols: An international regional experiment (EAST-AIRE). J. Geophys. Res. 2007, 112, D22S00. [Google Scholar] [CrossRef]
  13. Xia, X.; Chen, H.; Li, Z.; Wang, P.; Wang, J. Significant reduction of surface solar irradiance induced by aerosols in a suburban region in northeastern China. J. Geophys. Res. 2007, 112, D22S02. [Google Scholar] [CrossRef]
  14. Liu, J.; Xia, X.; Wang, P.; Li, Z.; Zheng, Y.; Cribb, M.; Chen, H. Significant aerosol direct radiative effects during a pollution episode in northern China. Geophys. Res. Lett. 2007, 34, L23808. [Google Scholar] [CrossRef]
  15. Ji, Y.; Wang, H.; Hu, Y.; Yang, T. Analysis of solar ultraviolet radiation variation characteristics and main influencing factors in Guiyang. Plateau Meteorol. 2011, 30, 1005–1010. (In Chinese) [Google Scholar]
  16. Ding, G.; Liu, C. Relationship between surface UV radiation and air quality in Hefei. Environ. Sci. Technol. 2014, 37, 378–381. (In Chinese) [Google Scholar]
  17. Deng, X.; Zhou, X.; Tie, X.; Wu, D.; Li, F.; Tan, H.; Deng, T. Attenuation of ultraviolet radiation reaching the surface due to atmospheric aerosols in Guangzhou. Chin. Sci. Bull. 2012, 57, 2759–2766. [Google Scholar] [CrossRef]
  18. Hu, B.; Wang, Y. The attenuation effect on ultraviolet radiation caused by aerosol and cloud in Lhasa, Tibetan Plateau of China. Adv. Space Res. Off. J. Comm. Space Res. (COSPAR) 2015, 56, 111–118. [Google Scholar] [CrossRef]
  19. Geiger, M.; Diabaté, L.; Ménard, L.; Wald, L. A web service for controlling the quality of measurements of global solar irradiation. Sol. Energy 2002, 73, 475–480. [Google Scholar] [CrossRef]
  20. System Description, AErosol RObotic NETwork. Available online: https://aeronet.gsfc.nasa.gov/new_web/system_descriptions.html (accessed on 30 July 2020).
  21. Madronich, S. Photodissociation in the atmosphere: 1. Actinic flux and the effect of ground reflections and clouds. J. Geophys. Res. 1987, 92, 9740–9752. [Google Scholar] [CrossRef]
  22. Ruggaber, A.; Dlugi, R.; Nakajima, T. Modelling radiation quantities and photolysis frequencies in the troposphere. Kluwer Acad. Publ. 1994, 18, 171–210. [Google Scholar] [CrossRef]
  23. Wang, S.; Su, W. Effect of atmospheric aerosols on UV-B radiation reaching the ground. J. Environ. Sci. 1993, 5, 224–229. [Google Scholar]
  24. Eck, T.F.; Holben, B.N.; Slutsker, I.; Setzer, A. Measurements of irradiance attenuation and estimation of aerosol single scattering albedo for biomass burning aerosols in Amazonia. J. Geophys. Res. Atmos. 1998, 103, 31865–31878. [Google Scholar] [CrossRef]
  25. Petters, J.L.; Saxena, V.K.; Slusser, J.R.; Wenny, B.N.; Madronich, S. Aerosol single scattering albedo retrieved from measurements of surface UV irradiance and a radiative transfer model. J. Geophys. Res. 2003, 108, 4288. [Google Scholar] [CrossRef]
  26. Wang, W.; Li, X.; Shao, M.; Hu, M.; Zeng, L.; Wu, Y.; Tan, T. The impact of aerosols on photolysis frequencies and ozone production in Beijing during the 4-year period 2012–2015. Atmos. Chem. Phys. 2019, 19, 9413–9429. [Google Scholar] [CrossRef]
  27. Lee, H.; Kim, W.; Lee, Y.G.; Kim, J.; Cho, H.K. Atmospheric Transmission of Ultraviolet and Total Solar Radiation by Clouds, Aerosols, and Ozone in Seoul, Korea: A Comparison of Semi-Empirical Model Predictions with Observations. Asia-Pac. J. Atmos. Sci. 2019, 55, 165–175. [Google Scholar] [CrossRef]
  28. Gao, W.; Gao, Q.; Chen, Y.; Ma, Z.; Gu, Y.; Li, W.; Li, W. Sandstorm event environment quality classification in Beijing. Resour. Sci. 2014, 36, 1527–1534. (In Chinese) [Google Scholar]
  29. Tang, L.; Hu, B.; Liu3, H.; Zhao, S.; Liu, J. Aerosol optical properties and direct radiative forcing in Beijing in the recent decade. Clim. Environ. Res. 2021, 26, 155–168. (In Chinese) [Google Scholar]
Figure 1. Sensitivity of ultraviolet radiation (UV) to aerosol optical depth (AOD).
Atmosphere 15 00311 g001
Figure 2. Sensitivity of ultraviolet radiation to single scattering albedo (SSA).
Atmosphere 15 00311 g002
Figure 3. Diurnal variation of ultraviolet radiation (black: UV1, red: UV2, blue: UV3).
Atmosphere 15 00311 g003
Figure 4. Daily averaged attenuation rate of ultraviolet radiation by atmosphere, AOD, and cloud (black: ARatmosphere, red: ARaerosol, blue: ARcloud).
Atmosphere 15 00311 g004
Figure 5. Monthly variation of ultraviolet radiation (black: UV1, red: UV2, blue: UV3).
Atmosphere 15 00311 g005
Figure 6. Monthly averaged attenuation rate of ultraviolet radiation by atmosphere, AOD, and cloud (black: ARatmosphere, red: ARaerosol, blue: ARcloud).
Atmosphere 15 00311 g006
Figure 7. Annual variation of ultraviolet radiation (black: UV1, red: UV2, blue: UV3).
Atmosphere 15 00311 g007
Figure 8. The annual attenuation rate of atmosphere, aerosol, and cloud to ultraviolet radiation (black: ARatmosphere, red: ARaerosol, blue: ARcloud).
Atmosphere 15 00311 g008
Figure 9. Characteristics between Ks (clearness index), AOD, and attenuation rate of UV radiation.
Atmosphere 15 00311 g009
Table 1. UV radiation and attenuation rate in other regions.
LocationPeriodUV RadiationAttenuationReference
Beijing, China2005–20209.9 W·m−266.76% (by atmosphere)This paper
Guangzhou, China2000, 2004, 20067 W·m−2
(monthly mean UVB)
75% (by atmosphere)Deng et al. [17]
Lhasa, Tibetan Plateau of China2005–20130.91 MJ·m−2·d−1 (annual)18% (by aerosols and clouds)Hu et al. [18]
Seoul, KoreaMarch 2004 to
February 2013
7.7 W·m−226% (by aerosols and clouds)Lee et al. [27]
Disclaimer/Publisher’s Note: The statements, opinions and data contained in all publications are solely those of the individual author(s) and contributor(s) and not of MDPI and/or the editor(s). MDPI and/or the editor(s) disclaim responsibility for any injury to people or property resulting from any ideas, methods, instructions or products referred to in the content.

