Article

Effects of Meteorological Factors on Asthma Hospital Visits in Haikou City, China

1
Hainan Climate Center, Haikou 570203, China
2
Key Laboratory of South China Sea Meteorological Disaster Prevention and Mitigation of Hainan Province, Haikou 570203, China
3
Hainan Meteorological Service Center, Haikou 570203, China
*
Authors to whom correspondence should be addressed.
These authors contributed equally to this work.
Atmosphere 2024, 15(3), 328; https://doi.org/10.3390/atmos15030328
Submission received: 21 January 2024 / Revised: 29 February 2024 / Accepted: 4 March 2024 / Published: 6 March 2024
(This article belongs to the Section Biometeorology)

Abstract

:
The effects of meteorological conditions on asthma in Haikou, a tropical city in China, are still unclear. This study aimed to determine the relationships between meteorological factors and the number of asthma hospital visits in Haikou. A Poisson generalized additive model combined with a distributed lag nonlinear model is used to model the nonlinear exposure–response relationship between the daily mean temperature and asthma hospital visits. The daily mean pressure and air quality are used as covariates and simultaneously control the mixed effects of holiday effects, weekend effects, and long-term trends. The results indicate that there is a significant statistical relationship between the daily mean temperature and asthma hospital visits, which shows an inverted J-shaped relationship. When the daily mean temperature is below the reference value (29.3 °C), the number of asthma patients increases considerably, and there is a marked lag in the prevalence of asthma. The longest lag is 9 days, and the most pronounced impact of the daily mean temperature on the number of asthma hospital visits can be found when the lag time is 1–4 days. When the daily mean temperature is 10 °C, the cumulative effect of the relative risk of asthma is 2.204, an increase of 120.4% (95% CI 1.294–3.755). If the daily mean temperature is below the 2.5th percentile value (14.8 °C), the relative risk significantly increases by more than 5.3% (95% CI 1.000–1.110), and the longest lasting impact time is 5 days. This indicates that increases in asthma hospital visits in Haikou, China, are significantly correlated with low-temperature weather. We suggest that preventive measures for asthma should take low-temperature weather into account. Additionally, we also found that extremely high temperatures have a certain impact on the increase in asthma hospital visits, but that the correlation is not significant.

1. Introduction

Asthma is a common respiratory disease, usually characterized by chronic airway inflammation and manifested by respiratory symptoms, such as wheezing, shortness of breath, chest tightness, and cough, which vary over time and in intensity [1]. Asthma is a global health problem that affects over 300 million people worldwide and is the most common chronic lung disease in children and adolescents [2,3]. Globally, there are noticeable differences in the prevalence of asthma, which is more common in high-income countries; however, some low- and medium-income countries also have high levels of asthma symptom prevalence [3]. China, a developing country with the world’s largest population, has undergone unprecedented developments in its social and economic environment in recent decades. According to a survey by the National Cooperative Group on Childhood Asthma in China, the prevalence of childhood asthma in China shows a growth trend reaching 3.02% by 2010 [4]. The number of asthma patients is 45.7 million, and asthma is a major public health issue, which, due to its high prevalence in China, must be seriously challenged and, ultimately, solved [5]. Meanwhile, with the rapid socio-economic development of Haikou city, Hainan province, China in recent decades, the prevalence of childhood asthma there increased from 1.42% in 2000 to 3.19% in 2010 [4,6]. However, the causes of the increase in asthma prevalence in Haikou city are still unclear.
Previous studies have found that the seasonal variations in environmental factors, such as meteorological conditions [2,7,8,9,10,11,12,13,14,15,16,17,18,19,20,21,22,23,24,25,26,27], air pollution [9,12,16,20,28,29,30,31], airborne allergens [9,32,33], and viruses [34,35], are related to the prevalence of asthma in children and adults. Klabuschnigg et al. conducted a study on the effects of meteorological and environmental factors on asthma and found that the amount of pollen and spores is correlated with childhood asthma prevalence, and that both low and high air pressure environments have an influence on asthma attacks [32]. Erbas et al. determined that seasonal pollen and the human rhinovirus may play important roles in childhood asthma attacks [33,35]. Recent studies have also found that air pollutants, such as nitrogen dioxide (NO2), sulfur dioxide (SO2), particulate matter with a diameter less than 2.5 μm (PM2.5) and 10 μm (PM10), carbon monoxide (CO) and ozone (O3), and pollen, dramatically increase the risk of emergency department visits and hospital admissions of pediatric asthma patients [29,30,31]. Other studies have proposed that climate factors, such as temperature, humidity, and diurnal temperature range, are associated with hospitalization for childhood asthma [22,23,36]. Extreme meteorological factors have been found to be triggering factors of childhood asthma attacks, and childhood asthma attacks present a remarkable seasonal pattern [2,11,37]. Lei et al. have demonstrated that the increase in temperature variation between adjacent days during the warm season can increase the risk of asthma attacks in children [25], and Liu et al. have revealed that cold waves are also associated with hospitalization for childhood asthma [24]. Moreover, temperature, wind speed, and humidity are related to asthma-related hospitalization of children 0–5 years old, and the air quality index (AQI) is related to the asthma hospitalization of children 6–14 years old [20]. Among the studies on the meteorological environmental factors mentioned above, research on temperature has been found to be the most extensive and has mainly focused on time series. However, there is still uncertainty among studies on the relationship between ambient temperature and childhood asthma, and the results and conclusions vary across regions [38].
Therefore, despite the relationship between meteorological factors and the exacerbation of asthma attacks, the key factors affecting asthma are different across regions. In addition, previous studies have mainly focused on developed countries and regions, as well as on cities in temperate and subtropical climate zones. Currently, there is no research on the effects of meteorological conditions on asthma in tropical regions. Haikou, located in the north of Hainan island, is the political, economic, scientific, technological, and cultural center of Hainan province, China, and a tropical coastal city. In this study, we aim to explore the relationships between meteorological factors and the number of asthma patients in Haikou city and provide guidance for the prevention and treatment of asthma in the tropics.

2. Materials and Methods

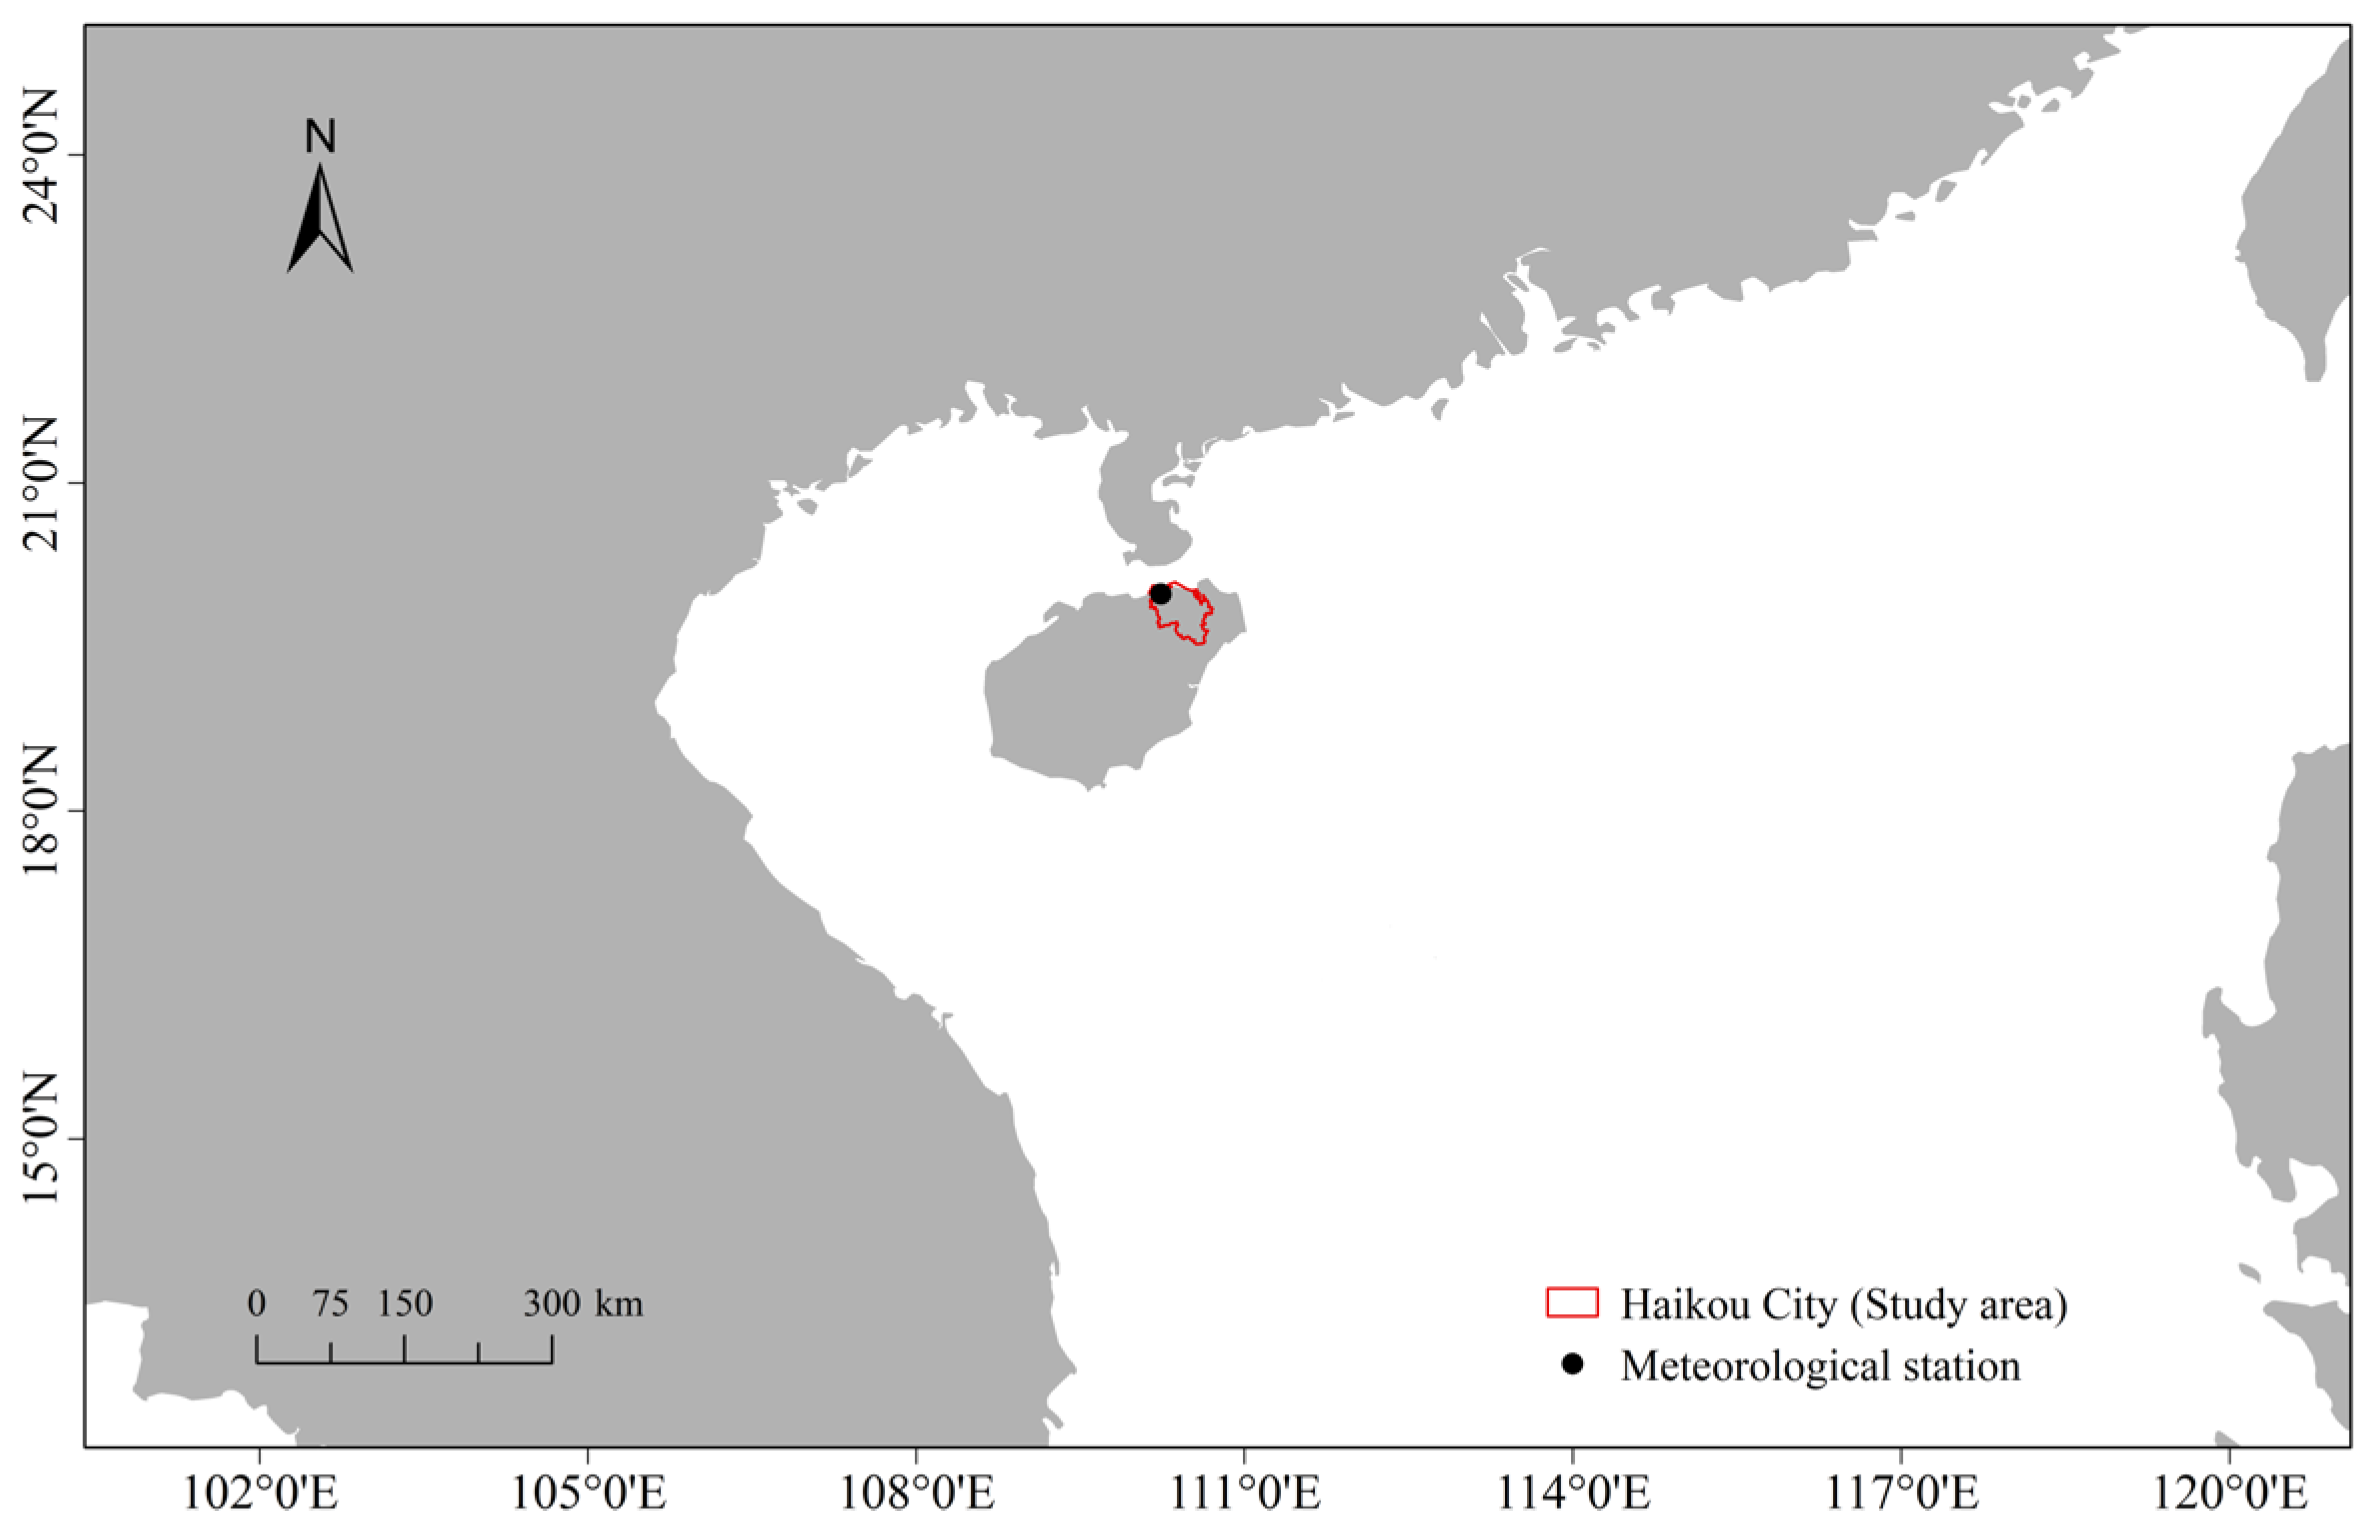
2.1. Study Area and Data Collection

The study area was Haikou city (19°31′ N–20°04′ N, 110°07′ E–110°42′ E), located at the northern edge of the low-latitude tropics and in the tropical monsoon climate zone (Figure 1). It is the capital of Hainan province, China, and had a resident population of 2.9397 million at the end of 2022.
The asthma dataset used in this study was obtained from Hainan Provincial People’s Hospital, which is the largest tertiary comprehensive hospital in Hainan province. The asthma dataset was extracted from the hospital information system and includes the date of visit, gender, age, date of birth, place of residence, and registered residence, and information on daily asthma hospital visits (including emergency department visits and outpatient visits) from September 2016 to August 2019 were collected. Data anonymization was conducted before the analyses to protect the patients’ privacy and personal information, and then the total number of daily visits was calculated. Before data anonymization and retrieval of the statistics, the authors could not access the patients’ personal information, and there was no interaction with the patients in our study. The data were screened according to the following criteria. Specifically, the diagnosis code of asthma is J45 according to the International Classification of Diseases, 10th revision. The residence of the patients was Haikou city, and the required patient information was complete, without any obvious missing items. Moreover, patients who had a repeat visit within one week after their initial visit were excluded.
The meteorological data used in this research include the daily mean atmospheric pressure (Prs, hPa), daily maximum atmospheric pressure (Pmax, hPa), daily minimum atmospheric pressure (Pmin, hPa), daily mean temperature (Tmean, °C), daily maximum temperature (Tmax, °C), daily minimum temperature (Tmin, °C), relative humidity (RH, %), daily rainfall (R, mm), and daily mean wind speed (WS, m s−1), which were collected from the Hainan Meteorological Service. The data from the Haikou National Meteorological Station (located at 20°00′ N, 110°15′ E) were used in the study as they have been well calibrated, are highly correlated with the records from other stations and are representative of the overall weather conditions of Haikou (Figure 1).
The daily air quality data are from the monitoring data in Haikou issued by the China Environmental Monitoring Center, including SO2, NO2, O3, CO, PM2.5, PM10, and the AQI. The AQI is the maximum value of individual air quality indexes of regularly monitored air pollutants [20].

2.2. Statistical Analysis

The correlations among each meteorological factor, pollutant, and number of asthma hospital visits were analyzed by Spearman rank correlation, and the Spearman correlation coefficient was used to express the degree of correlation between the variables. A positive correlation indicates that an increase in one feature’s value increases the value of the target variable, whereas a negative correlation means that an increase in one feature’s value reduces the value of the target variable. The closer the absolute value of the correlation coefficient is to 1, the stronger the correlation is. The correlation analysis is based on the p-value, and significance was tested at the test level a = 0.01 and a = 0.05 (2-tailed). The descriptive results are expressed as the mean values, standard deviations, and percentile values. We performed the Spearman rank correlation to assess whether variables could be included as key variables in the model.
Daily asthma hospital visits are small-probability events relative to the total population, following a Poisson distribution. Therefore, combined with the distributed lag nonlinear model (DLNM), we used a generalized additive model (GAM) with a Poisson regression to investigate the relationship between the daily mean temperature, the daily asthma hospital visits [39], and other environmental factors. Additionally, the impact of mixed factors, such as days of the week and holidays, were considered.
Firstly, a cross-basis matrix of the Tmean with lag time was established, and then the AQI, PM10, and Prs were used as covariates to control the mixed effects of holiday effects, weekend effects, and long-term trends to develop a DLNM model based on the nested GAM of the base variables of meteorological elements.
The exposure–response relationship between the Tmean and the daily asthma hospital visits was analyzed [39]. The basic model can be expressed as Equation (1).
ln E Y t = α + f T m e a n t · l + N S P r s , d f 1 + N S A Q I , d f 2 + N S P M 10 , d f 3 + N S T i m e , d f 4 + γ 1 D O W + γ 2 h o l i d a y
where Y t indicates the number of daily asthma hospital visits, which approximately follow the Poisson distribution. The expected value of Y t is E Y t . α denotes the model intercept. f T m e a n t · l represents the cross-basis function of the independent variable Tmean with the lag time dimension l (0, 1, …, l), and the maximum lag time (l) is 9 days. The temperature exposure–response dimension was obtained based on a B-spline function, where degree = 3 and df = 4. The exposure lag effect dimension was fitted with a polynomial function, where degree = 2. N S P r s , d f 1 , N S A Q I , d f 2 , and N S P M 10 , d f 3 denote the natural cubic spline functions of the Prs, AQI, and PM10, respectively, with the degree-of-freedom parameters df1, df2, and df3 all equal to 3. “Time” is a time variable (1, 2, …, 1095), and N S T i m e , d f 4 indicates the natural cubic spline function of the time variable. Long-term trends were fitted by the time variable with 7 degrees of freedom per year, i.e., the degree-of-freedom parameter df4 was 21 (3 × 7). D O W represents the day of the week, and h o l i d a y denotes festivals and holidays. Both D O W and h o l i d a y appear as dummy variables in the model. The low-temperature and high-temperature environments were calculated relative to the reference temperature (29.3 °C), which was taken to be the temperature giving the lowest relative risk (RR) in the cumulative exposure–response curve for asthma hospital visits [40]. All RR estimates were calculated relative to the reference temperature.
A sensitivity analysis was conducted by changing the temperature metrics from daily minimum to daily mean and daily maximum temperatures to compare and best capture the effects of temperature on asthma hospital visits. Based on this, it was decided that the daily mean temperature should be the ambient temperature metric of choice because it was the better predictor than daily minimum and maximum temperatures. As part of the sensitivity analysis, we also varied the degree between 1 and 4, the df between 2 and 9, and maximum lag days of 1 to 50 d. A quasi-Akaike information criterion (QAIC) was conducted to evaluate the goodness of model fit. All statistical analyses were conducted using R software (version 4.1.3), mainly using the “pastecs”, “mgcv”, “dlnm”, and “ggplot2” packages. The statistical significance level of 0.05 was adopted for the analyses.

3. Results

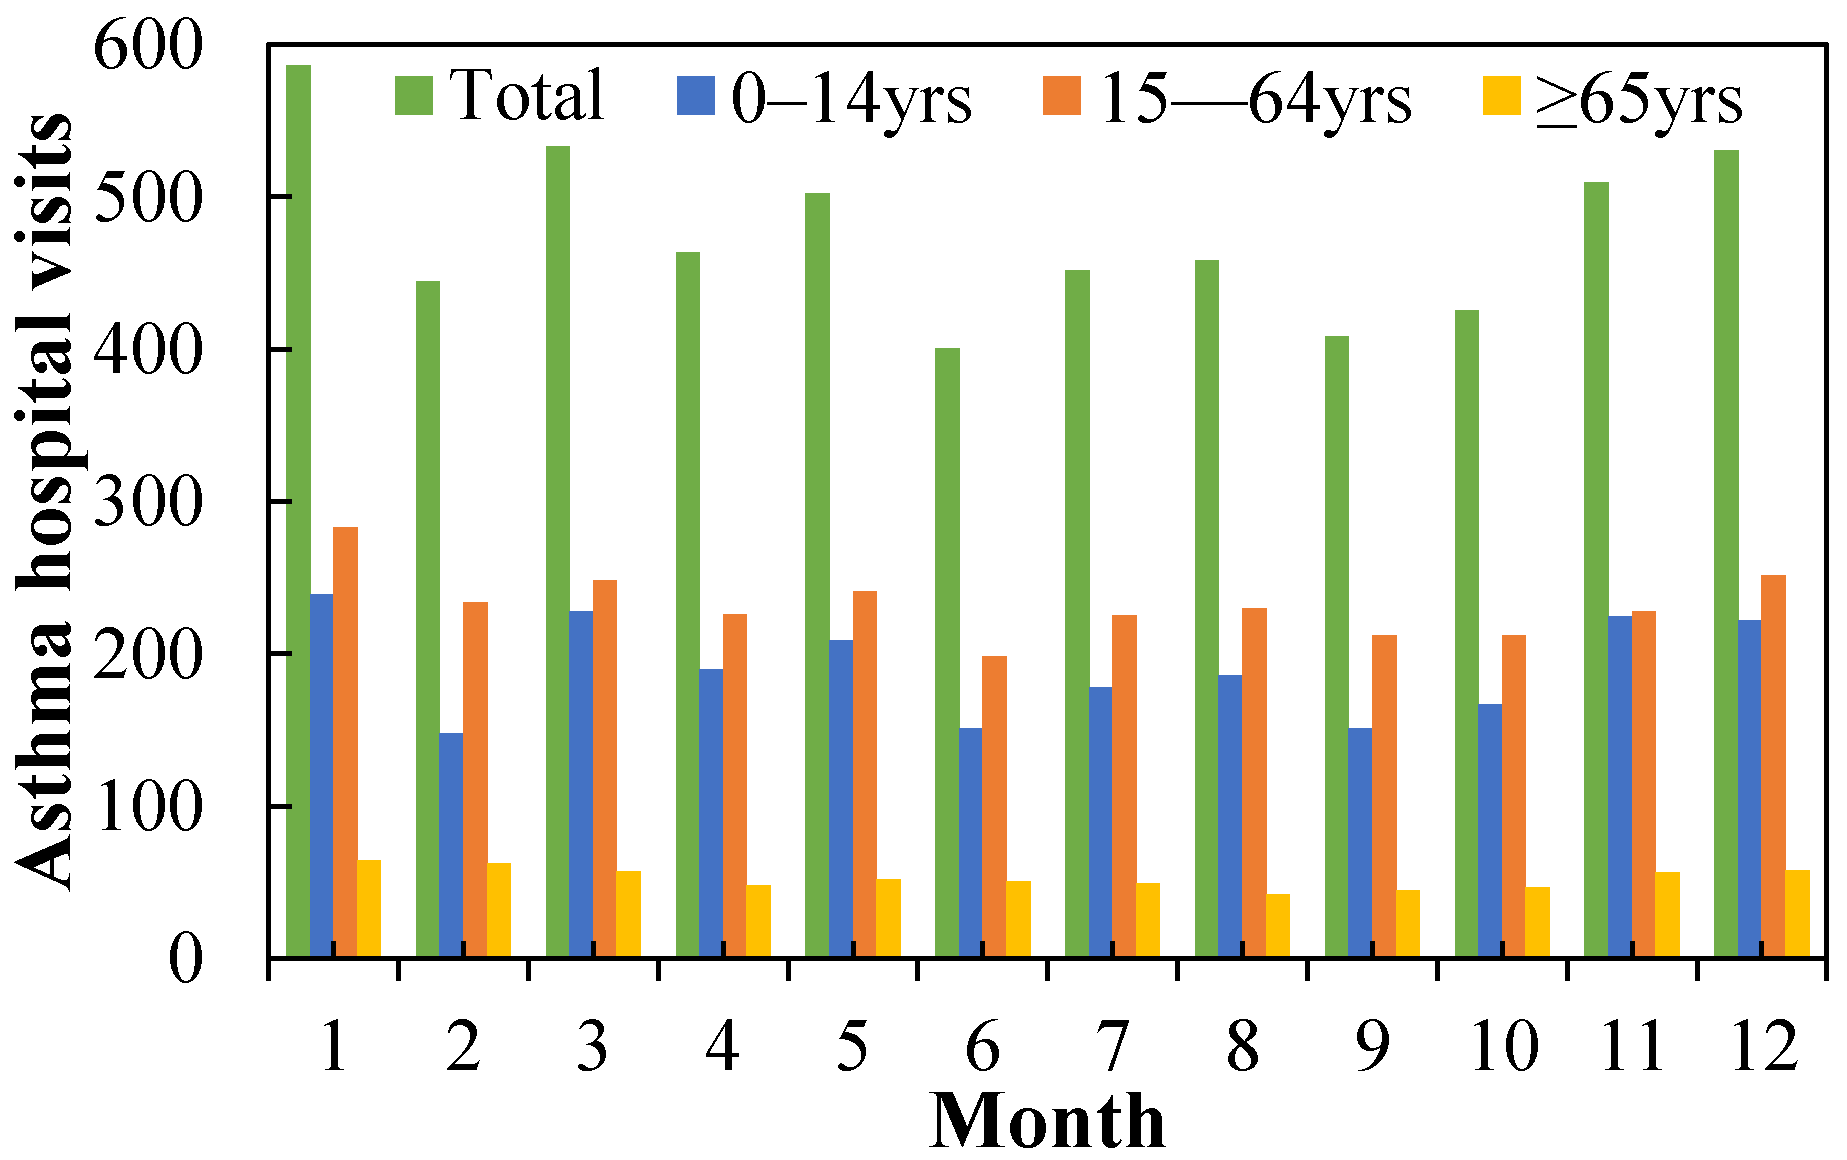
3.1. Descriptive Statistical Analysis

Table 1 shows the descriptive statistical results of meteorological factors, air pollutants, and daily asthma hospital visits in Haikou from September 2016 to August 2019. It can be seen that the daily mean values of the Prs, Pmax, Pmin, Tmean, Tmax, Tmin, RH, R, and WS were 1003.9 hPa, 1005.9 hPa, 1002.0 hPa, 25.1 °C, 28.7 °C, 22.6 °C, 26.2 hPa, 81.4%, 5.5 mm, and 2.9 m∙s−1, respectively. The daily mean AQI value was 41.2, and the daily mean concentrations of PM2.5, PM10, SO2, NO2, CO, and O3 were 18.2 μg∙m−3, 34.0 μg∙m−3, 5.6 μg∙m−3, 12.6 μg∙m−3, 0.6 μg∙m−3, and 72.7 μg∙m−3, respectively. The total number of asthma hospital visits was 17,142, which included 6877 people aged 0–14 years, 8368 people aged 15–64 years, and 1897 people aged ≥65 years. The mean number of daily asthma hospital visits was 15.7, with the highest number (7.6) of people aged 15–64 years, 6.3 who were aged 0–14 years, and 1.7 who were aged ≥65 years.
Figure 2 displays the monthly mean numbers of asthma hospital visits in different age groups from August 2016 to August 2019. The results show that the number of asthma hospital visits had an increasing trend during September–March and decreased starting in April. There are three peaks in the total monthly mean number of asthma patients, namely in January (586), March (533), and December (531), and the patient number of the 15–64-year-old age group was the largest. The lowest total number was in June, with 400. Note that the number of asthma hospital visits in February was considerably lower than in November, December, January, and March, possibly due to the impact of the Chinese Spring Festival holiday.
The total number of asthma hospital visits had highly significant positive correlations (the correlation is significant at the 0.01 significance level) with the Prs, Pmax, Pmin, AQI, and PM10, and significant positive correlations (the correlation is significant at the 0.05 significance level) with the WS, PM2.5, and O3 (Table S1). Additionally, the total number of asthma hospital visits was significantly negatively correlated with the Tmean, Tmax, and Tmin. The other factors had no statistically significant correlation with the total number of asthma hospital visits. We chose the factors that had highly significant positive correlations to study their effect on the total number of asthma visits. However, due to the high correlation among the three temperature factors, the correlation among the three pressure factors was also high (Table S2). Therefore, in order to study the effect of temperature on asthma disease, the DLNM model was constructed using the Tmean as the temperature factor, while Prs, AQI, and PM10 were used as covariates.

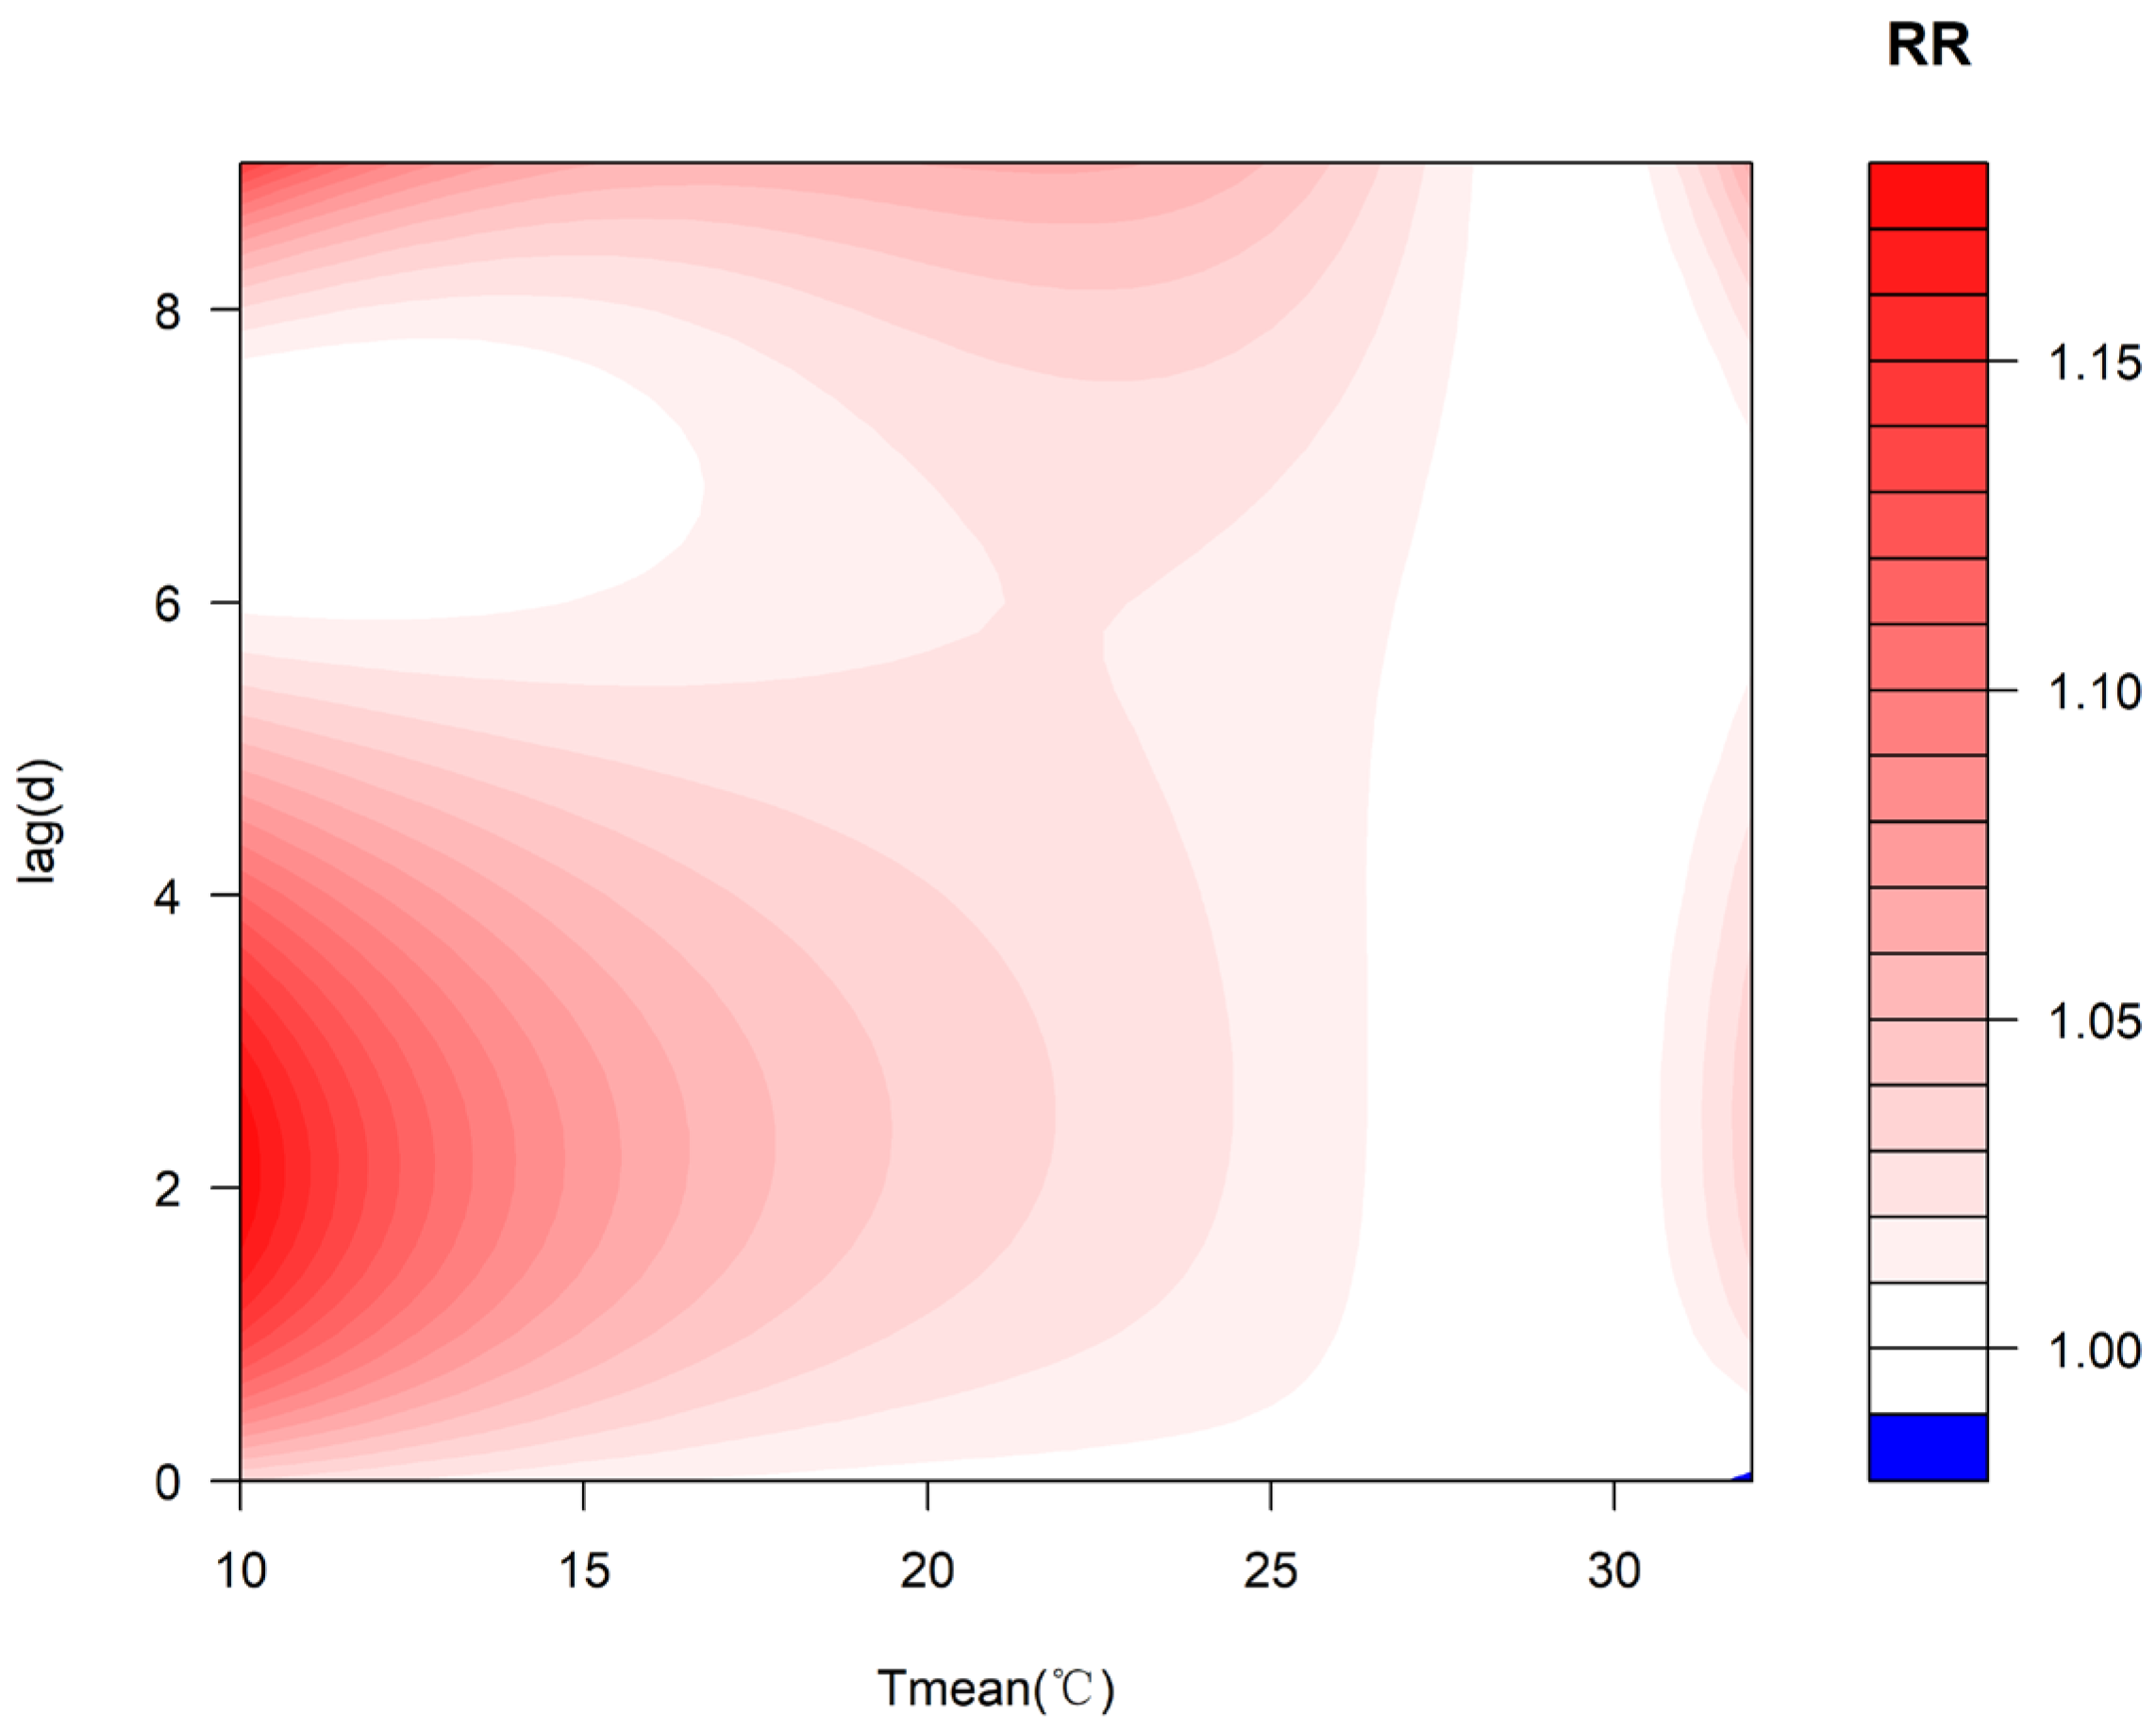
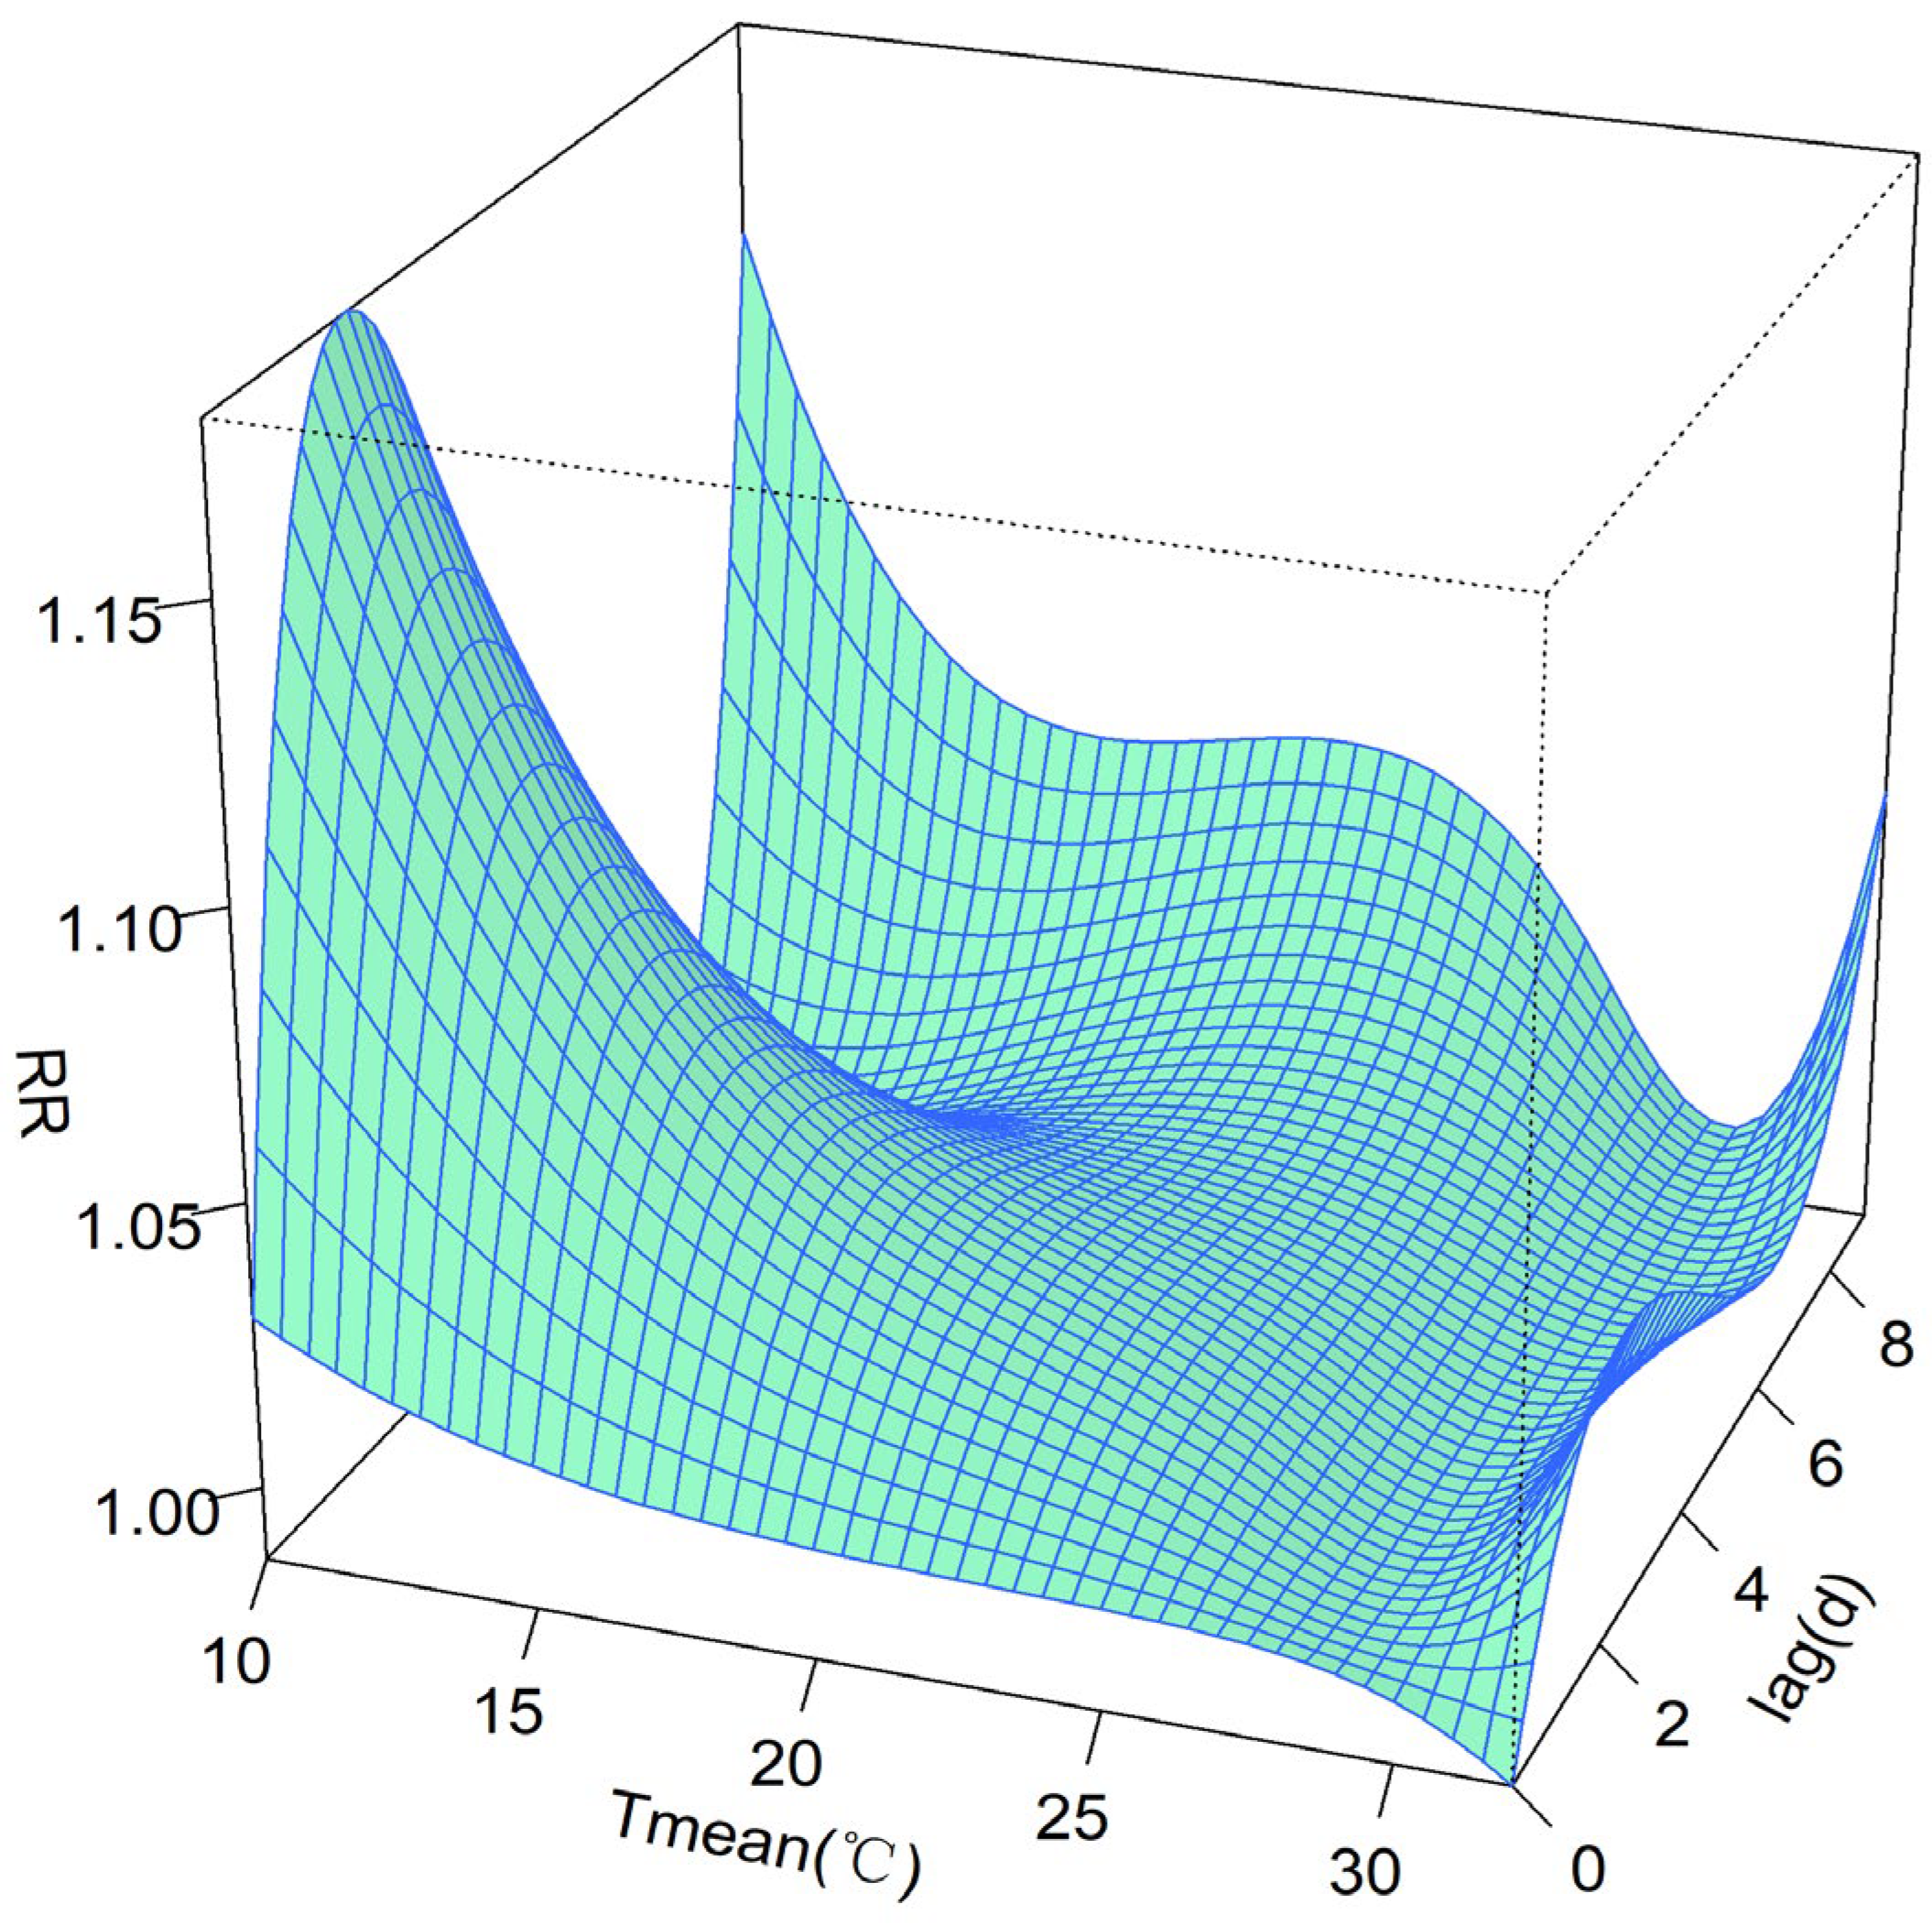
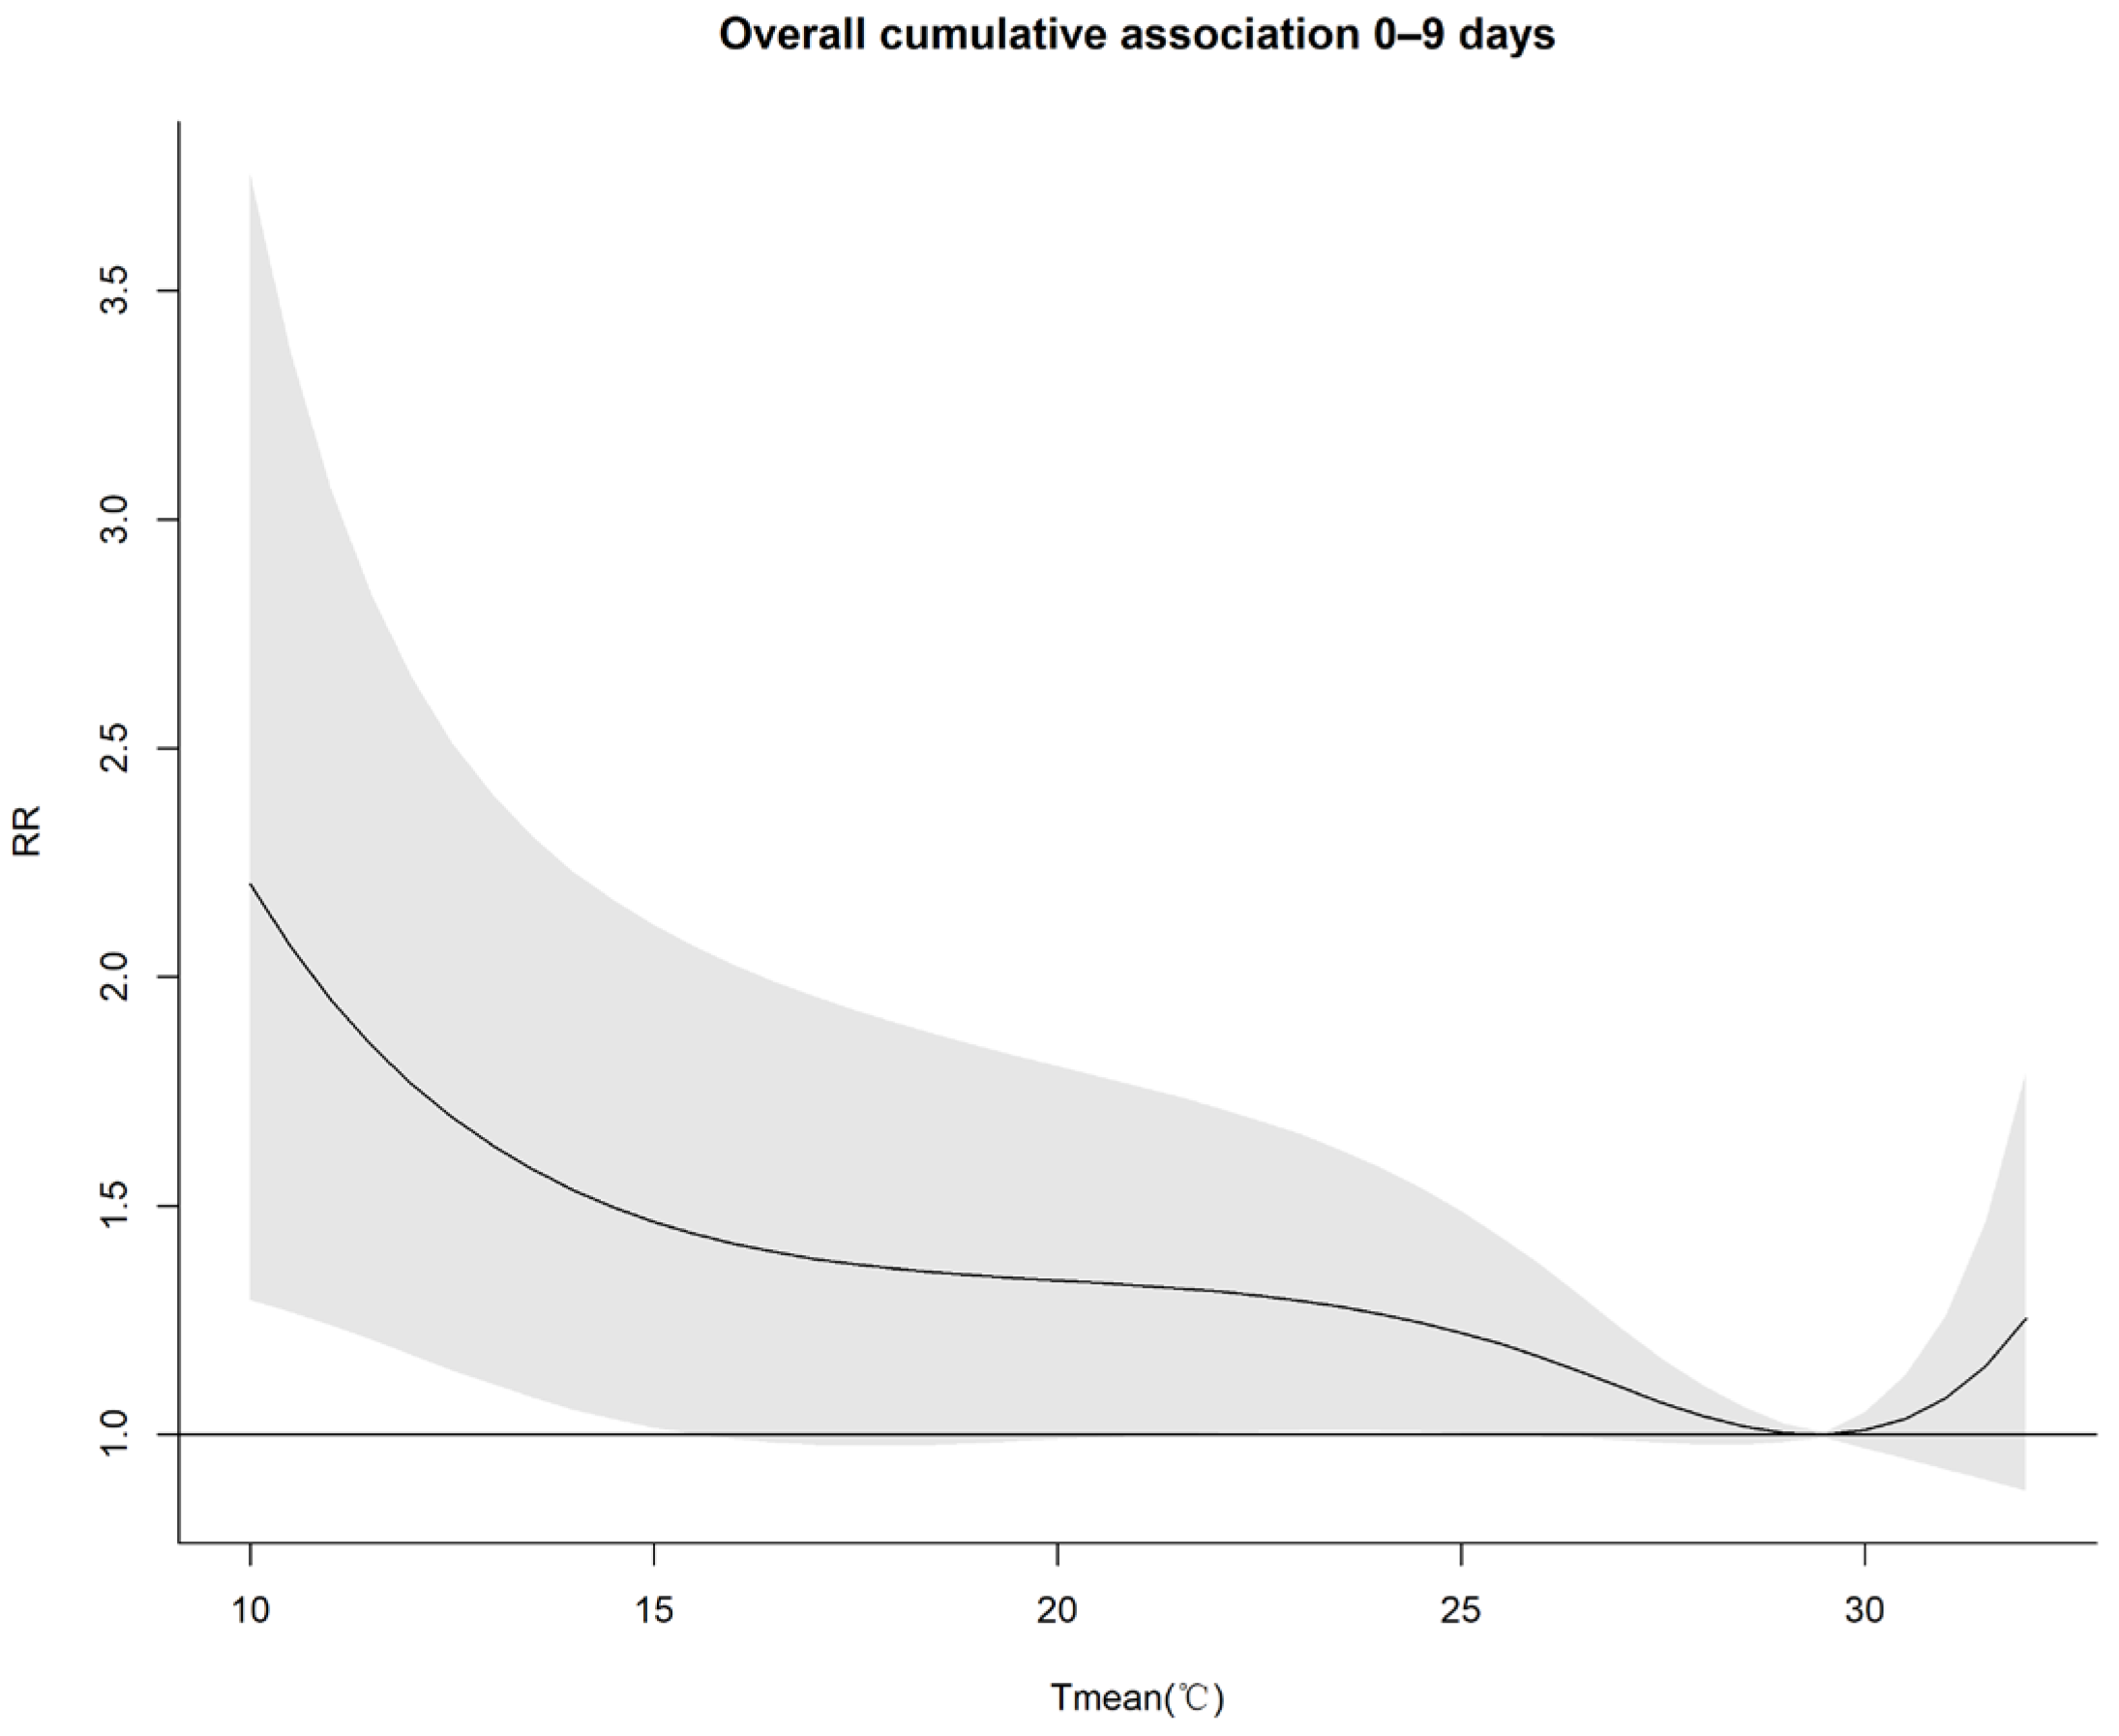
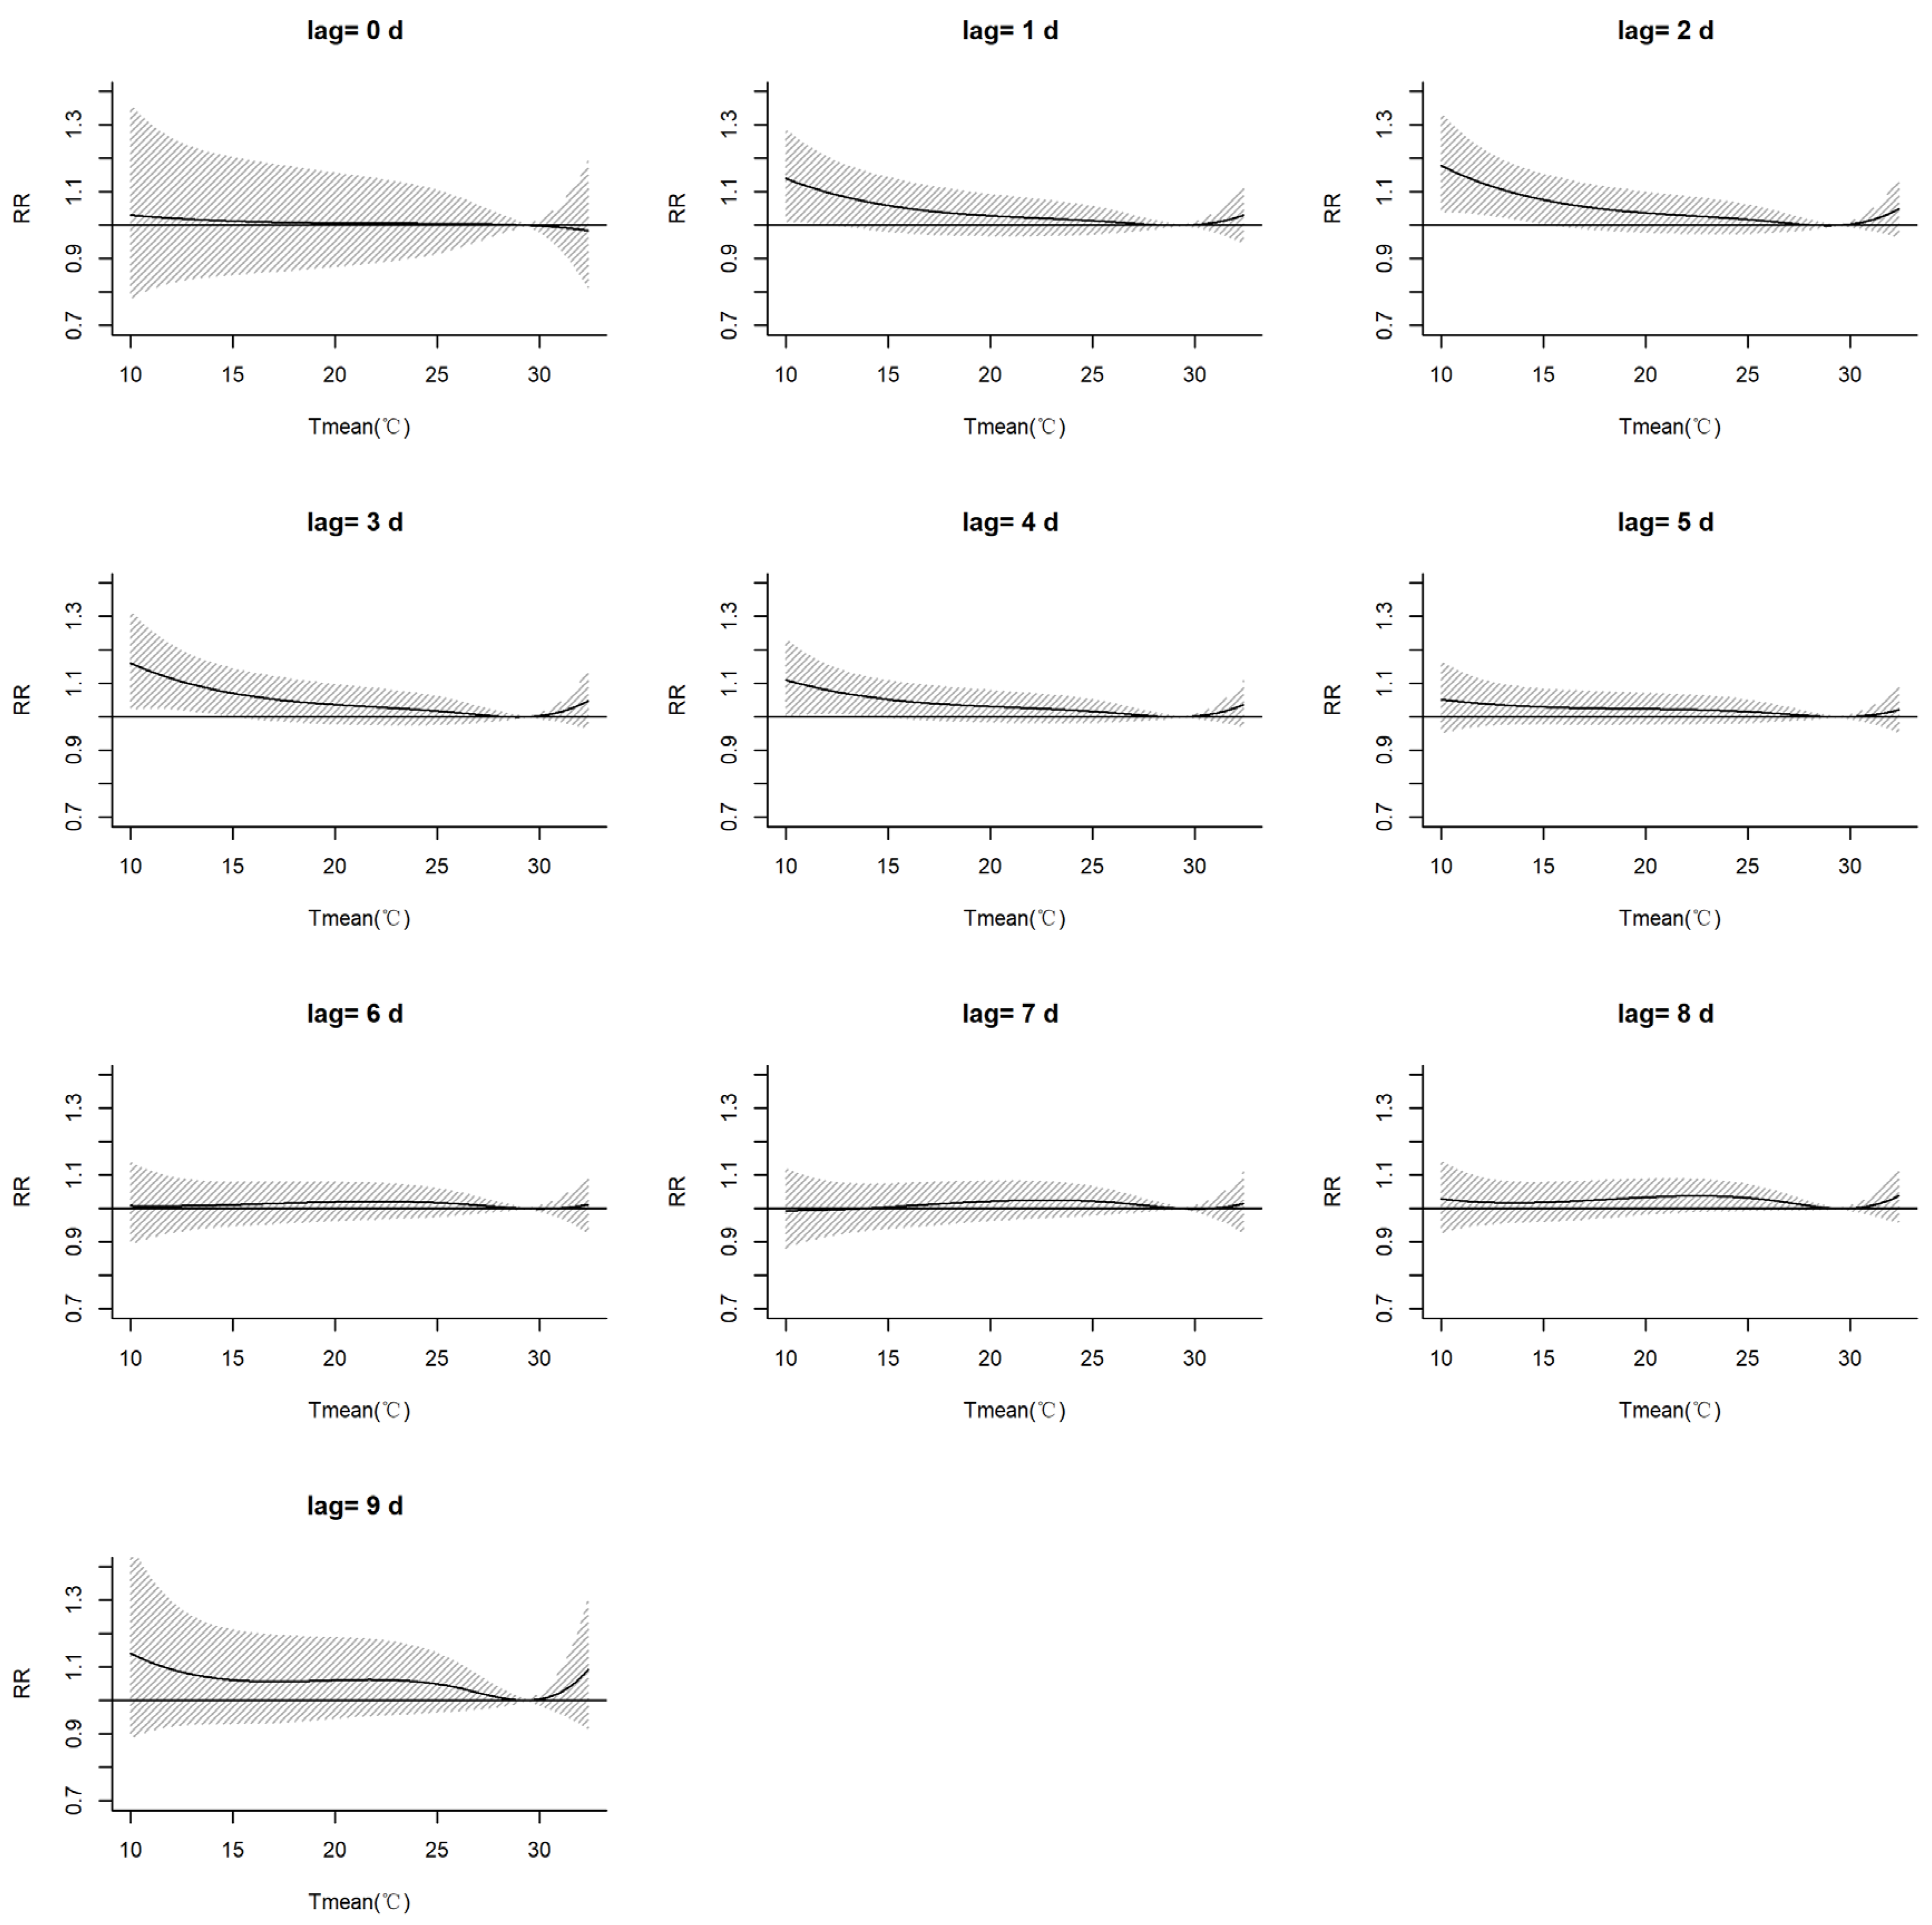
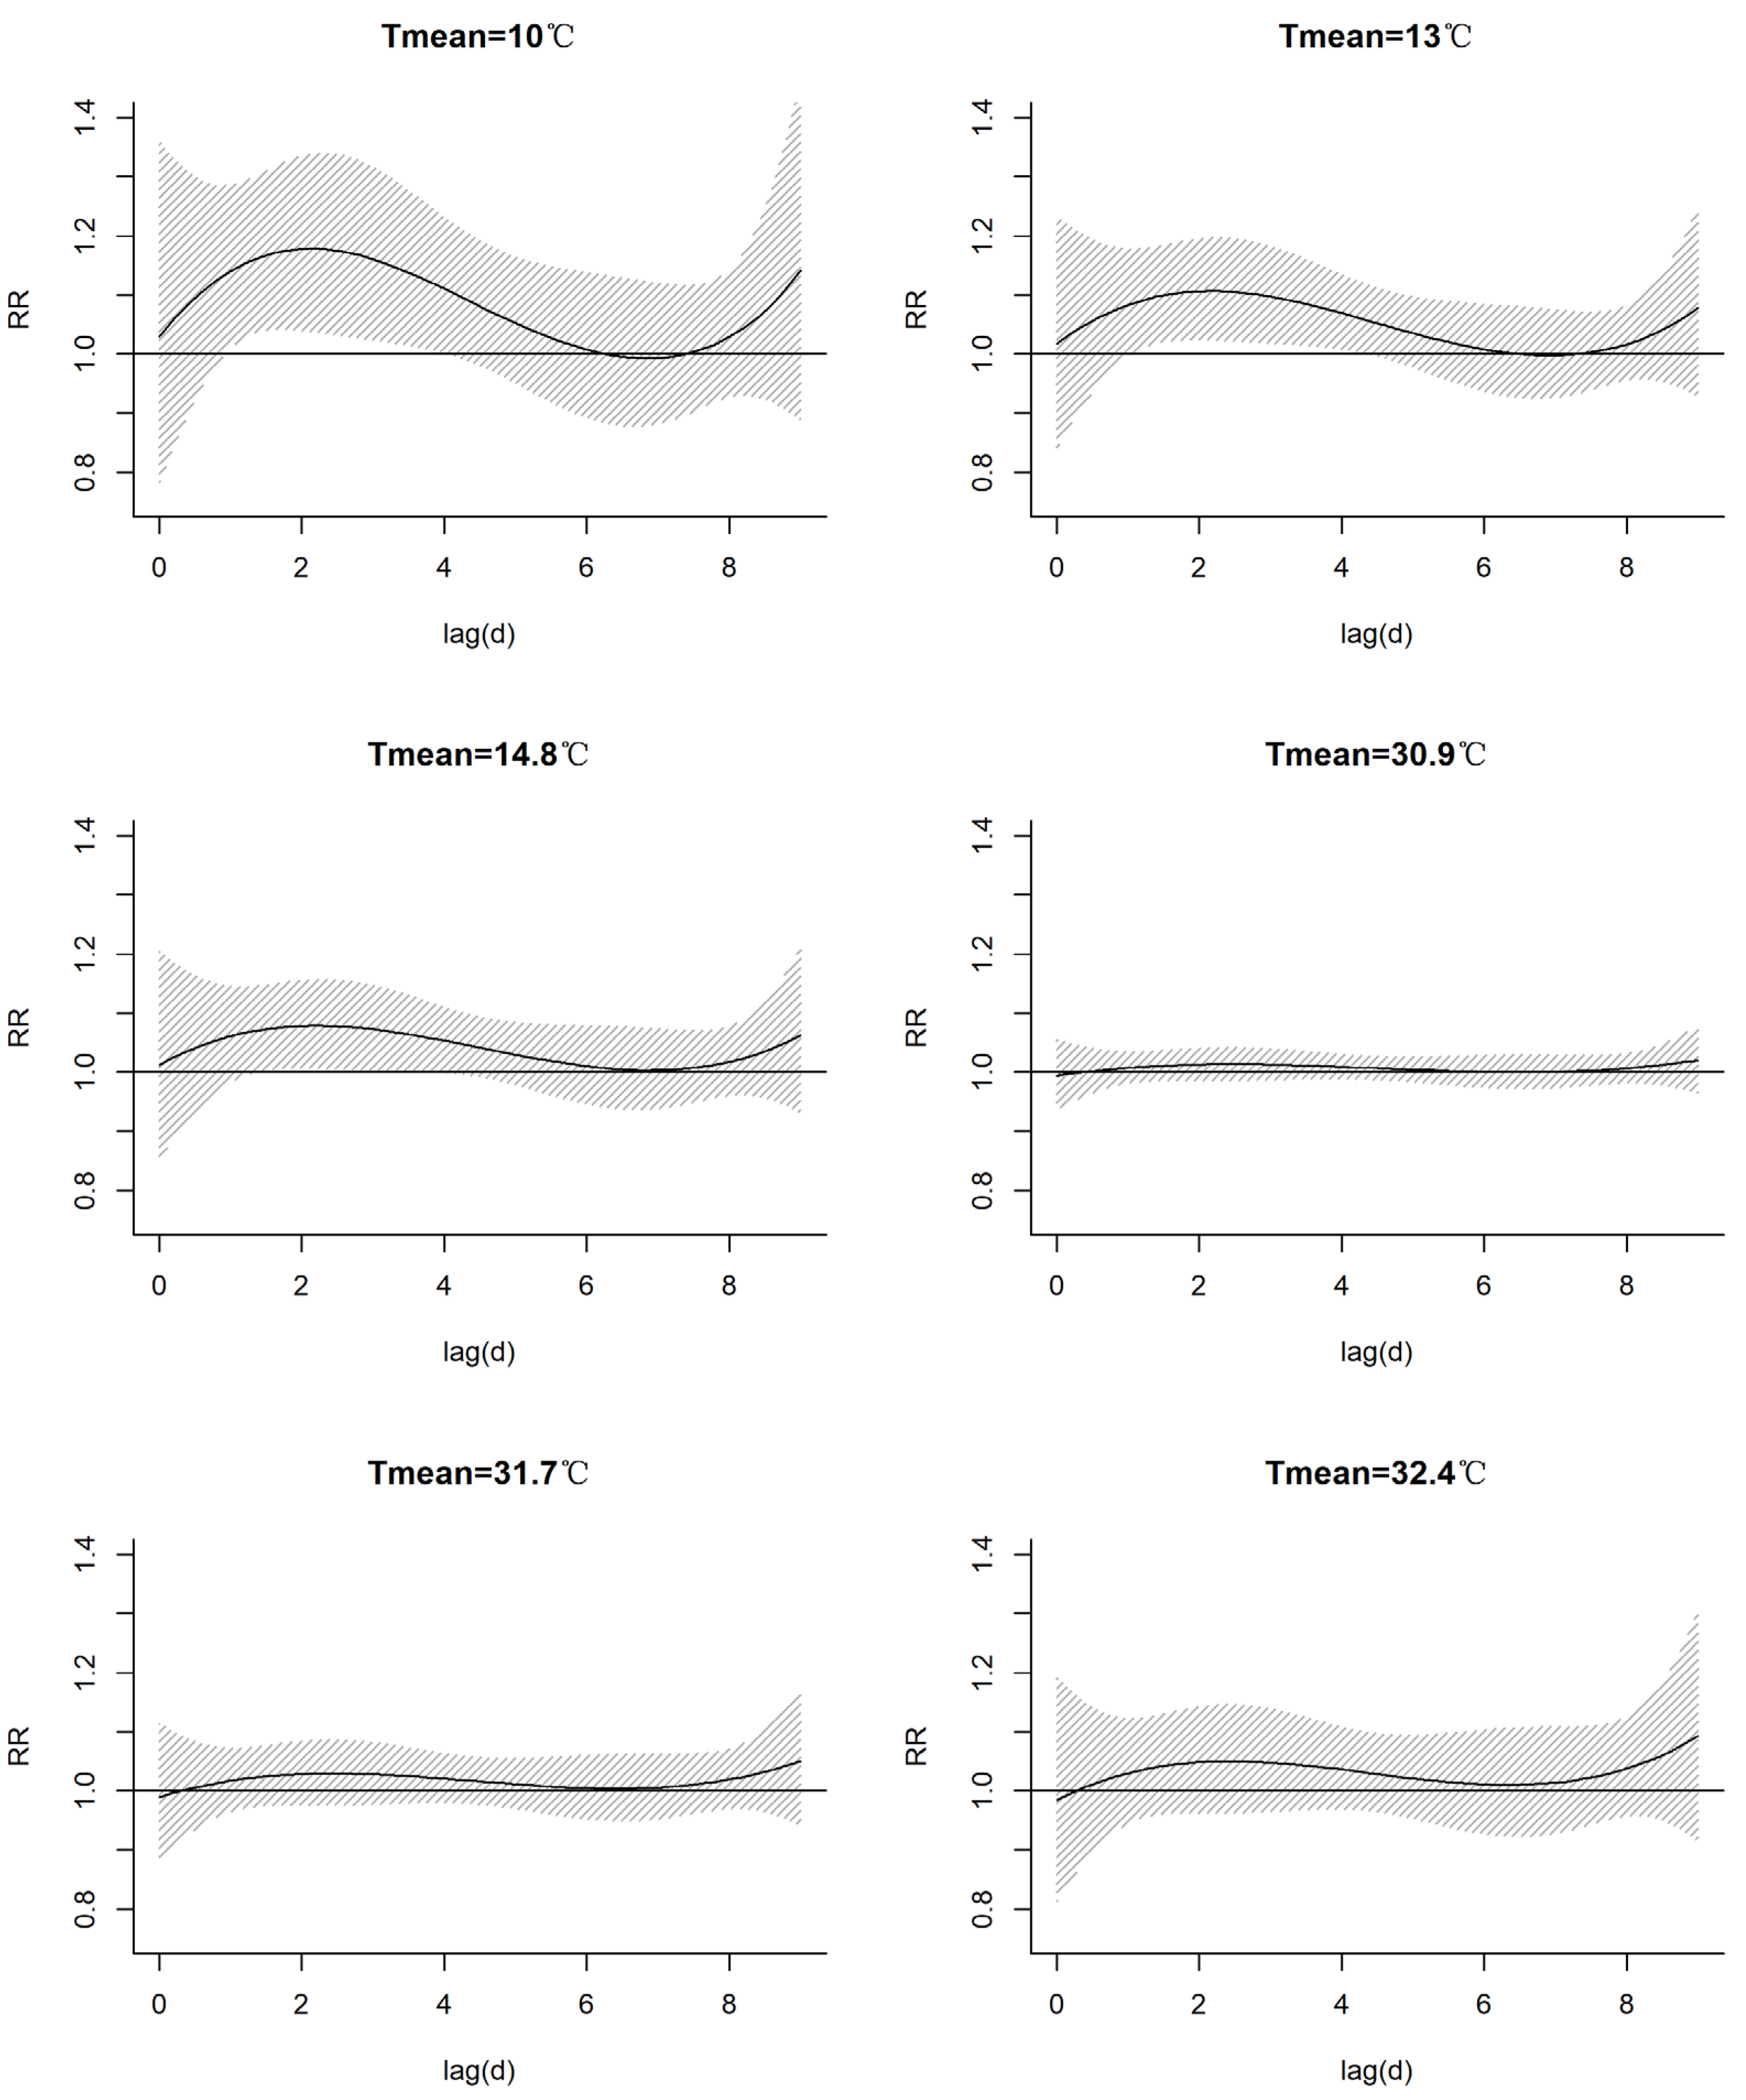
3.2. Exposure–Response Relationship between Temperature and Asthma Hospital Visits

The exposure–response relationship between the Tmean and the number of asthma hospital visits was investigated, and the cumulative effect of continuous exposure to the low-temperature and high-temperature environments could be analyzed separately. Figure 3 and Figure 4 present the exposure–response relationship between the Tmean and asthma hospital visits. It can be seen that the influence of the temperature on the RR is mainly concentrated in the “low-temperature” environment, with an obvious lag effect. The RR was the highest for the lag period of 1–3 days. The extreme high temperature has a certain adverse impact on the risk of asthma attacks, though not at a significant level.
Figure 5 shows the cumulative exposure–response relationship between the Tmean and the asthma hospital visits for lag periods of 0–9 days. In the low-temperature environment, the risk of asthma attacks increased slowly with the decrease in the Tmean, and until about 17 °C, it decreased rapidly. When the Tmean dropped to 10 °C, the cumulative effect reached its peak within the cumulative 9 days (RR of 2.204; CI of 1.294–3.755), and the RR increased by 120.4%, passing the significance test (Table S3). However, in the high-temperature environment, the risk of asthma prevalence increased with the increase in the Tmean. When the Tmean rose to 32.4 °C, the cumulative effect on the RR of asthma increased by 37.0% (RR of 1.37; CI of 0.856–2.191) within the cumulative 9 days, failing the significance test.
As presented in Figure 6, the exposure–response relationship between the Tmean and asthma hospital visits was investigated for different lag periods. The results demonstrate that the Tmean influence on asthma attacks had a lag effect. The cold effect of the low-temperature environment significantly influenced asthma attacks for the lag periods of 1–4 days, passing the significance test. However, there was no significant effect for the lag periods of 0 and 5–8 days. For a lag of 9 days, the risk of asthma shows an increasing trend in the low-temperature environment. On the other hand, the hot effect of the high-temperature environment increased the risk of asthma attacks during the lag periods of 1–5 days and 8–9 days, though not at a significant level.
The 0, 1st, 2.5th, 97.5th, 99th, and 100th percentile values of the Tmean, namely 10 °C, 13 °C, 14.8 °C, 30.9 °C, 31.7 °C, and 32.4 °C, respectively, were selected as the key characterization values of cold and hot effects with which to further analyze their impacts on asthma attacks. From the lag effects on the RR of asthma attacks at different temperature values (Figure 7, Table S4), we found that when the Tmean was less than the reference temperature (29.3 °C), the RR of asthma attacks gradually increased with the decrease in the Tmean.
When the Tmean was 10.0 °C, the cold effect resulted in a risk of asthma attacks for a lag period of 6 days (RR > 1), and for the lag periods of 1–4 days, the impacts were statistically significant. The risk peaked and increased by 17.8% for a lag of 2 days (RR of 1.178, CI of 1.04–1.336). The risk decreased when the lag time was more than 6 days. While the risk increased when the lag time was up to 8 days or more, not all impacts passed the significance test. This phenomenon may be related to the follow-up period of asthma patients.
The cold effect caused a risk of asthma attacks within the 5-day lag period (RR > 1) when the Tmean reached 13.0 °C, and the risk peaked in the 2-day lag period and increased by 10.6% (RR of 1.106; CI of 1.024–1.195). The impacts for a lag time of 2–4 days were statistically significant. When the lag time was more than 6 days, the risk decreased until the lag time reached 8 days and above, upon which time it increased again, though not all impacts passed the significance test.
The cold effect at the Tmean of 14.8 °C shows the same impact as that at the Tmean of 13.0 °C. The risk was the highest when the lag was 2 days, increasing by 7.8% (RR of 1.078; CI of 1.007–1.155).
Regarding the Tmeans of 30.9 °C and 31.7 °C, the hot effect had no obvious influence on asthma attacks within a lag time of 9 days. The extreme high temperature of 32.4 °C caused a risk of asthma attacks when the lag times were 1–9 days (RR > 1), though it did not pass the significance test.

4. Discussion

To our knowledge, this study is the first to assess the effect of the daily mean temperature on asthma outpatient and emergency department visits in the tropical regions of China. Previous studies have focused mostly on the impact of temperature on the asthma outpatient or hospitalization numbers in children [20,24,25,41], while fewer studies have focused on all age groups of the population [42]. We note that the number of asthma visits in Haikou, China, displays seasonal variations, with a peak in winter, similar to that in other cities of China [20,24] and in Finland [43]. In this research, we found a significant statistical relationship between the daily mean temperature and asthma visits, i.e., an inverted J-shaped relationship. Specifically, the asthma risk increased as the temperature decreased from the median value to the minimum value. In particular, when the daily mean temperature was lower than the median value, the number of asthma hospital visits markedly increased, with a noticeable time-lag effect. This result is consistent with the findings of numerous previous studies [13,37,41,42,43,44].
Many studies have demonstrated that the lag effects of the daily mean temperature on asthma visits vary in different regions. For example, in Beijing and Hefei, China, the lag time for the influence of temperature on childhood asthma is 7 days [24,44], while in Shanghai and Hong Kong, the lag period for the impact of low temperature on asthma hospitalization patients is 14–30 days [13]. In this study, we determined that the impact of temperature on asthma outpatients and emergency department visits in Haikou, China, also shows a noticeable lag effect. The maximum lag time was 9 days, and the most pronounced impact appeared when the lag time was 1–3 days. Moreover, the risk of asthma attacks increased by more than 6.7% when the temperature was below the 2.5th percentile (14.8 °C) of the Tmean, and the maximum lag effect reached 5 days, passing the significance test. This may be due to the fact that low temperature can induce airway hyperresponsiveness by causing tracheal contraction, thereby increasing the risk of asthma attacks. Cold weather is usually a continuous weather process, with longer duration and higher extreme levels, increasing the risk of asthma attacks and resulting in a lag effect.
Moreover, in this study, extreme high temperatures had a certain impact on the increase in asthma visits, but the correlation was not significant. Studies in six cities in Australia; in Beijing and Shenzhen in China; in England; and in Atlanta in the USA have also suggested that increases in temperature can induce the risk of asthmatic symptoms [27,44,45,46,47]. However, in Shanghai and Hong Kong in China, previous studies have not found a direct impact of high temperature on asthma attacks [13,48]. Therefore, we believe that the impact of high temperature on asthma attacks should not be ignored in Haikou, China, or in other tropical regions.
Although the physiological and pathological mechanisms of asthma exacerbations caused by temperature variations are not fully clarified, recent studies have proposed several basic pathways through which to explain them [38]. For extremely low temperatures, the effect on asthma is relatively short-lived, as it directly induces trachea contraction, airway inflammation, and mucus hypersecretion, which subsequently trigger airway hyperreactivity and decrease lung function [26]. Extremely high temperatures may activate the vagal bronchopulmonary C-fiber sensory nerves and enhance the reflex bronchoconstriction [49].
In the context of climate change, the intensities and durations of heat waves and cold waves are anticipated to increase [50]. Therefore, it is imperative that more aggressive strategies with which to cope with temperature extremes are implemented to avoid the increase in the risk of asthma exacerbation, especially for cold-wave-related asthma under the threat of a worldwide pandemic. Our study provides health risk-based metrics that can be used to develop appropriate early warning temperature thresholds for asthma exacerbation. Additionally, high-risk characteristics of extreme temperature events are identified in this research, which can allow physicians and patients to develop individualized prevention strategies with which to cope with the growing threat of climate change.
There are several limitations to this study. First, we used the weather conditions from a single meteorological station to represent a region instead of direct measurements, which may have introduced monitoring errors in the meteorological environment of the exposed population. Second, our study used asthma outpatient data from only one hospital, which may have resulted in sample bias. Additionally, our study did not classify the study population based on gender, age, or other demographic factors. Thus, the specific risk factors of asthma in certain populations have not been investigated. Despite these limitations, the data provided in this research support the hypothesis that asthma prevalence is associated with meteorological factors. As the first study on the environmental factors influencing asthma prevalence among residents in Haikou, a typical tropical city in China, this study is expected to provide a reference and insight into the risk of asthma prevalence in tropical urban areas.

5. Conclusions

This study indicates that the risk of asthma attacks in Haikou, a tropical city in China, is significantly correlated with low-temperature weather. The impact of low temperatures on asthma attacks displays a lag effect, with a maximum lag period of 9 days. The results suggest that low temperatures may trigger asthma attacks when the daily mean temperature in Haikou city drops below the 2.5th percentile (14.8 °C), and that the risk will increase by more than 5.3%. Therefore, effective strategies need to be implemented to protect susceptible individuals, such as the elderly and children, from the influences of low temperatures. Based on the continuous monitoring and forecasting of meteorological conditions, risk forecasting and warnings about asthma attacks can alert patients to the need to take timely preventive measures and may thus minimize medical visits and hospitalizations that are related to weather changes and asthma, thereby reducing the burden on healthcare systems.

Supplementary Materials

The following supporting information can be downloaded at: https://www.mdpi.com/article/10.3390/atmos15030328/s1, Table S1: Spearman correlation coefficients of the numbers of asthma hospital visits in different age groups with meteorological elements and air quality factors; Table S2: Spearman correlation coefficients of meteorological elements and air quality indexes; Table S3: The RR of the cumulative effects of the Tmean on asthma attacks in lag periods of 0–9 days; Table S4: The RR of the lag effects of the Tmean on asthma attacks at different key characterization values of the Tmean.

Author Contributions

Conceptualization, Y.Z. and J.Z.; formal analysis, Y.Z. and J.Y.; investigation, S.C. and M.Z.; writing—original draft preparation, Y.Z. and J.Y.; writing—review and editing, Y.Z. and S.C.; supervision, J.Z.; funding acquisition, Y.Z. All authors have read and agreed to the published version of the manuscript.

Funding

This research was funded by Hainan Provincial Natural Science Foundation of China [823MS119], Hainan Province Science and Technology Special Fund [ZDYF2022SHFZ036], and Hainan Meteorological Service [HNQXJS202004].

Institutional Review Board Statement

Not applicable.

Informed Consent Statement

Not applicable.

Data Availability Statement

The data presented in this study are available on request from the corresponding author. The data are not publicly available due to affiliation data management policy.

Acknowledgments

The authors wish to thank the Hainan Provincial Health Commission for its assistance in data acquisition, and Hainan Provincial People’s Hospital for providing data and expertise that greatly assisted the research.

Conflicts of Interest

The authors declare no conflict of interest.

References

  1. Global lnitiative for Asthma. Global Strategy for Asthma Management and Prevention. 2023. Available online: www.ginasthma.org (accessed on 23 June 2023).
  2. Hu, Y.; Cheng, J.; Jiang, F.; Liu, S.; Li, S.; Tan, J.; Yin, Y.; Tong, S. Season-stratified effects of meteorological factors on childhood asthma in Shanghai, China. Environ. Res. 2020, 191, 110115. [Google Scholar] [CrossRef]
  3. Asher, I.; Pearce, N. Global burden of asthma among children. Int. J. Tuberc. Lung Dis. 2014, 18, 1269–1278. [Google Scholar] [CrossRef]
  4. The National Cooperative Groupon Childhood Asthma; Institute of Environmental Health and Related Product Safety; Chinese Center for Disease Control and Prevention. Third nationwide survey of childhood asthma in urban areas of China. Chin. J. Pediatr. 2013, 51, 729–735. [Google Scholar] [CrossRef]
  5. Huang, K.; Yang, T.; Xu, J.; Yang, L.; Zhao, J.; Zhang, X.; Bai, C.; Kang, J.; Ran, P.; Shen, H.; et al. Prevalence, risk factors, and management of asthma in China: A national cross-sectional study. Lancet 2019, 394, 407–418. [Google Scholar] [CrossRef] [PubMed]
  6. The National Cooperative Groupon Childhood Asthma. A nationwide survey in China on prevalence of asthma in urban children. Chin. J. Pediatr. 2003, 41, 123–127. [Google Scholar]
  7. Newell, G.R., Jr.; Swafford, L.I. Epidemiology of asthma in children with particular reference to wind speed and wind direction. Pediatrics 1963, 31, 134–143. [Google Scholar] [CrossRef] [PubMed]
  8. Carey, M.J.; Cordon, I. Asthma and climatic conditions: Experience from Bermuda, an isolated island community. Br. Med. J. 1986, 293, 843–844. [Google Scholar] [CrossRef] [PubMed]
  9. Rossi, O.V.; Kinnula, V.L.; Tienari, J.; Huhti, E. Association of severe asthma attacks with weather, pollen, and air pollutants. Thorax 1993, 48, 244–248. [Google Scholar] [CrossRef] [PubMed]
  10. Qasem, J.A.; Nasrallah, H.; Al-Khalaf, B.N.; Al-Sharifi, F.; Al-Sherafyee, A.; Almathkouri, S.A.; Al-Saraf, H. Meteorological factors, aeroallergens and asthma-related visits in Kuwait: A 12-month retrospective study. Ann. Saudi Med. 2008, 28, 435–441. [Google Scholar] [CrossRef] [PubMed]
  11. Xu, Z.; Huang, C.; Hu, W.; Turner, L.R.; Su, H.; Tong, S. Extreme temperatures and emergency department admissions for childhood asthma in Brisbane, Australia. Occup. Environ. Med. 2013, 70, 730–735. [Google Scholar] [CrossRef] [PubMed]
  12. Jayawardene, W.P.; YoussefAgha, A.H.; Lohrmann, D.K.; El Afandi, G.S. Prediction of asthma exacerbations among children through integrating air pollution, upper atmosphere, and school health surveillances. Allergy Asthma Proc. 2013, 34, 1–8. [Google Scholar] [CrossRef]
  13. Zhang, Y.; Peng, L.; Kan, H.; Xu, J.; Chen, R.; Liu, Y.; Wang, W. Effects of meteorological factors on daily hospital admissions for asthma in adults: A time-series analysis. PLoS ONE 2014, 9, e102475. [Google Scholar] [CrossRef]
  14. Hervás, D.; Utrera, J.; Hervás-Masip, J.; Hervás, J.; García-Marcos, L. Can meteorological factors forecast asthma exacerbation in a paediatric population? Allergol. Immunopathol. 2015, 43, 32–36. [Google Scholar] [CrossRef]
  15. Da Silva, I.R.; Nedel, A.S.; Marques, J.R.Q.; Júnior, L.R.N. Excess of children’s outpatient consultations due to asthma and bronchitis and the association between meteorological variables in Canoas City, Southern Brazil. Int. J. Biometeorol. 2019, 63, 1517–1524. [Google Scholar] [CrossRef] [PubMed]
  16. Hu, Y.; Xu, Z.; Jiang, F.; Li, S.; Liu, S.; Wu, M.; Yan, C.; Tan, J.; Yu, G.; Hu, Y.; et al. Relative impact of meteorological factors and air pollutants on childhood allergic diseases in Shanghai, China. Sci. Total. Environ. 2019, 706, 135975. [Google Scholar] [CrossRef] [PubMed]
  17. Yousif, M.K.; Al Muhyi, A.-H.A. Impact of weather conditions on childhood admission for wheezy chest and bronchial asthma. Med. J. Islam. Repub. Iran. 2019, 33, 89. [Google Scholar]
  18. Zhao, Y.; Huang, Z.; Wang, S.; Hu, J.; Xiao, J.; Li, X.; Liu, T.; Zeng, W.; Guo, L.; Du, Q.; et al. Morbidity burden of respiratory diseases attributable to ambient temperature: A case study in a subtropical city in China. Environ. Health 2019, 18, 89. [Google Scholar] [CrossRef]
  19. Tikkakoski, A.P.; Tikkakoski, A.; Kivistö, J.E.; Huhtala, H.; Sipilä, K.; Karjalainen, J.; Kähönen, M.; Lehtimäki, L. Association of air humidity with incidence of exercise-induced bronchoconstriction in children. Pediatr. Pulmonol. 2019, 54, 1830–1836. [Google Scholar] [CrossRef] [PubMed]
  20. Zhang, H.; Liu, S.; Chen, Z.; Zu, B.; Zhao, Y. Effects of variations in meteorological factors on daily hospital visits for asthma: A time-series study. Environ. Res. 2020, 182, 109115. [Google Scholar] [CrossRef] [PubMed]
  21. Romaszko-Wojtowicz, A.; Cymes, I.; Dragańska, E.; Doboszyńska, A.; Romaszko, J.; Glińska-Lewczuk, K. Relationship between biometeorological factors and the number of hospitalizations due to asthma. Sci. Rep. 2020, 10, 9593. [Google Scholar] [CrossRef] [PubMed]
  22. Pan, R.; Wang, X.; Yi, W.; Wei, Q.; Gao, J.; Xu, Z.; Duan, J.; He, Y.; Tang, C.; Liu, X.; et al. Interactions between climate factors and air quality index for improved childhood asthma self-management. Sci. Total. Environ. 2020, 723, 137804. [Google Scholar] [CrossRef]
  23. Wei, Q.; Zhong, L.; Gao, J.; Yi, W.; Pan, R.; Gao, J.; Duan, J.; Xu, Z.; He, Y.; Liu, X.; et al. Diurnal temperature range and childhood asthma in Hefei, China: Does temperature modify the association? Sci. Total. Environ. 2020, 724, 138206. [Google Scholar] [CrossRef] [PubMed]
  24. Liu, X.; He, Y.; Tang, C.; Wei, Q.; Xu, Z.; Yi, W.; Pan, R.; Gao, J.; Duan, J.; Su, H. Association between cold spells and childhood asthma in Hefei, an analysis based on different definitions and characteristics. Environ. Res. 2021, 195, 110738. [Google Scholar] [CrossRef] [PubMed]
  25. Lei, X.; Liu, L.; Chen, R.; Liu, C.; Hong, J.; Cao, L.; Lu, Y.; Dong, X.; Chen, X.; Qiu, X.; et al. Temperature changes between neighboring days and childhood asthma: A seasonal analysis in Shanghai, China. Int. J. Biometeorol. 2021, 65, 827–836. [Google Scholar] [CrossRef] [PubMed]
  26. Zhu, Y.; Yang, T.; Huang, S.; Li, H.; Lei, J.; Xue, X.; Gao, Y.; Jiang, Y.; Liu, C.; Kan, H.; et al. Cold temperature and sudden temperature drop as novel risk factors of asthma exacerbation: A longitudinal study in 18 Chinese cities. Sci. Total. Environ. 2022, 814, 151959. [Google Scholar] [CrossRef] [PubMed]
  27. Deng, S.; Han, A.; Jin, S.; Wang, S.; Zheng, J.; Jalaludin, B.B.; Hajat, S.; Liang, W.; Huang, C. Effect of extreme temperatures on asthma hospital visits: Modification by event characteristics and healthy behaviors. Environ. Res. 2023, 226, 115679. [Google Scholar] [CrossRef] [PubMed]
  28. D’amato, G.; Vitale, C.; De Martino, A.; Viegi, G.; Lanza, M.; Molino, A.; Sanduzzi, A.; Vatrella, A.; Annesi-Maesano, I.; D’amato, M. Effects on asthma and respiratory allergy of Climate change and air pollution. Multidiscip. Respir. Med. 2015, 10, 39. [Google Scholar] [CrossRef] [PubMed]
  29. Zheng, X.-Y.; Ding, H.; Jiang, L.-N.; Chen, S.-W.; Zheng, J.-P.; Qiu, M.; Zhou, Y.-X.; Chen, Q.; Guan, W.-J. Association between Air Pollutants and Asthma Emergency Room Visits and Hospital Admissions in Time Series Studies: A Systematic Review and Meta-Analysis. PLoS ONE 2015, 10, e0138146. [Google Scholar] [CrossRef] [PubMed]
  30. Chen, K.; Glonek, G.; Hansen, A.; Williams, S.; Tuke, J.; Salter, A.; Bi, P. The effects of air pollution on asthma hospital admissions in Adelaide, South Australia, 2003–2013: Time-series and case–crossover analyses. Clin. Exp. Allergy 2016, 46, 1416–1430. [Google Scholar] [CrossRef]
  31. Orellano, P.; Quaranta, N.; Reynoso, J.; Balbi, B.; Vasquez, J. Effect of outdoor air pollution on asthma exacerbations in children and adults: Systematic review and multilevel meta-analysis. PLoS ONE 2017, 12, e0174050. [Google Scholar] [CrossRef]
  32. Klabuschnig, A.; Göiz, M.; Horak, F.; Jäger, S.; Machalek, A.; Popow, C.; Haschke, F.; Skoda-Türk, R. Influence of aerobiology and weather on symptoms in children with asthma. Respiration 1981, 42, 52–60. [Google Scholar] [CrossRef]
  33. Erbas, B.; Akram, M.; Dharmage, S.C.; Tham, R.; Dennekamp, M.; Newbigin, E.; Taylor, P.; Tang, M.L.K.; Abramson, M.J. The role of seasonal grass pollen on childhood asthma emergency department presentations. Clin. Exp. Allergy 2012, 42, 799–805. [Google Scholar] [CrossRef]
  34. Johnston, N.W. Asthma exacerbations. 1: Epidemiology. Thorax 2006, 61, 722–728. [Google Scholar] [CrossRef] [PubMed]
  35. Erbas, B.; Dharmage, S.C.; Tang, M.L.; Akram, M.; Allen, K.J.; Vicendese, D.; Davies, J.M.; Hyndman, R.J.; Newbigin, E.J.; Taylor, P.E.; et al. Do human rhinovirus infections and food allergy modify grass pollen–induced asthma hospital admissions in children? J. Allergy Clin. Immunol. 2015, 136, 1118–1120.e2. [Google Scholar] [CrossRef] [PubMed]
  36. Qiu, H.; Yu, I.T.-S.; Tse, L.A.; Chan, E.Y.; Wong, T.W.; Tian, L. Greater temperature variation within a day associated with increased emergency hospital admissions for asthma. Sci. Total. Environ. 2015, 505, 508–513. [Google Scholar] [CrossRef] [PubMed]
  37. Lam, H.C.-Y.; Li, A.M.; Chan, E.Y.-Y.; Goggins, W.B. The short-term association between asthma hospitalisations, ambient temperature, other meteorological factors and air pollutants in Hong Kong: A time-series study. Thorax 2016, 71, 1097–1109. [Google Scholar] [CrossRef] [PubMed]
  38. Xu, Z.; Crooks, J.L.; Davies, J.M.; Khan, A.F.; Hu, W.; Tong, S. The association between ambient temperature and childhood asthma: A systematic review. Int. J. Biometeorol. 2018, 62, 471–481. [Google Scholar] [CrossRef] [PubMed]
  39. Gasparrini, A.; Armstrong, B.; Kenward, M.G. Distributed lag non-linear models. Stat. Med. 2010, 29, 2224–2234. [Google Scholar] [CrossRef] [PubMed]
  40. Gasparrini, A. Distributed Lag Linear and Non-Linear Models in R: The Package DLNM. J. Stat. Softw. 2011, 43, 1–20. [Google Scholar] [CrossRef] [PubMed]
  41. Guo, Y.; Jiang, F.; Peng, L.; Zhang, J.; Geng, F.; Xu, J.; Zhen, C.; Shen, X.; Tong, S. The Association between Cold Spells and Pediatric Outpatient Visits for Asthma in Shanghai, China. PLoS ONE 2012, 7, e42232. [Google Scholar] [CrossRef]
  42. Son, J.-Y.; Bell, M.L.; Lee, J.-T. The impact of heat, cold, and heat waves on hospital admissions in eight cities in Korea. Int. J. Biometeorol. 2014, 58, 1893–1903. [Google Scholar] [CrossRef] [PubMed]
  43. Belachew, A.B.; Rantala, A.K.; Jaakkola, M.S.; Hugg, T.T.; Ruuhela, R.; Kukkonen, J.; Jaakkola, J.J.K. Effect of cold winters on the risk of new asthma: A case-crossover study in Finland. Occup. Environ. Med. 2023, 80, 702–705. [Google Scholar] [CrossRef] [PubMed]
  44. Fang, J.; Song, J.; Wu, R.; Xie, Y.; Xu, X.; Zeng, Y.; Zhu, Y.; Wang, T.; Yuan, N.; Xu, H.; et al. Association between ambient temperature and childhood respiratory hospital visits in Beijing, China: A time-series study (2013–2017). Environ. Sci. Pollut. Res. Int. 2021, 28, 29445–29454. [Google Scholar] [CrossRef]
  45. Konstantinoudis, G.; Minelli, C.; Lam, H.C.Y.; Fuertes, E.; Ballester, J.; Davies, B.; Vicedo-Cabrera, A.M.; Gasparrini, A.; Blangiardo, M. Asthma hospitalisations and heat exposure in England: A case–crossover study during 2002–2019. Thorax 2023, 78, 875–881. [Google Scholar] [CrossRef]
  46. O’lenick, C.R.; Winquist, A.; Chang, H.H.; Kramer, M.R.; Mulholland, J.A.; Grundstein, A.; Sarnat, S.E. Evaluation of individual and area-level factors as modifiers of the association between warm-season temperature and pediatric asthma morbidity in Atlanta, GA. Environ. Res. 2017, 156, 132–144. [Google Scholar] [CrossRef]
  47. Li, S.; Baker, P.J.; Jalaludin, B.B.; Guo, Y.; Marks, G.B.; Denison, L.S.; Williams, G.M. Are children׳s asthmatic symptoms related to ambient temperature? A panel study in Australia. Environ. Res. 2014, 133, 239–245. [Google Scholar] [CrossRef] [PubMed]
  48. Lam, H.C.Y.; Hajat, S.; Chan, E.Y.Y.; Goggins, W.B. Different sensitivities to ambient temperature between first- and re-admission childhood asthma cases in Hong Kong—A time series study. Environ. Res. 2019, 170, 487–492. [Google Scholar] [CrossRef] [PubMed]
  49. Hayes, D., Jr.; Collins, P.B.; Khosravi, M.; Lin, R.-L.; Lee, L.-Y. Bronchoconstriction Triggered by Breathing Hot Humid Air in Patients with Asthma: Role of cholinergic reflex. Am. J. Respir. Crit. Care Med. 2012, 185, 1190–1196. [Google Scholar] [CrossRef]
  50. Intergovernmental Panel on Climate Change (IPCC). Climate Change 2021—The Physical Science Basis: Working Group I Contribution to the Sixth Assessment Report of the Intergovernmental Panel on Climate Change; Cambridge University Press: Cambridge, UK, 2023; pp. 1517–1520. [Google Scholar] [CrossRef]
Figure 1. Location of the study area and Haikou Meteorological Station.
Atmosphere 15 00328 g001
Figure 2. Monthly mean numbers of asthma hospital visits in different age groups from August 2016 to August 2019.
Atmosphere 15 00328 g002
Figure 3. Exposure–response relationship between the Tmean and the number of asthma hospital visits in different lag periods.
Atmosphere 15 00328 g003
Figure 4. Three-dimensional exposure–response relationship between the Tmean and asthma hospital visits.
Atmosphere 15 00328 g004
Figure 5. Cumulative exposure–response relationship between the Tmean and the RR of asthma attacks for lag periods of 0–9 days.
Atmosphere 15 00328 g005
Figure 6. Exposure–response relationships between the Tmean and the number of asthma hospital visits for different lag days.
Atmosphere 15 00328 g006
Figure 7. Lag effects of the Tmean on the RR of asthma attacks at different key characterization values of the Tmean.
Atmosphere 15 00328 g007
Table 1. Statistics on daily meteorological factors, air pollutants, and asthma hospital visits.
Min.1st Qu.MedianMean3rd Qu.Max.Std. Dev.
Meteorological factors
Prs984.9999.21003.71003.91008.21019.66.2
Pmax989.710011005.91005.91010.410226.4
Pmin98099710021002.0100610186.3
Tmean10.022.126.225.128.332.44.3
Tmax11.625.129.828.732.738.95.3
Tmin720.223.822.625.528.83.9
RH42778281.486.5997.7
R0005.52266.619.1
WS0.72.32.82.93.410.40.9
Air pollutants
AQI13293741.248.515018.4
PM2.54111518.2227311.1
PM108233034.04210915.5
SO23455.66161.9
NO2391212.615394.7
CO0.30.50.60.60.71.20.1
O30516872.788.521530.6
Daily asthma hospital visits
Total08.51515.721459.4
0–14 yrs0146.310276.4
15–64 yrs0477.611264.6
≥65 yrs0011.73101.7
Disclaimer/Publisher’s Note: The statements, opinions and data contained in all publications are solely those of the individual author(s) and contributor(s) and not of MDPI and/or the editor(s). MDPI and/or the editor(s) disclaim responsibility for any injury to people or property resulting from any ideas, methods, instructions or products referred to in the content.

