Abstract
The city of Cuernavaca has experienced a significant deterioration in air quality in recent years. Despite this situation, few studies in the region have constantly monitored this problem. The objective of this study was to determine the concentrations of heavy metals in PM2.5 in three representative sites of the city and estimate the risks posed to human health and the environment. The results revealed concentrations in the following order of abundance: Fe > Al > Mg > Zn > As > Ni > V > Pb > Mn. The EF indicated that As comes mainly from anthropogenic emissions; Zn, V, Pb, and Ni come from natural and anthropogenic sources; and Mn, Fe and Al have a natural origin derived from the soil. The Igeo, As, Pb and Zn were greater than five, followed by V and Ni, whose values ranged between two and three. The ecological RI was far greater than 600 in all cases. The HQ revealed that all values were below one, indicating that the health risk posed by exposure to ambient air is below that established by the USEPA. The Ni ILCR values for adults were 1.03 × 10⁻⁵, followed by 2.9 × 10⁻⁶ and 1.6 × 10⁻⁷ for Pb and As, respectively. For children, the values were in the following order: Pb (1.2 × 10⁻⁶), Ni (4.8 × 10⁻⁶) and As (7.5 × 10⁻⁶). These findings suggest that Cuernavaca’s air has moderate to heavy contamination levels, which must be taken into account by environmental authorities so that measurements can be taken to help reverse this situation.
1. Introduction
One of the biggest public health problems worldwide is air pollution, which is caused by various natural and/or anthropogenic activities [1,2]. Although mitigation and/or control programs for this problem have been implemented in many places, it is still common for acute contamination events that exceed the international standards considered safe for human health to occur [3,4,5]. Statistical data from the World Health Organization indicate that around seven million people die annually in the world due to poor air quality, and that 9 out of 10 people breathe air containing high levels of pollutants [6]. These figures are continuing to increase worldwide, given that pollution does not decrease [7].
Heavy metals are characterized by their toxicity, the fact that they do not biodegrade and their bioaccumulation in living organisms [8]. For example, metals such as arsenic (As), nickel (Ni), chromium (Cr), and cobalt (Co) are potentially mutagenic, carcinogenic and teratogenic. Meanwhile, vanadium (V), manganese (Mn), cadmium (Cd), copper (Cu), lead (Pb), and zinc (Zn) are associated with some noncarcinogenic toxic effects, such as cardiovascular, respiratory, kidney and liver diseases, and alterations in the central nervous and endocrine systems [9].
Although many studies carried out have reported the impact that metals have on human health, there is still much uncertainty about the mechanisms of action of these contaminants; it is not clear whether their health implications are a result of their synergistic or individual effects.
Specifically, heavy metals such as Cr, Cd, As, Pb, and Ni are highly toxic even at low concentration levels [10]. Various toxicological studies have shown that long periods of exposure to heavy metals in PM2.5 could cause respiratory and lung inflammation, cardiovascular and heart disease, and cancer [11,12]. The heavy metals present in PM2.5 can be transferred to the human body either orally, via inhalation or through the dermis, reaching the blood and then the internal organs [13,14].
Various studies carried out in Mexico have focused on the physical–chemical characterization of atmospheric particles, spatiotemporal variation and the possible sources of heavy metals, with few studies evaluating the risks to health and the environment [15,16,17,18,19].
The objectives of this study were as follows: (i) to determine the concentrations of heavy metals in the PM2.5 in Cuernavaca, México; (ii) to determine the level of contamination and the ecological risk by calculating the geo-accumulation index and the potential ecological risk index; (iii) to assess the potential (non)-carcinogenic health risk; and (iv) to estimate the likelihood of carcinogenic and non-carcinogenic risk via the Monte Carlo simulation method.
2. Materials and Methods
2.1. Study Area
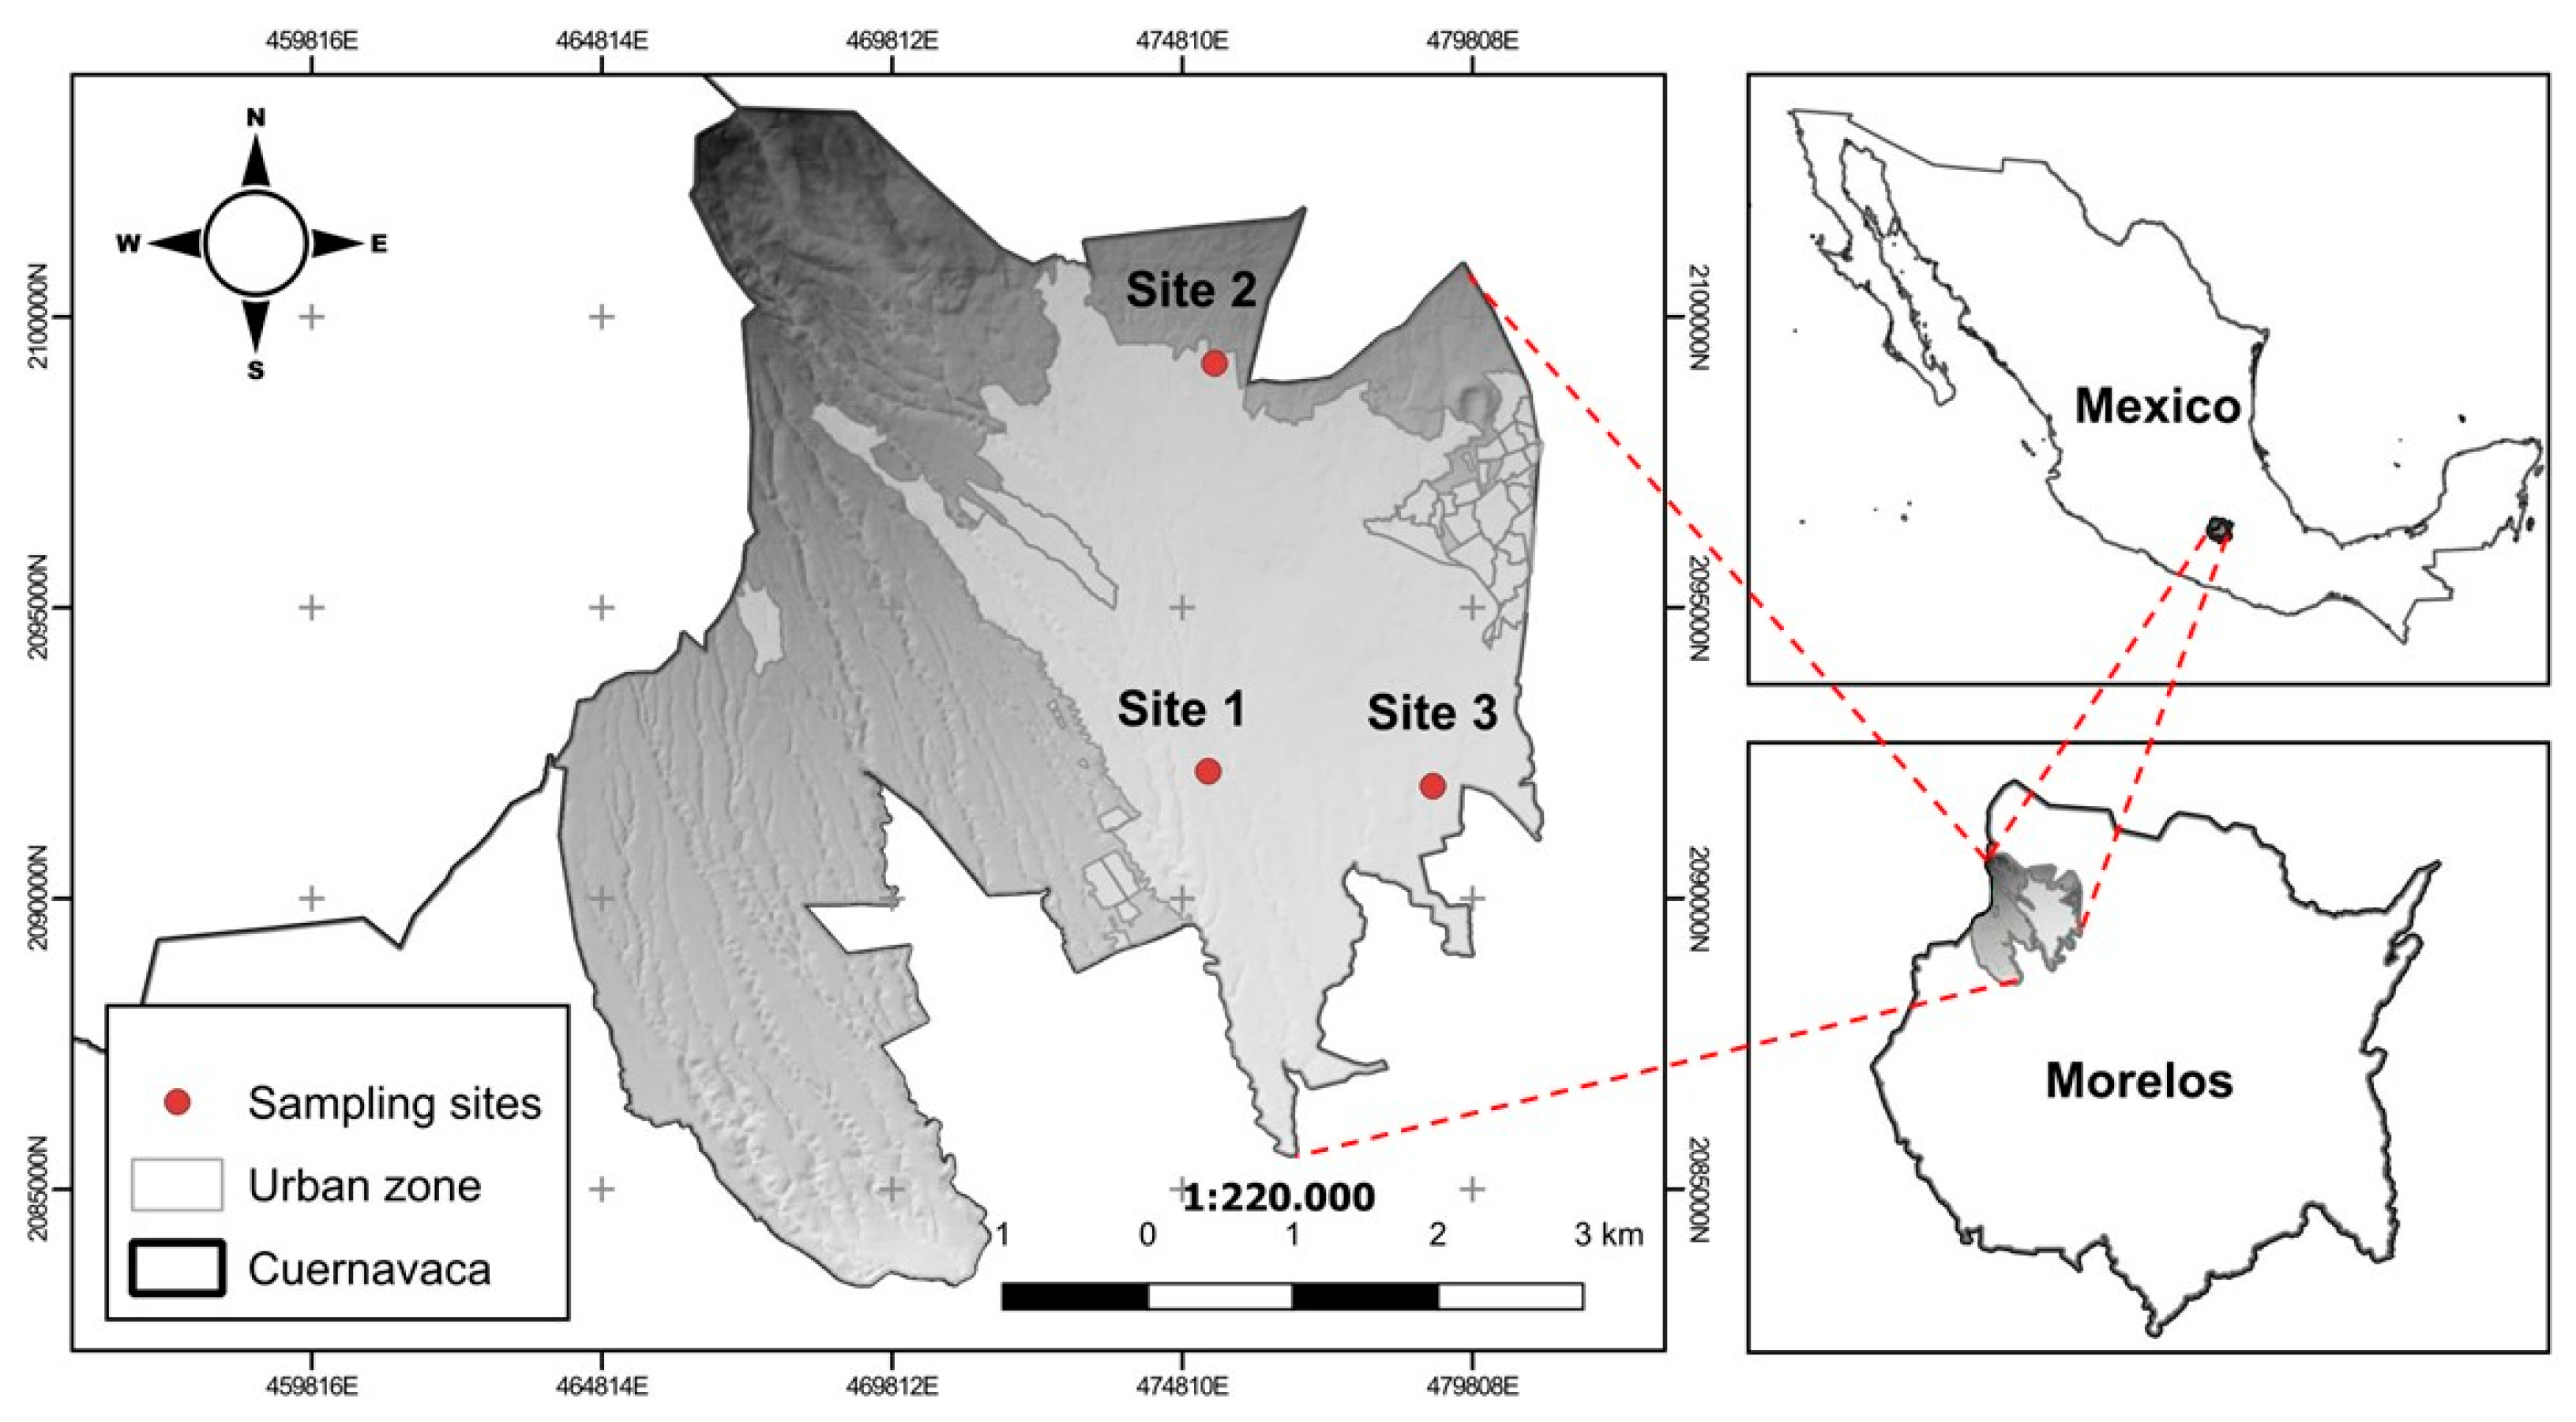
The study was carried out in the City of Cuernavaca, located south of Mexico City, and three sites with different characteristics were selected. Site 1 was located in the center of the city, where there is a high level of vehicular and commercial activity; site 2 was a wooded area located north of the city; and site 3 was representative of the main industrial area of the city (Figure 1).
Figure 1.
Sites studied in the metropolitan area of Cuernavaca, Mexico.
2.2. Sampling and Chemical Analysis
Sampling was carried out between May and June 2014, using low-volume equipment (Mini-Vol, Airmetrics, Eugene, OR, USA) for periods of 24 h. Teflon filters were used to collect particles (PALL® diameter 47 mm, 0.2 μm pore size).
The extraction and analysis of the metals were carried out according to the methodology developed by Saldarriaga et al., 2021 [16]. Briefly, a mixture of HNO3-HCl was used for the extraction in an ultrasound bath at a temperature of 60–70 °C. The analysis was performed by atomic absorption spectrophotometry. The efficiency of the extraction methodology was evaluated by using the NIST SRM 1648 reference material. The average recovery ranged from 85.5 to 120%.
2.3. Enrichment Factor (EF)
To identify the origin of the heavy metals present in the PM2.5 particulate matter, the enrichment factors (EF) and the geo-accumulation index (Igeo) were calculated by the following expressions:
The estimation of EF was based on the average abundances of the elements in the geological material, as proposed by Taylor (1964), using Fe as a reference element [15].
Here, “X” is the targeted element, and “X/Y” air and “X/Y” crust refer to the concentration ratios of element “X” with respect to “Y” (reference element) in the air and crust, respectively. If EF < 5 corresponds to a trace metal from the soil, a value of 5 < EF < 100 is a natural and anthropogenic mixture, and if EF > 100, it is considered to be of anthropogenic origin [20].
2.4. Geo-Accumulation Index (Igeo)
The Igeo, was calculated according to Equation (2) [21]:
where Xsample corresponds to the concentration of the ith metal in PM2.5 and Ycrust corresponds to the earth’s crust. Table 1 shows a classification of the contamination levels.

Table 1.
Classification of the geo-accumulation index (I geo). Adapted from Müller 1969 [21].
2.5. Ecological Risk Index (RI)
The ecological risk index (RI) was established by Håkanson (1980) to evaluate the potential ecological risk posed to aquatic environments [22].
where is the potential ecological risk coefficient of the ith metal and is the ith metal’s toxic response factor [23,24].
If RI < 150, it is considered low risk; 150 to 300 is moderate; 300 to 600 is considerable; and >600 is very high. The specific values for each metal are mentioned below: As (10), Ni (5), Pb (5), V (2) [25].
2.6. Health Risk Assessment
2.6.1. Non-Cancer Risk
To estimate the potential hazard to human health, the risk assessment developed based on the EPA guidelines considered two conditions. First, the exposed population parameters were described by standard references (US EPA Exposure Handbook). The second condition considered fine-particle inhalation as the main exposure pathway [26,27].
This study assessed the non-carcinogenic and carcinogenic risk by estimating the Hazard Quotient (HQ) and Incremental Lung Cancer Risk (ILCR), respectively. Previously, the Lifetime Average Daily Dose (LADD) was calculated. Those estimations were obtained through the Monte Carlo Simulation method [28].
The LADD is commonly used to estimate the daily intake of a toxic material throughout the entire life of an individual. It was calculated as follows:
where is the metal concentration in ng/m3; IR is the daily inhalation, with values of 12 and 16 m3/day for children and adults, respectively; ED is the exposure duration, set at 11 and 45 years; BW is the body weight set at 25 and 80 kg for each age group; and AT is the life expectancy in the Mexican Population, with a value of 75 years.
The HQ evaluates the potential for non-cancer hazards using the ratio of the chronic exposure dose; in this case, this was the LADD and the Reference Concentration for Inhalation Exposure (RfC) of each metal. The RfC is an estimate of the daily inhalation rate that is likely to be without a significant risk of negative health effects over the lifetime.
The HQ expresses the probability of a population developing a non-cancer health event throughout its lifetime. If the HQ obtained is less than 1 (HQ < 1), adverse health effects associated with the exposure are not expected to occur; this is the opposite if the HQ is greater than 1 (HQ > 1), and chronic exposure to the toxic element is associated with negative effects on the health of the population.
2.6.2. Cancer Risk
The ILCR assesses the probability of cancer occurrence throughout an individuals’ lifetime and is calculated by multiplying the LADD by the inhalation cancer slope factor (CSF). The CSF is expressed in units of reciprocal dose (mg/kg/day)−1, given that it is obtained through a linear dose–response model with a zero-dose threshold based on toxicological studies. The ILCR was estimated for children between 6 and 11 years old and for adults aged 45 years old.
2.7. Monte Carlo Simulation
The Monte Carlo Simulation (MCS) model is recommended by USEPA (1997) for health risk assessment [28]. Due to the ambiguity involved in the use of predetermined values such as the inhalation rate and other variables that represent a health risk, it is suggested that the MCS model is used to estimate the probability of risk distribution [29].
In the present study, the MCS was performed with 10,000 repetitions per site using the metal concentration data to estimate the risk and examine its uncertainties. First, the original metal concentration data were simulated by proposing a relative standard deviation of 40% to calculate the standard deviation and generate normally distributed samples. Also, to ensure the randomness quality, the algorithm applied used different seeds to generate the simulated data [30]. Each simulated set of data was filtered through a modified “z” score test to eliminate discordant data. The uncertainty in the risk calculation was determined from the probabilistic results obtained and the contribution of each variable.
2.8. Statistical Analysis
The mean, standard deviation (SD), and over-standard rates were calculated using MS Excel 2010 (Microsoft Corp, Redmond, WA, USA). To determine the best-fitting distribution for each parameter, Monte Carlo simulation was performed using Python and R libraries. The health risk assessment was evaluated according to the USEPA Integrated Risk Information Database (IRIS) [31] and the International Agency for Research on Cancer (IARC) [32].
3. Results and Discussion
3.1. Metal Concentration
The concentrations of metals detected in this study presented the following order of abundance (Fe > Al > Mg > Zn > As > Ni > V > Pb > Mn). The fact that these species present the same behavior suggests that they come from common sources. It should be noted that at site 3, the highest concentrations were found for all species; this site is located in the main industrial zone of the state (Table 2).

Table 2.
Concentration of metals (ng m−3) in PM2.5 in Cuernavaca, Morelos.
The main source of elements such as Ni, Zn and V is the combustion of fossil material, while vehicle emissions contribute significant amounts of Pb, Fe, Zn, and Ni [33]. For its part, it is known that metallurgical processes are the main source of Zn, Ni and As [34]. Regarding the last element, another important source is volcanic emissions [35], and in that sense, it must be considered that a good part of this metal in Cuernavaca likely comes from the Popocatepetl volcano (active), which is located approximately 60 km away. Meanwhile, Fe, Mn, Zn, and Pb come from natural and anthropogenic sources [36,37] and, specifically, Mn is associated with dust resuspension [34]; in this sense, it is important to mention that this metropolitan area has been subject to a high rate of deforestation in the last two decades, generating frequent events of dust resuspension. On the other hand, the city is crossed by various road distributors that communicate with Mexico City and the states of Mexico, Puebla, Guerrero, Tlaxcala and Veracruz, where cargo vehicles and passenger buses mainly travel. In addition, it is impacted by an industrial zone called CIVAC, made up of more than 150 factories.
3.2. Comparison with Other Studies
A comparison of the metal concentrations observed in Cuernavaca was made with those reported in other places (Table 3). In the case of Al, Fe, Mg and V, the concentrations were higher than those reported in other studies, except for Ni, Pb and Zn, which were lower. It should be noted that these types of comparisons must be interpreted with caution due to the geological and meteorological characteristics, economic and urban development, and industrial and vehicular activity of each of the places [38].

Table 3.
Comparison of the concentration of heavy metals bound to PM2.5 reported in other places.
3.3. Enrichment Factor (EF) and Geo-Accumulation Index
The enrichment factor and geo-accumulation index were used together to identify the possible sources of the metals detected in the present study.
Table 4 indicates that Mn, Fe and Al (EF < 5) came from natural sources, and mainly from dust resuspension. Zn, V, Pb, and Ni presented an EF of 5 < EF < 100, and came from natural and anthropogenic sources. Meanwhile, the only element that was above 100 (EF > 100) was As, suggesting that it came from anthropogenic sources, mainly vehicular and industrial activity [41,42].

Table 4.
Enrichment factor and geo-accumulation index for the metals identified in Cuernavaca.
Igeo indicates that the air of Cuernavaca is extremely contaminated (Class 6) by As, Pb, and Zn (Igeo > 5), followed by V and Ni (Class 4, strongly contaminated) 3 < Igeo < 4 (Table 4). Together, the EF and Igeo, reveal that the air of Cuernavaca is strongly contaminated with As, Pb, and Zn.
3.4. Environmental Risk
The results indicate that As (RI > 600) is the element that represents the greatest ecological risk in this city, followed by Pb and to a lesser extent Ni, V, and Zn; this merits serious attention, considering the potential impact of these metals on ecosystems and human health (Table 5). Some studies have shown that metals such as As and Pb affect the central nervous system [43] and the renal system [44]; it has also been found that the kidneys are the internal organs that accumulate the most heavy metals [45].

Table 5.
Ecological risk index (RI) calculated for the sites studied in Cuernavaca.
3.5. Human Health Risk
Non Cancer Risk
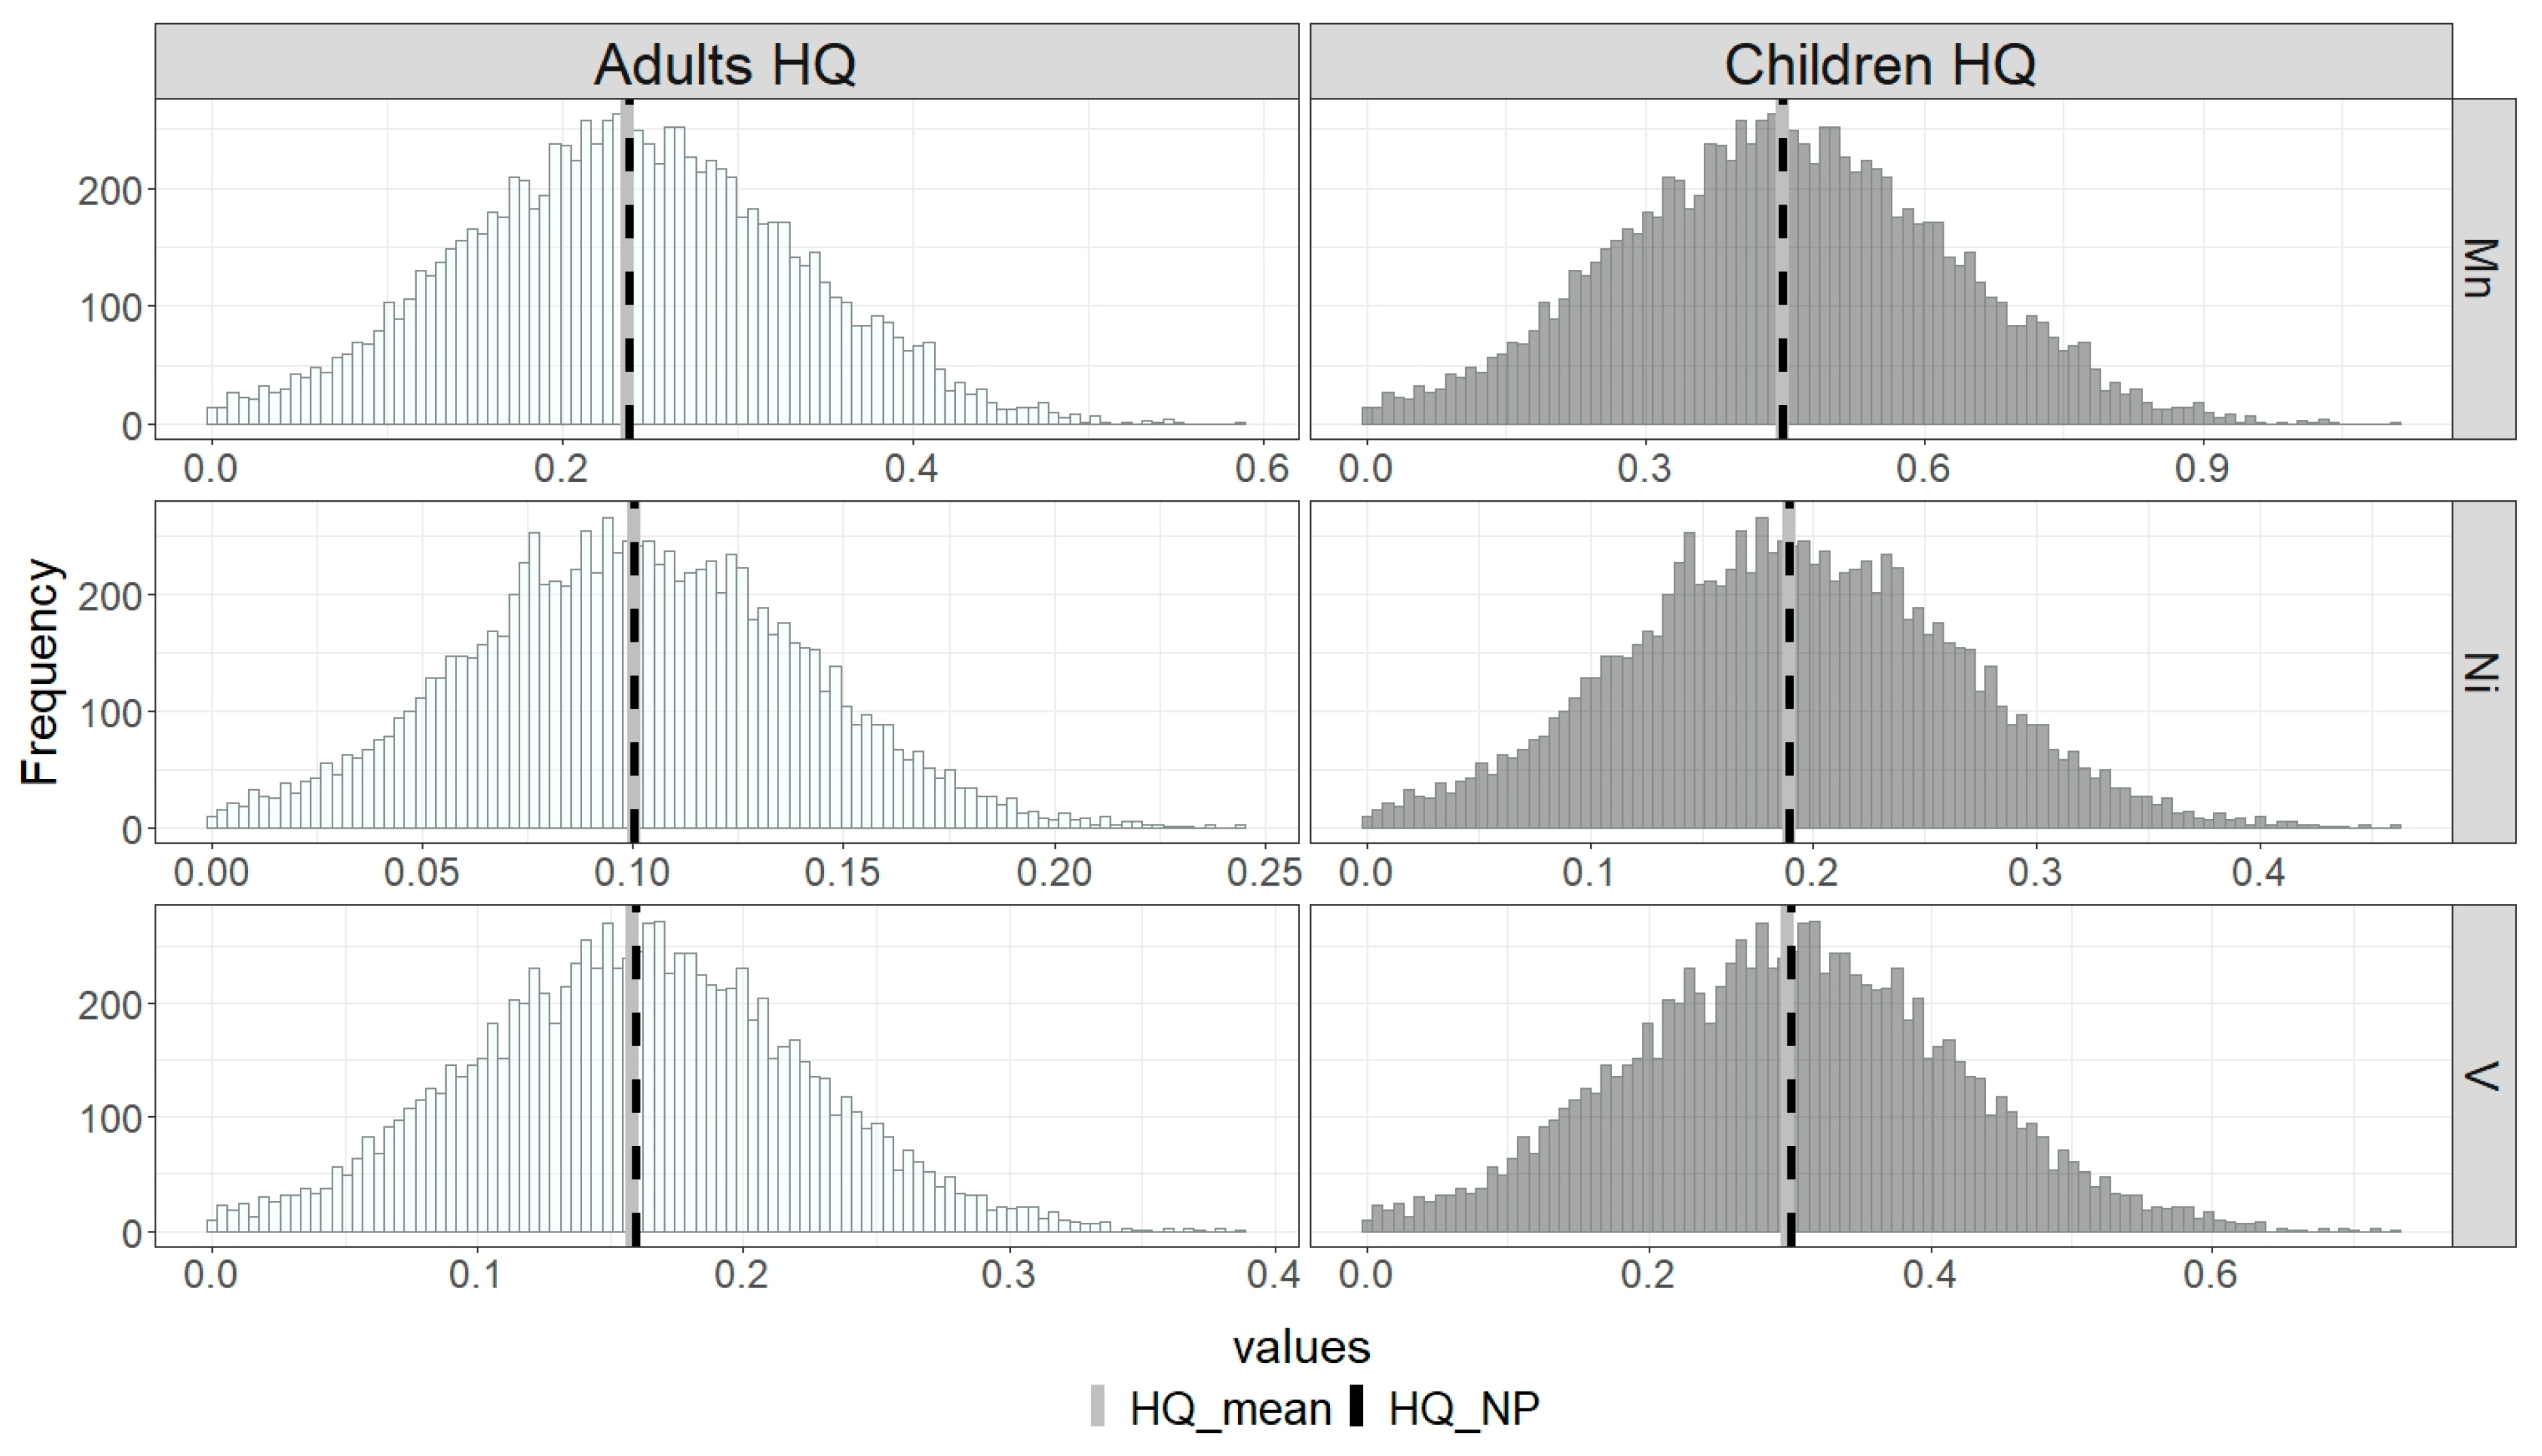
The human health risk in the urban area of Cuernavaca was evaluated by considering the concentrations of V, Mn, and Ni. Figure 2 illustrates the health risks posed to children and adults, expressed in terms of the HQ.
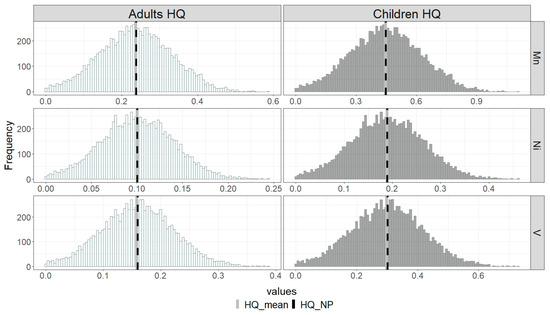
Figure 2.
Simulation of the hazardous quotient (HQ) for adults and children. HQ_mean (simulated probabilistic value); HQ_NP (calculated non-probabilistic value).
All HQ values were below 1 for the selected metals, suggesting that the health risk posed by exposure to ambient air is below that established by the USEPA. However, it must be considered that prolonged exposure can accumulate toxic substances linked to PM2.5.
The results indicate that children are at a greater risk than adults, and that this is due to their daily activities, inhalation rate, body weight ratio, and immature physiological systems, suggesting their greater vulnerability [46]. Likewise, people who have some type of comorbidity should be considered [47].
3.6. Carcinogenic Risk through the Inhalation Exposure Pathway
Incremental Lung Cancer Risk (ILCR)
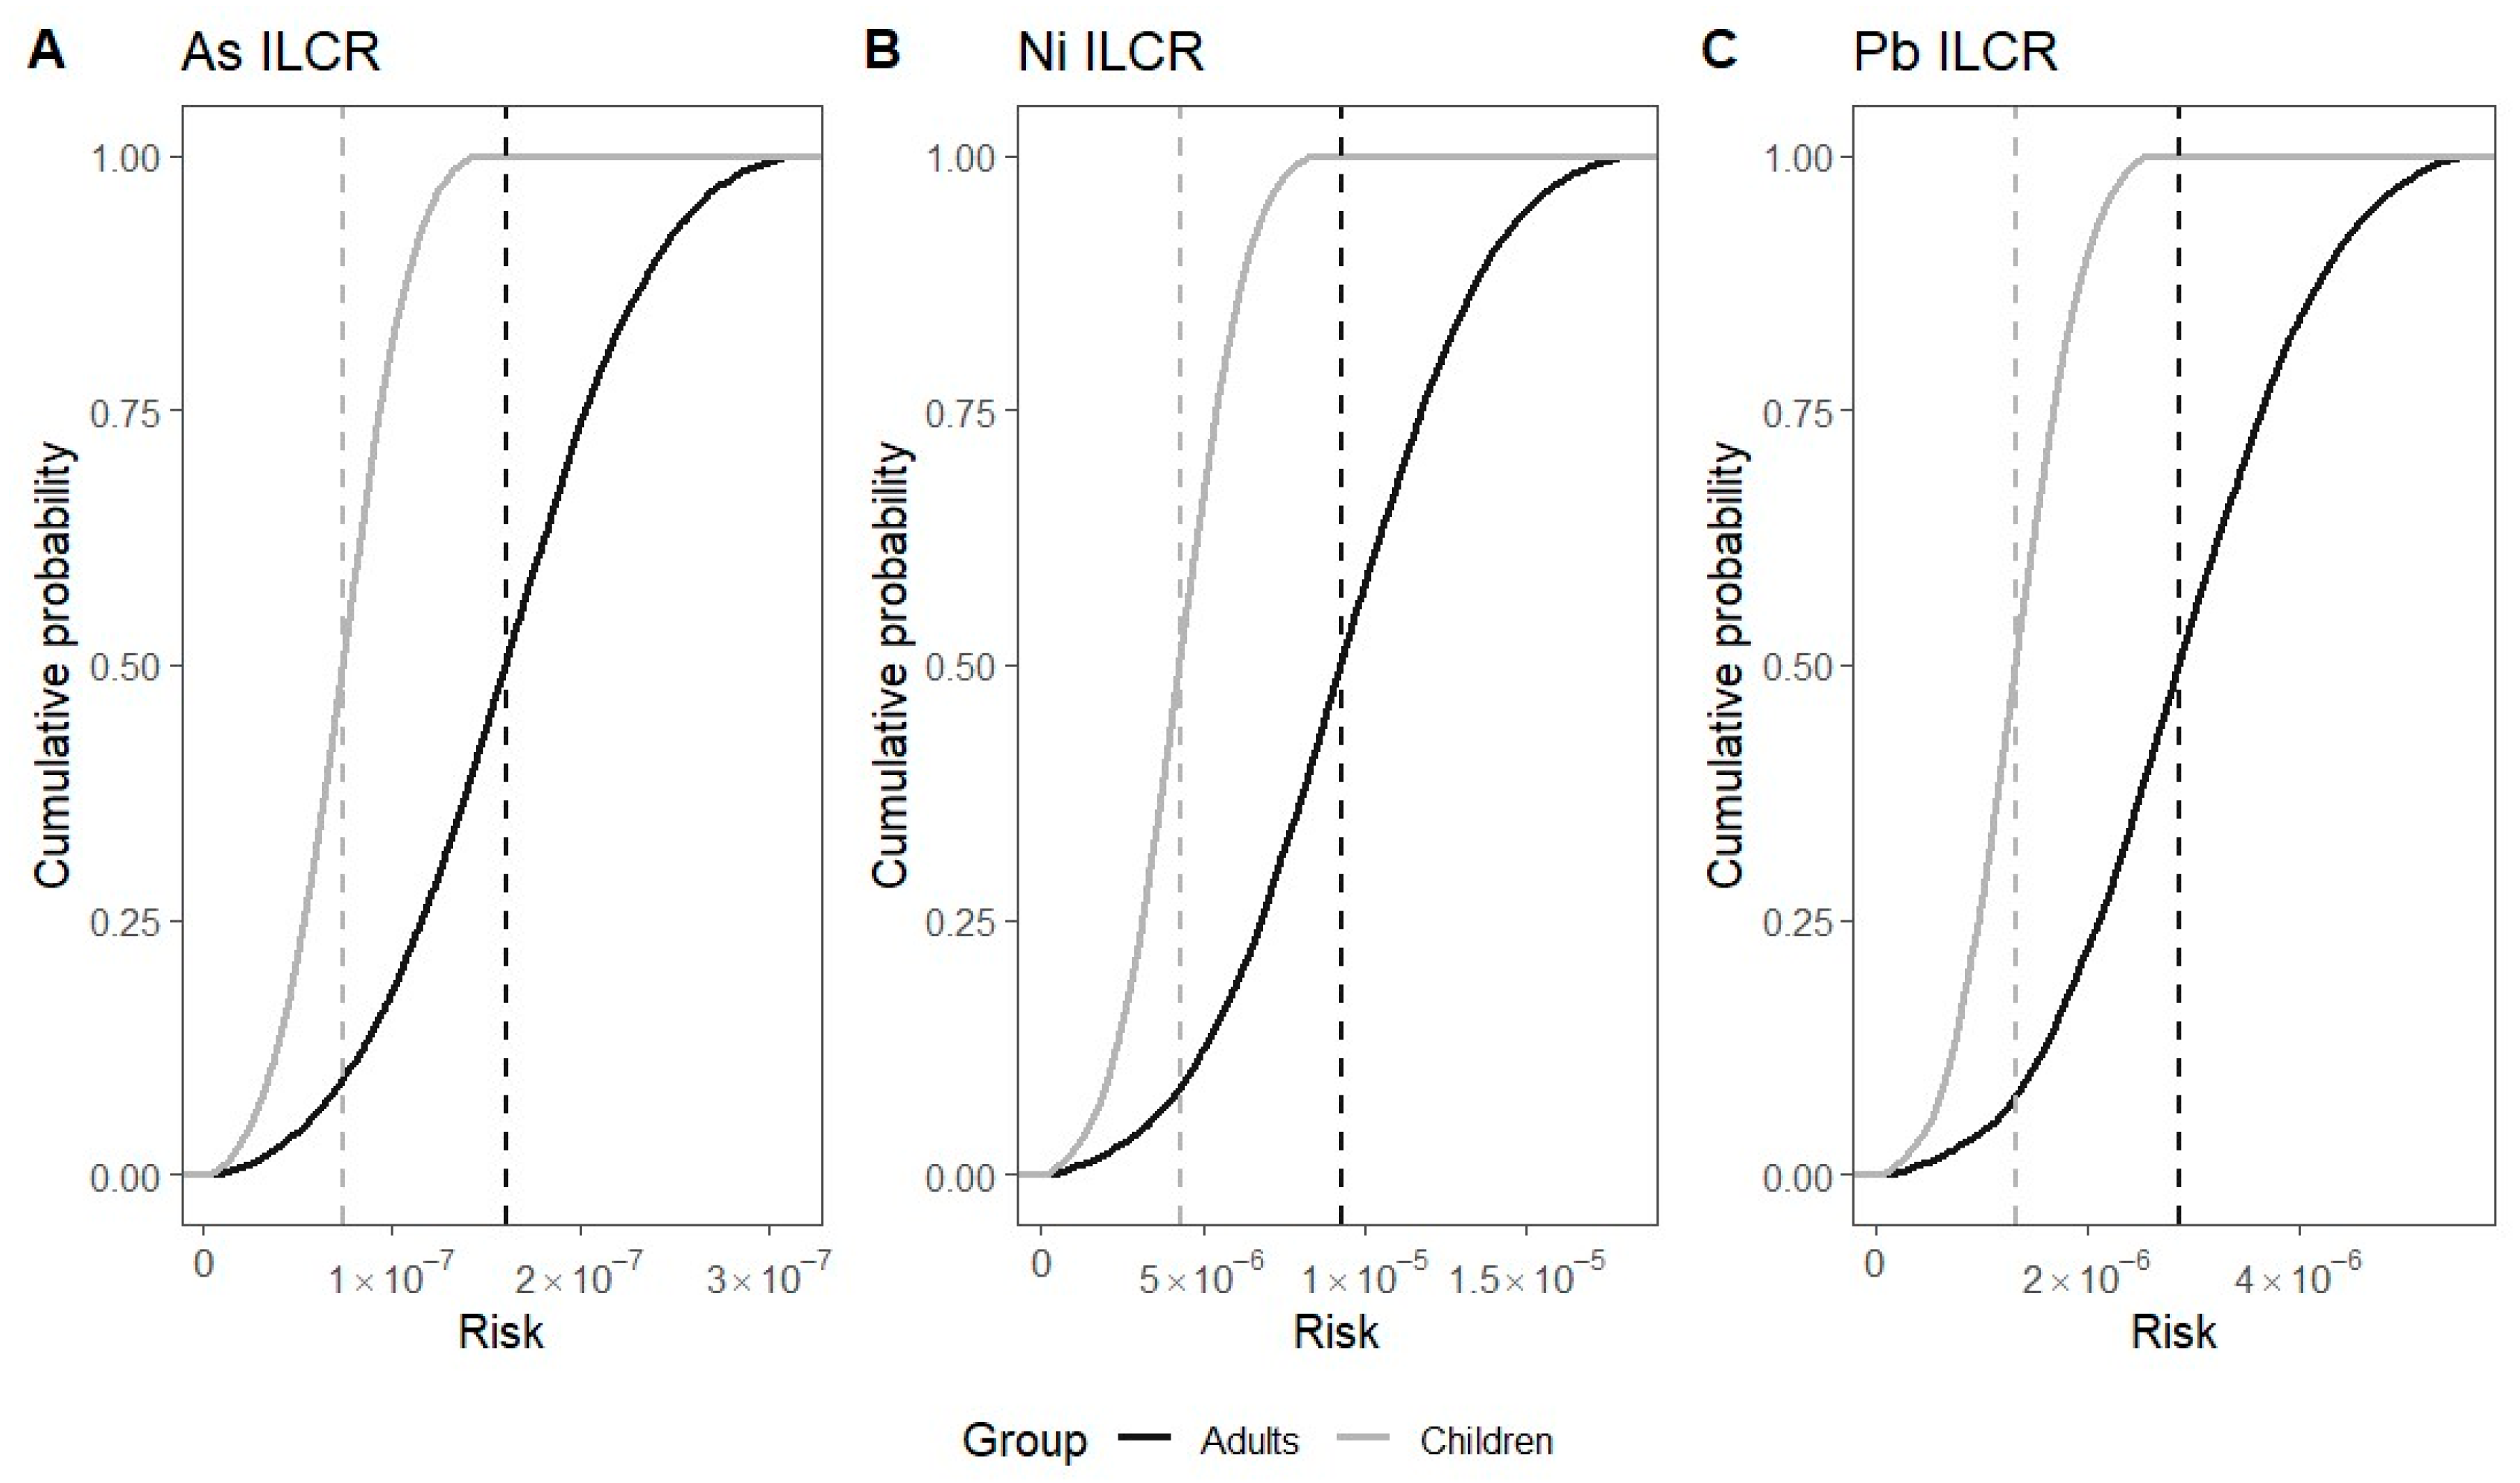
Three metals were chosen to estimate the incremental lung cancer risk due to their carcinogenic classification: As (carcinogen to humans), Ni (possible), and Pb (probable) (IARC 2005). The whole estimations for cancer risk showed that adults are twice as likely to develop lung cancer than children. The Ni ILCR value in Cuernavaca for adults was 1.03 × 10⁻⁵, followed by 2.9 × 10⁻⁶ and 1.6 × 10⁻⁷ for Pb and As, respectively. Meanwhile, the ILCR values for the children were in the following order: Pb (1.2 × 10⁻⁶), Ni (4.8 × 10⁻⁶), and As (7.5 × 10⁻⁶) (Figure 3). The ILCR for adults exposed to Ni was slightly higher than one case in one million (1 × 10⁻⁶), which is the EPA threshold value, suggesting that this metal bound to PM2.5 poses a risk to the health of the adult population studied here. The rest of the ILCR estimations suggest that there is no cancer risk posed to the population groups in this study.
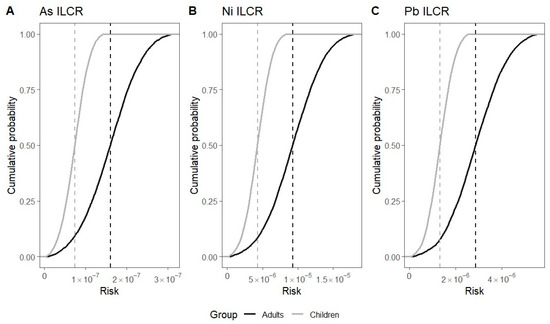
Figure 3.
Simulation of cancer risk for adults and children for (A) As, (B) Ni and (C) Pb.
However, it should not be ruled out that in the medium and long term, this situation could become a serious public health problem if we consider that these metals are bound to particle matter in many different compounds. This could lead to biotransformation in target organs, generating species more toxic than their parents that also bioaccumulate, leading to chronic toxicity. In addition, arsenic is a carcinogen with systemic effects on human health [48].
4. Conclusions
The most abundant metal was Fe, followed by Al, Mg, Zn, As, Ni, V, and Mn, suggesting a mixture of natural and anthropogenic sources. The EF indicates that Al, Fe, Mg, and Mn come fundamentally from natural sources, while V, Ni, Zn, and Pb come from a mix of natural and anthropogenic sources. Meanwhile, the environmental risk, determined by the Ecological Risk Index (RI), indicates the high potential risk that As and Pb pose to natural ecosystems, microorganisms, plants, animals, and humans. The human health risk revealed that the noncarcinogenic risk posed by exposure to ambient air is below that established by the USEPA. Additionally, the Incremental Lung Cancer Risk (ILCR) values were below the limit established by the USEPA, except for Ni in adults. However, long-term exposure to transition metals bound to PM2.5 may be related to negative effects on health.
These findings suggest that Cuernavaca’s air has moderate to high contamination levels, which must be taken into account by environmental authorities so that measures can be taken to help reverse this situation and so that the population becomes aware of the proper use of transportation, which would enable a significant reduction in vehicle emissions and the clandestine burning of garbage and other types of organic matter.
Author Contributions
Conceptualization, H.S.-N. and A.B.-H.; methodology, M.R.-R. and A.B.-H.; software, M.R.-R. and J.d.J.D.-T.; validation, M.-L.G.-B. and M.R.-A.; formal analysis, V.M.-A. and M.A.M.-T.; investigation, H.S.-N.; resources, H.S.-N. and M.A.M.-T.; data curation, H.S.-N.; writing—original draft preparation, H.S.-N. and A.B.-H.; writing—review and editing, H.S.-N., A.B.-H. and M.-L.G.-B.; visualization, H.S.-N., V.M.-A. and J.d.J.F.-L.; supervision, H.S.-N. and M.-L.G.-B.; project administration, H.S.-N. and M.R.-A.; funding acquisition, H.S.-N. All authors have read and agreed to the published version of the manuscript.
Funding
This project was financed by the Secretary of Public Education of Mexico (PROMEP/103.5/13/6626).
Institutional Review Board Statement
Not applicable.
Informed Consent Statement
Not applicable.
Data Availability Statement
The datasets generated during and/or analyzed during the current study are available from the corresponding author upon reasonable request.
Acknowledgments
The authors would like to express their gratitude to the Air Quality Monitoring Network of the State of Morelos (RAMAMOR, for its acronym in English) for allowing the installment of the equipment in their locations. They also thank the National Council of Humanities, Science and Technologies (CONAHCyT, for its acronym in English) for the grant awarded to Alhelí Brito Hernández.
Conflicts of Interest
The authors declare no conflicts of interest.
References
- Olstrup, H.; Johansson, C.; Forsberg, B.; Åström, C.; Orru, H. Seasonal Variations in the Daily Mortality Associated with Exposure to Particles, Nitrogen Dioxide, and Ozone in Stockholm, Sweden, from 2000 to 2016. Atmosphere 2021, 12, 1481. [Google Scholar] [CrossRef]
- Emmanouil, C.; Drositi, E.; Vasilatou, V.; Diapouli, E.; Krikonis, K.; Eleftheriadis, K.; Kungolos, A. Study on particulate matter air pollution, source origin, and human health risk based of PM10 metal content in Volos City, Greece. Toxicol. Environ. Chem. 2016, 99, 691–709. [Google Scholar] [CrossRef]
- Scorer, R.S. Air Pollution Meteorology; Horwood Pub.: Chichester, UK, 2002. [Google Scholar]
- World Health Organization. WHO, Ambient Air Pollution: A Global Assessment of Exposure and Burden of Disease. March 2018. Available online: https://www.who.int/publications/i/item/9789241511353 (accessed on 25 August 2023).
- World Health Organization. WHO, 7 Million Premature Deaths Annually Linked to Air Pollution [Press Release]. 25 March 2014. Available online: https://www.who.int/news/item/25-03-2014-7-million-premature-deaths-annually-linked-to-air-pollution (accessed on 15 September 2023).
- Gao, P.; Guo, H.; Wang, S.; Guo, L.; Xing, Y.; Yao, C.; Jia, L.; Fan, Q.; Hang, J. In Vitro investigations of high molecular weight polycyclic aromatic hydrocarbons in winter airborne particles using simulated lung fluids. Atmos. Environ. 2019, 201, 293–300. [Google Scholar] [CrossRef]
- World Health Organization. WHO, Global Air Quality Guidelines: Particulate Matter (PM2.5 and PM10), Ozone, Nitrogen Dioxide, Sulfur Dioxide and Carbon Monoxide; Executive Summary. World Health Organization. 2021. Available online: https://apps.who.int/iris/handle/10665/345334 (accessed on 16 September 2023).
- Alsbou, E.M.E.; Al-Khashman, O.A. Heavy metal concentrations in roadside soil and street dust from Petra region, Jordan. Environ. Monit. Assess. 2017, 190, 48. [Google Scholar] [CrossRef] [PubMed]
- Agency for Toxic Substances and Disease Registry (ATSDR). Substance priority List. U.S. Department of Health and Human Services. 2019. Available online: https://www.atsdr.cdc.gov/spl/index.html (accessed on 15 September 2023).
- Baensch-Baltruschat, B.; Kocher, B.; Stock, F.; Reifferscheid, G. Tyre and road wear particles (TRWP)—A review of generation, properties, emissions, human health risk, ecotoxicity, and fate in the environment. Sci. Total Environ. 2020, 733, 137823. [Google Scholar] [CrossRef] [PubMed]
- Xu, P.; Chen, Y.; He, S.; Chen, W.; Wu, L.; Xu, D.; Chen, Z.; Wang, X.; Lou, X. A follow-up study on the characterization and health risk assessment of heavy metals in ambient air particles emitted from a municipal waste incinerator in Zhejiang, China. Chemosphere 2020, 246, 125777. [Google Scholar] [CrossRef]
- Zhang, X.; Eto, Y.; Aikawa, M. Risk assessment and management of PM2.5-bound heavy metals in the urban area of Kitakyushu, Japan. Sci. Total Environ. 2021, 795, 148748. [Google Scholar] [CrossRef] [PubMed]
- Wang, K.; Wang, W.; Li, L.; Li, J.; Wei, L.; Chi, W.; Hong, L.; Zhao, Q.; Jiang, J. Seasonal concentration distribution of PM1.0 and PM2.5 and a risk assessment of bound trace metals in Harbin, China: Effect of the species distribution of heavy metals and heat supply. Sci. Rep. 2020, 10, 8160. [Google Scholar] [CrossRef]
- Imani, M. Particulate matter (PM2.5 and PM10) generation map using MODIS Level-1 satellite images and deep neural network. J. Environ. Manag. 2021, 281, 111888. [Google Scholar] [CrossRef]
- Saldarriaga-Noreña, H.; Hernández-Mena, L.; Ramírez-Muñiz, M.; Carbajal-Romero, P.; Cosío-Ramírez, R.; Esquivel-Hernández, B. Characterization of trace metals of risk to human health in airborne particulate matter (PM2.5) at two sites in Guadalajara, Mexico. J. Environ. Monit. 2009, 11, 887–894. [Google Scholar] [CrossRef]
- Saldarriaga-Noreña, H.; Montiel-Palma, S.; Márquez, R.L.; Sánchez, J.V.; Murillo-Tovar, M.A. Chemical characterization and Health Risk Assessment of metals associated to airborne particulate matter PM2.5 in Saltillo, México. South Fla. J. Dev. 2021, 2, 4218–4238. [Google Scholar] [CrossRef]
- Hernández-López, A.E.; del Campo, J.M.M.; Mugica-Álvarez, V.; Hernández-Valle, B.L.; Mejía-Ponce, L.V.; Pineda-Santamaría, J.C.; Reynoso-Cruces, S.; Mendoza-Flores, J.A.; Rozanes-Valenzuela, D. A Study of PM2.5 Elemental Composition in Southwest Mexico City and Development of Receptor Models with Positive Matrix Factorization. Rev. Int. Contam. Ambient. 2021, 37, 67–88. [Google Scholar] [CrossRef]
- Murillo-Tovar, M.A.; Saldarriaga-Noreña, H.; Hernández-Mena, L.; Campos-Ramos, A.; Cárdenas-González, B.; Ospina-Noreña, J.E.; Cosío-Ramírez, R.; Díaz-Torres, J.D.J.; Smith, W. Potential Sources of Trace Metals and Ionic Species in PM2.5 in Guadalajara, Mexico: A Case Study during Dry Season. Atmosphere 2015, 6, 1858–1870. [Google Scholar] [CrossRef]
- Blanco-Jiménez, S.; Altúzar, F.; Jiménez, B.; Aguilar, G.; Pablo, M.; Benítez, M.A. Evaluación de Partículas Suspendidas PM2.5 en el Área Metropolitana de Monterrey; Instituto Nacional de Ecología y Cambio Climático (INECC): México City, Mexico, 2015; 34p, Available online: http://aire.nl.gob.mx/docs/reportes/Reporte_WG3_PM2.5_Monterrey.pdf (accessed on 1 January 2020).
- Taylor, S.R. Abundance of chemical elements in the continental crust: A new table. Geochim. Cosmochim. Acta 1964, 28, 1273–1285. [Google Scholar] [CrossRef]
- Müller, G. Index of geoaccumulation in sediments of the Rhine River. J. Geol. 1969, 2, 108–118. [Google Scholar]
- Håkanson, L. An ecological risk index for aquatic pollution control: A sedimentary approach. Water Res. 1980, 14, 975–1001. [Google Scholar] [CrossRef]
- Alves, C.A.; Vicente, E.D.; Vicente, A.M.; Rienda, I.C.; Tomé, M.; Querol, X.; Amato, F. Loadings, chemical patterns and risks of inhalable road dust particles in an Atlantic city in the north of Portugal. Sci. Total Environ. 2020, 737, 139596. [Google Scholar] [CrossRef] [PubMed]
- Zhi, M.; Zhang, X.; Zhang, K.; Ussher, S.J.; Lv, W.; Li, J.; Gao, J.; Luo, Y.; Meng, F. The characteristics of atmospheric particles and metal elements during winter in Beijing: Size distribution, source analysis, and environmental risk assessment. Ecotoxicol. Environ. Saf. 2021, 211, 111937. [Google Scholar] [CrossRef] [PubMed]
- Chen, X.; Guo, M.; Feng, J.; Liang, S.; Han, D.; Cheng, J. Characterization and risk assessment of heavy metals in road dust from a developing city with good air quality and from Shanghai, China. Environ. Sci. Pollut. Res. 2019, 26, 11387–11398. [Google Scholar] [CrossRef]
- U.S. Environmental Protection Agency. Exposure Factors Handbook; EPA/600/R-09/052F; National Center for Environmental Assessment: Washington, DC, USA, 2011. Available online: https://cfpub.epa.gov/ncea/risk/recordisplay.cfm?deid=236252 (accessed on 10 August 2023).
- Environmental Protection Agency. Exposure Assessment Tools by Routes-Inhalation. 2023. Available online: https://www.epa.gov/expobox/exposure-assessment-tools-routes-inhalation (accessed on 20 October 2023).
- U.S. Environmental Protection Agency. Guiding Principles for Monte Carlo Analysis; EPA/630/R-97/001; U.S. Environmental Protection Agency: Washington, DC, USA, 1997. Available online: https://www.epa.gov/sites/default/files/2014-11/documents/montecar.pdf (accessed on 10 August 2023).
- Jiang, C.; Zhao, Q.; Zheng, L.; Chen, X.; Li, C.; Ren, M. Distribution, source and health risk assessment based on the Monte Carlo method of heavy metals in shallow groundwater in an area affected by mining activities, China. Ecotoxicol. Environ. Saf. 2021, 224, 112679. [Google Scholar] [CrossRef]
- Díaz-González, L.; Uscanga-Junco, O.A.; Rosales-Rivera, M. Development and comparison of machine learning models for water multidimensional classification. J. Hydrol. 2021, 598, 126234. [Google Scholar] [CrossRef]
- U.S. Environmental Protection Agency. Integrated Risk Information System. Available online: https://www.epa.gov/iris/basic-information-about-integrated-risk-information-system (accessed on 24 September 2023).
- International Agency for Research on Cancer. Guidelines for Carcinogen Risk Assessment. EPA/630/P-03/001B; 2005. Available online: https://www3.epa.gov/airtoxics/cancer_guidelines_final_3-25-05.pdf (accessed on 17 August 2023).
- Rajšić, S.; Mijić, Z.; Tasić, M.; Radenković, M.; Joksić, J. Evaluation of the levels and sources of trace elements in urban particulate matter. Environ. Chem. Lett. 2008, 6, 95–100. [Google Scholar] [CrossRef]
- Pacyna, J.M. Source inventories for atmospheric trace metals. In Atmospheric Particles; IUPAC Series on Analytical and Physical Chemistry of Environmental Systems; Harrison, R.M., van Grieken, R.E., Eds.; Wiley: Chichester, UK, 1998; Volume 5, pp. 385–423. [Google Scholar]
- López, D.L.; Bundschuh, J.; Birkle, P.; Armienta, M.A.; Cumbal, L.; Sracek, O.; Cornejo, L.; Ormachea, M. Arsenic in volcanic geothermal fluids of Latin America. Sci. Total Environ. 2012, 429, 57–75. [Google Scholar] [CrossRef]
- Allen, A.; Nemitz, E.; Shi, J.; Harrison, R.; Greenwood, J. Size distributions of trace metals in atmospheric aerosols in the United Kingdom. Atmos. Environ. 2001, 35, 4581–4591. [Google Scholar] [CrossRef]
- Fukai, T.; Kobayashi, T.; Sakaguchi, M.; Aoki, M.; Saito, T.; Fujimori, E.; Haraguchi, H. Chemical Characterization of Airborne Particulate Matter in Ambient Air of Nagoya, Japan, as Studied by the Multielement Determination with ICP-AES and ICP-MS. Anal. Sci. 2007, 23, 207–213. [Google Scholar] [CrossRef]
- Han, X.; Lu, X. Spatial distribution, environmental risk and source of heavy metals in street dust from an industrial city in semi-arid area of China. Arch. Environ. Prot. 2017, 43, 10–19. [Google Scholar] [CrossRef]
- Guo, F.; Tang, M.; Wang, X.; Yu, Z.; Wei, F.; Zhang, X.; Jin, M.; Wang, J.; Xu, D.; Chen, Z.; et al. Characteristics, sources, and health risks of trace metals in PM2.5. Atmospheric Environ. 2022, 289, 119314. [Google Scholar] [CrossRef]
- Makkonen, U.; Vestenius, M.; Huy, L.; Anh, N.; Linh, P.; Thuy, P.; Phuong, H.; Nguyen, H.; Thuy, L.; Aurela, M.; et al. Chemical composition and potential sources of PM2.5 in Hanoi. Atmos. Environ. 2023, 299, 119650. [Google Scholar] [CrossRef]
- Haritash, A.K.; Kaushik, C.P.; Kaushik, A.; Kansal, A.; Yadav, A.K. Suitability assessment of groundwater for drinking, irrigation and industrial use in some North Indian villages. Environ. Monit. Assess. 2008, 145, 397–406. [Google Scholar] [CrossRef] [PubMed]
- Chester, R.; Nimmo, M.; Alarcon, M.; Saydam, C.; Murphy, K.; Sanders, G.; Corcoran, P. Defining the chemical character of aerosols from the atmosphere of the mediterranean-sea and surrounding regions. Oceanol. Acta 1993, 16, 231–246. [Google Scholar]
- Wright, R.O.; Amarasiriwardena, C.; Woolf, A.D.; Jim, R.; Bellinger, D.C. Neuropsychological correlates of hair arsenic, manganese, and cadmium levels in school-age children residing near a hazardous waste site. NeuroToxicology 2006, 27, 210–216. [Google Scholar] [CrossRef] [PubMed]
- Barbier, O.; Jacquillet, G.; Tauc, M.; Cougnon, M.; Poujeol, P. Effect of Heavy Metals on, and Handling by, the Kidney. Nephron Physiol. 2005, 99, 105–110. [Google Scholar] [CrossRef] [PubMed]
- de Burbure, C.; Buchet, J.-P.; Bernard, A.; Leroyer, A.; Nisse, C.; Haguenoer, J.-M.; Bergamaschi, E.; Mutti, A. Biomarkers of Renal Effects in Children and Adults with Low Environmental Exposure to Heavy Metals. J. Toxicol. Environ. Health Part A 2003, 66, 783–798. [Google Scholar] [CrossRef] [PubMed]
- de Oliveira, B.F.A.; Ignotti, E.; Artaxo, P.; do Nascimento Saldiva, P.H.; Junger, W.L.; Hacon, S. Risk assessment of PM2.5 to child residents in Brazilian Amazon region with biofuel production. Environ. Health 2012, 11, 64. [Google Scholar] [CrossRef]
- Salinas-Rodríguez, A.; Fernández-Niño, J.A.; Manrique-Espinoza, B.; Moreno-Banda, G.L.; Sosa-Ortiz, A.L.; Qian, Z.M.; Lin, H. Exposure to ambient PM2.5 concentrations and cognitive function among older Mexican adults. Environ. Int. 2018, 117, 1–9. [Google Scholar] [CrossRef]
- Agency for Toxic Substances and Disease Registry. United States. Division of Toxicology and Human Health Sciences. Addendum to the Toxicological Profile for Arsenic. 2015. Available online: https://stacks.cdc.gov/view/cdc/35726 (accessed on 10 November 2023).
Disclaimer/Publisher’s Note: The statements, opinions and data contained in all publications are solely those of the individual author(s) and contributor(s) and not of MDPI and/or the editor(s). MDPI and/or the editor(s) disclaim responsibility for any injury to people or property resulting from any ideas, methods, instructions or products referred to in the content. |
© 2024 by the authors. Licensee MDPI, Basel, Switzerland. This article is an open access article distributed under the terms and conditions of the Creative Commons Attribution (CC BY) license (https://creativecommons.org/licenses/by/4.0/).

