Abstract
Natural gas is known as a widely used energy source in residential, business and industrial areas. During the transportation of natural gas by pipelines, accidents occur due to various reasons, which can also lead to gas output. These accidents are events that have the potential to pose important risks in terms of life and property safety, particularly in urban areas and surrounding of pipeline routings. In this study, accident scenarios were generated based on a natural gas distribution pipeline fire that occurred in Istanbul (NW Türkiye) on 28 April 2020 and the impact areas of the jet fire were calculated using the ALOHA program. The effects of source release factors (i.e., pipe length and diameter) and atmospheric conditions (i.e., wind speed, cloud cover, air temperature and relative humidity) on the thermal radiation threat distances associated with jet fire were calculated for the current and worst scenarios. As a result, it was found that pipe length and diameter have a significant effect on threat distances. In addition to the role of the synoptic circulation mechanism on the jet fire for the selected episodic event (position of low/high pressure centers), local atmospheric conditions also have an effect on the threat distance. From the modeling analysis, significant impact of wind speed, air temperature and relative humidity values on the threat distances were found. In the worst scenario, if there were strong northeasterly winds reaching 30.9 m per hour at the time of the jet fire, the threat distances would have been 21 m (red), 28 m (orange) and 42 m (yellow). This case shows that if a natural gas jet fire occurs under the influence of strong northeasterly winds (passing over the Black Sea without encountering any topographic obstacles), poisonous gas will be transported to long distances in a short time and will negatively affect social life and economy.
1. Introduction
Natural gas is a colorless, odorless, lighter than air and flammable gas mixture that is formed as a result of certain geological processes occurring under the earth’s crust and is found in large volumes on top of oil deposits in gaseous form or trapped in the voids existing in porous rocks [1]. It consists of approximately 70–90% methane and lesser amounts of light paraffinic hydrocarbons like ethane, propane and butane. Apart from these, natural gas also includes gases such as nitrogen, carbon dioxide and hydrogen sulfide. Therefore, raw natural gas must be processed to remove these gases before being put into use through pipelines [2].
Natural gas (an environmentally friendly, efficient and useful fuel) is widely used in residences, businesses and industrial areas. Nowadays, natural gas is carried either in gaseous form via pipelines or in liquefied form (LNG) by tankers. Complicated pipelines are being constructed in order to deliver natural gas to end users. Natural gas pipelines can be examined in three different groups. Gathering pipelines, which are accepted as the first stage for natural gas production, are pipelines established for the purpose of transporting natural gas between the production area, also called wellhead, and the collection plants. Transmission pipelines carry natural gas from collection plants to raffination, processing and storage plants. In addition, they are used to carry the refined natural gas to the distribution pipelines section or to consumers. Distribution pipelines are built to transport natural gas from transmission pipelines for use in businesses and residences [3,4].
In Türkiye, natural gas is transported between cities at high pressure (35–75 bar) via steel transmission pipelines. The pressure of the natural gas coming to the main pressure reducing stations (RMS-A) located near the city is reduced to 20–40 bar or 12–19 bar, depending on the structure of the distribution network [5]. Then, it is transmitted to regional regulator stations located at certain places in the city via steel distribution lines. Natural gas, the pressure of which is reduced to 4 bar at the regional regulator stations, is delivered to the service boxes located at the entrances of the residences via 63-, 90-, 110- and 125-mm diameter polyethylene gas pipelines. Under normal conditions, these pipelines are buried at a depth of about 0.8–1 m. The pressure value of this gas coming to the service boxes is reduced to 21–300 mbar depending on the usage capacity of the building [1,5].
During the transportation of natural gas through pipelines, accidents occur due to external interventions, corrosion, construction errors/material failures, ground movements, faulty operation/maintenance errors and other and unknown reasons, which also cause gas output [6]. Accidents related to natural gas pipelines are events that have the potential to pose important risks to the safety of life and property, particularly in urban areas and surrounding of pipeline routings. As mentioned by Joe and Ahn [7], people around the pipeline routes are subject to significant risk from pipeline failure. In general, the hazard distance associated with the pipeline ranges from under 20 m for smaller pipelines at lower pressure, up to over 300 m for a larger one at higher pressure. On the other hand, the frequency of accidents occurring in natural gas distribution pipelines is higher than the frequency of accidents occurring in other pipelines, and distribution pipeline accidents constitute approximately 80 percent of all accidents occurring in natural gas pipelines. In addition, since natural gas distribution pipelines are located more densely in urban areas, the population around these pipelines is higher, which rises the severity of accidents occurring in natural gas distribution pipelines. The most important results of accidents in natural gas pipelines are fire and explosion [4]. These events, on the other hand, can have serious consequences on people and the environment as well as cause great economic losses. For this reason, determining the impact areas related to pipeline accidents will be beneficial in terms of activities such as risk assessment, planning, emergency intervention and evacuation.
Numerous studies have been conducted on the determination of the impact areas of natural gas accidents and risk assessment. Bubbico et al. [8] conducted a preliminary risk assessment study for an LNG ship berthing in Italy’s Panigaglia terminal using ALOHA 10.9 and CHEMS-PLUS V6 software. As a result, they determined that there would be dangerous thermal effects in the region within a radius of 700–1500 m. Bernatik et al. [9] determined the hazardous areas for the releases that occur in different ways in LNG plants using ALOHA, EFFECTS and TerEx programs and compared the results. They also proposed a method for quantifying the hazards of LNG installations by replacing the criticality assessment method applied for national monuments. Kalatpoor et al. [10] used Kent’s pipeline risk assessment method [11] for a risk assessment study related to a gas pipeline located in the oil exploration area in Gachsaran, Iran; however, they estimated the threat areas with the ALOHA program. Shao and Duan [12] examined the accident scenarios by using the ALOHA program and they determined the accident risk related to the natural gas release from the pipeline in a natural gas power plant and the effects of this accident on the residents. They also calculated the individual and social risks for the accidents in question. They found that the individual risk and social risk were beyond the acceptable range for three types of leakage situations, where the leakage openings were 100 mm, 200 mm, and 1200 mm, respectively. Zhu et al. [13] investigated the suffocation, flammable vapor cloud, overpressure and thermal radiation threat distances related to natural gas pipeline accidents using the ALOHA program and determined the dependence of these distances on environmental factors and pipeline-related factors. They declared that flammable vapor cloud distance (530 m) was larger than the overpressure threat distance (417 m) and the suffocation threat distance (135 m). Zhou et al. [14] suggested a theoretical method for risk assessment studies related to gas pipelines, conducted a case study on a natural gas pipeline in China to demonstrate the method and its practice in land use planning and used the ALOHA program to calculate accident outcomes. As a result of the case study, they determined the critical distances from the pipeline for 10−5, 10−6 and 3 × 10⁻⁷ values of individual risk as 360 m, 480 m and 520 m, respectively. Using these distances, they obtained three risk areas and made recommendations for land use planning for each risk area. Bajcar et al. [15] provided a refined way to measure the effects of third-party interventions on the risk to people posed by natural gas transmission pipelines. Hanafiah et al. [16] calculated and compared the human health and safety loss as a result of natural gas pipeline failures in monetary terms for rural and urban sites. For this purpose, they determined a fire scenario leading to a vapor cloud explosion and calculated the damage radiuses using the ALOHA program for this scenario. As a result, they calculated much larger human health and safety loss values for urban areas than for rural areas. Ebrahemzadih and Haedari [17] adopted the Fault Tree Analysis method to examine the disaster probability prediction process in natural gas pipelines, presented a new method based upon the assignment of weights to the fault tree and determined the hazards related to the transportation of natural gas with the “What-if” method. They also benefited from the ALOHA program in the determination of accident scenarios and their effects. Based on the results obtained with the ALOHA program, they determined that the most dangerous scenarios for natural gas pipelines are jet fire and vapor cloud explosion. Çetinyokuş [18] calculated the toxic zone, combustible zone and high-pressure effect distances of methane, ethylene diamine and methyl chloride for different situations that were created by taking into account the average atmospheric conditions of Kocaeli with the help of the ALOHA program. The largest threat distance values (toxic threat distance values, >10 km) was obtained for ethylene diamine. It was determined that, for all three chemicals, wind speed, atmospheric stability class and surface roughness were significantly effective on their threat distances. Tawfik et al. [19] for Damanhur Electric Power Plant, Egypt, they used the AirPacts module of the SIMPACT program to determine the physical effects of pollutants generated under normal operating conditions as well as the ALOHA program to model nitrogen dioxide and methane gas leakage scenarios for risk assessment. Khalid et al. [20], by using the ALOHA program and quantitative risk calculation approach, evaluated the potential results of jet fire caused by the release of natural gas from pipes at a natural gas power plant in Teluk Gong, Malaysia. Kotkava and Hromada [21] modeled a real methane leakage that happened in 2010 at the old ALSTOM power complex in Brno, Czechia using ALOHA and TerEx programs and compared the results they obtained with the measurement results during the accident. Özay et al. [22], with the help of the ALOHA program, modeled the BLEVE scenario that occurred on a liquefied natural gas tanker cruising in the İstanbul Strait and identified the affected areas. Vairo et al. [23] focused on an improved event tree model to overcome the limitations of the widely used IP-UKOOA (Ignition Probability-United Kingdom Offshore Operators Association) approach. To prove the capability of the new model, they conducted a case study for a buried high pressure natural gas pipeline and compared their results with those of the traditional method.
Apart from the studies mentioned above, calculating the threat distances related to the accidents occurring in the local natural gas distribution pipelines in urban areas and determining the effects of the source release factors and atmospheric conditions (both local and synoptic) on these distances are also of great importance in terms of ensuring the safety of life and property. Therefore, the aim of this study is to determine the effects of source release factors (i.e., pipe length and diameter) and atmospheric conditions (i.e., wind speed, cloud cover, air temperature, relative humidity, the position of low/high pressure centers) on thermal radiation threat distances associated with a jet fire occuring in a natural gas distribution pipeline. For this purpose, accident scenarios were created based on a natural gas distribution pipeline fire in Istanbul, Türkiye and modeling studies were carried out for these scenarios using the ALOHA program.
2. Data and Methodology
2.1. Occurence of the Accident
This study is very important because it is based on a real accident that occurred during natural gas distribution. In the literature, there are studies related to natural gas transmission and medium pressure distribution pipelines; however, this study mainly focuses on the consequences of accidents in local natural gas distribution pipelines and the role of resource emission factors and atmospheric conditions on gas transmission. For this reason, we analyzed a real natural gas distribution pipeline fire that occurred in the province of Istanbul as the basis. According to the records obtained from the Istanbul Metropolitan Municipality Fire Brigade Department and the news in the national press, the fire occured on 28 April 2020 at 11:07 a.m. local time (LT: UTC+3) in Beylikdüzü District Gürpınar Neighborhood İnönü Street [24]. From the relevant records, it is known that the construction machine used in the work during the excavation work on the street damaged the natural gas pipeline passing through the street; hence, the fire occurred as a result of the natural gas spreading to the environment contacting any open fire source. As a result, jet fire occurred in the urban settlement of Istanbul (Figure 1) and 15 people affected by the incident were treated by 112 emergency medical teams at the scene and 2 injured people were taken to the hospital by ambulance, which was published by Governership of Istanbul [25].
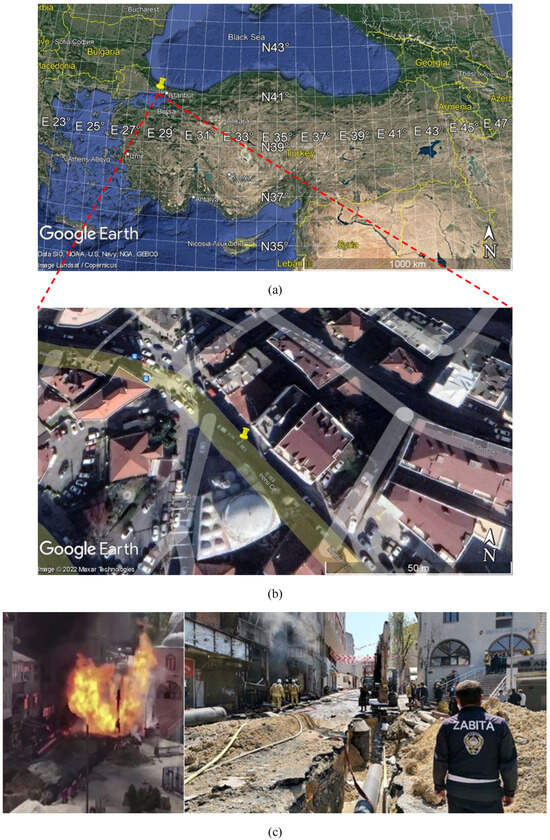
Figure 1.
(a) Geographic location and satellite image (b) of the fire occurrence on 28 April 2020. (c) Fire moment and after the fire.
2.2. ALOHA Program
ALOHA is a hazard modeling program created by NOAA (National Oceanic and Atmospheric Administration) and EPA (U.S. Environmental Protection Agency) in order to model events like that toxic vapor cloud, fire and explosion caused by the release of chemical substances from tanks, pipelines and liquid pools, and to identify threat zones. The program is mainly designed to identify threat zones related to hazards arising from chemical releases for responders in real emergency situations [26,27]. ALOHA is one of the widely accepted models used for simulating dispersion of hazardous gases and a number of studies succesfully incorporated the applications of ALOHA for risk assessment purpose [28,29]. Many studies indicated that this software is very useful for the dispersion modeling of hazardous chemicals such as LPG and Chlorine [30,31,32,33].
It can produce fast and reasonably accurate results. Compared to other software programs, this model is very easy to run and give fast estimation of impacted area, so that responders can use ALOHA as a responsible tool during a spill event [34]. Additionally, the ALOHA development team states that this program is also suitable for education and emergency planning activities. ALOHA is a computer program designed to be easily used. It controls the values (chemical substance, atmospheric conditions, source release conditions, etc.) that users enter into the program through dialog boxes and minimizes the errors that may occur in this regard. For this purpose, the model uses two different types of dispersion of gas clouds in the atmosphere as Gaussian air dispersion and heavy gas dispersion. The library of the program includes the physical properties of around 1000 widespread chemical substances. Modeling results are displayed as printable text. In addition, different types of graphical outputs can also be obtained. As a result of the modeling, the program usually estimates three threat zones, shown in red, orange and yellow, based on the identified concern levels [35]. Red color indicates the highest threat level and yellow color indicates the least threat level. Apart from this, it is possible to show threat zones on maps by means of tools such as MARPLOT, Google Maps and Google Earths [26,27].
2.3. Input Chemical and Atmospheric Conditions into the ALOHA
Thermal radiation threat distances of jet fire and the effects of source release factors (i.e., pipe length and diameter) and atmospheric conditions (i.e., wind speed, cloud cover, air temperature and relative humidity) on these distances were investigated in accident scenarios based on the event mentioned in Section 2.1. Since it constitutes a large part of the natural gas composition, methane was chosen as the chemical substance in the modeling studies. In modeling studies to determine the dependence of threat distances on pipe diameters, the burning rate calculated by the ALOHA program is 97.6 kg/min for 63 mm pipe diameter, 297 kg/min for 110 mm pipe diameter and 384 kg/min for 125 mm pipe diameter. As the amount of burning chemicals per unit time increased, the threat distances related to thermal radiation caused by fire increased.
It is known that synoptic circulations also play a significant role in transferring particles, in addition to the local scale atmospheric environment [36,37]. For the synoptic approach, we used NCEP/NCAR Reanalysis (2.5° × 2.5° grid resolution) sea level pressure, 10 m wind direction and speed values at 06:00 UTC on 28 April 2020 (closest time to the jet fire episode). In terms of the surface-based observations, the closest meteorological station where the event occurred was selected and station-based meteorological data on 28 April 2020 was provided by Turkish State Meteorological Service (TSMS). Urban or forest selection was made for the ground roughness. Atmospheric stability class is determined by the ALOHA program depending on other atmospheric conditions. In the scenarios created, it is assumed that the fire occurred in the polyethylene local natural gas distribution pipeline; the pipe is smooth and connected to the infinite tank source (in this case, ALOHA assumes that the pipe is completely broken, and that the diameter of the hole through which the gas is discharged is equal to the pipe diameter). Pipe pressure is assumed to be 4 bar (3.95 atm). For the pipe temperature, the soil temperature values measured at a depth of 100 cm were used.
The default thermal radiation concern levels of the ALOHA program were used to calculate the threat distances. These concern levels are defined as follows:
- Red threat zone: 10.0 kW/m2 (potentially fatal within 60 s)
- Orange threat zone: 5.0 kW/m2 (second degree burns within 60 s)
- Yellow threat zone: 2.0 kW/m2 (pain within 60 s)
The thermal radiation threat radiates simultaneously in all directions but extends slightly further downwind. The ALOHA program estimates three nearly circular thermal radiation threat zones for jet fire. However, the threat distances given numerically in the text summary are the greatest distances downwind.
3. Results and Discussion
3.1. Threat Distances Based on Source Release Factors
In order to determine the effect of source release factors (pipe length and diameter) on threat distances, the atmospheric conditions on the day and time of the reference event were taken into account in the modeling studies. All conditions for these studies are defined below:
- Date: 28 April 2020
- Time: 11:07 a.m. LT (Atmospheric conditions measured at 11:00 a.m. for 11:07 a.m. are used)
- Wind speed: 3.1 m/s
- Wind direction: 115°
- Cloud cover: Clear
- Air temperature: 17.6 °C
- Atmospheric stability class: C
- Inversion height: 1461 m
- Relative humidity: 57%
- Pipe temperature: 12.3 °C
The pipe diameter was determined as 125 mm in the modeling studies carried out to determine the variation of the threat distances with the pipe length (the length of the pipe from the point of damage to the closure point). The calculated results for pipe lengths between 25 m and 1000 m are shown in Figure 2. In the investigated range, it was determined that the threat distances decreased non-linearly with increasing pipe length. For larger values of pipe length, it was found that threat distances do not change depending on the pipe length.
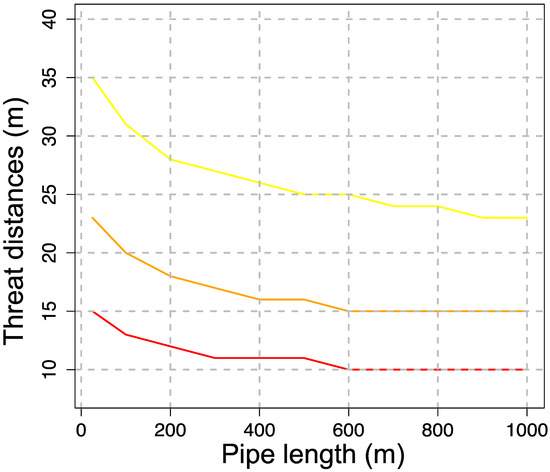
Figure 2.
Threat distances at different pipe lengths.
In the modeling studies carried out to determine the dependence of the threat distances on the pipe diameter, the pipe length was determined as 25 m. The calculated results for pipe diameters of 63 mm (6.3 cm), 110 mm (11 cm) and 125 mm (12.5 cm) are shown in Figure 3. It is shown that the calculated threat distances increase as the pipe diameter, that is, the hole diameter increases. This is a result of the increase in the combustion velocity, that is, in the amount of gas burned per unit time, with the increase in pipe diameter.
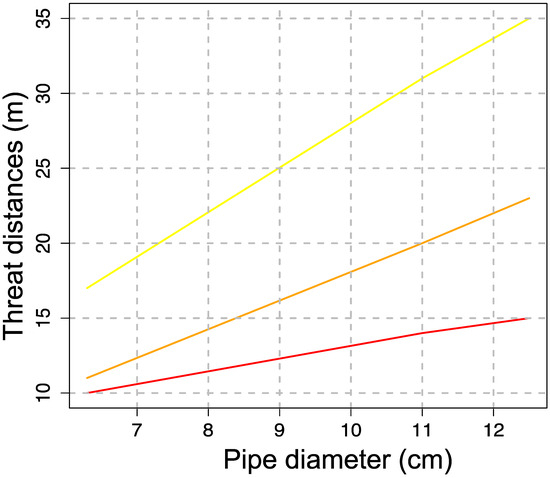
Figure 3.
Threat distances at different pipe diameter.
3.2. The Impact of Large- and Local-Scale Atmospheric Circulations on Threat Distances for the Selected Jet Fire Episode
As a first step, the role of synoptic conditions on threat distances were evaluated by using sea level pressure and 10 m wind properties. As shown in Figure 4, the region is under the influence of the high-pressure center, and low surface winds are dominant in the region. In general, these atmospheric conditions prevent the distribution of air pollutants and cause high pollutant concentration over the region for a long time. For more in-depth analysis, local meteorological conditions were entered into the ALOHA program.
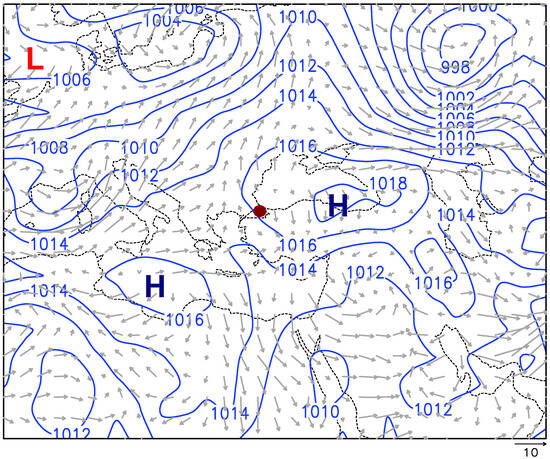
Figure 4.
Synoptic conditions of the jet fire episodic time (06:00 UTC on 28 April 2020). The straight lines indicate the sea level pressure values (in hPa) and gray arrows mark the wind direction and speed (m/s) at 10 m. Brown point is the location of the jet fire occurence. H and L symbols represent the high- and low-pressure centers, respectively.
Modeling studies were carried out for the date of 28 April 2020 in order to determine the dependence of the threat distances on hourly atmospheric conditions. For this purpose, meteorological parameters (i.e., wind speed and direction, air temperature, relative humidity and soil temperature) were provided by TSMS. Other meteorogical/environmental conditions were determined as below:
- Date: 28 April 2020
- Cloud cover: Clear
- Inversion height: 1461 m
- Pipe diameter: 125 mm (12.5 cm)
- Pipe length: 25 m
Although the ALOHA program had determined the stability class D for atmospheric conditions at 04:00, it was assumed that there was no inversion at this hour since it warned that night inversion could only exist for stability classes E and F. Threat distances were calculated based on hourly atmospheric conditions, as shown in Figure 5. From this figure, threat distances do not change significantly depending on the hourly atmospheric conditions, but there is only a 1 m difference in the threat distances for certain time intervals.
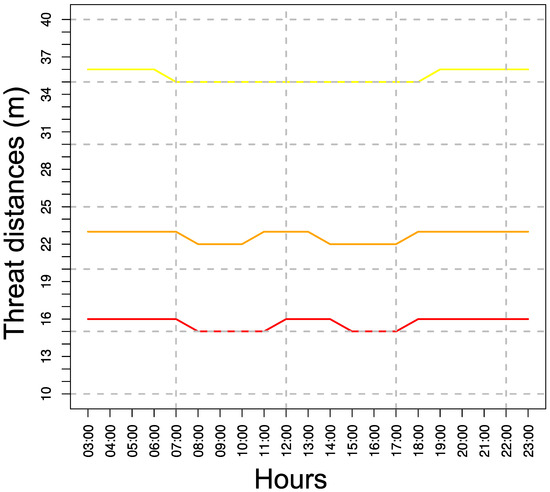
Figure 5.
Hourly distribution of threat distances depending on atmospheric conditions on 28 April 2020.
3.3. Threat Distances Based on Monthly Average Atmospheric Conditions
In the modeling studies carried out to determine the dependence of the threat distances on the monthly average atmospheric conditions, the 28th date of each month and 11:07 a.m. LT during 2020 year was selected. For the wind speed and direction, cloud cover, air temperature, relative humidity and soil temperature values, monthly mean values for the 1960–2020 period, which are obtained from the TSMS, were used. All other conditions are defined as below:
- Inversion height: 1000 m
- Pipe diameter: 125 mm (12.5 cm)
- Pipe length: 25 m
According to the results, threat distances do not change significantly depending on the monthly average atmospheric conditions (Figure 6). However, the results showed that threat distances are slightly longer during winter months and shorter in the summer months. The main reason for the difference in threat distance between winter and summer seasons can be explained as the presence of a large number of cyclones in the region during winter months and resulting strong winds enable transfering of pollutants from the source region to the other areas in a very short time. To be more understandable, the impacts of the meteorological parameters on threat distances were analyzed in the next section.
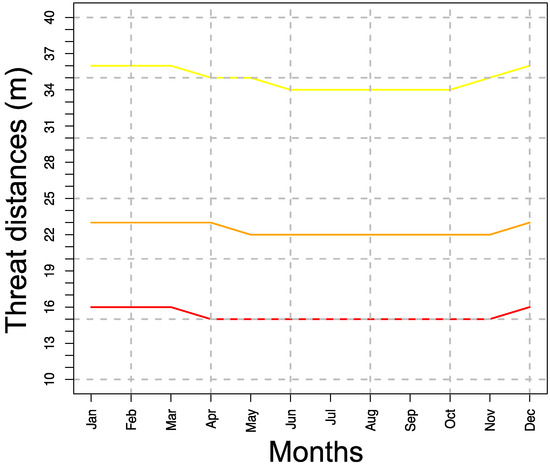
Figure 6.
Monthly mean distribution of threat distances depending on long-term meteorological parameters.
3.4. Sensitivity of Threat Distances to Changes in Meteorological Parameters
Modeling studies were also carried out to determine the dependence of threat distances on wind speed, cloud cover, air temperature and relative humidity. For these studies, 28 April 2020 as the date and 11:07 a.m. LT as the time have been determined. For atmospheric conditions, the April average values determined for the period 1960–2020. The inversion height was determined as 1000 m, similar to that of Baltaci et al. [38]. The conditions determined for modeling studies are defined as below:
- Date: 28 April 2020
- Time: 11:07 a.m. LT
- Wind speed: 2.4 m/s
- Wind direction: North-northeast (NNE)
- Cloud cover: 5 (Cloud cover can be defined as integers between 0 (clear) and 10 (complete cover) to the ALOHA program.)
- Air temperature: 11.8 °C
- Inversion height: 1000 m
- Relative humidity: 73%
- Pipe diameter: 125 mm (12.5 cm)
- Pipe length: 25 m
- Pipe temperature: 12.2 °C
In order to determine the variation of the threat distances depending on the wind speed, the April average values for all other atmospheric conditions were used. When modeling with the ALOHA program, a minimum value of 1 m/s should be used for the wind speed. From the TSMS records, the highest wind speed value in April was determined as 24.4 m/s. The results for threat distances in this range are shown in Figure 7. It is found that threat distances increase as the wind speed increases. The largest change was determined for the red threat distance, and the smallest change was determined for the yellow threat distance.
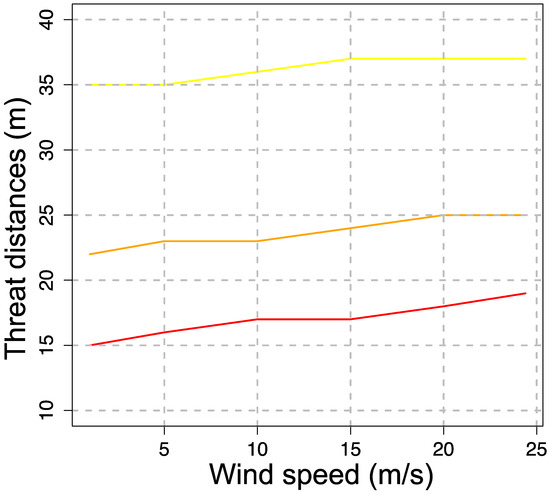
Figure 7.
Threat distances depending on the wind speed on 28 April 2020.
In addition, the threat zones calculated by the ALOHA program for wind speeds of 1 m/s and 24.4 m/s are shown in Figure 8. The results indicated that threat zones determined at 1 m/s wind speed are more symmetrical than the threat zones determined at 24.4 m/s wind speed. For a wind speed of 24.4 m/s, threat distances calculated downwind are longer than threat distances calculated upwind. This is likely due to the wind bending the jet flames more downwind, creating a greater thermal radiation threat in that direction. This also explains why the threat distances downwind increase as the wind speed increases.
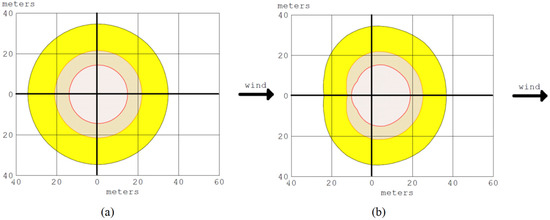
Figure 8.
Threat zones calculated by ALOHA program for (a) low (1 m/s) and (b) severe (24.4 m/s) wind speeds.
April mean values for other atmospheric conditions were used to determine the variation of threat distances depending on cloud cover. In the ALOHA program, cloud cover can be defined as integers from 0 to 10. Clear sky conditions are represented with 0, 5 and 10, numbers mark partly cloudy and whole covered, respectively. Threat distances calculated between 0 and 10 values for cloud cover. As shown in Figure 9, threat distances do not change significantly depending on the cloud cover, only the orange threat distance is 1 m shorter in cloudy weather than in clear sky conditions. One of the main reasons for this situation can be explained as the trapping of outgoing long wave radiation in the troposphere under cloudy state conditions. In order to determine the variation of the threat distances depending on the air temperature, the average values for April were used for all other atmospheric conditions.
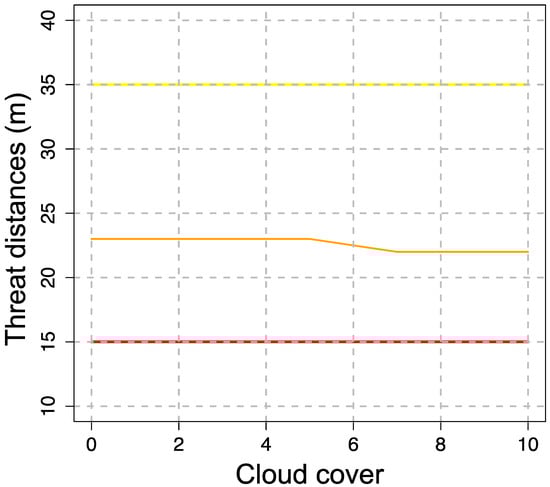
Figure 9.
The impact of cloud cover content on threat distances.
From the archieved records, the lowest and highest air temperature values change from −1.4 °C to 30.5 °C, respectively. Threat distances calculated for this range are shown in Figure 10. Threat distances decrease depending on the air temperature. However, for the entire range, it is observed that there is a change of 2 m in both yellow and orange threat distances and 1 m in the red threat distance.
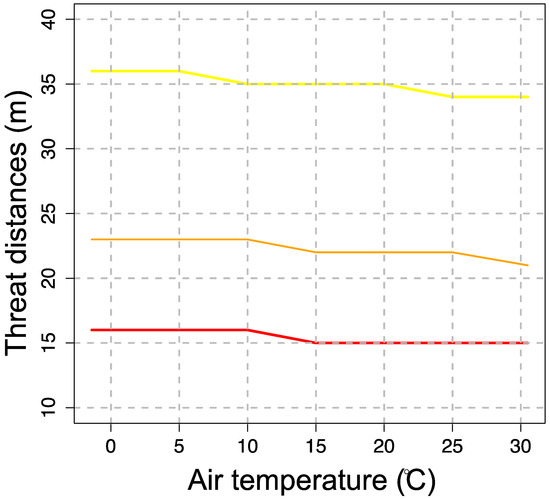
Figure 10.
The impact of air temperature (°C) on threat distances.
In order to determine the variation of the threat distances depending on the relative humidity (RH), average RH values for the month of April were used. RH values in the ALOHA program can be selected as dry (5%), medium (25% and 50%), and wet (75% and 99%). As shown in Figure 11, threat distances decrease depending on the increase in relative humidity. The biggest change was determined for the yellow threat distance.
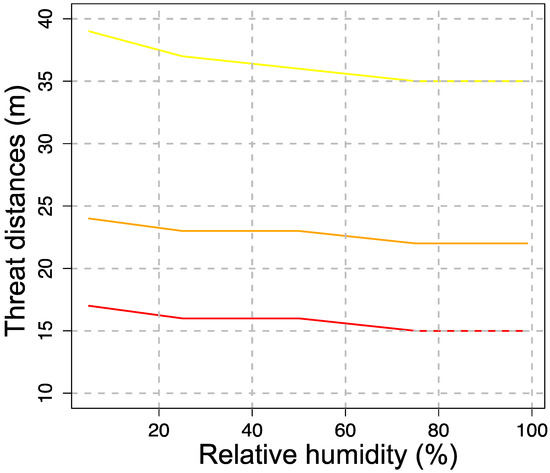
Figure 11.
The impact of relative humidity (%) on threat distances.
3.5. Threat Distances for Worst Case Scenario
A worst case scenario was created by taking into account the variation of the threat distances depending on the source release factors and atmospheric conditions. All conditions set for this scenario are defined as below:
- Date: 28 April 2020
- Time: 11:07 LT
- Wind speed: 30.9 m/s (The highest wind speed measured between 1960 and 2020)
- Wind direction: North–northeast (NNE)
- Cloud cover: 0 (Clear)
- Air temperature: −12.6 °C (The lowest temperature measured between 1960 and 2020)
- Atmospheric stability class: D
- Inversion height: 1000 m
- Relative humidity: 5%
- Pipe diameter: 125 mm (12.5 cm)
- Pipe length: 25 m
- Pipe temperature: 5.8 °C (The lowest soil temperature was measured at 100 cm depth between 1960 and 2020)
According to the main results, red, orange and yellow threat distances were found as 21 m, 28 m and 42 m, downwind, respectively. This indicates that the occurence of natural gas jet fire under strong northeasterly winds enable transport of poisonous gas to long distances in a very short time and will negatively affect social life and economy. In order to evaluate the risks associated with natural gas pipelines, the possible undesirable consequences that may arise from any pipeline leak or rupture. As examples from the previous studies [10,14,16,17], the consequences of possible accidents were determined using the ALOHA program. In addition, in the study conducted by Zhou et al. [14], land use modifications were suggested for the risk areas, which are determined around the pipeline. Similar to the previous research, land use recommendations, new routes for natural gas pipelines and associated safe distances between pipelines and crowded and sensitive buildings (e.g., schools, hospitals, stadiums and shopping malls) will be beneficial for the most populated city in Europe (Istanbul). Additionally, more experimental studies based on heat transfer, similar to that of Delouei et al. [39,40] should be done to minimize the possible risks.
4. Summary and Conclusions
Consequence analyses of accidents related to chemicals that cause hazards such as fire, explosion and toxic spread are studies that may be important in terms of activities such as risk assessment, planning, intervention and evacuation. The ALOHA program is widely used for this purpose. In this study, based on a natural gas distribution pipeline fire that occurred in Istanbul, Türkiye on 28 April 2020, current and worst accident scenarios were created by considering the source release factors and atmospheric conditions. Main salient results of the study as follow:
- Source release factors have a significant effect on the threat distances, the threat distances decrease non-linearly as the pipe length increases and the threat distances increase depending on the burning rate as the pipe diameter increases.
- Threat distances do not change significantly depending on the stable atmospheric conditions for wind speed and temperature; however, there is only a 1 m difference in the threat distances for certain time intervals. From the monthly averages, threat distances are slightly longer during winter months and shorter in the summer months.
- From the meteorological parameters; wind speed, air temperature and relative humidity are effective to identify threat distances in the specified intervals. It has been found that as the wind speed increases, the threat distances increase due to the bending of the jet flame more in the wind direction, and the threat distances decrease as the air temperature and relative humidity increase. From the results, cloud cover does not show significant impact on threat distances.
- From the worst scenario, red, orange and yellow threat distances were calculated as 21 m, 28 m and 42 m, respectively. These calculated values can be used a reference for the determination of safe distances, especially during emergency intervention and evacuation works related to jet fires occurring in natural gas distribution pipelines and also during infrastructure works.
Author Contributions
R.B.: Conceptualization, Methodology, Visualization, Writing; H.B.: Supervision, Methodology, Writing—Reviewing and Editing; B.O.A.: Supervision, Methodology, Reviewing and Editing. All authors have read and agreed to the published version of the manuscript.
Funding
The authors acknowledge Marmara University Scientific Research Projects Unit for financial support (Project Code: FDK-2021-10266).
Institutional Review Board Statement
Not applicable.
Informed Consent Statement
Not applicable.
Data Availability Statement
The data presented in this study are available on request from the corresponding author. The data are not publicly available due to private funding.
Conflicts of Interest
The authors declare no conflicts of interest.
References
- Şahingöz, D. Genel Doğal Gaz, 3rd ed.; Bulundu, H., Say, S.S., Eds.; UGETAM Yayınları: Ankara, Turkey, 2016; Available online: https://ugetam.istanbul/wp-content/uploads/2020/12/Genel-Dogalgaz.pdf (accessed on 10 May 2021).
- Vianello, C.; Maschio, G. Quantitative Risk Assesment of The Italian Gas Distribution Network. J. Loss Prev. Process Ind. 2014, 32, 5–17. [Google Scholar] [CrossRef]
- Azari, P.; Karimi, M. Quantitative Risk Mapping of Urban Gas Pipeline Networks Using GIS. Int. Arch. Photogramm. Remote Sens. Spat. Inf. Sci. 2017, XLII-4/W4, 319–324. [Google Scholar] [CrossRef]
- Heidari, P.A.; Ebrahemzadih, M.; Farahani, H.; Khoubi, J. Quantitative Risk Assessment in Iran’s Natural Gas Distribution Network. Open J. Saf. Sci. Technol. 2014, 4, 59–72. [Google Scholar] [CrossRef][Green Version]
- Uçar, S. Türkiye’de Kazı Kaynaklı Doğal Gaz Boru Hattı Hasarları, Etkin Müdahale Usulleri, Kazı Hasarlarının Önemli Ölçüde Azaltılması Için Öneriler ve İnovatif Sistem Örneği; Gazbir-Gazmer. Available online: https://www.gazmer.com.tr/upload/tr/dosya/dokumanyonetimi/31/KAZICI-DELICI-I%C5%9E-MAKINASI-KAYNAKLI-BORU-HATTI-HASARLARININ-AZALTILMASI-ICIN-INOVATIF-SISTEM-ORNEGI_08102021091623-2.pdf (accessed on 7 December 2020).
- Han, Z.Y.; Weng, W.G. Comparison Study on Qualitative and Quantitative Risk Assessment Methods for Urban Natural Gas Pipeline Network. J. Hazard. Mater. 2011, 189, 509–518. [Google Scholar] [CrossRef] [PubMed]
- Joe, Y.-D.; Ahn, B.J. Analysis of Hazard Area Associated with Pressure Natural-Gas Pipeline. J. Loss Prev. Process Ind. 2022, 15, 179–188. [Google Scholar] [CrossRef]
- Bubbico, R.; Di Cave, S.; Mazzarotta, B. Preliminary Risk Analysis for LNG Tankers Approaching a Maritime Terminal. J. Loss Prev. Process Ind. 2009, 22, 634–638. [Google Scholar] [CrossRef]
- Bernatik, A.; Senovsky, P.; Pitt, M. LNG as a Potential Alternative Fuel–Safety and Security of Storage Facilities. J. Loss Prev. Process Ind. 2011, 24, 19–24. [Google Scholar] [CrossRef]
- Kalatpoor, O.; Goshtaps, K.; Khavajı, S. Health, Safety and Environmental Risk of a Gas Pipeline in an Oil Exploring Area of Gachsaran. Ind. Health 2011, 49, 209–214. [Google Scholar] [CrossRef]
- Kent Muhlbauer, W. Pipeline Risk Management Manual Ideas, Techniques and Resources, 3rd ed.; Gulf Professional Publishing: Burlington, MA, USA, 2004. [Google Scholar]
- Shao, H.; Duan, G. Risk Quantitative Calculation and ALOHA Simulation on The Leakage Accident of Natural Gas Power Plant. Procedia Eng. 2012, 45, 352–359. [Google Scholar] [CrossRef]
- Zhu, H.; Mao, Z.; Wang, Q.; Sun, J. The Influences of Key Factors on The Consequences Following the Natural Gas Leakage from Pipeline. Procedia Eng. 2013, 62, 592–601. [Google Scholar] [CrossRef]
- Zhou, Y.; Hu, G.; Li, J.; Diao, C. Risk Assesment Along the Gas Pipelines and Its Application in Urban Planning. Land Use Policy 2014, 38, 233–238. [Google Scholar] [CrossRef]
- Bajcar, T.; Cimerman, F.; Širok, B. Towards More Detailed Determination of Third Party Impact on Risk on Natural Gas Pipelines: Influence of Population Density. Process Saf. Environ. Prot. 2015, 94, 509–516. [Google Scholar] [CrossRef]
- Hanafiah, N.M.; Zardasti, L.; Yahaya, N.; Noor, N.M.; Hassan, N.; Valipour, A. Comparision Study on Human Health and Safety Loss for Rural and Urban Areas in Monetary Value Subjected to Gas Pipeline Failure. J. Environ. Sci. Technol. 2015, 8, 300–309. [Google Scholar] [CrossRef][Green Version]
- Ebrahemzadih, M.; Haedari, P.A. Investigating the Likelihood of Catastrophic Events in Natural Gaz Pipelines Using an Integration of Fault Tree Analysis and What–If Methods. Sigurnost 2016, 58, 18–30. [Google Scholar] [CrossRef]
- Çetinyokuş, S. Sonuç Analizi ile Belirlenen Etki Mesafeleri Üzerine Atmosferik Seçimlerin Etkisi (ALOHA Yazılımı). Afyon Kocatepe Üniv. Mühendis. Bilim. Derg. 2017, 17, 209–217. [Google Scholar] [CrossRef]
- Tawfik, F.S.; Nassar, N.; Abdel Aziz, M.A.H. Environmental Impact of Conventional Power Plant in Normal and Accidental Conditions. Arab J. Nucl. Sci. Appl. 2018, 51, 68–81. [Google Scholar] [CrossRef]
- Khalid, N.A.; Tohir, M.Z.M.; Said, M.S.M. Consequence Simulation of Jet Fire Due to Leakage of Pipelines in a Natural Gas Power Plant in Malaysia. Perintis Ejournal 2019, 9, 15–29. [Google Scholar]
- Kotkava, B.; Hromada, M. Comparision of the Resulting Models of Dispersion of Hazardous Substances Created in the Software Aloha and TerEx. In Proceedings of the 20th International Multidisciplinary Scientific GeoConference SGEM 2020, Albena, Bulgaria, 16–25 August 2020. [Google Scholar] [CrossRef]
- Özay, M.E.; Köten, H.; Can, E. İstanbul Boğazı Geçişi Güvenlik Açığı: Olası Tanker Patlama Simülasyonu. Int. J. Pure Appl. Sci. 2021, 7, 509–516. [Google Scholar] [CrossRef]
- Vairo, T.; Pontiggia, M.; Fabiano, B. Critical Aspects of Natural Gas Pipelines Risk Assessments. A Case-study Application on Buried Layout. Process Saf. Environ. Prot. 2021, 149, 258–268. [Google Scholar] [CrossRef]
- Habertürk. Beylikdüzü’nde Doğalgaz Borusunda Patlama: 2 Yaralı. Available online: https://www.haberturk.com/son-dakika-haberler-beylikduzu-nde-dogalgaz-borusunda-patlama-2-yarali-2661329 (accessed on 14 December 2021).
- Republic of Türkiye Governership of Istanbul, Doğal Gaz Boru Hattında Patlama Olayı Basın Açıklaması. Available online: http://www.istanbul.gov.tr/dogalgaz-boru-hattinda-patlama-olayi-ile-ilgili-basin-aciklamasi (accessed on 14 December 2021).
- NOAA. ALOHA (Areal Location of Hazardous Atmospheres) 5.4.4. Technical Documentation. 2013. Available online: https://response.restoration.noaa.gov/sites/default/files/ALOHA_Tech_Doc.pdf (accessed on 9 May 2021).
- NOAA. ALOHA. 2020. Available online: https://response.restoration.noaa.gov/sites/default/files/aloha.pdf (accessed on 17 December 2021).
- Shah Md, T.R.; Tausif, S.; Sultana, R.S. Facility layout optimization of on ammonia plant based on risk and economic analysis. Proc. Eng. 2013, 90, 760–765. [Google Scholar]
- Bahareh, I.; Berrin, T. Explosion impacts during transport of hazardous Cargo: GIS-based characterization of overpressure impacts and delinaation of flammable zones for ammonia. J. Environ. Manag. 2015, 156, 1–9. [Google Scholar]
- Howari, F.M. Evaporation losses and dispersion of volatile organic compounds from tank farms. Environ. Monit. Assess. 2015, 187, 273. [Google Scholar] [CrossRef] [PubMed]
- Praveen, P.; Nagendra, S. Hazard evaluation using ALOHA tools in storage area of an oil refinery. Int. J. Renew. Energy Technol. 2015, 4, 203–209. [Google Scholar]
- Lucyna, B. Computer simulation of impacts of a chlorine tanker truck accident. Transp. Res. Part D Transp. Environ. 2016, 43, 107–122. [Google Scholar]
- Nilambar, B.; Indra, M.M.; Vimal, C.S. Fire and explosion hazard analysis during surface transport of liquid petroleum gas (LPG): A case study of LPG truck tanker accident in Kannur, Kerala, India. J. Loss Prev. Process Ind. 2016, 40, 449–460. [Google Scholar]
- Anjana, N.S.; Amarnath, A.; Harindranathan Nair, M.V. Toxic hazards of ammonia release and population vulnerability assessment using geographical information system. J. Environ. Manag. 2018, 210, 201–209. [Google Scholar] [CrossRef]
- Jones, R.; Lehr, W.; Simecek-Beatty, D.; Reynolds, M. ALOHA® (Areal Locations of Hazardous Atmospheres) 5.4. 4: Technical Documentation. 2013. Available online: https://repository.library.noaa.gov/view/noaa/2669 (accessed on 1 January 2024).
- Flocas, H.; Kelessis, A.; Helmis, C.; Petrakakis, M.; Zoumakis, M.; Pappas, K. Synoptic and local scale atmospheric circulation associated with air pollution episodes in an urban Mediterrenean area. Theor. Appl. Climatol. 2009, 95, 265–277. [Google Scholar] [CrossRef]
- Zhang, J.P.; Zhu, T.; Zhang, Q.H.; Li, C.C.; Shu, H.L.; Ying, Y.; Dai, Z.P.; Wang, X.; Liu, X.Y.; Liang, A.M. The impact of circulation patterns on regional transport pathways and air quality over Beijing and its surroundings. Atmos. Chem. Phys. 2012, 12, 5031–5053. [Google Scholar] [CrossRef]
- Baltaci, H.; Alemdar, C.S.O.; Akkoyunlu, B.O. Background atmospheric conditions of high PM10 concentrations in Istanbul, Turkey. Atmos. Pollut. Res. 2020, 11, 1524–1534. [Google Scholar] [CrossRef]
- Delouei, A.A.; Karimnejad, S.; Gharajeh, A.; Sajjadi, H.; Atashafrooz, M.; Xie, G.; Arabkoohsar, A. Bath heaters using alternative heat transfer medium: A thermo-economic analysis. J. Braz. Soc. Mech. Sci. Eng. 2023, 45, 73. [Google Scholar] [CrossRef]
- Delouei, A.A.; Naeimi, H.; Sajjadi, H.; Atashafrooz, M.; Imanparast, M.; Chamkha, A.J. An active approach to heat transfer enhancement in indirect heaters of city gase stations: An experimental modeling. Appl. Therm. Eng. 2024, 237, 121795. [Google Scholar] [CrossRef]


Disclaimer/Publisher’s Note: The statements, opinions and data contained in all publications are solely those of the individual author(s) and contributor(s) and not of MDPI and/or the editor(s). MDPI and/or the editor(s) disclaim responsibility for any injury to people or property resulting from any ideas, methods, instructions or products referred to in the content. |
© 2024 by the authors. Licensee MDPI, Basel, Switzerland. This article is an open access article distributed under the terms and conditions of the Creative Commons Attribution (CC BY) license (https://creativecommons.org/licenses/by/4.0/).