Article

Improvement in the Adaptation and Resilience of the Green Areas of Yerevan City to Climate–Ecological Challenges

1
Institute of Botany, National Academy of Sciences of the Republic of Armenia, Avan, Atcharjan St. 1, Yerevan 0063, Armenia
2
Katedra Ochrony Roslin, Warsaw University of life Sciences, Nowoursynowska 159, 02-776 Warsaw, Poland
3
Faculty of Forest Sciences, Swedish University of Agricultural Sciences (SLU), P.O. Box 43, S-739 21 Skinnskatteberg, Sweden
4
Faculty of Geography, Ivan Franko National University of Lviv (IFNL), Doroshenko Str. 41, 79000 Lviv, Ukraine
5
Faculty of Geography and Geology, Yerevan State University (YSU), Alex Manukyan 1, Yerevan 0025, Armenia
6
Department of Nature Protection, Municipality of Yerevan, Argishti Str. 1, Yerevan 0015, Armenia
*
Author to whom correspondence should be addressed.
Atmosphere 2024, 15(4), 473; https://doi.org/10.3390/atmos15040473
Submission received: 3 March 2024 / Revised: 1 April 2024 / Accepted: 3 April 2024 / Published: 11 April 2024

Abstract

:
The services provided by green infrastructures may lead to a decrease in climate-related ecological, social, and health risks, especially in the urban environment. Consequently, the best guarantee to make this environment as safe as possible is to increase the extent of green areas, taking into consideration the functional importance, and climatic–ecological peculiarities of the area. These are also issues for the Republic of Armenia’s (RA) capital Yerevan. There the current conditions of the green areas of Yerevan city do not meet the expected requirements of the climatic–ecological development of urban areas. The green area per capita is 8 m2, which is unevenly distributed within 12 different administrative districts of Yerevan city. The aim of this research was to study the natural climatic and ecological conditions of Yerevan city and the status of the green areas of the city. The eco-biological indicators of the trees and shrubs growing in Yerevan green areas have been assessed, and the more resilient plant species have been singled out. All 12 administrative districts of Yerevan have been mapped and the green area per capita for each administrative district has been calculated. The received data have been combined with health indicators and suggestions have been made to add green areas in Yerevan according to the functional significance and sustainability of shrubby species and to their decorative and phyto-filtration properties. The city has unfavorable climatic conditions. It is located in the northern section of the subtropical climatic zone and has a distinct dry continental climate. Temperatures above +40 °C are typical, while winter is rather cold and sometimes temperatures may drop below −20 °C (in January 2008, it dropped to −27.6 °C). The amount of atmospheric precipitation has reduced by 9%. The city is counted as one of the driest urban areas of the South Caucasus. The other unfavorable ecological conditions are heavy traffic, the city’s open landfill, the concentration of industrial enterprises, large-scale construction works, etc. The atmospheric concentrations of particulate matter (PM), gases and heavy metals have been detected to exceed the permitted limits. In terms of health care, the death cases due to various diseases (acute respiratory, vascular, and cancer) have increased, which requires complex activities to reduce environmental pollution and to improve the microclimate.

1. Introduction

Cities cover less than 1% of the planet’s surface and serve as crucial homes for 54% of the global population and 70–90% of economic activity. Urban land cover is predicted to be increased by 1.2 million square kilometers by 2030, nearly tripling global urban land area for the 2000 and 2030 period [1,2]. Urbanization expansion can lead to significant health risks, disrupting the normal functioning of the human organism and the organism’s biorhythms and can add to the psychological and emotional load as well as adding to the number of stressful situations [3,4,5,6,7,8].
Urban areas’ poor air quality is a serious threat to human health, causing problems for the respiratory system and cardiovascular diseases worldwide. Every year 3.7 million people die because of air pollution, e.g., due to an increased quantity of ultrafine particles deposition, as well as air pollution exposure and cardiovascular disease [9,10]. Environmental quality and landscape diversity are important assets for public health and physical activity [9,10,11,12]. The degradation of green areas has also created pressure on air quality. Missing or unsatisfactory vegetation cover has led to increased levels of soil erosion and hence dust concentrations as the city lacks natural obstacles and green barriers within as well as outside of it [13,14,15,16,17]. Thanks to the biofiltration property of plants the pollutants that are present in the air, e.g., particulate matter (PM), carbon dioxide, volatile organic compounds, toluene, ethylbenzene, and oxyline, are reduced considerably by passing through the biological barrier [13,18,19,20].
According to Nowak, 1 acre (0.405 hectares) of tree cover in parks can accumulate over 40 tons of carbon and restore 1.2 tons of that carbon in a year [17]. During the day, the air quality improvement by the plants is 0.51% for solid particles, 0.45% for ozone, 0.44% for sulfur dioxide, 0.33% for nitrogen dioxide and 0.002% for carbon dioxide, respectively. However, in the garden area covered with trees the air quality improvement is 100% for ozone, 13% for sulfur dioxide, 13% for particulate matter (PM), 8% for nitrogen dioxide, and 0.05% for carbon dioxide [16,17,18,19]. The green infrastructure in the city also accumulates PM of diameter smaller than 10 µm (PM10) which are dangerous for the human organism [21,22,23,24].
It should also be noted that in large cities, outdoor air pollution [25], the influence of surrounding forest stands [26], climate change, and temperature are more pronounced [25,26,27,28,29,30]. Urban climate challenges also create unfavorable conditions for the human body during physical activity [29,30]. The urban heat island is caused by two main factors, one of which includes heat emissions connected to human activities (such as using cars and air conditioning). However, the enlarging of the city infrastructure with natural solutions [31] could alleviate the consequences of climate change and temperature increases [32] while improving the quality of human life at the same time [31,32,33].
Urban green spaces can promote mental and physical health and reduce morbidity and mortality in urban residents by providing psychological relaxation and stress alleviation, stimulating social cohesion, supporting physical activity, and reducing exposure to air pollutants, noise, and excessive heat. People are mentally, physically, and socially healthier when they live in greener environments. Green areas’ ability to remove carbon from the atmosphere and store it in vegetation contributes to climate change mitigation. Urban plantations capture air pollutants including PM, which are more dangerous for the human organism and cause various diseases [21,22,23,24,34,35,36,37].
Urban green spaces often are not presented as a single system; the spaces between the green areas are interrupted, which in turn becomes one of the priorities for the creation of ecological corridors․ This circumstance is also important from the point of view of biodiversity conservation. [33,38,39,40].
All of these problems are also typical for the large cities of Armenia: Yerevan, Gyumri, Vanadzor, Kapan, etc. The state of the green plantations in the cities of the RA, overall, does not meet the current requirements of the ecological development of the areas, which causes the creation of uncontrollable situations in the field of the urbanized green area use and reproduction.
Although Gyumri, Vanadzor, and Kapan cities have more favorable climates from the point of view of maintaining green spaces, they need to reshape and revise the types of green spaces to meet the actual climate–ecological challenges. In the 1950s, the green area in the city of Gyumri was 528.8 ha, but nowadays has decreased to 297.5 ha. Green areas in the city of Vanadzor in the 1980s amounted to 191.1 ha, and in 2020—136.2 ha. The green areas in those cities are very fragmented and do not provide a continuous healthy environment both for people and biodiversity. These cities lack the government-mandated requirement to maintain 40% green space in residential areas [41,42,43,44,45,46].

2. Materials and Methods
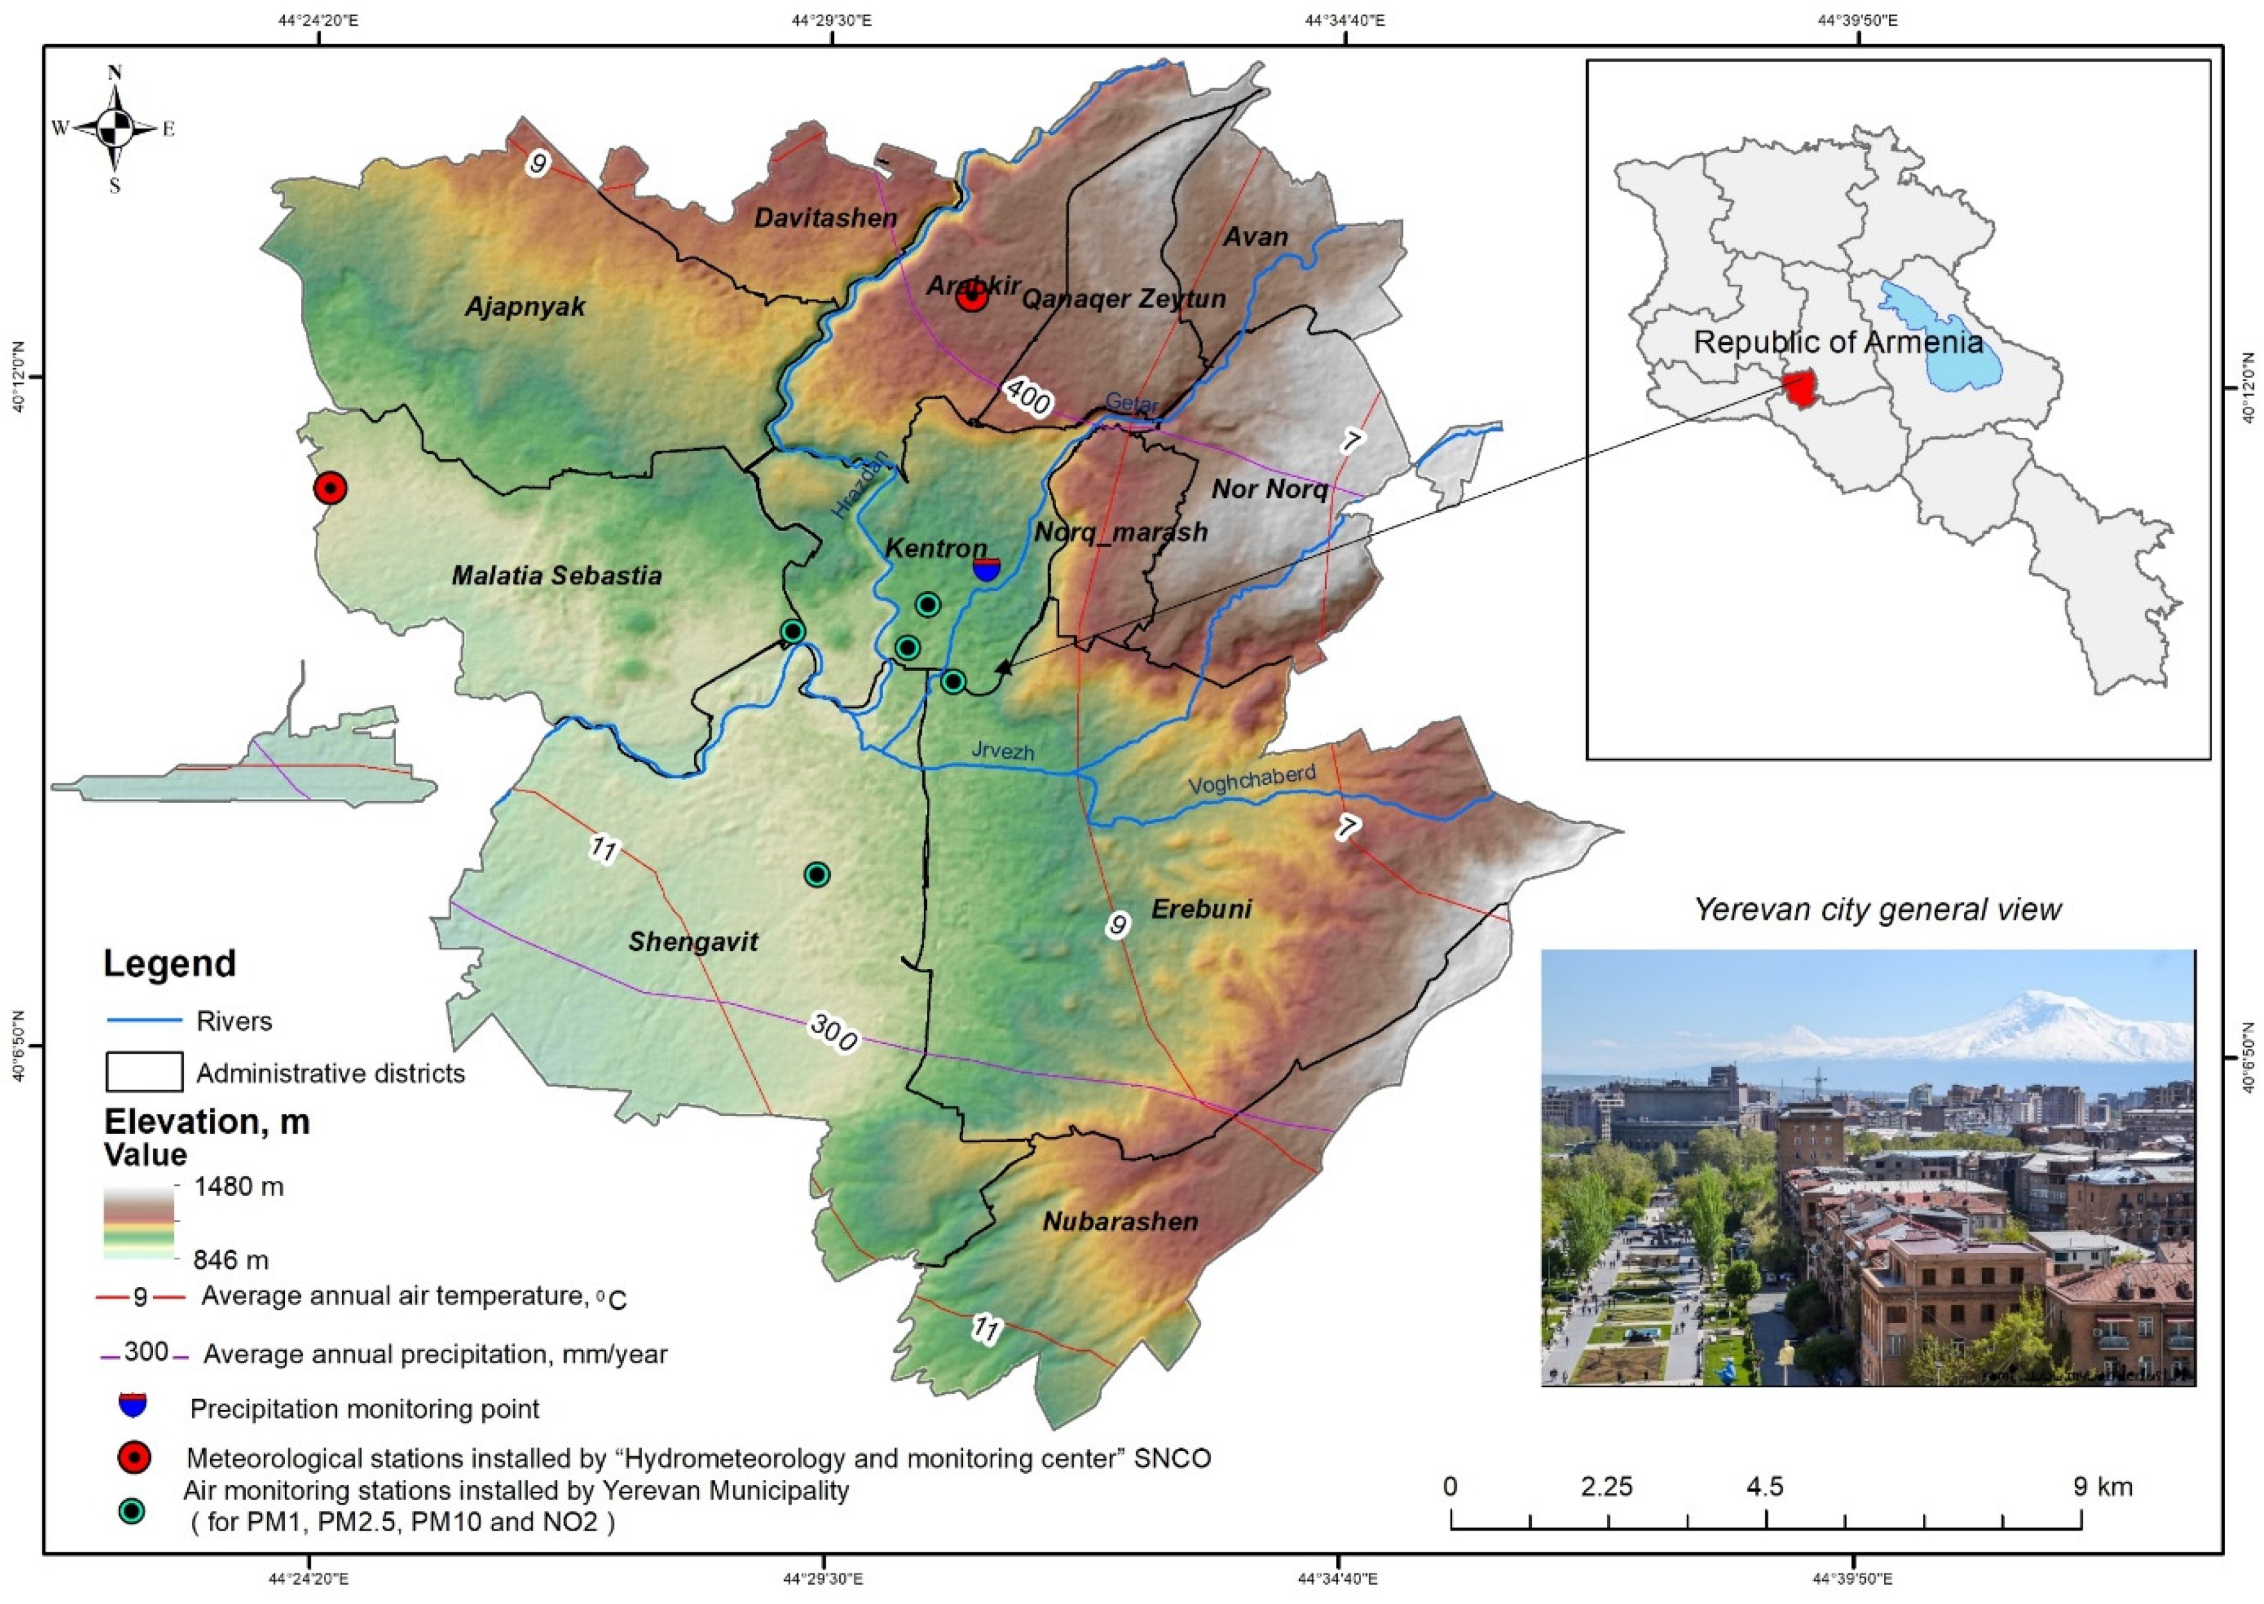
2.1. Study Area

The geographic coordinates of Yerevan are 40°10′51″ northern latitude and 44°30′48″ eastern longitude. It is in the northeastern part of the Ararat valley on both banks of the Hrazdan River, 900–1350 m above sea level. The straight-line distance of Yerevan from the Black Sea is 300 km, from the Caspian Sea is 456 km, and from the Mediterranean Sea is 800 km (Figure 1).
The natural landscape of Yerevan is semi-desert. The soil type is semi-desert gray, which has emerged in the conditions of dry and severe continental climate as well as semi-desert vegetation. The soil mainly has a clay–sand composition with a soil horizon of 15–20 cm and with a humus quantity of 1–1.5%, and carbonate content in the upper levels is 8–18%. Due to high levels of carbonates, semi-desert soil mainly has a solid, and sometimes rocky, structure [47,48].
Yerevan has a well-expressed vertical altitude zoning of landscapes from a desert and semi-desert to a dry-steppe zone. The city is one of the driest areas of the South Caucasus [49,50]. The climate is subtropical dry continental, with very hot summers and short but cold winters (summer temperature ranges from +22 to +26 °C; winter temperature ranges from −20 to −27 °C). The absolute minimum winter temperature was −27 °C, and the summer maximum has been as high as 41.2 °C. The annual mean temperature in Yerevan is 11–12 °C. In terms of climate change, the mean yearly temperature indicator has gone up by 1.23 °C nowadays. Long-term research has shown that in Yerevan the wettest weather is observed in May and the driest in August. The mean precipitation in Yerevan is 277 mm. The last twenty years have been warmer than the average, with the exception of 2012 [51] (https://weather-and-climate.com/ (accessed on 29 March 2024), https://www.holiday-weather.com/, https://www.weather-atlas.com) (accessed on 29 March 2024).
In recent decades, there has been an observable acute scarcity of water resources from one side and increase by 20% in the number of dangerous hydro-meteorological phenomena from the other side. These circumstances require a very efficient use of water resources and the selection of new plants adapted to the climate–ecological challenges. Yerevan and its neighborhood are also known for having scarce water resources. Water deficit is especially observed in the summer. In a year, up to 1000–1200 mm of water layer can evaporate, making the humidity index 0.25–0.30. Therefore, greening is impossible without artificial irrigation in Yerevan [51].
Yerevan is considered as the administrative and economic center of Armenia․ It is divided into 12 administrative districts (Figure 1). The area of the city composes 0.7% of the total area of the RA, and the Yerevan population counts for 36.6% of the total population of the country. A total of 41.2% of the country’s industrial capacity is centralized in the city [52].

2.2. Greening History and Current Challenges

The greening efforts in Yerevan commenced in the 1950s and 1960s alongside the establishment of industrial centers, leading to the creation of various green planting areas. Approximately 250 species of decorative trees and shrubs were utilized during this period, with 50 species planted in street areas and alleys. However, during the energetic crises and economic blockade of the Republic of Armenia (RA) in the 1990s, a significant number of trees and shrubs were felled for heating and cooking purposes, resulting in the depletion of urban greenery. As a consequence, there is an urgent need for the comprehensive reconstruction of urban green plantations, beginning with the removal of old, dried-up trees that have lost their aesthetic appeal, and replacing them with new specimens [41,53,54].
Officially, green areas in Yerevan cover approximately 6760 hectares (as of 2015), constituting 30% of the total city area. These green plantations serve various functional purposes, including public use areas such as parks, squares, community gardens, street trees, and grassy lawns, as well as limited use areas such as those surrounding administrative buildings, educational institutions, cultural and scientific centers, sports facilities, healthcare institutions, and industrial organizations. Additionally, there are green areas designated for special purposes such as highways, streets, water protection, windbreaks, soil erosion control, and botanical and zoo exhibitions [45].
To enhance environmental and soil protection, it is crucial for the city to implement the separation of street lawns using barrier shrubs. Alternative methods such as vertical and roof greening are particularly beneficial for the Center (Kentron) administrative district, where land surface availability is limited, yet temperature contrast is most pronounced. These strategies and solutions have been incorporated into the Yerevan municipality’s five-year development program, with each district and street receiving priority attention in selecting plant species based on their climate–ecological characteristics. The active implementation of these proposals has resulted in the planting of a significant number of barrier and flowering shrubs along the streets in recent years, with over 500,000 shrubs planted between 2020 and 2022 (see Table 1).
The scientific inventory and studies carried out by the dendrologists from the Botanical Institute named after A. Takhtajyan NAS RA have shown that, overall, the functional significance of the category of green plantations for the last decades was broken. There is a lack of harmony and compatibility of various compositional elements in them.

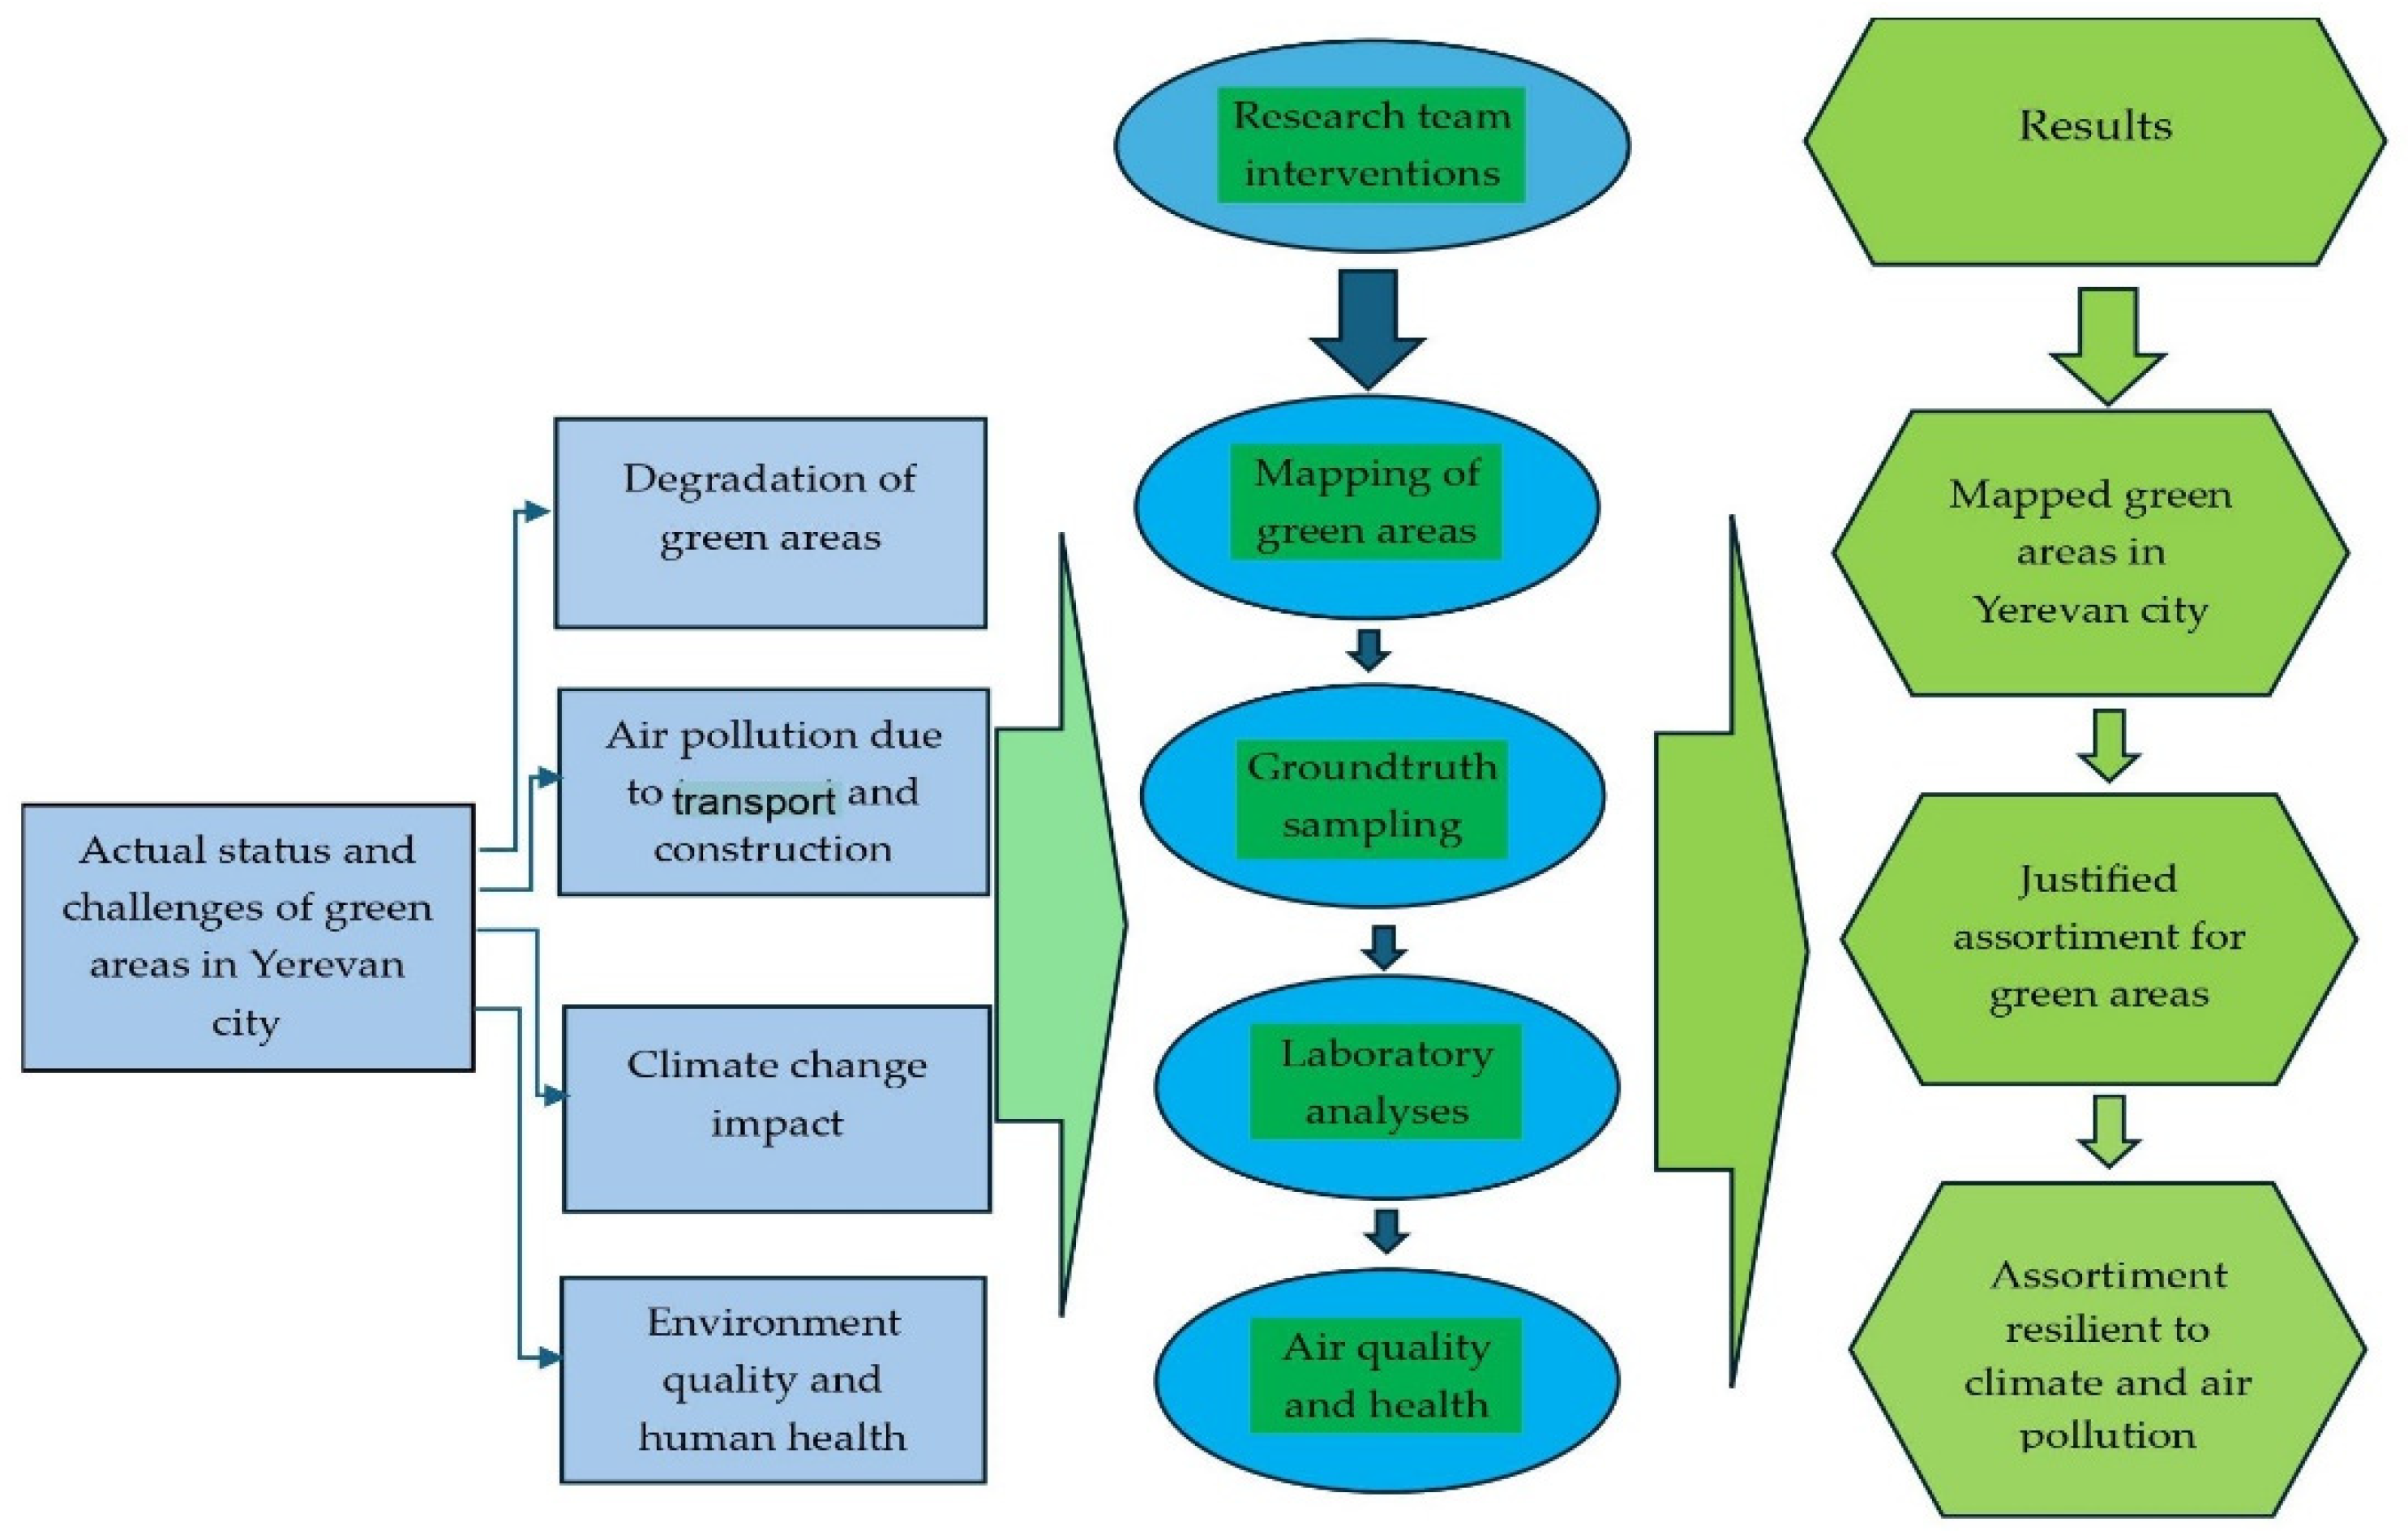
2.3. Materials and Methods

The study utilized various data sources and methodologies to assess the climatological and ecological conditions of Yerevan. These included climatological data from the Hydrometeorological and Monitoring Center of the Ministry of Environment of Armenia (meteomonitoring.am (accessed on 29 March 2024)), published ecological–climatic data of the city, open-source cartographic geodata, geodata provided by the Yerevan municipality, field route visit data, field sampling, and laboratory analysis.
The field route method was employed to evaluate the status of green areas, involving sample collections and observations of dendrological collections’ behavior in response to climate–ecological challenges and aesthetic qualities. The taxonomic identification of tree plants and bushes was conducted based on herbarium samples, and laboratory analysis was carried out using appropriate reference materials and determinants [55,56,57,58,59,60,61,62,63]. The study of tree plants and bushes in urban plantations was carried out in green plantations of each category (park, street plantation, etc.) at certain intervals, mainly in different stages of plant vegetation (leafing, flowering, and fruiting). Herbarium samples were taken and their taxonomic affiliation was determined in laboratory conditions using the appropriate reference materials and determinants [64,65].
Basic cartographic materials were developed using “Open Street Map” (OSM) and the SRTM digital elevation model (DEM). National geodata from the Yerevan municipality was used to represent administrative boundaries. GPS and electronic tachometers were used in fieldwork, and digital maps were developed using QGIS v3.
Demographic data were sourced from the Armenian Statistical Service (https://www.armstat.am (accessed on 29 March 2024)), while data on climate and atmospheric pollution were obtained from the Hydrometeorological and Monitoring Center (meteomonitoring.am (accessed on 29 March 2024)). The data on Yerevan population death rate by age group and sex for 2017–2019 were obtained from the Statistical Yearbook of Armenia and the National Institute of Health (http://www.nih.am/ (accessed on 29 March 2024)) [36,51,59,63,66,67,68,69,70,71,72]. Atmospheric air quality in Yerevan was monitored at five stationary atmospheric monitoring stations, measuring suspended solids, sulfur dioxide, nitrogen dioxide, PM, and ground-level ozone [52,69,70,71,72,73]. Laboratory analyses were conducted for sulfur dioxide, nitrogen dioxide, ground-level ozone, and PM using various methods and spectrometers. As for the laboratory analyses, sulfur dioxide (ISO 7934:1989), nitrogen dioxide (ISO 6768:1998), and ground-level ozone in the air were assessed using the passive (weekly) and active (daily) sampling methods of Gries, Thorin with spectrometers (UV/VIS) (Analytik jena Specord 205, Specord 210 plus, Specord 250 plus analytik jena, PerkinElmer Lambda 35 and Shimadzu uv1650pc-Spectrometers) [74,75,76]. M in the air was determined by the chromatographic method (ICP-MS, ELAN 9000, PerkinElmer, Shelton, Connecticut USA) consistent with ISO 17294-2 [76,77,78].
A flow-chart of activities was developed to facilitate the working process (Figure 2):

3. Results

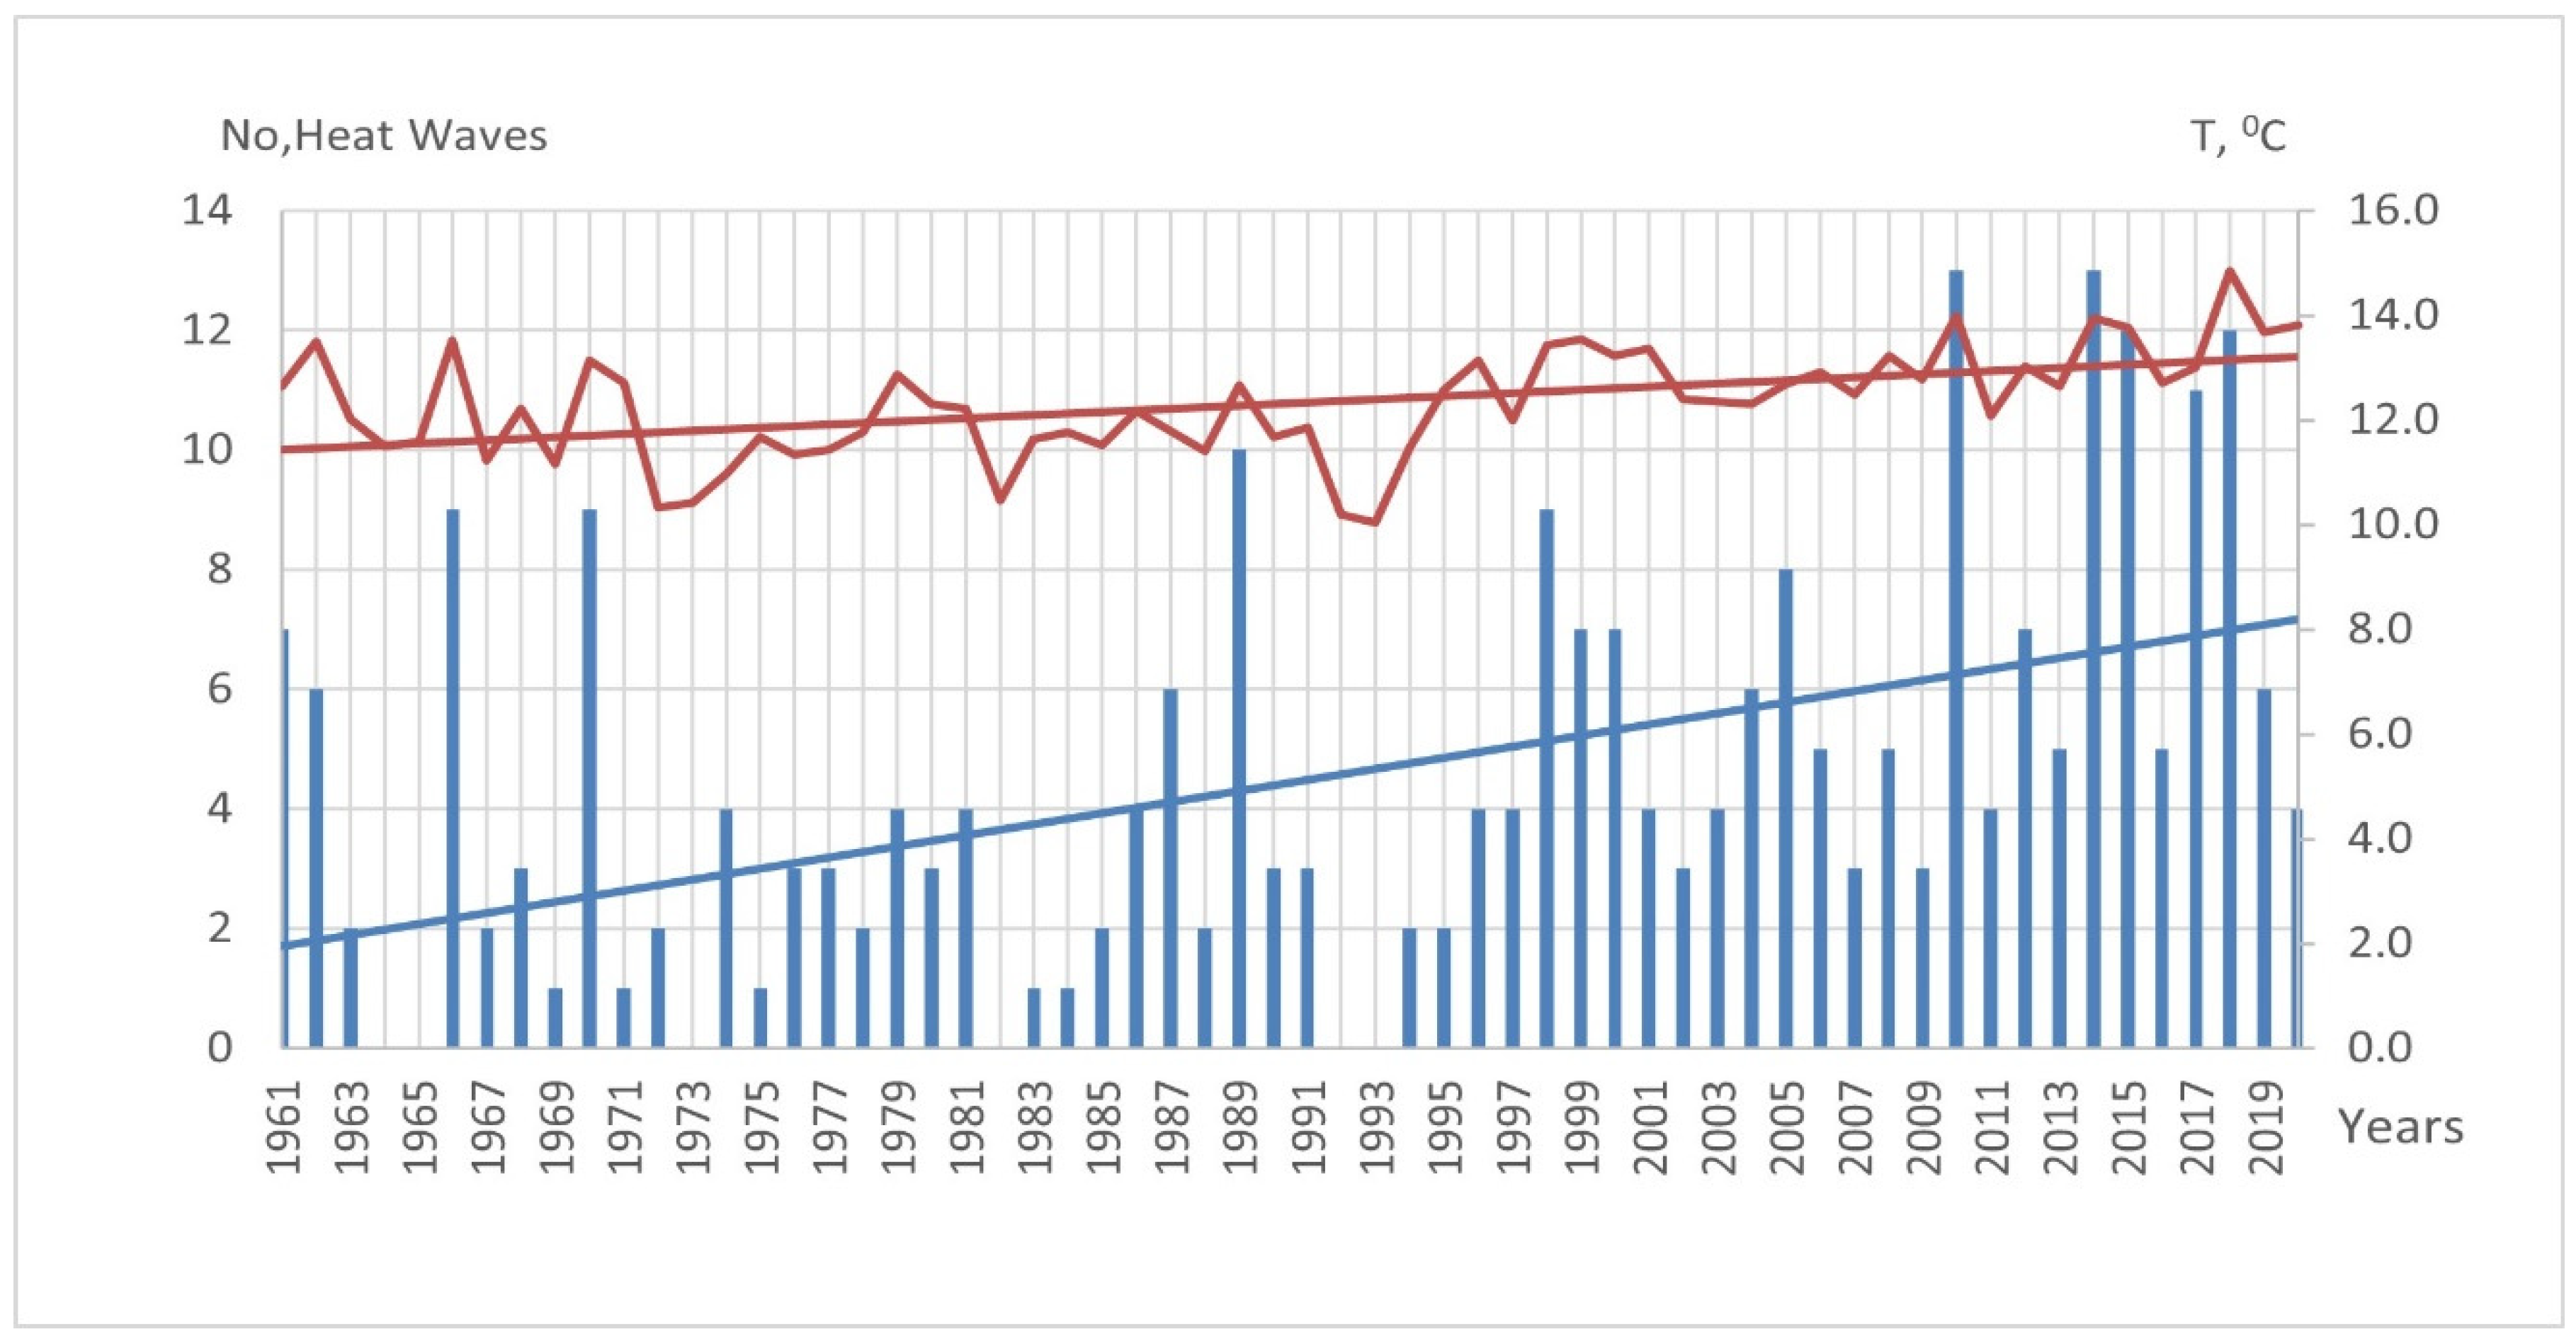
3.1. Climate Change as a Serious Challenge for the Greening Strategy

In the Fourth National Communication on Climate Change (2020) [67], climate change projections for Armenia until 2100 were made for the RCP 8.5 harsh scenario using the METRAS model. The model is based on the results of the ACCES, CNRM, MPIM and GFDL global circulation models. The METRAS regional model enables a dynamical downscaling of the results of these global models for the territory of Armenia, reducing the errors due to the rough model resolution, given the complex mountainous terrain conditions of Armenia. Using the high-resolution model, projections of average air temperature and atmospheric precipitation in Armenia were conducted based on different altitude zones, deriving from the pessimistic RCP8.5 scenario [67]. According to these calculations, the following changes in average annual temperature and precipitation are suggested for the cities that have projected changes in temperature and precipitation in Yerevan until 2100 (Table 2). According to the data of long-term observations, the average annual temperature (1961–1990) was 10.8 °C for the lower zone up to 1000 m altitude and 8.4 °C for the highlands of Yerevan. Meanwhile the projected temperatures for 2100, for the same corresponding zones, according to the RCP 8.5 scenario will be 15.5 and 20.2 °C. This is an evident trend and challenge for the city’s climate that requires immediate action with mitigation and adaptation measures.
The high-resolution METRAS (12 × 12 km) regional climate model was used in this case to reduce the uncertainties of the CCS M4 global climate model used in NC3 for climate change projections [68]. In the NC3 CCSM4 model, the IPCC-recommended RCP 8.5 and RCP 6.0 scenarios for CO2 emissions were used. The results from this model also indicate that the temperature will continue to increase in all seasons of the year. However, according to the RCP 8.5 scenario, starting from the mid-21st century (2041–2100) the temperature will rise at a more rapid rate. According to the RCP 8.5 scenario, it is very likely that, by 2100, the average annual temperature in Armenia will be 10.2 °C, which exceeds the baseline (1961–1990) by 4.7 °C [68]. These figures demonstrate the same tendencies for Yerevan city.
The provided data highlight that the temperature in Yerevan is projected to increase, both in terms of the annual average and individual seasons. However, the situation with precipitation is nuanced. While the average annual rainfall is expected to decrease overall, there will be a slight increase in autumn precipitation, although significant decreases are anticipated in other seasons. This variation should be taken into account when selecting tree varieties for urban greening projects in the studied cities.
Yerevan’s harsh, dry climate, characterized by dry air and low winter temperatures, negatively impacts the growth and development of tree plants, especially mesophilic species. Additionally, heatwaves are becoming more frequent and severe. Figure 3 illustrates the increasing number of heatwaves against the backdrop of rising yearly average temperatures in Yerevan from 1961 to 2020 (Figure 2). This trend underscores the urgency of adapting urban greening strategies to mitigate the effects of climate change on tree growth and urban environments.
Early spring and late autumn frosts pose additional challenges for vegetation growth in Yerevan. The climatic conditions are inherently limiting, necessitating irrigation to support plant growth. When designing green spaces in the city, it is crucial to prioritize not only aesthetics but also the ecological adaptation of tree and shrub species to Yerevan’s adverse climatic factors. Selecting tree and shrub species that are resilient to frost, drought, and other climatic stresses is essential for ensuring the sustainability and success of urban greening efforts. Species with high ecological adaptability to Yerevan’s conditions can thrive with minimal maintenance and intervention, contributing to the resilience and biodiversity of the urban ecosystem. Additionally, incorporating sustainable irrigation practices and water-efficient landscaping techniques can help mitigate the impacts of water scarcity and ensure the long-term health of green plantings in the city.

3.2. Air Pollution

Yerevan also faces the challenge of the pollution of various components of the environment and, as a result, a high level of diseases among the population. There are around 671 organizations and 23 exploited mines within the administrative boundary of city which have a negative impact on the atmosphere (https://www.yerevan.am/hy/nature-protection (accessed on 29 March 2024). As a result, the soils, plants, and atmosphere in Yerevan are mainly polluted by PM, heavy metals, gas, and organic pollutants. In the last few years, an overall increase in PM and nitrogen dioxide has been observed in the atmosphere, with the exception of 2020, due to the pandemic and the decrease in human activity (Table 3).
However, the overall trend underscores the urgent need for effective measures to mitigate pollution and safeguard public health in Yerevan.
The concentration of heavy metals in tree leaves often exceeds the maximum acceptable concentration (MAC), particularly for nickel (exceeding MAC by more than 5 times) and molybdenum (exceeding MAC by 1.8 times) [62,71,72,73,77]. Furthermore, heavy metal content, including molybdenum, copper, zinc, lead, and cadmium, has been detected in particulate matter (PM) on tree leaves [73] and in crops grown within the city’s administrative boundary, particularly in herbs [74,78].
The combination of elevated levels of PM, gases, and heavy metals in the environment poses significant health risks to residents of Yerevan [75,79]. Data on population health indicate a concerning increase in death rates attributed to various acute respiratory, vascular, and cancerous diseases, particularly tumors, genetic disorders, and cardiovascular diseases directly linked to poor air quality (Table 4) [69,70,71,72]. Notably, the prevalence of cardiovascular diseases is on the rise, indicating unfavorable urban conditions. This trend persisted in 2021, with circulatory system diseases accounting for over half (54.2%) of deaths, followed by cancer diseases (19.6%), respiratory diseases (9.7%), and digestive diseases (4.8%), among others [76,80].

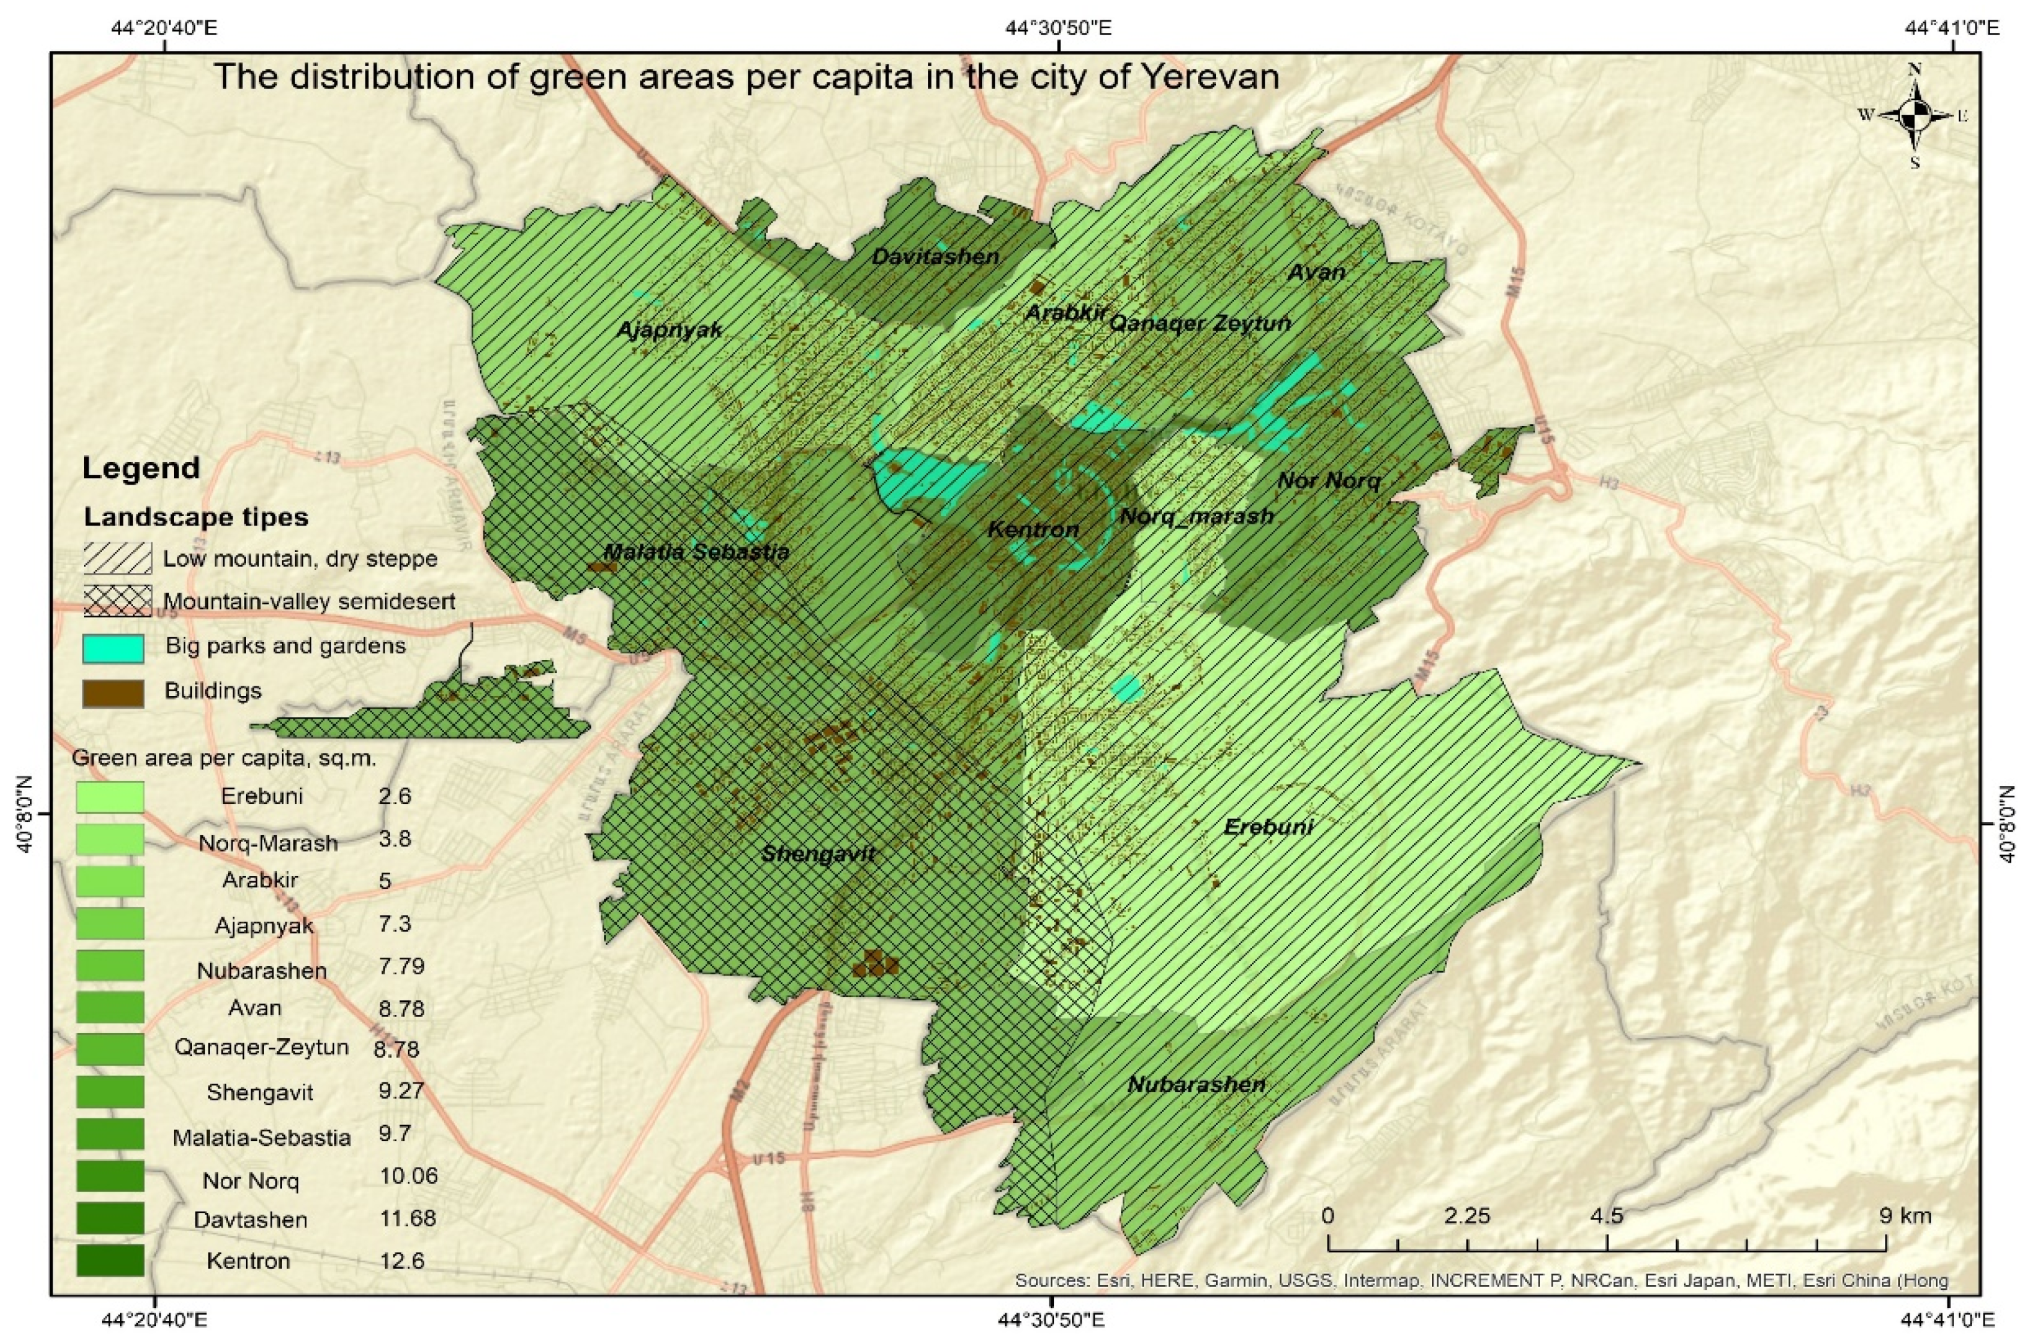
3.3. The Challenges for Green Area Distribution

The green area per capita in Yerevan is approximately 8 m2, a value that falls below standards observed in many comparable cities regionally and globally. Notably, Yerevan’s green spaces are not always interconnected, posing an additional challenge to maintaining biodiversity. Across the city’s 12 administrative districts, there are a total of 86 city parks, but the distribution of green areas within these districts is uneven [3,4].
Mapping results reveal that the southwestern part of Yerevan (Malatia-Sebastia administrative district) boasts the highest proportion of green area at 34%, followed by the northeastern part (Qanaqer-Zeytun) at around 23%. Conversely, the eastern part of the central area (Nork-Marash) has the least green area, accounting for 0%, largely due to the prevalence of detached houses (Table 5). Moreover, administrative districts such as Erebuni and Shengavit, which are industrial centers, have fewer green areas of general use, resulting in a smaller green area per capita ranging from 0.36 to 12.7 m2. This indicator is crucial for public health.
The administrative district of Kentron, despite having the greenest areas, also accommodates various enterprises, shops, offices, scientific centers, universities, and administrative buildings. However, the transport system in this district is overwhelmed, and the existing green spaces are insufficient to counteract the negative environmental impact. Official statistics indicate that Kentron, Shengavit, and Erebuni have the highest death rates, including among children under one year old (with 9–15 deaths annually) [77,81].
The mapping of the 12 administrative districts with their total areas, population, and green areas, which have been presented in Table 5 and Figure 3 and Figure 4 shows that indicators are totally different and unevenly distributed in terms of green area per capita (Figure 3).

3.4. Climate–Ecological and Dendrological Features of the Green Areas

In conducting a comprehensive climate–ecological assessment of the urban environment, particular emphasis is placed on evaluating the status of green plantations. Key indicators for assessment include the tolerance of tree species, species composition and age, and the impact of climate change and human-induced pressure on plants [78,79,80,82].
The biodiversity of green areas, behavior of dendrological collections, ecological adaptation and assessment of decorativeness (including climatic analogs, genus complexes, and evaluation of woody plants’ ecological adaptation and decorativeness) have been thoroughly studied (Table 6). An analysis of the taxonomic composition of dendro-flora in green plantations reveals that a significant proportion of the trees and shrubs used belong to two major families with ten or more genera: Rosaceae and Fabaceae. Additionally, several other families, including Oleaceae, Pinaceae, Caprifoliaceae, Moraceae and Fagaceae, contribute to the relatively rich taxonomic composition observed.
The uneven distribution of green areas in Yerevan poses significant health and environmental risks, underscoring the city’s low sanitary indicators. It is imperative to prioritize the restoration of green spaces to address these challenges promptly.
Research has identified approximately 100 species that have successfully adapted to the changing climate conditions in Yerevan. These species include Biota orientalis, Picea pungens “Glauca”, Juniperus virginiana, Thuja occidentalis, Ligustrum vulgare, Lonicera maackii, Lonicera tatarica and Buxus sempervirens, among others. However, around 20 species have shown low ecological adaptability, particularly dry subtropical and northern species such as Cedrus deodara, Chamaecyparis lawsoniana and Euonymus japonica.
Certain species, particularly those originating from relatively humid regions, have struggled to adapt to Yerevan’s semi-desert dry conditions, leading to their decline or extinction. Severe winter frosts, with temperatures dropping to −20–25 °C for extended periods in January, have further challenged heat-loving species. Additionally, inadequate irrigation exacerbates these conditions.
Am assessment of ornamental qualities, disease and pest tolerance, and grouping preferences of plants has been conducted. This data, combined with climatic conditions, has facilitated the identification of species based on drought tolerance and moisture requirements (Table 6). This holistic approach is essential for selecting suitable plant species for greening efforts in Yerevan, ensuring their resilience and aesthetic contribution to the urban landscape.
According to Table 6, the dominant tree species found in the streets of Yerevan include Ulmus parvifolia, Platanus acerifolia, Platanus orientalis, Fraxinus excelsior, Fraxinus pennsylvanica Marshall, Acer negundo and Quercus robur. However, in parks, the diversity of tree species is greater, with a wider variety of ornamental, broadleaf and evergreen types present.
The plant species in the city of Yerevan consist predominantly of broadleaf and evergreen tree species and shrubs, accounting for approximately 3% of the total. Among these species, there are ecologically sustainable, decorative, and valuable trees and shrubs, emphasizing the importance of their proper care and maintenance to improve the ecological and climatic conditions of the city.
Considering the challenges posed by global climate change and climate–ecological factors, it is crucial to reassess the current selection and use of plant species in Yerevan. There is a need to prioritize species that require less water and are better adapted to arid conditions. Examples of such species include Cotinus, certain sub-species of Sorbus, Elaeagnus, Tamarix, and shrubs like Sambucus. By incorporating more drought-tolerant species into urban greening initiatives, Yerevan can enhance its resilience to climate change and promote sustainable environmental management.
Thus, based on current and previous long-term research and phenological observation of the green areas of the Yerevan city it was possible to come up with an assortment of tree and shrub species recommended for sites of Yerevan with different pollution levels, (Table 7) [72,74,77,79].
It is recommended to select plant species for greening initiatives in Yerevan based on their resilience to climatic change conditions and the degree of pollution in the area. In street areas, priority should be given to more resistant shrubs and trees, while minimizing the use of evergreens. Evergreen species may struggle to thrive in areas with high pollution levels as they are unable to efficiently rid themselves of harmful substances, leading to eventual deterioration.
Conversely, in parks and groves, it is advisable to plant more ornamental and evergreen species. Increasing the proportion of evergreens in these areas can serve important sanitary and hygienic functions by contributing to the maintenance of public health. However, careful consideration should be given to selecting species that are well-suited to local environmental conditions and can thrive despite potential pollution challenges. By strategically choosing plant species based on their adaptability and environmental benefits, Yerevan can enhance the resilience and sustainability of its urban green spaces.

4. Discussions

The extensive scientific study of trees and shrubs has identified species that are more resilient to the climatic and ecological conditions of Yerevan, particularly in terms of their tolerance to atmospheric pollutants and heavy metals. For example, species such as Fraxinus and Quercus demonstrate high levels of sustainability to various pollutants, including particulate matter (PM) and gases. Other species, like Ulmus parvifolia, Platanus orientalis, Platanus acerifolia Willd, and Robinia pseudoacacia, possess characteristics that enable them to accumulate PM and withstand environmental pollution effectively. The Robinia pseudoacacia is very common in the southern industrial part of the city, which is very resilient to high environmental pollution. This tree species can gain resilience against the high content of toxicants by actively synthesizing protein nitrogen, which is one of the displays of sustainability against toxicants by the plant and can serve as a vivid example of the toxic content prediction [62,63,76,80].
Also in the prospective assortment of trees, it is advisable to choose trees that can withstand the heat of summer (July–August) and low relative humidity (Cotinus coggygria, Fraxinus excelsior, Fraxinus pennsylvanica, Juniperus virginiana), with a deep root system, strong natural wood (Platanus acerifolia and Platanus orientalis), and dense foliage (Aesculus hippocastanum, Sophora japonica, and Koelreuteria paniculata), trees that can withstand and mitigate the effects of heavy rainfall and reduce the impact of strong winds on the population.
These findings underscore the importance of expanding green areas in Yerevan using plant species adapted to dry conditions. Recommended plant species are ecologically tolerant, native, and possess phyto-filtration properties, making them suitable for improving the urban environment. By adding green areas of functional importance, such as separating pavements from streets with barrier plants, implementing green roofs and facades, creating green corridors, and enhancing blue-green infrastructures like lakes, river green paths, and recreation areas, Yerevan can mitigate environmental pollution and enhance overall urban livability.
Incorporating sustainable, decorative, phyto-filtration, and drought-tolerant tree and shrub species into urban greening efforts is essential for promoting biodiversity, improving air quality, and enhancing the overall well-being of Yerevan’s residents.

5. Conclusions

In summary, the assessment of climatic and eco-biological indicators of trees and shrubs in Yerevan’s green areas has led to the identification of more tolerant plant species. These species are resilient to climate change and air pollution, thereby providing a healthier environment for outdoor recreation and physical activity. The mapping of all 12 administrative districts of Yerevan has enabled the calculation of green area per person for each district, which has been combined with health indicators to suggest extending green areas in accordance with the functional significance and climate–ecological sustainability of plant species, including decorative and phyto-filtration properties.
Several key conclusions can be drawn:
  • Due to Yerevan’s dry continental climate, low precipitation and limited water resources, greening efforts require artificial irrigation and the selection of drought-resistant plants, especially considering the increasing yearly average temperatures and frequency of heatwaves.
  • The city faces extremely unfavorable climate–ecological conditions, characterized by a significant industrial concentration, mining activities, continuous construction and heavy traffic, resulting in pollution exceeding acceptable limits, including heavy metals and gas pollutants.
  • Poor ecological conditions correlate with poor health indicators, with carcinogenic and cardiovascular diseases being particularly prevalent, and with risks likely to persist as urban development continues unabated.
  • Yerevan’s dense population and uneven distribution of green areas highlight the need for increased and balanced green space development to meet World Health Organization (WHO) standards.
  • The city’s green areas predominantly feature broadleaf and evergreen tree species and shrubs, including ecologically sustainable and decorative varieties requiring adequate care. A reconsideration of plant types is necessary to include more sustainable, decorative species adapted to arid conditions, aligning with the goals of the Paris Agreement.
Addressing these conclusions will be essential for promoting environmental sustainability, enhancing public health, and improving the overall livability of Yerevan.

Author Contributions

Conceptualization, Z.V., G.N., A.P. and M.E.; Methodology, data collection and analysis: M.G., H.S., N.M. and S.K.; Maps: G.A.; Writing—original draft preparation: G.N., H.S. and N.M.; Writing—review and editing—Z.V., A.P. and M.E.; Supervision, Z.V.; Project administration: N.M. All authors have read and agreed to the published version of the manuscript.

Funding

This research work was supported by the Science Committee of RA, in the frames of the research project № 21T-1F140 (The exobiological aspects of optimization and pyrotechnical measures of urban plantations in RA).

Institutional Review Board Statement

Not applicable.

Informed Consent Statement

Not applicable.

Data Availability Statement

Publicly available datasets were analyzed in this study. This data can be found here: National Statistical Service of Republic of Armenia, http://armstat.am/en/ (accessed on: 29 March 2024), National Institute of Health (Ministry of Health of Republic of Armenia)-2017-2019, https://www.nih.am (accessed on: 29 March 2024), https://nih.am/assets/pdf/atvk/7757ef19033d47f82bcdf271b94ef4e2.pdf (accessed on: 29 March 2024). Bulletin of Atmospheric Air Pollution inthe Territory of the Republic of Armenia in2020. http://armmonitoring.am/public/admin/ckfinder/userfiles/files/ampopag/Odi Obzor 2020.pdf (accessed on: 29 March 2024); Armenian 4thNational Communication on Climate Change 2020, http://env.am/storage/files/fnc-eng.pdf (accessed on: 29 March 2024), Armenian 3rdNational Communication on Climate Change 2015, http://env.am/storage/files/1armenias-tnc-2015-eng.pdf (accessed on: 29 March 2024).

Acknowledgments

We thank the editors and anonymous reviewers for their helpful comments.

Conflicts of Interest

The authors declare no conflicts of interest.

References

  1. Bowen, K.J.; Parry, M.A. The Evidence Base for Linkages between Green Infrastructure, Public Health and Economic Benefit; Bowen, K.J., Parry, M., Eds.; Government of Victoria: Melbourne, VIC, Australia, 2015. Available online: https://vises.org.au (accessed on 29 March 2024).
  2. Emilsson, T.; Ode Sang, Å. Impacts of Climate Change on Urban Areas and Nature-Based Solutions for Adaptation. In Nature-Based Solutions to Climate Change Adaptation in Urban Areas: Linkages between Science, Policy and Practice; Impacts of Climate Change on Urban Areas and Nature-Based Solutions for Adaptation; Kabisch, N., Korn, H., Stadler, J., Bonn, A., Eds.; Springer International Publishing: New York, NY, USA, 2017; pp. 15–27. [Google Scholar]
  3. Aram, F.M.; García, E.H.; Solgi, E.; Mansournia, S. Urban green space cooling effect in cities. Heliyon 2019, 5, e01339. [Google Scholar] [CrossRef] [PubMed]
  4. Van den Berg, M.; Wendel-Vos, W.; van Poppel, M.; Kemper, H.; van Mechelen, W.; Maas, J. Health benefits of green spaces in the living environment: A systematic review of epidemiological studies. Urban For. Urban Green. 2015, 14, 806–816. [Google Scholar] [CrossRef]
  5. Arvanitidis, P.A.; Papagiannitsis, G. Urban open spaces as a common: The credibility thesis and common property in a self-governed park of Athens, Greece. Cities 2020, 97, 102480. [Google Scholar] [CrossRef]
  6. Faraniza, Z. Application of urban ecological concepts towards healthy and humane cities. In Journal of Physics: Conference Series, Volume 1940, The 4th International Conference on Mathematics, Science, Education and Technology (ICOMSET) in Conjunction with the 2nd International Conference on Biology, Science and Education (ICoBioSE) 2020 23–24 July 2020, Padang, Indonesia; IOP Publishing Ltd.: Bristol, UK, 2021. [Google Scholar] [CrossRef]
  7. Salmon, P.; Stroh, E.; Herrera-Duenas, A.; von Post, M.; Isaksson, C. Oxidative stress in birds along a NOx and urbanization gradient: An interspecific approach. Sci. Total Environ. 2018, 622–623, 635–643. [Google Scholar] [CrossRef] [PubMed]
  8. McDonnell, M.J. The history of urban ecology: An ecologist’s perspective. In Urban Ecology: Patterns, Processes, and Applications; Niemelä, J., Breuste, J.H., Elmqvist, T., Guntenspergen, G., James, P., McIntyre, N.E., Eds.; Oxford University Press: Oxford, UK, 2011; pp. 5–13. [Google Scholar]
  9. Brown, J.S.; Zeman, K.L.; Bennett, W.D. Ultrafine particle deposition and clearance in the healthy and obstructed lung. Am. J. Respir. Crit. Care Med. 2002, 166, 1240–1247. [Google Scholar] [CrossRef] [PubMed]
  10. Lee, B.-J.; Kim, B.; Lee, K. Air Pollution Exposure and Cardiovascular Disease. Toxicol. Res. 2014, 30, 71–75. [Google Scholar] [CrossRef] [PubMed]
  11. Beatley, T.; Konijnendijk, C.C. Urban landscapes for public health. In Nature and Public Health: The Role of Nature in Improving the Health of a Population; Series 2015, Oxford Textbook of Nature and Public Health—Matilda van den Bosch, William Bird; Bird, W., van den Bosch, M., Eds.; Oxford University Press: Oxford, UK, 2018. [Google Scholar]
  12. Denche-Zamorano, Á.; Pastor-Cisneros, R.; Moreno-Moreno, L.; Carlos-Vivas, J.; Mendoza-Muñoz, M.; Contreras-Barraza, N.; Gil-Marín, M.; Barrios-Fernández, S. Physical Activity Frequency and Health-Related Quality of Life in Spanish Children and Adolescents with Asthma: A Cross-Sectional Study. Int. J. Environ. Res. Public Health 2022, 19, 14611. [Google Scholar] [CrossRef] [PubMed]
  13. Darlington, A.; Chan, M.; Malloch, D.; Pilger, C.; Dixon, M. The Biofiltration of Indoor Air: Implications for Air Quality. Indoor Air 2000, 10, 39–46. [Google Scholar] [CrossRef] [PubMed]
  14. Darlington, A.; Dat, J.; Dixon, M. The Biofiltration of Indoor Air: Air Flux and Temperature Influence the Removal of Toluene, Ethylbenzene, and Xylene. Environ. Sci. Technol. 2001, 35, 240–246. [Google Scholar] [CrossRef] [PubMed]
  15. Anguluri, R.; Narayanan, P. Role of green space in urban planning: Outlook towards smart cities. Urban For. Urban Green. 2017, 25, 58–65. [Google Scholar] [CrossRef]
  16. Nowak, D.J.; Crane, D.E. Carbon storage and sequestration by urban trees in the USA. Environ. Pollut. 2002, 116, 381–389. [Google Scholar] [CrossRef] [PubMed]
  17. Nowak, D.J.; Hirabayashi, S.; Bodine, A.; Greenfield, E. Tree and forest effects on air quality and human health in the United States. Environ. Pollut. 2014, 193, 119–129. [Google Scholar] [CrossRef] [PubMed]
  18. Salmond, J.A.; Tadaki, M.; Vardoulakis, S.; Arbuthnott, K.; Coutts, A.; Demuzere, M.; Dirks, K.N.; Heaviside, C.; Lim, S.; MacIntyre, H.; et al. Health and climate related ecosystem services provided by street trees in the urban environment. Environ. Health 2020, 15, 95–111. [Google Scholar] [CrossRef] [PubMed]
  19. Wolf, K.L.; Lam, S.T.; McKeen, J.K.; Richardson, G.R.; van den Bosch, M.; Bardekjian, A.C. Urban trees and human health: A scoping review. Int. J. Environ. Res. Public Health 2020, 17, 4371. [Google Scholar] [CrossRef] [PubMed]
  20. Przybysz, A.; Nersisyan, G.; Stanisław, W.; Gawroński, S.W. Removal of Particular Matter and Trace Elements from Ambient Air by Urban Greenery in Winter Season. Environ. Sci. Pollut. Res. J. 2019, 26, 473–482. [Google Scholar] [CrossRef] [PubMed]
  21. Popek, R.; Gawrońska, H.; Sæbø, A.; Wrochna, M.; Gawroński, S.W. Particulate matter on foliage of 13 woody species: Deposition on surfaces and phytostabilisation in waxes a 3-year study. Int. J. Phytoremediat. 2013, 15, 245–256. [Google Scholar] [CrossRef] [PubMed]
  22. Sæbø, A.; Popek, R.; Nawrot, B.; Hanslin, H.M.; Gawrońska, H.; Gawroński, S.W. Plant species differences in particulate matter accumulation on leaf surfaces. Sci Total Environ. 2012, 427–428, 347–354. [Google Scholar] [CrossRef] [PubMed]
  23. Nawrot, T.S.; Perez, L.; Künzli, N.; Munters, E.; Nemery, B. Public health importance of triggers of myocardial infarction: A comparative risk assessment. Lancet 2011, 377, 732–740. [Google Scholar] [CrossRef] [PubMed]
  24. Nieuwenhuijsen, M.J. Green infrastructure and health. Ann. Rev. Public Health 2020, 42, 317–328. [Google Scholar] [CrossRef]
  25. WHO. WHO-World Health Organization. Ambient (Outdoor) Air Pollution. 2018. Available online: https://www.who.int/news-room/fact-sheets/detail/ambient-(outdoor)-air-quality-and-health (accessed on 12 April 2021).
  26. FAO. Forests and sustainable cities. Unasylva 2018, 250, 1–84. [Google Scholar]
  27. Pope, C.A.; Burnett, R.T.; Thun, M.J.; Calle, E.E.; Krewski, D.; Ito, K.; Thurston, G.D. Lung Cancer, Cardiopulmonary Mortality, and Long-term Exposure to Fine Particulate Air Pollution. J. Am. Med. Assoc. 2002, 287, 1132–1141. [Google Scholar] [CrossRef] [PubMed]
  28. Fann, N.; Lamson, A.D.; Anenberg, S.C.; Wesson, K.; Risley, D.; Bryan, J.H. Estimating the national public health burden associated with exposure to ambient PM2.5 and ozone. Risk Anal. 2012, 32, 81–95. [Google Scholar] [CrossRef] [PubMed]
  29. Arnfield, A.J. Two decades of urban climate research: A review of turbulence, exchanges of energy and water, and the urban heat island. Int. J. Climatol. 2003, 23, 1–26. [Google Scholar] [CrossRef]
  30. Brans, K.I.; Jansen, M.; Vanoverbeke, J.; Tüzün, N.; Stoks, R.; Meester, L.D. The heat is on: Genetic adaptation to urbanization mediated by thermal tolerance and body size. Glob. Chang. Biol. 2017, 23, 5218–5227. [Google Scholar] [CrossRef] [PubMed]
  31. FAO. Guidelines on Urban and Periurban Forestry; Salbitano, F., Borelli, S., Conigliaro, M., Eds.; FAO Forestry Paper No. 178; FAO: Rome, Italy, 2016. [Google Scholar]
  32. Nowak, D.J.; Greenfield, E.J.; Hoehn, R.E.; Lapoint, E. Carbon storage and sequestration by trees in urban and community areas of the United States. Environ. Pollut. 2013, 178, 229–236. [Google Scholar] [CrossRef] [PubMed]
  33. Lee, A.; Jordan, H.C.; Horsley, J. Value of urban green spaces in promoting healthy living and wellbeing: Prospects for planning. Risk Manag. Healthc. Policy 2015, 8, 131–137. [Google Scholar] [CrossRef] [PubMed]
  34. World Health Organization (Regional Office for Europe). Urban Green Spaces and Health; World Health Organization: Geneva, Switzerland, 2016; Volume iii, 80p. [Google Scholar]
  35. Konijnendijk, C. Evidence-based guidelines for greener, healthier, more resilient neighborhoods: Introducing the 3-30-300 rule. J. For. Res. 2022, 34, 821–830. [Google Scholar] [CrossRef] [PubMed]
  36. Urban Forest Diversity Guidelines. Tree Species Selection Strategy for the City of Melbourne. Prepared on Behalf of City of Melbourne by ASPECT Studios and Tree Logic. 2011. Available online: https://www.melbourne.vic.gov.au/SiteCollectionDocuments/urban-forest-diversity-guidelines.pdf (accessed on 29 March 2024).
  37. Wang, X.L.; Wang, L.; Wang, S. Marketisation as a channel of international technology diffusion and green total factor productivity: Research on the spillover effect from China’s first-tier cities. Technol. Anal. Strateg. Manag. 2021, 33, 491–504. [Google Scholar] [CrossRef]
  38. Torkildsen, G. Leisure and Recreation Management; Psychology Press: London, UK, 2005; Available online: https://samples.sainsburysebook.co.uk/9781134390083_sample_544268.pdf (accessed on 16 August 2016).
  39. Khan, A. Planning Standards for Recreational Facilities and Open Space in the Context Areas of Bangladesh in Khan, A.M. 2014. Revisiting Planning Standards for Recreational Facilities in Urban Areas. Equality in the City: Making Cities Socially Cohesive. World Town Planning Day 2014. Available online: http://www.bip.org.bd/SharingFiles/journal_book/20141118151124.pdf (accessed on 2 August 2016).
  40. Fayvush, G.; Aghababyan, K.; Aleksanyan, A.; Arakelyan, M.; Gasparyan, A.; Kalashian, M.; Margaryan, M.; Nanagulyan, S. Biodiversity Conservation Problems. In Biodiversity of Armenia; Springer: Cham, Switzerland. [CrossRef]
  41. Harutyunyan, L.V.; Harutyunyan, S.L. Dendroflora of Armenia; Book Two; Luys Publishing House: Yerevan, Armenia, 1987; 464p. (In Armenian) [Google Scholar]
  42. Khachatryan, A. Contemporary state of landscaping of the city of Gyumri. Izv. Agrar. Nauk. 2006, 4, 141–145. [Google Scholar]
  43. Gyumri-GCAP_Eng.pdf. Available online: https://ebrdgreencities.com/ (accessed on 29 March 2024).
  44. Vanadzor Public Areas. Available online: https://urbanista.am/vanadzor-publicspace (accessed on 29 March 2024).
  45. RA Government Decision N108 N of 8 Febuary 2018 “The Decision of the ra Government on Determining the Requirements for the Size and Species Composition of the Green Belts of Residences and Recognize the Decision n 1318 of 30 October 2008 of the ra Government as Lost Force about”. Available online: https://www.arlis.am/DocumentView.aspx?DocID=119785 (accessed on 29 March 2024).
  46. Santrosyan, A.V.; Ishkhanyan, Y.; Nersisyan, G.S. The correct development strategy of environmental laws in the process of improving the atmospheric air. Armen. J. Forensic Crim. 2020, 4, 63–70. Available online: http://journal.nbe.am/wp-content/uploads/2020/12/Amsagir_042_2020_for-web.pdf (accessed on 29 March 2024).
  47. Edilyan, R.A. Land cover. In Physical Geography of the Armenian SSR, 1971 (470p.); National Academy of Sciences of Armenian SSR: Yerevan, Armenia, 1971; pp. 220–228. (In Armenian) [Google Scholar]
  48. Edilyan, R.A. General Conditions of Soil Formation, Maps of Geography and Systems Soil of the Armenian SSR. National Academy of Sciences of Armenia: Yerevan, Armenia, 1976; pp. 17–51. (In Armenian) [Google Scholar]
  49. Kovats, S.; Akhtar, R. Climate, climate change and human health in Asian cities. Environ. Urban. 2008, 20, 165–175. [Google Scholar] [CrossRef]
  50. Azatian, V.G. Yerevan: [Album Guide]; Parberakan: Yerevan, Armenia, 1989; 319p. (In Armenian) [Google Scholar]
  51. World Meteorological Organization Climate Normals for 1981–2010. 2021. World Meteorological Organization. Archived from the Original on 9 October 2021. Retrieved 9 October 2021. WMO Climatological Normals|World Meteorological Organization. 2021. Available online: https://community.wmo.int/en/wmo-climatological-normals (accessed on 29 March 2024).
  52. Statistical Handbook 2021. Marzers and Yerevan City of the Republic of Armenia in Figures, 2021, Statistical Handbook. Available online: https://armstat.am/file/Map/MARZ_01.pdf (accessed on 29 March 2024).
  53. Vardanyan, Z.H.; Ktrakyan, S.A.; Zaroyan, G.M. Green stand distribuition in different administrative districts and microclimatic zones of Yerevan. Biol. J. Armen. 2019, 71, 79–84. (In Armenian) [Google Scholar]
  54. Nersisyan, G.; Studying Indicator Parameters of Ecological Tolerance of Trees under Conditions of the City of Yerevan. World Forum on Urban Forests. Changing the Nature of Cities: The Role of Urban Forestry for a Green, Healthier and Happier Future. 28 November to 1 December, Mantua, Italy. 2018, p. 56. Available online: https://www.wfuf2018.com/en-ww/parallel-session-2-the-present-1.aspxG (accessed on 29 March 2024).
  55. Kishchenko, I.T. Assessment of deciduous trees introduction prospect in the taiga zone (Karelia). Arct. Environ. Res. 2019, 19, 87–92. [Google Scholar] [CrossRef]
  56. Alexandrova, M.S.; Bulygin, N.E.; Voroshilov, V.N.; Karpisonova, R.A.; Plotnikova, L.S. Metodika Fenologicheskikh Nablyudeniy v Botanicheskikh Sadakh SSSR [Methods of Phenological Observations in the Botanical Gardens of the USSR]; Nauka Publisher: Moscow, Russia, 1975; 27p. (In Russian) [Google Scholar]
  57. Rusanov, F.N. Principles and methods for studying collections of introduced living things plants in botanical gardens. Bull. GBS 1976, 100, 26–29. [Google Scholar]
  58. Nekrasov, V.I. Current Issues in the Development of the Theory of Plant Acclimatization; Nauka: Moscow, Russia, 1980; 102p. [Google Scholar]
  59. Fayvush, G.; Vardanyan, Z.; Aleksanyan, A. Invasiveness Risk Assessment of Woody Plants of Armenia. Thaiszia 2018, 28, 81–91. [Google Scholar]
  60. Street Tree Manual. City of Charleston, South Carolina 15 April 2021, Department of Parks. 2021. Available online: https://www.charleston-sc.gov/DocumentCenter/View/29378/Street-Tree-Manual-04152021?bidId= (accessed on 29 March 2024).
  61. Street Tree Manual. The Seattle Department of Transportation. 2014. Available online: https://www.seattle.gov/documents/departments/sdot/about/documentlibrary/streettreemanualweb.pdf (accessed on 29 March 2024).
  62. Melkonyan, G.A. Mercury Pollution Issue in Major Cities of the Republic of Armenia. Ph.D. Dissertation, Yerevan State University, Yerevan, Armenia, 2023. [Google Scholar]
  63. Sargsyan, K.S. The green circle of Yerevan city. In History of Establishment and the Ways of Reconstruction; Asoghik: Yerevan, Armenia, 2007; 160p. [Google Scholar]
  64. Annotated Catalog of Trees and Shrubs of Botanical Gardens and Arboretums of the Armenian SSR. Bulletin. Bot. Garden of the Academy of Sciences of the Armenian SSR. 27; Institute of Botany of National Academy of Sciences of Armenia: Yerevan, Armenia, 1985; 164p. (In Russian)
  65. Gabrielyan, E.; Fragman-Sapir, O.; Oganezova, G.; Sargsyan, M.; Nersesyan, A.; Aghababyan, M.; Tamanyan, K. Green Armenia; “Limush”(WWF-Armenia and Armenian Botanical Society NGO): Yerevan, Armenia, 2016; 352p. [Google Scholar]
  66. Fayvush, G. Climate change impacts: Vulnerability assessment and adaptation. In Third National Communication on Climate Change under the United Nations Framework Convention on Climate Change; Lusabats: Yerevan, Armenia, 2015; pp. 51–87. [Google Scholar]
  67. Armenian 4th National Communication on Climate Change 2020. Under the United Nations Framework Convention. Available online: http://env.am/storage/files/fnc-eng.pdf (accessed on 29 March 2024).
  68. Armenian 3rd National Communication on Climate Change 2015. Under the United Nations Framework Convention. Available online: http://env.am/storage/files/1armenias-tnc-2015-eng.pdf (accessed on 29 March 2024).
  69. Bulletin of Atmospheric Air Pollution in the Territory of the Republic of Armenia in 2020. Available online: http://armmonitoring.am/public/admin/ckfinder/userfiles/files/ampopag/Odi%20Obzor%202020.pdf (accessed on 29 March 2024).
  70. Health Statistical Yearbook. National Institute of Health after Named after Academician S. Avdalbekyan; Ministry of Health of Armenia: Yerevan, Armenia, 2017.
  71. Health Statistical Yearbook. National Institute of Health after Named after Academician S. Avdalbekyan; Ministry of Health of Armenia: Yerevan, Armenia, 2018.
  72. Health Statistical Yearbook. National Institute of Health after named after academician S. Avdalbekyan (nih.am). 2019. Available online: https://nih.am/assets/pdf/atvk/7757ef19033d47f82bcdf271b94ef4e2.pdf (accessed on 29 March 2024).
  73. Saghatelyan, A.K.; Arevshatyan, S.H.; Sahakyan, L.V. Ecological-geochemical assessment of heavy metal pollution of the territory of Yerevan. Electron. J. Nat. Sci. 2003, 1, 36–41. [Google Scholar]
  74. Yang, Y.; Zhang, X.; Korenaga, T.; Higuchi, K. Determination of passive-sampled sulfur dioxide in ambient air as sulfate ion by flow injection analysis with an in-line reaction column. Talanta 2007, 45, 445–450. [Google Scholar] [CrossRef]
  75. Christie, S.; Scorsone, E.; Persaud, K.; Kvasnik, F. Remote detection of gaseous ammonia using the near infrared transmission properties of polyaniline. Sens. Actuators B 2003, 90, 163–169. [Google Scholar] [CrossRef]
  76. Eipel, C.; Jeroschewski, P.; Steinke, I. Determination of ozone in ambient air with a chemiluminescence reagent film detector. Anal. Chim. Acta 2003, 491, 145–153. [Google Scholar] [CrossRef]
  77. Saghatelyan, A.; Sahakyan, L.; Belyaeva, O. Geochemistry of atmospheric dust on the territory of the city of Yerevan. Chem. J. Mold. 2012, 7, 74–77. [Google Scholar] [CrossRef] [PubMed]
  78. Tepanosyan, G.; Baldacchini, C.; Sahakyan, L. Revealing Soil and Tree Leaves Deposited Particulate Matter PTE Relationship and Potential Sources in Urban Environment. Int. J. Environ. Res. Public Health 2021, 18, 10412. [Google Scholar] [CrossRef] [PubMed]
  79. Yerevan Green Action Plan. 2017. Available online: https://www.yerevan.am/en/yerevan-green-city-action-plan (accessed on 29 March 2024).
  80. Health System Statistical Yearbook. National Institute of Health after Named after Academician S. Avdalbekyan; Ministry of Health of Armenia: Yerevan, Armenia, 2020.
  81. NSSRA. NSSRA: National Statistical Service of Republic of Armenia. 2018. Available online: http://armstat.am/en/ (accessed on 13 March 2018).
  82. Elbakidze, M.; Dawson, L.; Kraft van Ermel, L.E.; Mikusiński, G.; Hedblom, M.; Korohoda, N.; Kruhlov, I.; Smaliychuk, A.; Kurdadze, T.; Ugrekhelidze, K.; et al. Understanding people’s interactions with urban greenspace: Case studies in Eastern Europe. Urban For. Urban Green. 2023, 89, 128117. [Google Scholar] [CrossRef]
Figure 1. The geographic location, meteorological and air quality monitoring stations, and administrative districts of Yerevan city.
Atmosphere 15 00473 g001
Figure 2. The flow chart of work steps from the problem statement and cleared major issue (light blue) towards research approaches to address those issues (dark blue with highlighted approaches in dark green) and achive certain results (green).
Atmosphere 15 00473 g002
Figure 3. The yearly average temperature (in red) and number of heatwaves (in blue) in Yerevan for the 1961–2020 period and their trend (Data source: Hydrometeorological and monitoring center of Ministry of Environment of Armenia).
Atmosphere 15 00473 g003
Figure 4. The green area per capita by administrative districts of Yerevan city and major landscape types.
Atmosphere 15 00473 g004
Table 1. The number of plants planted in Yerevan city for the 2019–2022 period. https://www.yerevan.am/hy/development-programs (accessed on 29 March 2024).
Planting SpeciesYears
2019202020212022
Trees15,492268675909140
Shrubs5000212,682109,345133,911
Flowers1,000,000290,00053,000277,956
Table 2. Projected changes in temperature and precipitation in Yerevan (for two altitude categories: “up to 1000 m” and the “highlands”) until 2100.
Average Annual Temperature, °CPrecipitation, mm
1961–19902040207021001961–1990204020702100
10.812.414.115.5343332322313
8.410.017.420.2502491481472
Winter
−0.21.32.64.166645555
−2.6−1.10.21.797948080
Spring
9.711.312.113.6122115105114
7.38.99.711.2179168155166
Summer
21.023.024.427.086757476
18.620.622.024.6125110109111
Autumn
12.514.315.717.169787970
10.111.913.314.7101115116102
Table 3. Mean annual concentration (ug/m3) change dynamics in Yerevan city atmospheric pollutants 2016–2022 [69].
PollutantsDescriptorYear MACTendency
2016201720182019202020212022
PMMean annual concentration9514311012811717214715011.7
Sample quantity2356240117111729154217551803 -
Sulfur dioxideMean annual concentration282928181317022050−1.3
Sample quantity2358242817641757155717691819 -
Nitrogen dioxideMean annual concentration23222015322729403.0
Sample quantity2393240317621751155617681805 -
Ozone near the groundMean annual concentration587645630−0.1
Sample quantity2402239417631738153617661660 -
Table 4. Yerevan population death rate by age group and sex, 2017–2019 [68,69,70,71,72].
Death Cause201720182019
0–19-year-old children (male)The death rate of children due to separate conditions in the perinatal period262619
Death rate of children having congenital malformations and chromosome disorders1267
0–19-year-old children (female)Death rate of children due to separate conditions in the perinatal period301815
Death rate of children having congenital malformations and chromosome disorders1194
20> years old (male)Diseases of the blood circulatory system228522322275
Malignant tumors10719831008
Ischemic heart disease, chronic and other types105012301287
Table 5. Distribution of the total area, population, green areas of general use, and green areas per capita in Yerevan.
Administrative
District
Total Area (Hectare)PopulationGreen Areas of General Use, Yards, haGreen Areas Per Capita, m2
Achapnyak2582110,50080.067.3
Avan81253,10046.668.78
Arabkir1325115,200595,0
Davtashen65243,00049.3211.68
Erebuni4850130,00032.92.6
Kentron1335126,200160.2812.6
Malatia-Sebastia2516140,600123.839.7
Nor Nork1410134,400130.2910.06
Nork-Marash47611,9004.33.8
Nubarashen172410,2007.567.79
Shengavit4060141,900127.339.27
Qanaqer-Zeytun77374,90065.338.78
Total22,5001,080,311882.998.11
Table 6. The diversity of trees and shrubs in Yerevan and their climate–ecological characteristics.
SpeciesLifestyle *Ecological SustainabilityUse According to Landscaping TypeDegree of Tree OrnamentalityDecoration LevelDrought ResistanceMoisture ResistantDisease and Pest Resistance
N/N123456789
1Spiraea x vanhouttei (Briot) Zab.Sh.d.StableSolitary, street planting, groups, living fence34High+ Stable
2Populus alba L.T.d.StableSolitary, street planting28Average +Stable
3Juniperus sabina L.Sh.c.StableSolitary, groups23Very high+ Stable
4Juniperus virginiana L.T.c.StableSolitary, street planting, groups27Very high+ Stable
5Cotinus coggygria Scop.T.d.StableSolitary, groups37Very high+ Stable
6Picea pungens Engelm. “Glauca”T.c.StableSolitary, street planting, groups26Very high +Stable
7Ulmus minor L.T.d.StableSolitary, street planting29Average+ Low
8Morus alba L.T.d.StableSolitary, street planting29Average+ Stable
9Acer pseudoplaytanus L.T.d.AverageSolitary, street planting29Average +Average
10Acer negundo L.T.d.AverageSolitary, street planting29Average+ Average
11Acer platananoides L.T.d.AverageSolitary, street planting, groups29Average +Average
12Thuja occidentalis L. “Fastigiata”T.c.AverageSolitary, street planting, groups26Very high +Average
13Quercus macranthera L.T.d.StableSolitary, street planting, groups28Average+ Low
14Campsis radicans (L.) Seem.L.d.StableVertical landscaping34High +Average
15Catalpa ovata G. DonT.d.AverageSolitary, street planting, groups34High+ Average
16Koelreuteria paniculata L.T.d.StableSolitary, street planting, groups37Very high+ Stable
17Biota orientalis (L.) Endl.T.c.StableSolitary, street planting, groups23Very high+ Stable
18Ligustrum vulgare L.Sh.d.StableStreet planting, living fence33High+ Stable
19Berberis vulgaris L.Sh.d.Stablegroups32High+ Stable
20Parthenocissus quinquefolia (L.) Planch.L.d.StableVertical landscaping35High+ Stable
21Fraxinus lanceolata L.T.d.StableSolitary, street planting29Average+ Average
22Fraxinus pennsylvanica L.T.d.StableSolitary, street planting, groups29Average+ Average
23Fraxinus excelsior L.T.d.StableSolitary, street planting, groups29Average+ Average
24Hibiscus syriacus L.Sh.d.StableSolitary, street planting, groups33High+ Average
25Aesculus hippocastanum L.T.d.AverageSolitary, street planting35Very high +Stable
26Salix alba L. var. vitelliana “Pendula”T.d.StableSolitary, street planting, groups36Very high +Average
Continouation of table on the next page
N/N123456789
27Robinia pseudoacacia L.T.d.StableSolitary, street planting, groups36Very high+ Stable
28Robinia pseudoacacia L. “Compacta”T.d.StableSolitary, street planting, groups36Very high+ Stable
29Sophora japonica L.T.d.StableSolitary, street planting, groups35High+ Average
30Platanus orientalis L.T.d.StableSolitary, street planting, groups32High +Average
31Platanus acerofolia L.T.d.StableSolitary, street planting, groups32High +Average
32Philadelphus caucasicus KoehmeSh.d.StableSolitary, groups, living fence36Very high+ Average
33Buxus sempervirens L.S.ev.StableStreet planting, groups, living fence23Very low +Average
34Forsythia intermedia Zab. Sh.d.StableSolitary, groups, living fence33High +Average
* Sh.d.—Shrub deciduous, T.d.—Tree deciduous, T.c.—Tree conifers, L.d.—Lianas deciduous, S.ev.—Shrub evergreen.
Table 7. The types of trees and shrubs proposed for Yerevan streets and gardens.
NSpecies
StreetsParksShrubsLianas
1Cotinus coggygria Scop.Cotinus coggygria Scop.Ligustrum vulgare L.Parthenocissus quinquefolia (L.) Planch.
2Koelreuteria paniculata L.Koelreuteria paniculata L.Spiraea vanhouttei (Briot) Zab.Campsis radicans (L.) Seem.
3Fraxinus lanceolata L.Fraxinus lanceolata L.Spiraea japonica L.Wisteria sinensis (Sims) Sweet
4Fraxinus pennsylvanica L.Fraxinus pennsylvanica L.Hibiscus syriacus L.Dens du Feu
5Fraxinus excelsior L.Fraxinus excelsior L.Philadelphus caucasicus KoehmeMadame Plantier
6Robinia pseudoacacia L. “Compacta”Cercis Canadensis L.Buxus sempervirens L.Hedera helix L.
7Sophora japonica L.Aesculus hippocastanum L.Forsythia intermedia Zab.Vitis amurensis Rupr.
8Platanus orientalis L.Platanus orientalis L.Symphoricarpos albus (L.) BlakeLonicera caprifolium L.
9Platanus acerofolia L.Platanus acerofolia L.Berberis vulgaris L.Lonicera flava Sims
10Aesculus hippocastanum L.Juniperus sabina L.Weigela florida (Bge.)A. DC.
11 Juniperus virginiana L.Deutzia scabra Thunb.
12 Picea pungens Engelm. “GlaucaChaenomeles japonica (Thunb.) Lindl. Ex Spach
13 Catalpa ovata G. DonBerberis vulgaris L.
14 Biota orientalis (L.) Endl.Berberis vulgaris L. “Atropurpurea
15 Salix alba L. var. vitelliana “Pendula”Viburnum opulus L. “Roseum
Disclaimer/Publisher’s Note: The statements, opinions and data contained in all publications are solely those of the individual author(s) and contributor(s) and not of MDPI and/or the editor(s). MDPI and/or the editor(s) disclaim responsibility for any injury to people or property resulting from any ideas, methods, instructions or products referred to in the content.

