Article

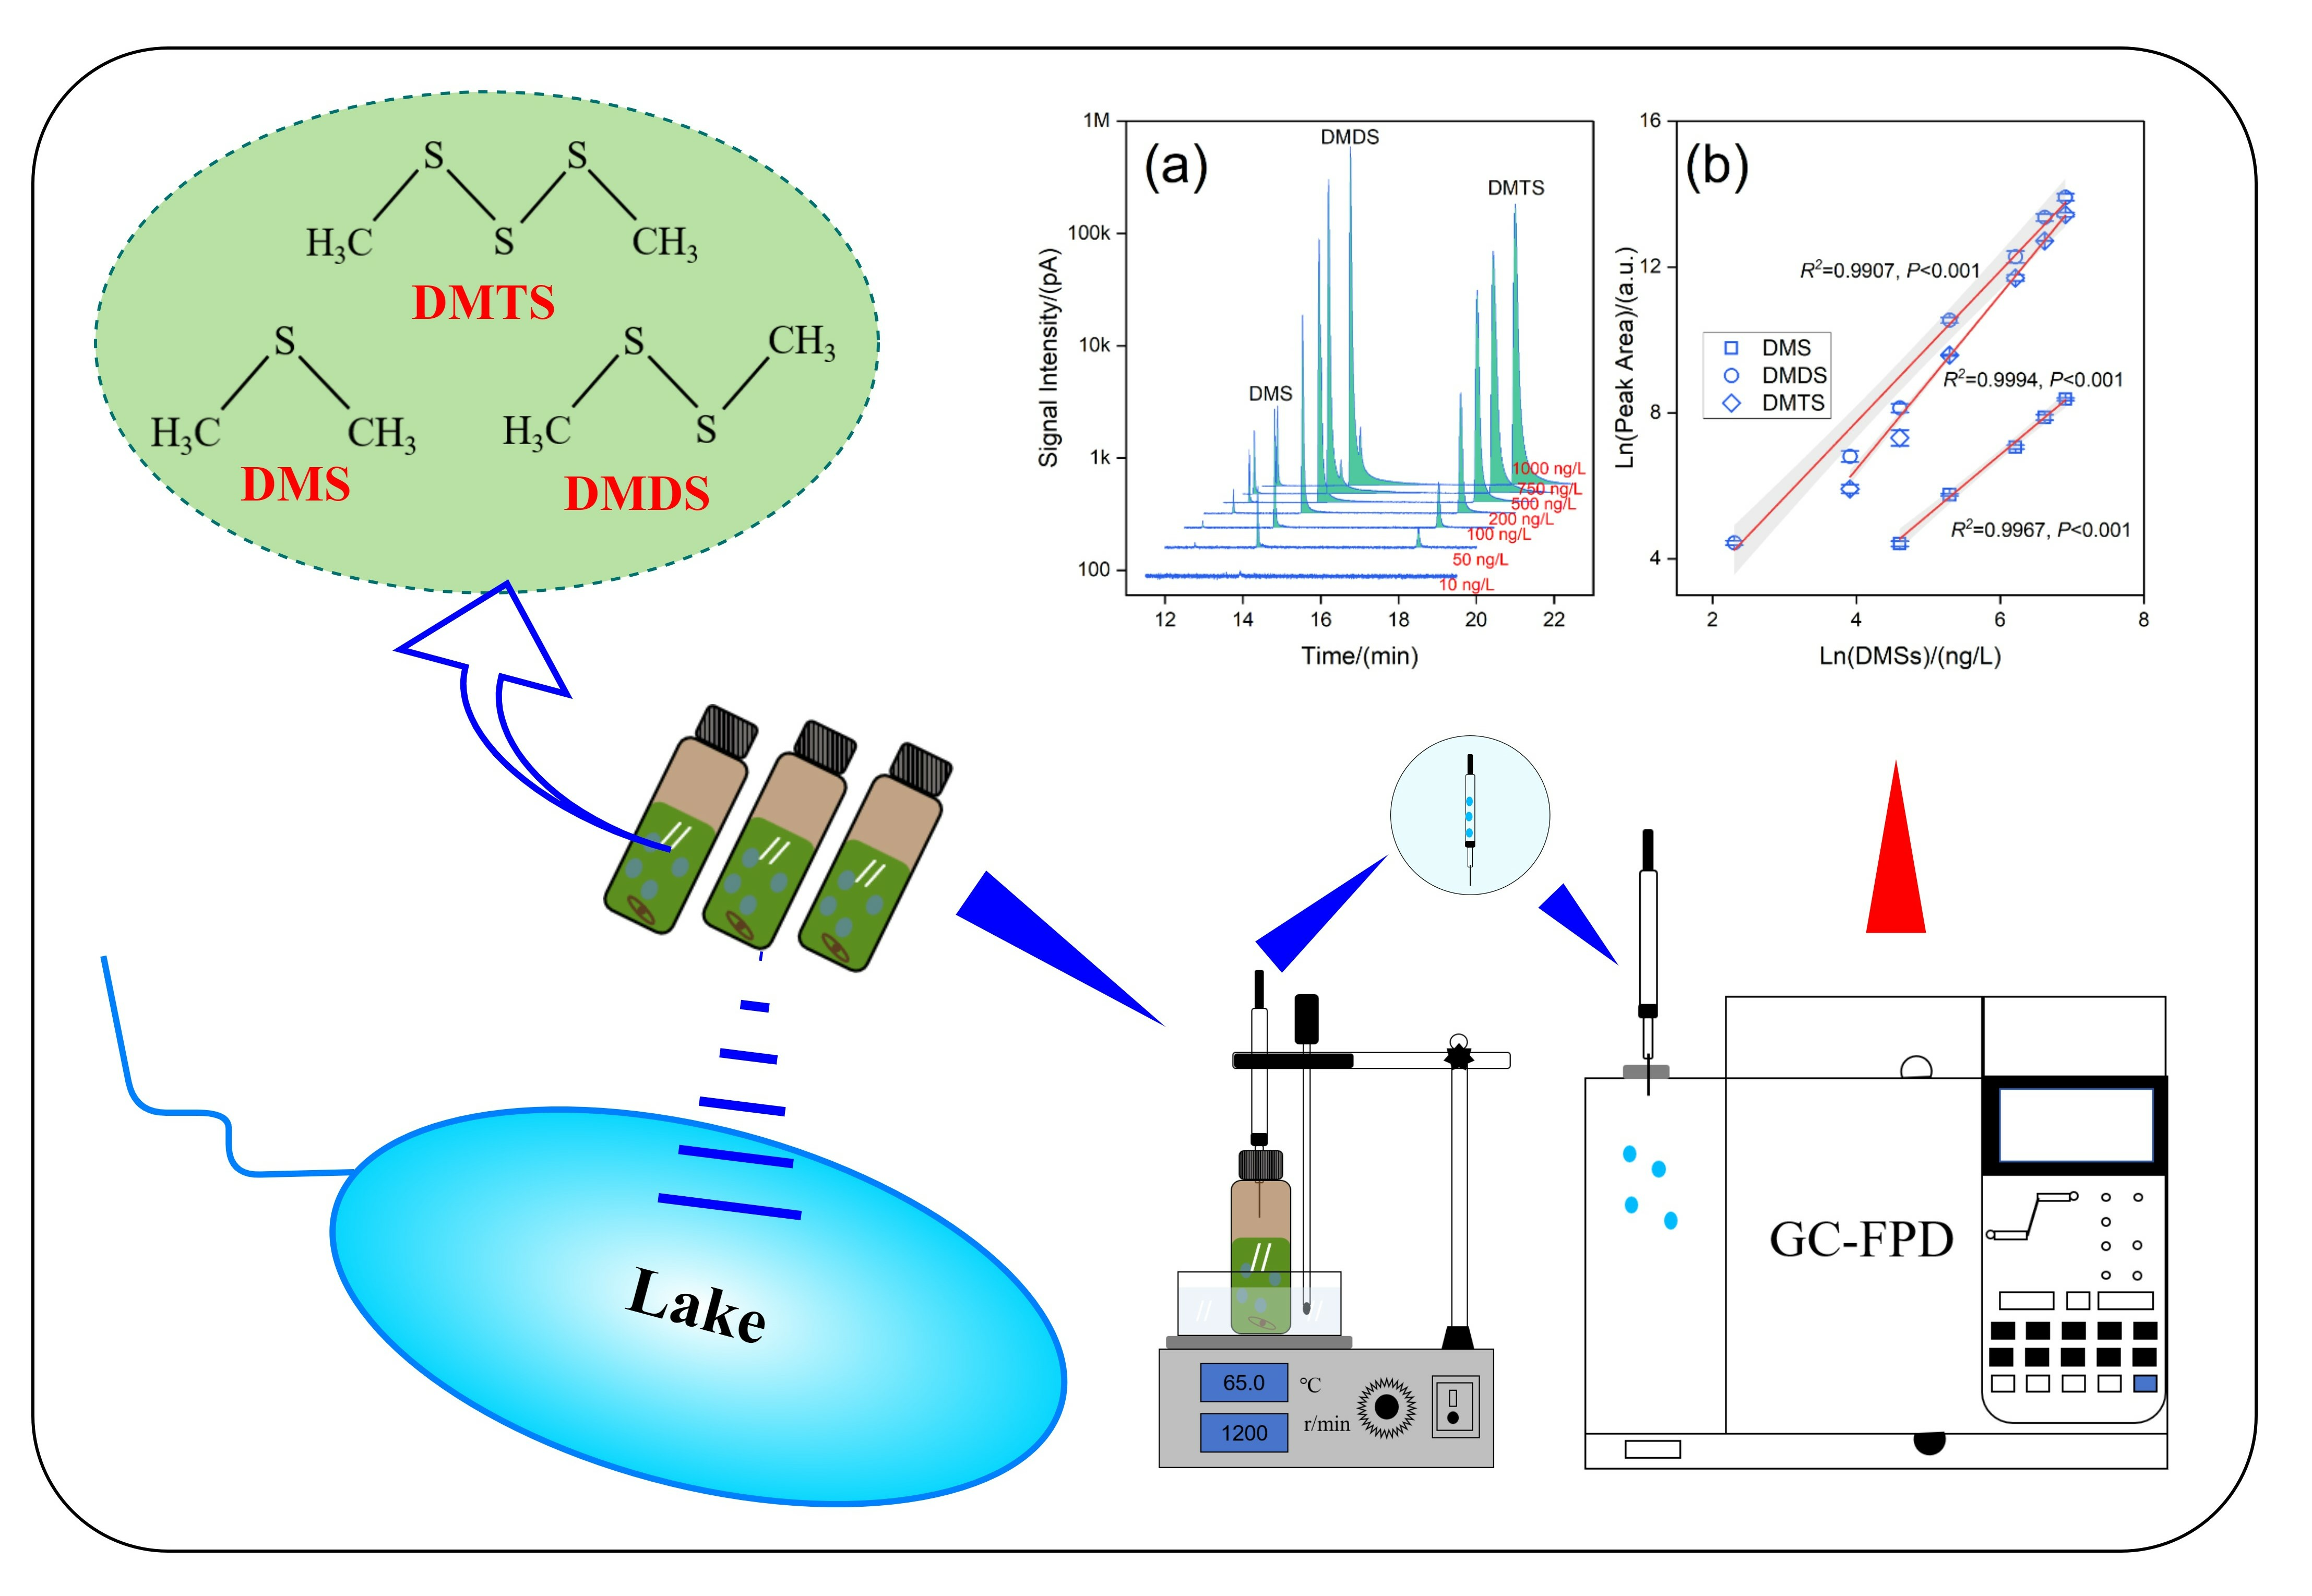
Analysis of Three Dimethyl Sulfides in Freshwater Lakes Using Headspace Solid-Phase Microextraction-Gas Chromatography with Flame Photometric Detection

1
Ningbo College of Health Sciences, Ningbo 315100, China
2
Nanjing Institute of Geography and Limnology, Chinese Academy of Sciences, Nanjing 210008, China
*
Author to whom correspondence should be addressed.
Atmosphere 2024, 15(4), 484; https://doi.org/10.3390/atmos15040484
Submission received: 7 March 2024 / Revised: 7 April 2024 / Accepted: 11 April 2024 / Published: 14 April 2024

Abstract

:
Dimethyl sulfides are ubiquitous odorous substances in eutrophic freshwater bodies. In this study, a simple headspace solid-phase microextraction-gas chromatography-flame photometric detection method was developed to detect three representative algal-derived dimethyl sulfides in freshwater lake water samples: dimethyl monosulfide (DMS), dimethyl disulfide (DMDS), and dimethyl trisulfide (DMTS). The effects of extraction fiber, temperature, pH, ionic strength, and sample volume were investigated orthogonally, and the optimized method was applied to analyze surface water samples from Lake Ulansuhai in Inner Mongolia, China. Optimal extraction was obtained with a 50/30 µm DVB/CAR/PDMS extraction fiber, 20% ion concentration, 87 min extraction time, and 50 °C extraction temperature. The correlation coefficients of the standardized working curves for DMS, DMDS, and DMTS were 0.9967, 0.9907, and 0.9994, respectively, indicating good linear relationships. Limits of detection were in the nanogram range, and the recoveries of the spiked standards for DMS, DMDS, and DMTS were 97.22~99.07%, 93.39~99.34%, and 91.17~99.25%, with relative standard deviations of 5.18~5.94%, 3.08~6.25%, and 2.56~5.47%, respectively. This method is stable and reliable, and can be used for the determination of volatile sulfides in freshwater lake water.

Graphical Abstract

1. Introduction

Eutrophication is one of the main ecological and environmental issues facing freshwater lakes worldwide. In China, around 85.4% of the 138 major freshwater lakes with areas greater than 10 km2 have varying degrees of eutrophication problems [1]. In many hyper eutrophic shallow lakes of China, a dramatic increase in the content of olfactory substances in the water column, represented by dimethyl sulfide substances, has led to a rapid deterioration in the water quality and caused serious environmental consequences [2]. In extremis, bulk accumulation of dimethyl sulfide substances in or near the waters of drinking water sources even caused severe drinking water supply crises for millions of people in neighboring cities [3,4,5]. Hence, dimethyl sulfides (DMSs) pollutants not only degrade the aquatic environmental quality, but also threatens human health and the normal functionating of socio-economic systems and have therefore become a serious threat to the water environment security in eutrophic lakes.
Dimethyl sulfides are volatile organic sulfur compounds, which mainly include dimethyl monosulfide (DMS), dimethyl disulfide (DMDS), and dimethyl trisulfide (DMTS) in freshwater lakes [6]. In normal, unpolluted, natural freshwater, the levels of these substances are very low, often below 10 ng/L, and DMDS and DMTS are often undetectable. However, in waters with more severe algal blooms or decaying aquatic plants, the content of DMSs in the water body is often high and can even cause it to be foul-smelling [7]. Follow-up monitoring studies have shown that DMSs, produced by the death and degradation of cyanobacteria accumulating in the shallow eutrophic Lake Taihu, was an odorous substance that triggered a water supply crisis in the city of Wuxi, Jiangsu Province of China, in 2007 [8], resulting in more than two million residents of the city being left without clean drinking water for up to a week. High concentrations of DMSs were detected in many freshwater lakes globally. In the United States, the maximum concentration of DMS in the Salton Sea lake was 11 µmol/L throughout the year [9], while the concentrations of DMS and DMDS in Linsley Pond lake were as high as 5.3 µg/L and 0.98 µg/L, respectively [10]. Recent studies have shown that the DMS concentration in the water column of Yangcheng Lake, a shallow eutrophic lake, is significantly higher than that in deep-water lakes [11]. Therefore, DMSs have become a prevalent olfactory substance in freshwater bodies, including eutrophic lakes, reservoirs, and rivers [12,13,14].
The detection methods for odorants such as DMSs mainly include sensory and instrumental analyses. Sensory analysis methods include olfactory level description, and olfactory threshold and hierarchy analysis methods. Because the steps of sensory analysis are cumbersome, and the errors are large. Instrumental analysis is more often used for detecting complex olfactory substances. During the detection, preconcentration and instrument selectivity are key steps in the identification of DMSs, whose volatility and high reactivity pose a great challenge for accurate quantitative analysis. Current analytical methods for the determination of DMSs are based on gas chromatography (GC) with different detectors. Detectors such as flame photometric detectors (FPD), mass spectrometry detectors (MSD), sulfur chemiluminescence detectors (SCD), and pulsed flame photometric detectors (PFPD) are often used [15,16,17,18,19]. However, both PFPD and SCD are specific detectors that require sophisticated measurement techniques and are not commonly configured in laboratories, whereas MSD detectors are more expensive. Previous studies have shown that for the determination of DMSs in different environmental media, despite the use of expensive MSD detectors, the detection limit is of the same order of magnitude as other detectors and does not reflect a better quantitative advantage [20]. Compared to other detectors, FPD detector has better selectivity for the small molecules of sulfides and phosphides. Moreover, FPD detectors are routinely used in testing laboratories and are economical. In previous studies on sulfide detection using SPME and GC-FPD, only DMS was measured, and multiple dimethyl sulfides were not investigated [18]. The methods in other related studies were found to have an extremely low detection of DMTS in our research practice, so further improvement of the detection method is needed [19]. Therefore, the use of FPD detectors for the determination of DMSs is more generalizable.
Dimethyl sulfides are often present at trace levels in lake waters, which poses a challenge for their tracking and monitoring. Therefore, selecting a reliable pretreatment enrichment method is crucial for subsequent quantitative analyses. Solid-phase microextraction is one of the more commonly used solvent-free enrichment methods for volatile or semi-volatile substances. It uses polymer-coated fibers to extract analytes from a variety of solid and liquid matrices and has the great advantage of collecting and preconcentrating the analytes in one step. In recent years, headspace solid-phase microextraction (HS-SPME) pretreatment technique has been widely applied to the analysis of trace-level volatile or semi-volatile odorants in water. Cheng et al. used HS-SPME-GC-MS to detect geosmin in drinking water, which improved the limit of quantification of the assay [20]. When using HS-SPME for the pretreatment of solid and liquid samples, the selection of the surface coating of the extraction fibers and fiber specifications are very important for the extraction process, while the extraction conditions are also critical for the sensitivity of the detection. It is crucial to develop and optimize a reliable analyzing procedure and method for detecting DMSs from field water samples.
Therefore, in this study, we developed a HS-SPME-GC-FPD method for determining and analyzing three representative algae-derived DMSs (DMS, DMDS, and DMTS) from water samples of freshwater lakes. The effects of the type of extraction fiber head, extraction temperature, pH, and ionic strength of HS-SPME were investigated. The method we developed could be widely used for DMSs monitoring and will benefit the management of the source water security for drinking water supply.

2. Materials and Methods

2.1. Chemicals and Reagents

The DMS, DMDS, and DMTS standards were purchased from Sigma-Aldrich Company (St. Louis, MO, USA), and their purities were greater than 99%. The basic properties are shown in Table 1. At room temperature, DMS, DMDS, and DMTS are malodorous liquids.
Methanol (chromatographically pure; Merck, Darmstadt, Germany), NaCl (analytically pure; Sinopharm Reagent Company, Shanghai, China), and hydrogen, air, helium, and nitrogen (high purity, purity 99.999%) were used.
Solid phase microextraction fibers coated with StableFlexTM bonded carboxen/polydimethylsiloxane of 75 µm film thickness (75 µm CAR/PDMS) and bonded divinylbenzene/carboxen/polydimethylsiloxane of 50/30 µm film thickness (50/30 µm DVB/CAR/PDMS) were obtained from Supelco (Bellefonte, PA, USA).

2.2. Standard Solutions and Calibration

2.2.1. Preparation of Stock Solution

For the standard stock solution of single DMSs, 1 L of 1000 mg/L methanol solution for DMS, DMDS and DMTS were prepared, respectively. In order to prevent volatilization of the prepared standard solutions, each solution was fully filled in a 40 mL brown headspace vial and then sealed with a PALM film first and tightly covered with a solid cap after. All solutions were stored in darkness in the refrigerator at 2~4 °C.
Mixed standard stock solution containing 10 mg/L DMSs were prepared from the standard stock solution. Using methanol as solvent, standard stock solutions were mixed and diluted to a 10 mg/L mixed stock solution. Then, it was also fully filled in a 40 mL headspace vial and screwed tightly with a solid cap, and stored in darkness in the refrigerator at 2~4 °C.

2.2.2. Preparation of the Working Solutions

Each working solution for DMS, DMDS, and DMTS was prepared by using ultrapure water as the solvent. Each of the three DMSs stock solutions (Section 2.2.1) was diluted step by step to a 100 ng/L working solution. It could only be used within a day.
Mixed working solution was prepared by using ultrapure water as solvent. The 10 mg/L of mixed stock solution (Section 2.2.1) was diluted stepwise into 10 µg/L mixed standard solution. And then, it was diluted stepwise using ultrapure water into a series working solutions in the concentration of 10, 50, 100, 200, 500, 750, and 1000 ng/L. These mixed working solutions could also only be used within a day.

2.3. Extraction Preparation

For preparing the extraction, 1 rotor for magnetic stirrer, 5 g NaCl, and 20 mL of a standard solution or aqueous samples were placed into a brown screw-top headspace vial (40 mL) (Agilent Storage vial kit 5183-4324). Before being added into the vial, the aqueous samples were filtered through a disposable 0.45 μm GF/F glass–fiber filter tip. The headspace vial was screwed shut using a ring-shaped hollow cap (Agilent Cap 5183-4308) with a polytetrafluoroethylene (PTFE)-coated silicone rubber gasket firstly, and then sealed with a sealing film. The prepared headspace vials were then subjected to the next step of solid-phase microextraction. For HS-SPME optimization experiments and sample testing, three replicates were prepared for each treatment. For the method validation experiments, five parallel samples were prepared for each treatment. The 1 cm extraction fiber was activated by inserting it into the GC injection port at 250 °C for 30 min prior to the first use. A blank extraction fiber was checked for the state prior to each subsequent use to ensure that there were no spurious peaks.
According to the properties of three DMSs, the original extraction conditions were set as follows: ion concentration (w/v) of 20%, extraction temperature of 65 °C, equilibrium time of 2 min, extraction time of 30 min, and stirring speed of 1200 rpm. After obtaining the instrumental analytical conditions for the ideal peak shapes, the ion concentration, extraction temperature, and extraction time in the pretreatment were optimized to achieve the best extraction results.

2.4. Instrumentation

A gas chromatograph (GC7890B, Agilent Technologies, Lexington, MA, USA) equipped with an FPD system operating in sulfur mode was used to determine the DMS concentrations. The chromatographic column was a Gas Pro (60 m × 320 μm × 1.8 μm), and the GC temperature program was as follows: the initial temperature was 50 °C for 3 min, then ramped up to 250 °C at a rate of 20 °C/min, and finally held at 250 °C for 10 min. The inlet temperature was 240 °C, and the desorption time was 3 min with splitless injection. The running auxiliary gases were hydrogen, synthetic air, helium, and nitrogen in constant flow mode at flow rates of 50, 65, 30 mL/min, and 1.5 mL/min, respectively.

2.5. Analysis of Water Samples

Water samples were collected from the Lake Ulansuhai in Inner Mongolia, China. It is the largest lake in the Yellow River Basin and one of the eight largest freshwater lakes in China, with an area of about 293 km2, and a water depth between 0.5 and 1.5 m. Five sampling points were set up in the east, west, south, and north, labeled as W1 to W5. Of these, W4 and W5 were located in the north. The water samples from 20 cm below the surface of the water were collected in July 2023 at each of the above sampling points by using a 2.5 L plexiglass water sampler. The sampler was rinsed three times with water samples before each sampling, and the collected water samples were filtered in situ through a 0.45 μm polyethersulfone membrane and then 20 mL was directly added to a 40 mL brown headspace bottle (Agilent Storage vial kit 5183-4324) pre-filled with 3.7 g of NaCl and a magnetic rotor, and then capped with a gasket (PTFE/silica) with PTFE/silicone coating on the inside. The vials were then sealed with a hollow cap with an inner layer of PTFE/silicone septa (Agilent Cap 5183-4308), and refrigerated at 4 °C.

2.6. Statistical Analysis

All statistical analyses were performed using SPSS 19.0 (IBM® SPSS® Statistics, NY, USA). All figures were plotted using OriginLab2021b (OriginLab Corporation, MA, USA).

3. Results and Discussion

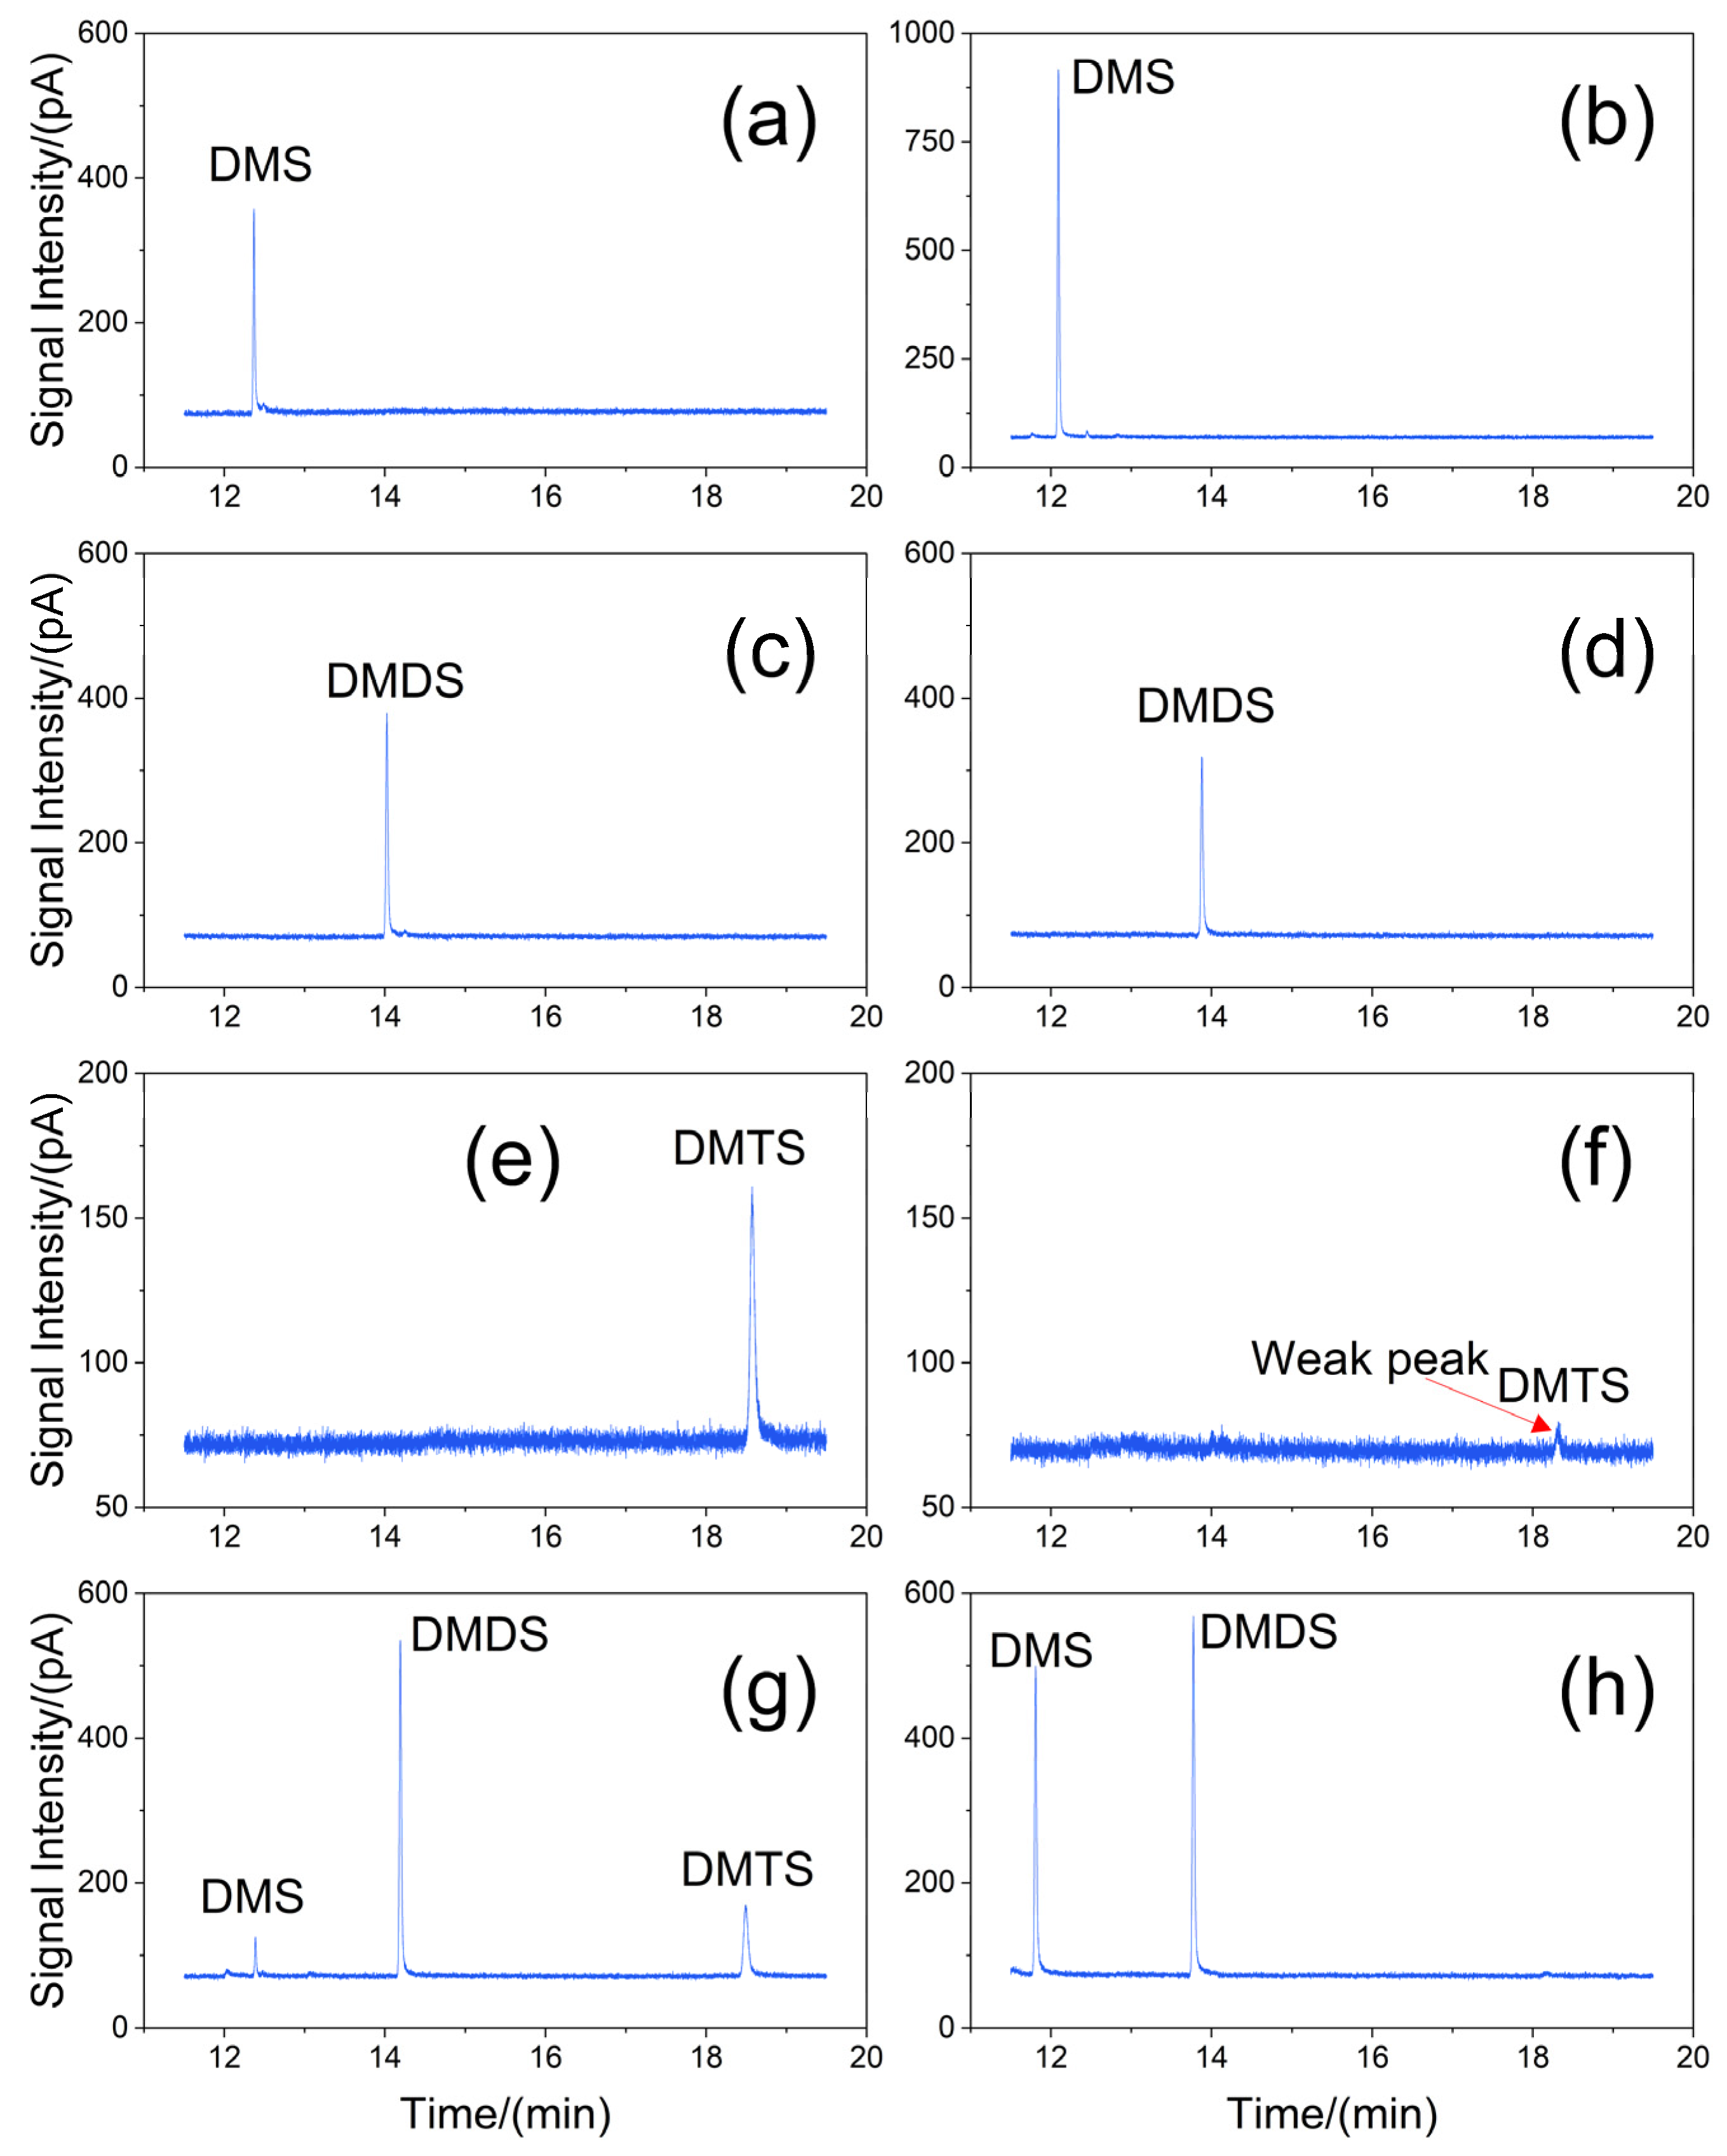
3.1. Characterization of the Three Dimethyl Sulfides

Single standard working solutions of 100 ng/L DMS, DMDS, and DMTS, and a mixed standard working solution of 100 ng/L were analyzed separately to determine the retention time of the three DMSs during GC-FPD analysis. The results are shown in Figure 1a. The DMSs showed high signal–noise ratio within 12–19 min, with no interference from stray peaks and clear peak patterns. The retention times were 12.344 min for DMS, 14.196 min for DMDS, and 18.539 min for DMTS. The organic sulfides more frequently detected in cyanobacteria-decayed lake waters are DMS and DMDS, whereas less attention has been paid to DMTS [6]. However, it is also one of the DMSs produced by cyanobacterial decay in water bodies and should be considered. After the optimization of this method, the simultaneous determination of the three DMSs was achieved, and a more comprehensive understanding of the types of organomethyl sulfides in water bodies can be obtained through a single determination, providing a reference for subsequent treatment methods.

3.2. Method Development and Optimization

3.2.1. Selection of Extraction Fiber

In HS-SPME, the extraction fibers are central throughout the experiment. The amount and rate of analyte adsorption by the extraction fiber are related to parameters such as the polarity, volatility, and boiling point of the analyte [23]. To enable the analytes to be quickly adsorbed and equilibrated by the coating on the surface of the extraction fibers, and to enable them to be detached as soon as possible during thermal desorption, it is necessary to select the appropriate extraction fibers according to the specific analytes to achieve the optimal HS-SPME effect [24].
In this experiment, 50/30 µm DVB/CAR/PDMS and 75 µm CAR/PDMS extraction fibers were coated with a bipolar map layer, which provided better extraction results than unipolar PDMS, PDMS/DVB, and polyamide (PA)-coated extraction fibers [25]. Considering the comparison in terms of the limiting value of the adsorption effect of the extraction fibers on a particular DMS, in this study we compared the extraction effect of the two extraction fibers for three DMSs at an ionic concentration of 20%, an extraction time of 30 min, an extraction temperature of 65 °C, and a lower concentration (100 ng/L). The results of the extraction peak shapes using 50/30 µm DVB/CAR/PDMS and 75 µm CAR/PDMS extraction fibers for 100 ng/L of DMS, DMDS, and DMTS in a single standard and 100 ng/L in a mixed standard are shown in Figure 1.
As seen from Figure 1a,c, the chromatographic peaks indicated that DMS and DMDS present a good separation in the column. The chromatographic peak height of DMS after extraction by 75 µm CAR/PDMS (Figure 1b) was higher than that of DMS after extraction by 50/30 µm DVB/CAR/PDMS fiber (Figure 1a). The extraction effect on DMS was superior with 75 µm CAR/PDMS extraction fiber than 50/30 µm DVB/CAR/PDMS extraction fiber. However, the signal–noise ratio of DMTS was weak and it was difficult to identify the peak after being extracted by 75 µm CAR/PDMS extraction fibers. Hence, it indicated that DMTS was not easily adsorbed by 75 µm CAR/PDMS extraction fibers at 100 ng/L. As shown in Figure 1g, at the concentration of 100 ng/L, although the adsorption capacity of 50/30 µm DVB/CAR/PDMS for DMS was weak, all three DMSs were able to produce distinct peaks, i.e., at least ensure that the DMSs could be detected at 100 ng/L. Therefore, comprehensively examining the half peak width, peak height, and peak area of the chromatographic peak, the 50/30 µm DVB/PDMS fibers were more sensitive to DMTS adsorption. The 50/30 µm DVB/CAR/PDMS fiber had a better adsorption effect for DMSs. The 50/30 µm DVB/CAR/PDMS fiber had also been used for the extraction of olfactory substances in eutrophic lakes [18,26,27]. The extraction effect was confirmed and applied to the extraction of DMSs in this study.

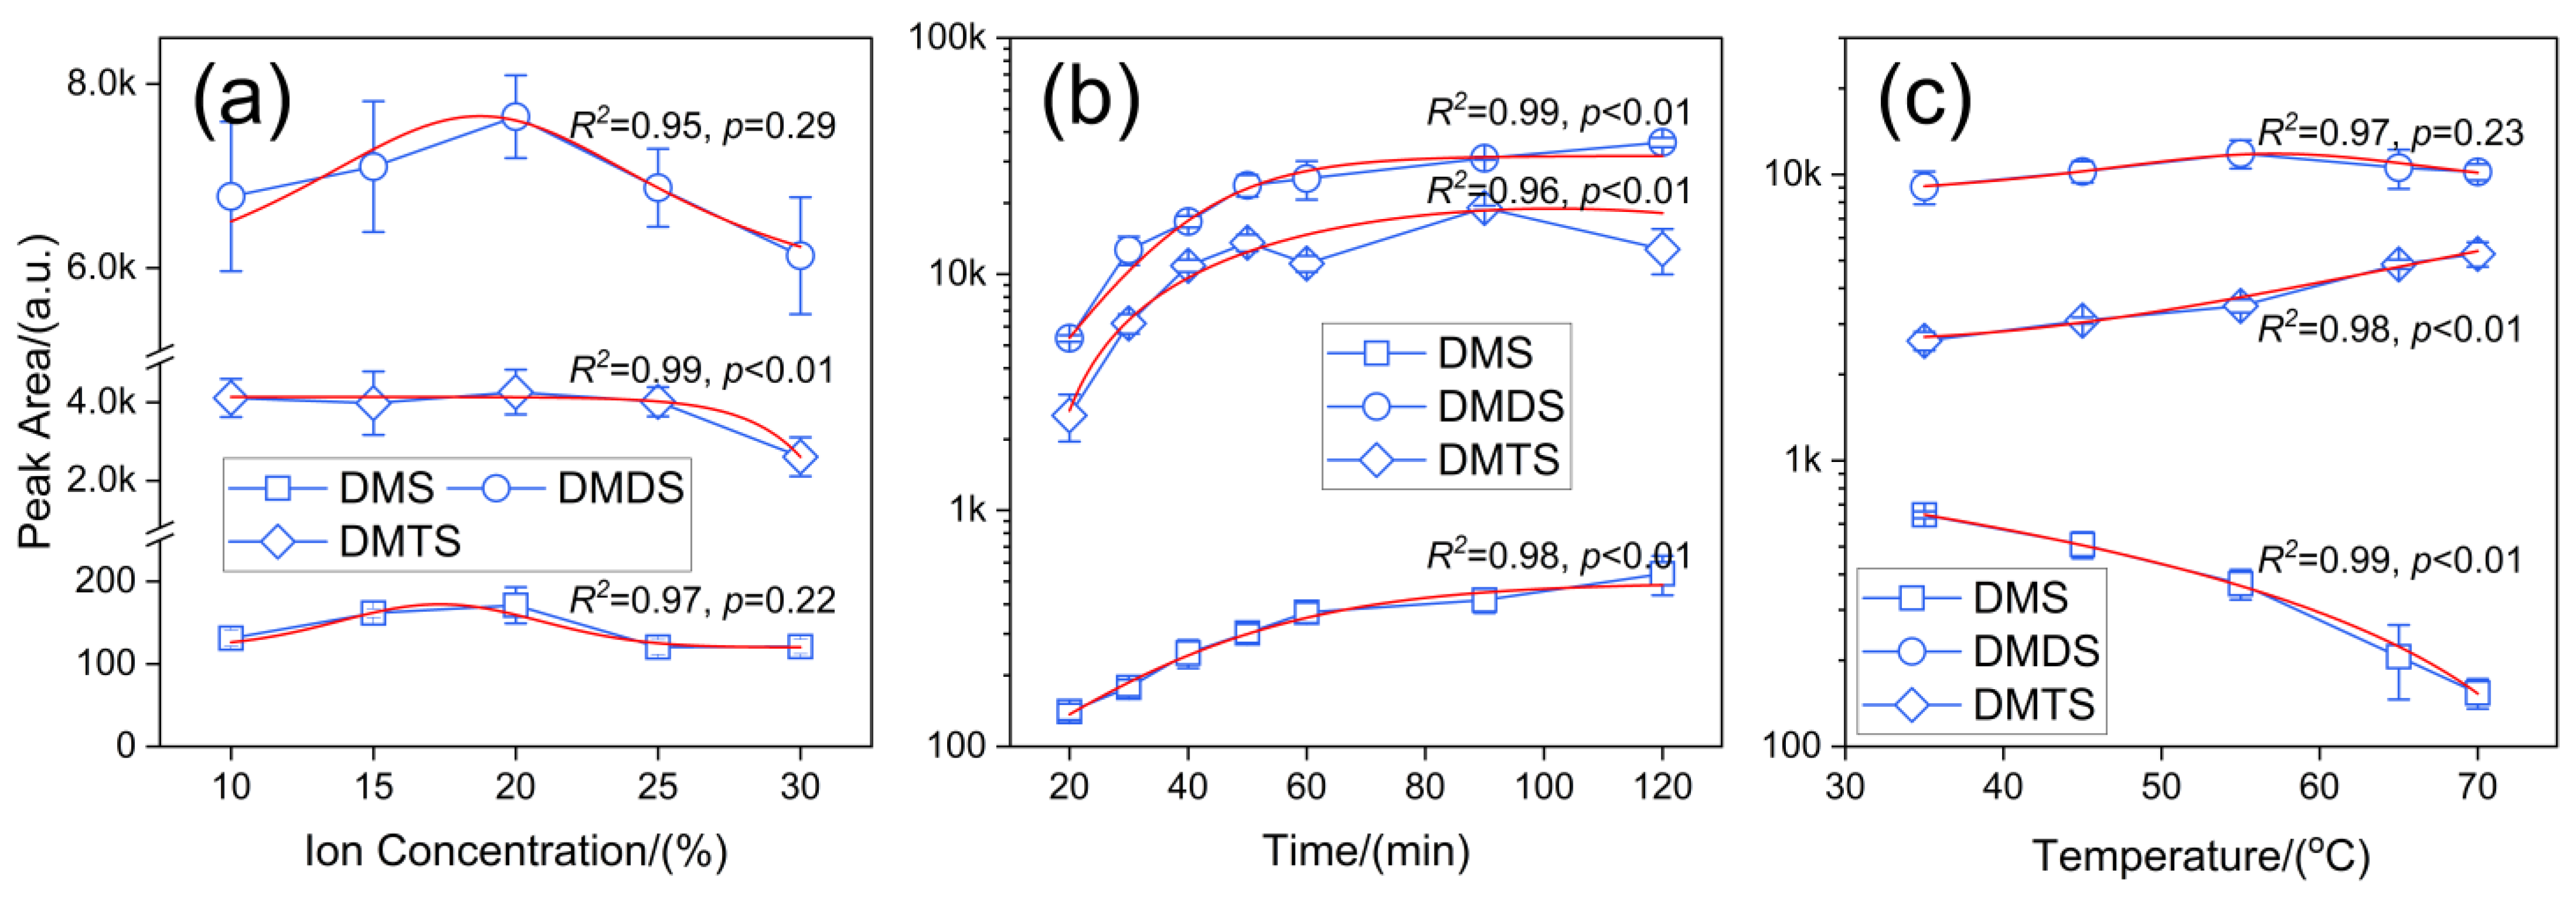
3.2.2. Optimization of Ion Concentration

The dissolution of NaCl in the sample solution increased the ionic concentration of the solution and simultaneously decreased the solubility of the target extractant, thus facilitating volatilization and the adsorption of the extraction fibers. However, when the ionic concentration (w/v) of NaCl is too high, soluble and insoluble NaCl may adsorb onto the target extractant, leading to a reduction in the extraction effect [25]. The extraction conditions of 30 min and 65 °C were selected, and the extraction of 200 ng/L mixed standard solution was conducted using 50/30 µm DVB/CAR/PDMS extraction fiber to investigate the extraction effect on the three DMSs under the conditions of NaCl ion concentration (w/v) of 10%, 15%, 20%, 25%, and 30%. Figure 2a shows an analytical plot of the effects of different ion concentrations on extraction.
From the trend line in Figure 2a, it can be seen that, in general, with increasing solution ion concentration the response peak areas of all three DMSs showed a trend of increasing and then decreasing. The peak area of each DMSs was further analyzed in relation to the ion concentration, and curve fitting was performed for each of the three sulfides to determine the pattern. Curve fitting was performed for DMS, and the fitted images showed that the peak area of DMS increased rapidly until the ion concentration reached 16%, then decreased slowly. The peak area reached a minimum when the ion concentration was 30%. The DMDS fitted curve images show that the peak area of DMDS followed a roughly parabolic trend with increasing ion concentration, reaching a maximum at an ion concentration of 18%. The DMTS fitted curve image shows that the peak area of DMTS was more in equilibrium and stable until the ion concentration reached 20%, after which it began to decline. Numerous researchers have chosen a 20% ion concentration as the extraction condition in single-variable optimization experiments [18,20], and the results in this study were similar; that is, the maximum extraction peak area of DMSs was found at a 20% ion concentration. Based on the fitting results of the three DMSs, 16%, 18%, and 20% were selected as the three ion concentrations in the orthogonal optimization experiments to further refine the optimal ion concentration.

3.2.3. Optimization of Extraction Time

The effect of extraction time on the results was more obvious. The extraction time for HS-SPME usually ranges from a few minutes to an hour or longer, depending on factors such as the solvent matrix, analytes, extraction fibers, and solution volume [25]. In this study, the extraction of 200 ng/L mixed standard solution with 50/30 µm DVB/CAR/PDMS extraction fibers was carried out at an ion concentration of 20% and an extraction temperature of 65 °C. The extraction of the three DMSs was assessed using extraction times of 20 min, 30 min, 40 min, 50 min, 60 min, 90 min, and 120 min.
As can be seen in Figure 2b, the peak areas of the three DMSs varied significantly with the increase in extraction time and showed a gradual increase until 90 min, and only the peak area of DMTS showed inflection points at 50 min and 90 min. The correlation was fitted to DMS, and the fitted image in Figure 2b shows that the peak area of DMS increased rapidly up to 60 min, after which the rate of increase slowed down until 90 min, after which the peak area was less affected by the extraction time. The fitted DMDS curve showed that the peak area of DMDS increased exponentially with an increase in the extraction time up to 120 min, and there was a tendency to continue increasing. The extraction time had the most significant effect on the DMDS peak area. The curve fitting of DMTS showed that the peak area of DMTS exhibited a parabolic trend with the increase in extraction time and reached the maximum value when the extraction time was 87 min, and the sudden drop in the peak area of DMTS at 60 min was probably due to the internal competition among the three DMSs for adsorption. With the increase in extraction time, DMTS was heavily adsorbed by the extraction fibers before 90 min, and the large drop in DMTS at 120 min indicated that the extraction of DMTS by the fiber was oversaturated, and the competitive adsorption of DMS, DMDS, and DMTS caused DMTS to fall off the fiber again.
In this study, although the GC-FPD was highly selective and sensitive to DMSs, the extraction fibers did not exhibit this property. Therefore, when the 50/30 µm DVB/CAR/PDMS extraction fiber reached the saturated state after an extended extraction time, DMDS and DMS, which have higher affinity for this fiber, replaced DMTS, which has lower affinity, through competitive adsorption [18]. The peak areas of different odorants require different times to reach the inflection point of extraction change, and the time point before reaching the equilibrium point was chosen as the extraction time to efficiently and rapidly extract and adsorb odorants [18,28]. In this study, to ensure that DMSs can be extracted and adsorbed more stably and to reduce the peak area error affected by the change in extraction time due to the experimental operation, according to the fitting results of the three DMSs, a time gradient of 87 min and 10 min before and after it, that is, 77, 87, and 97 min, were chosen as the extraction times in the orthogonal optimization experiment.

3.2.4. Optimization of Extraction Temperature

Within a certain temperature range, an increase in temperature aids the volatilization of olfactory substances and improves the extraction efficiency of the extraction fiber. However, for some volatile low-molecular-weight organics, the adsorption of the extraction fiber coating is an exothermic process. As the temperature increases, the thermal desorption process of volatile organics becomes stronger; therefore, an excessively high temperature will reduce the efficiency of the extraction fibers [29]. Therefore, it is necessary to select an appropriate extraction temperature to achieve better extraction efficiency for each analyte. In this study, we selected the conditions of 20% ion concentration and 40 min extraction time, and used 50/30 µm DVB/CAR/PDMS extraction fibers to extract 200 ng/L of the mixed standard solution to investigate the extraction effect of the three DMSs at extraction temperatures of 35 °C, 45 °C, 55 °C, 65 °C, and 70 °C. The extraction of the three DMSs at different temperatures is shown in Figure 2c, which shows an analytical plot of the effects of different extraction temperatures on extraction efficiency.
As shown in Figure 2c, the areas of the three DMS peaks varied with increasing extraction temperature, and the differences were obvious. A linear fitting was performed for DMS, and the fitted curve showed that the peak area of DMS decreased linearly with an increase in the extraction temperature. The linear relationship between the two was good, with R2 reaching 0.9997. It indicated that the adsorption of DMS by the 50/30 µm DVB/CAR/PDMS extraction fiber was an exothermic process, and the efficiency of the DMS being extracted decreased with increasing temperature. The fitted DMDS curve showed that the peak area of DMDS exhibited a roughly parabolic trend with the increase in extraction temperature, and reached the maximum value when the extraction temperature was 55 °C. The curve fitting of DMTS showed that the DMTS peak area increased logarithmically with an increase in the extraction temperature, the growth rate increased, and the effect of the extraction temperature on the peak area of DMTS was most significant. The extraction temperature should not be too high, or it will cause water vapor to attach to the extraction fiber, affecting the extraction and adsorption of the target analytes [20]. In this study, the optimal extraction temperatures for DMS and DMDS were not excessively high. Therefore, the trend of the three DMSs peak areas with the change in extraction time was integrated, and the extraction temperature condition where the DMDS peak area reached its maximum (50 °C) was taken as the baseline, and 5 °C before and after it was selected as the temperature gradient, i.e., 45 °C, 50 °C, and 55 °C were selected as the three extraction temperatures in the orthogonal optimization experiments.

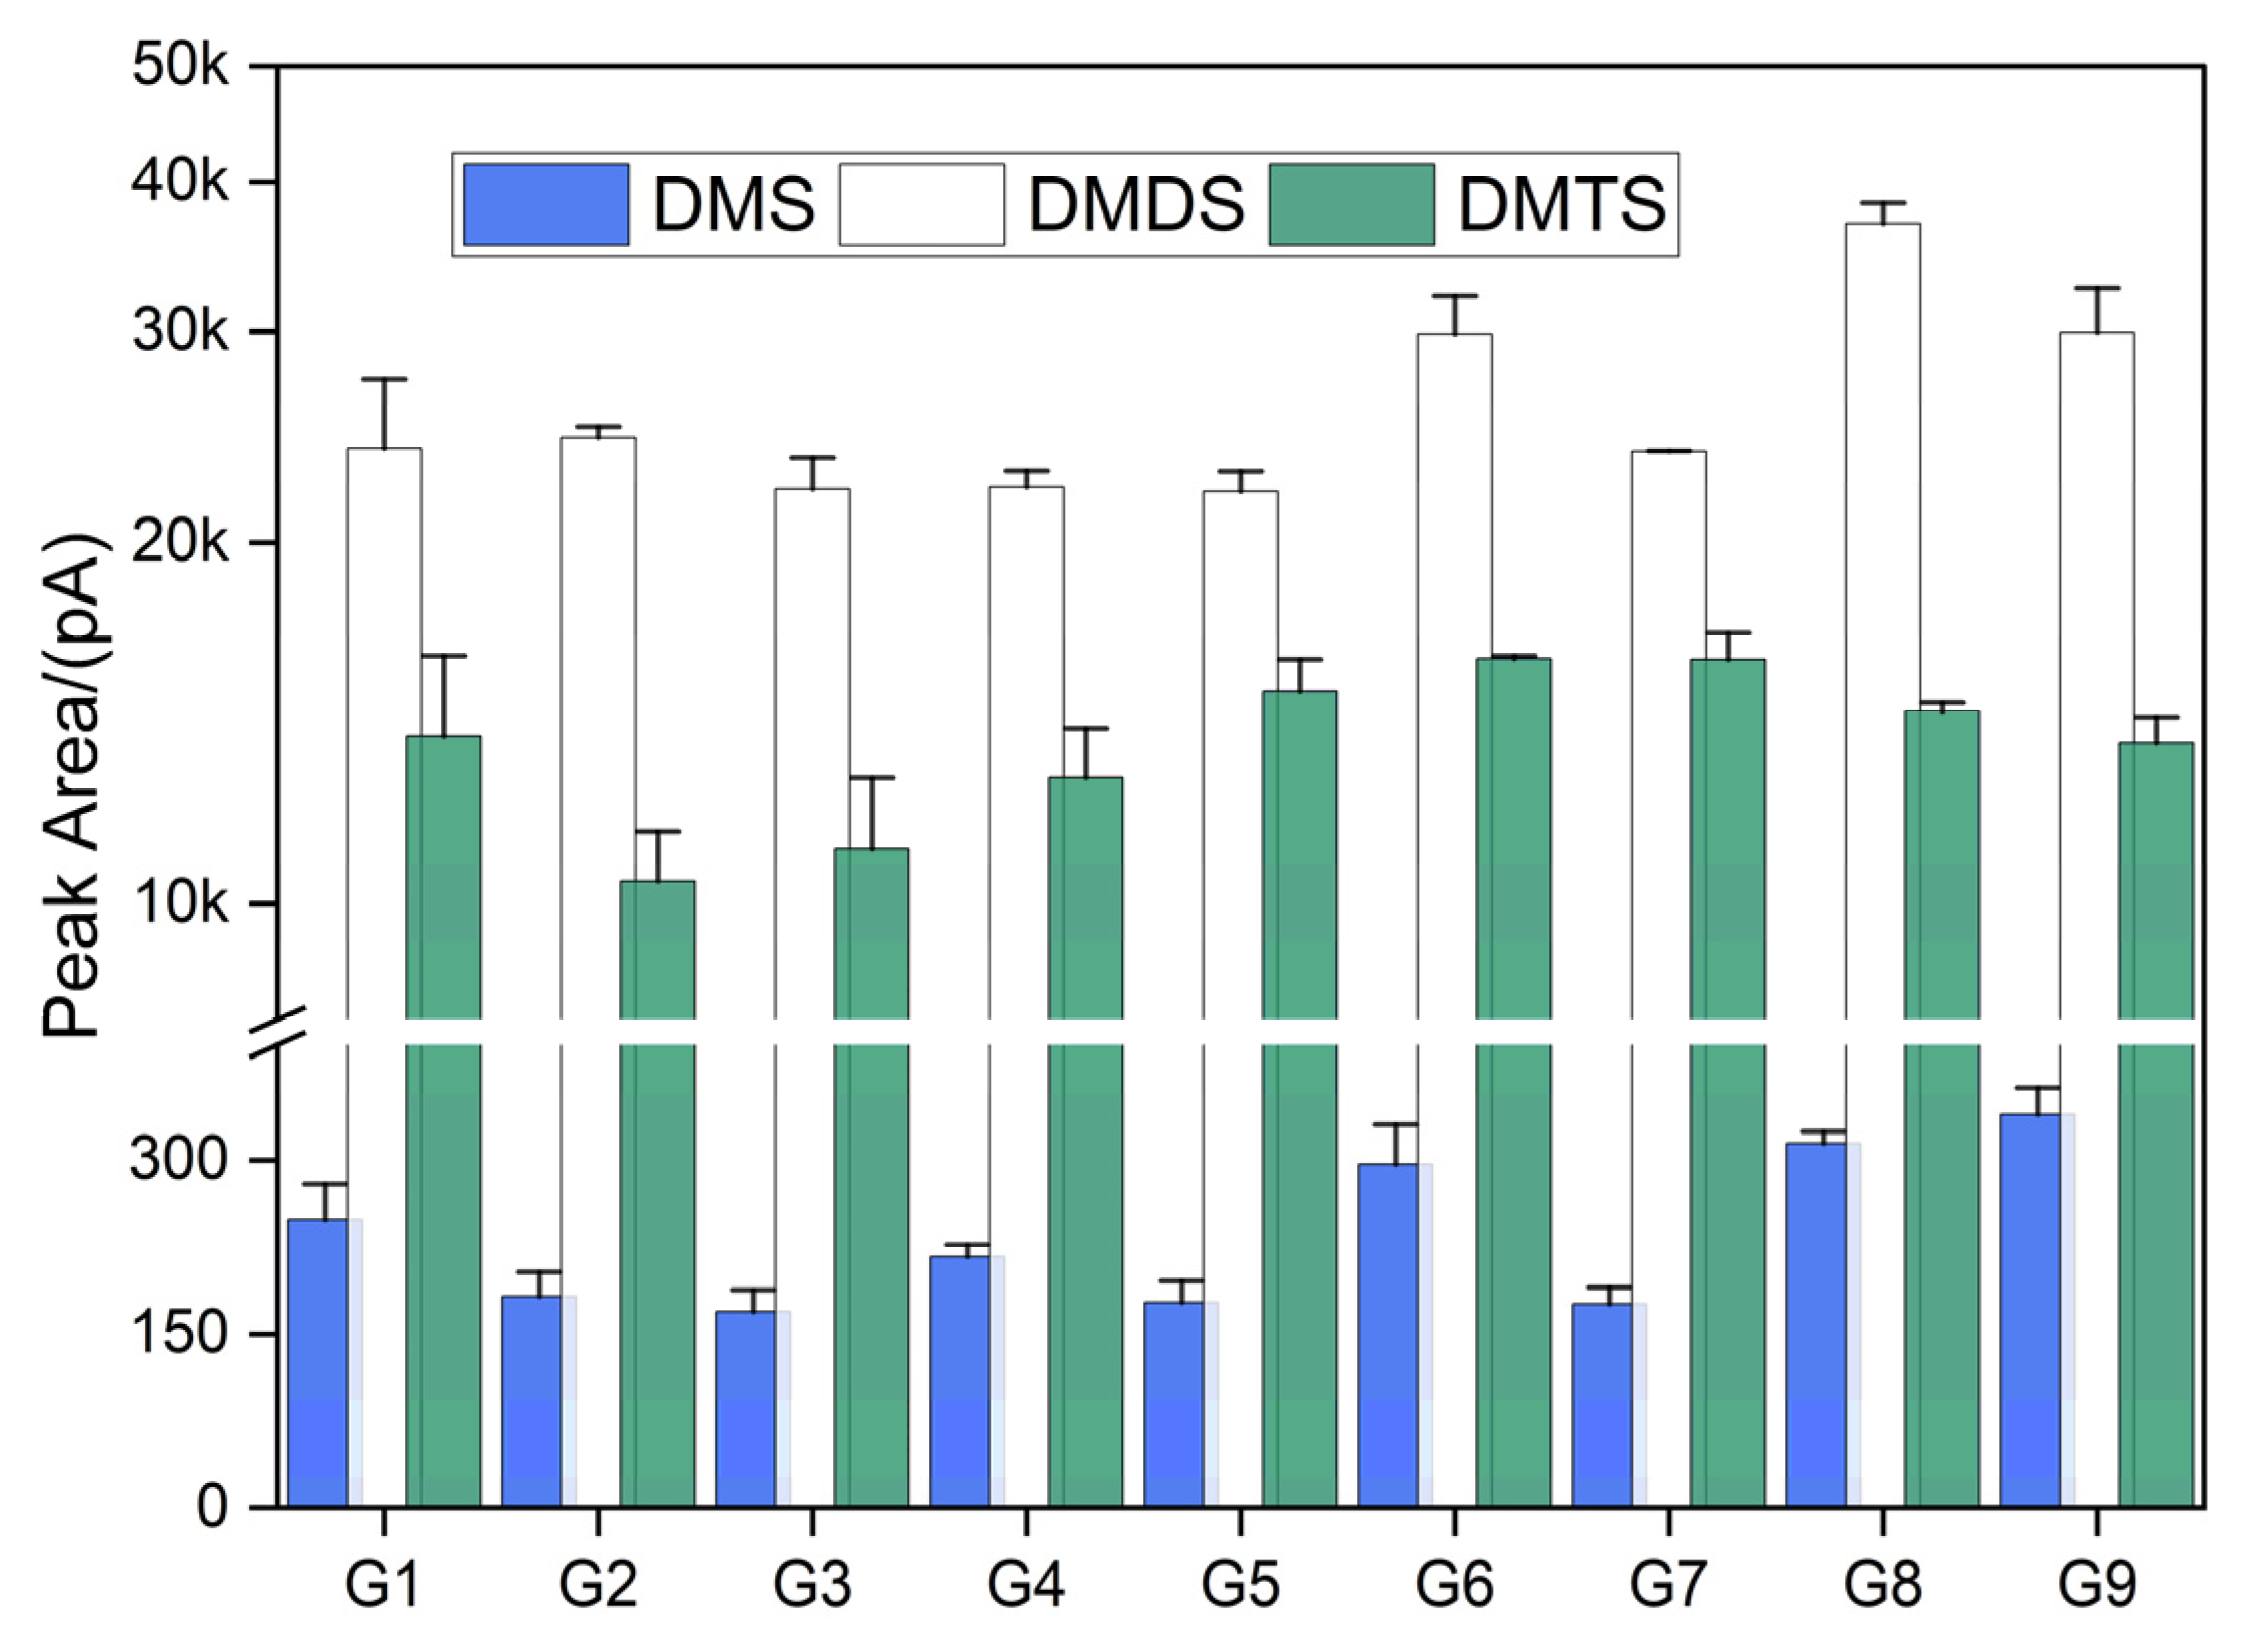
3.2.5. Orthogonal Optimization

Most current optimizations of HS-SPME conditions use a single factor as a variable to investigate the optimal conditions for the variation of this single factor when other factors are fixed [18,19,20,21]. This method often ignores the influence of interactions between multiple factors on target extraction. Therefore, in this study, on the basis of the previous single-factor optimization, the ion concentration (16%, 18%, and 20%), extraction time (77 min, 87 min, and 97 min), and extraction temperature (45 °C, 55 °C, and 55 °C) were selected as the three factors and three levels for orthogonal optimization experiments using 200 ng/L mixed standard working solution, which comprehensively considered the three values of the three factors to ensure the selection of the most accurate and stable HS-SPME conditions. The specific arrangements of the orthogonal experiments are listed in Table 2.
Figure 3 shows the results of the orthogonal experiments. As can be seen from the figure, under the nine different orthogonal experimental conditions, there was little difference in the peak areas of the three DMSs, but it was still necessary to refine the comparison and analysis of the three DMSs peak areas separately. The peak area of DMS was the largest in group 9 (20%, 97 min, and 55 °C), followed by group 8 (20%, 87 min, and 50 °C) and group 6 (18%, 97 min, and 50 °C). The peak area of DMDS was larger in groups 8, 6, and 9. The comparison of the peak areas of DMDS was as follows: group 8 > group 6 > group 9. The interaction of larger ion concentration (18% and 20%) with different extraction times (87 min and 97 min) and extraction temperatures (50 °C and 55 °C) contributed to the increase in the peak areas of DMS and DMDS. The peak area sizes of DMTS were more evenly distributed among the nine orthogonal experiments, but the peak area sizes of DMTS were largest in groups 6 and 7 (20%, 77 min, and 60 °C), followed by group 5 (18%, 87 min, and 60 °C) and group 8. The comparison of the extraction effect of the three DMSs peak areas showed that the best experimental results were obtained for groups 6 and 8.
Further comparative analysis of groups 6 and 8 showed that although the extraction peak areas of DMTS in group 8 were smaller than those in group 6, the extraction peak areas of DMS and DMDS were larger than those in group 6. Comparing the extraction efficiencies of the two groups, the extraction time of group 8 (87 min) was less than that of group 6 (97 min). Therefore, the extraction process was completed faster under the experimental conditions of group 8. Therefore, group 8 (20% ion concentration, 87 min extraction time, and 50 °C extraction temperature) was selected for the final HS-SPME conditions for this optimization experiment.

3.3. The Validation of the Methods

3.3.1. Linearity

Under the optimal HS-SPME conditions (extraction fiber 50/30 µm DVB/CAR/PDMS, ion concentration 20%, extraction time 87 min, and extraction temperature 50 °C) and the conditions of experimental methods and instrumental parameters determined in Section 2.4, the mixed standard stock solutions of the three DMSs were diluted step by step using ultrapure water to formulate concentrations of 10, 50, 100, 200, 500, 750, and 1000 ng/L, and analyzed by linear regression using the external standard method. According to the results of the peaks of the three DMSs at different concentrations, the usual fitting method was used to create scatter plots with the peak area y as the vertical coordinate and concentration x/(ng/L) as the horizontal coordinate. However, to facilitate the calculation and analysis of subsequent experiments, the graphing and fitting methods were adjusted. The peak area and concentration were linearly fitted using corresponding natural log (ln) values. The standard working curves were plotted, and the results are shown in Table 3. The peak areas of DMS, DMDS, and DMTS were well-fitted to the corresponding concentration ranges, with fitting coefficient R2 values of 0.9967, 0.9907, and 0.9994, respectively. The fitting coefficients R2 of 0.99, or above, and the p-values of 0.001 indicate that the peak areas of the three DMSs showed an exponential increase with an increase in their concentration.

3.3.2. Detection and Quantitation Limits

Under the optimal conditions of headspace solid-phase microextraction (extraction fiber 50/30 µm DVB/CAR/PDMS, ion concentration 20%, extraction time 87 min, and extraction temperature 50 °C) and the experimental method and instrumental parameters determined in Section 2.4, the mixed standard stock solution of three DMSs was diluted step by step with ultrapure water, and then prepared as mixed standard work solutions of 100 ng/L and 200 ng/L. The limit of detection limit (LOD) was determined using a 3-fold signal–noise ratio (S/N = 3), and the lower limit of quantification (LOQ) was determined using a 10-fold signal–noise ratio (S/N = 10). Standard working solutions were prepared for five parallel samples. The results are summarized in Table 4. The LOD of DMS was 29 ng/L and the LOQ was 95 ng/L. The LOD of DMDS was 1.2 ng/L and the LOQ was 4.1 ng/L. The LOD of DMTS was 5.0 ng/L and the LOQ was 17 ng/L. A ng/L level of detection was reached for all DMSs. Xu et al. used GC-FPD to determine the contents of DMS and DMDS in various treatment units of a wastewater treatment plant, and the limits of detection could reach 4.2 ng/L and 2.6 ng/L, respectively [17]. Lu et al. determined five organosulfides containing DMS, DMDS, and DMTS using GC-MS with detection limits ranging from 2.2 to 4.0 ng/L [18]. Houxing et al. used SPME-GC-MS to determine the amount of DMSs produced by Flagellates, and the limit of detection could reach 6.8 ng/L [30]. Chen et al. used a novel adsorption tube to enrich DMSs in situ and determined DMS and DMDS in water samples using thermal desorption gas chromatography coupled with a sulfur chemiluminescence detector (TD-GC-SCD) with detection limits of 6 and 3 ng/L, respectively [15]. Similar limits of detection were achieved using the optimized method of this study; however, the versatility of the instrument was enhanced, which increased its usability.

3.3.3. Accuracy and Precision

The reliability of the method was evaluated by determining the blank spiking recovery. A known concentration of the mixed standard solution was added to ultrapure water such that the calculated concentrations after addition were at three levels, 50, 100, and 500 ng/L. Five parallel samples (n = 5) were analyzed using the HS-SPME–GC–FPD method. The results are summarized in Table 5.
As shown in Table 5, the recoveries of DMSs at 100 and 500 ng/L were 97.22% and 99.07%, respectively, with relative standard deviations (RSD) lower than 5.94%. The recoveries of DMDS at concentrations of 50, 100, and 500 ng/L were 93.39%~99.34%, with RSD lower than 6.25%. The recoveries of DMTS at 50, 100, and 500 ng/L ranged from 91.17% to 99.25%, with RSD lower than 5.47%. The HS-SPME-GC-FPD method for the determination of DMS, DMDS, and DMTS in water established by this study is more reliable and stable and can be used for the determination of even trace DMSs in water.

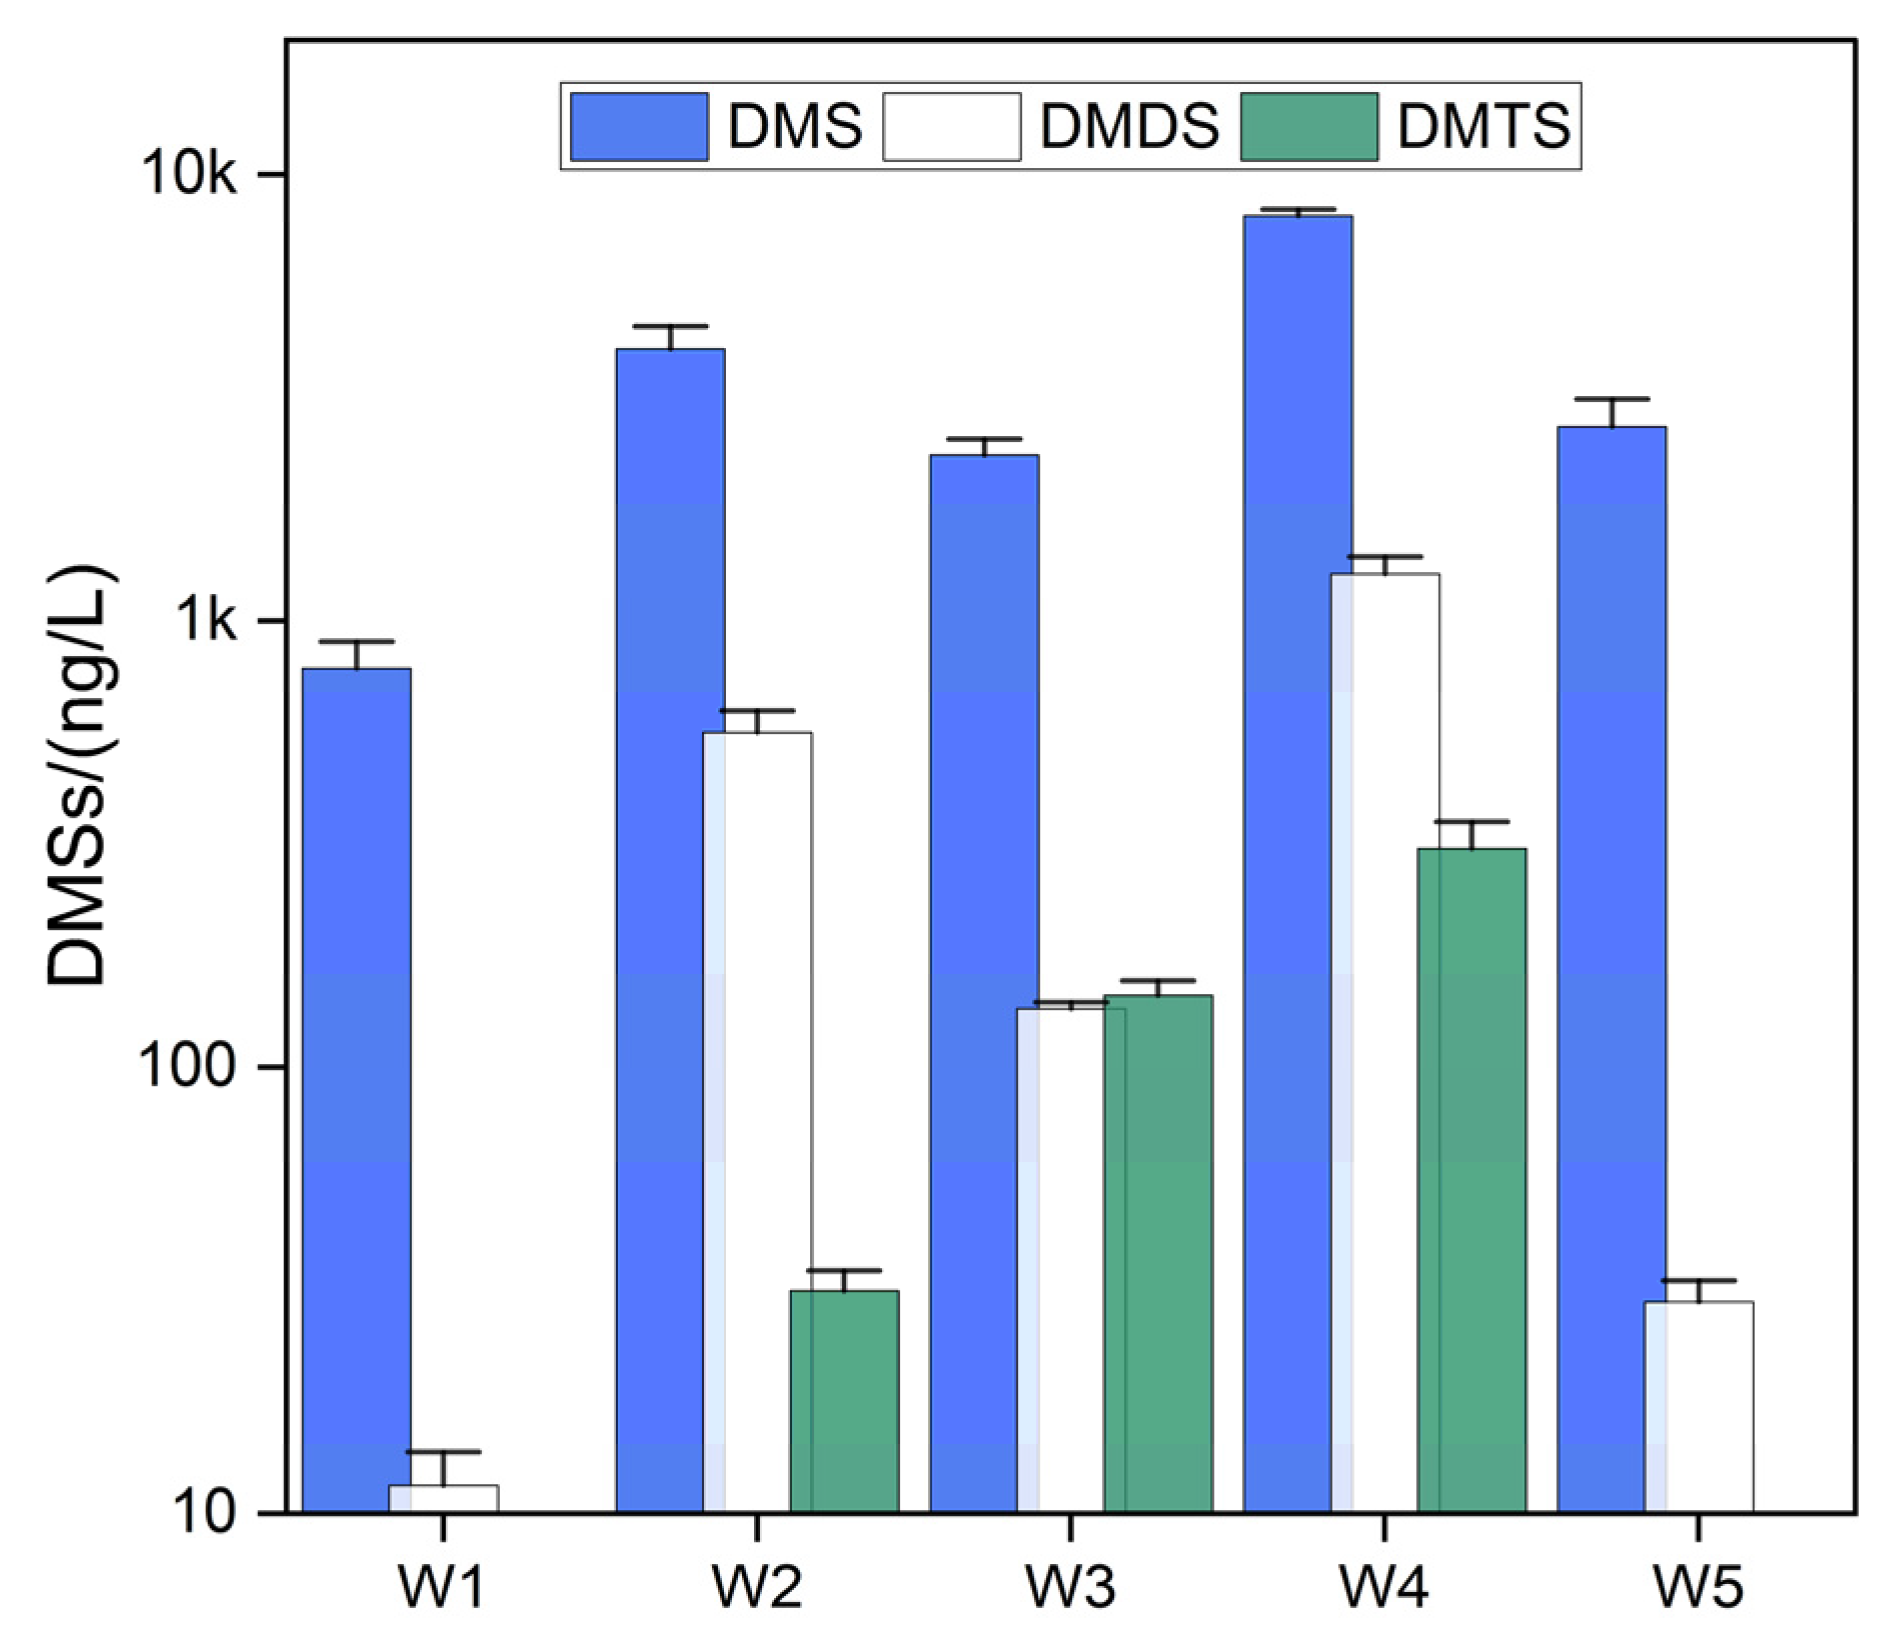
3.4. Analysis of Samples

The distribution characteristics of DMSs in the surface water of Lake Ulansuhai are shown in Figure 4. All three types of DMSs including DMS, DMDS, and DMTS were detected in the water samples by employing the optimized method developed in this study. The low SD of the testing results indicated the good reproducibility of the analysis. Specifically, DMS and DMDS were detected in all sampling sites in the lake, while DMTS was detected in 3 out of 5 sampling sites. The average concentration of three DMSs in descending order are DMS (3606.2 ng/L) > DMDS (403.4 ng/L) > DMTS (162.1 ng/L). The concentration of DMS in the water body of Lake Ulansuhai ranged from 783.8 to 8093.4 ng/L indicating a relatively severe DMS pollution in the lake water column. However, a clear spatial heterogeneity can be found in the distribution of DMS in the water of Lake Ulansuhai. Higher DMS concentrations were found in the central (W2), north (W3, W4), and west (W5) parts of the lake with large areas of submerged macroplants. The DMDS concentration ranged from 11.6 to 1276.8 ng/L, which also showed great spatial heterogeneity in the lake. Relatively severe DMDS pollution was found in the central (W2) and north (W3 and W4) parts of the lake. The concentration of DMTS was relatively the lowest among the three DMSs which ranged from not detected (W1 and W5) to 309.5 ng/L. The spatial distribution of DMTS was very similar to DMDS in Lake Ulansuhai, with relatively high DMTS concentrations in the central (W2) and north (W3 and W4) parts of the lake.
Compared with other lakes, the DMSs concentrations in the surface water of Lake Ulansuhai were higher than deep lakes such as Lake Constance [31] and Lake Kinneret [32] but similar to the shallow eutrophic Lake Yangcheng [11]. It is notable that the DMS, DMDS, and DMTS in the water of Lake Ulansuhai showed a certain degree of pollution for the average concentrations of the three compounds that largely exceeded the olfactory threshold concentrations. The most severe pollution of DMSs were found in the central and the north parts of the lake. Lake Ulansuhai is a typical grassy eutrophic lake. The lake floor is heavily covered with submerged macroplants, mainly Potamogeton pectinatus, and this situation is extremely severe in the central and the north parts of the lake. Shen et al. [33] found that the decay and degradation of the debris from dead submerged macroplants under hypoxic or anoxic condition could be the source of the DMSs in freshwater lakes. During this study, the water column was nearly hypoxic (DO < 2 mg/L) in the central and north parts of Lake Ulansuhai. Many debris of Potamogeton pectinatus were also found in the relevant sampling sites. Therefore, the high concentration of DMSs in the central and north parts of the lake were resulted by the decay and degradation of the dead submerged macroplants under the hypoxic/anoxic condition.

4. Conclusions

This study focused on optimizing the headspace solid-phase microextraction-gas chromatography-flame photometric method (HS-SPME-GC-FPD) for detecting dimethyl sulfides. The standard curve equations, limit of detection, lower limit of quantification, spiked recoveries of the experimental methods, and optimal extraction conditions were determined for the extraction of DMS, DMDS, and DMTS. The optimal extraction conditions were determined as using 50/30 µm DVB/CAR/PDMS extraction fiber at 20% ion concentration, 87 min extraction time, and 50 °C extraction temperature. Linear fits for DMS, DMDS, and DMTS were performed using ln(peak area) as the vertical coordinate and ln(concentration) as the horizontal coordinate. The correlation coefficients of the standardized working curves were 0.9967, 0.9907, and 0.9994, respectively, indicating a good linear relationship. Using this method, detection levels of ng/L were achieved for DMS, DMDS, and DMTS. The limits of detection for DMS, DMDS, and DMTS were 29 ng/L, 1.2 ng/L, and 5.0 ng/L, respectively. The recoveries of the spiked standards for DMS, DMDS, and DMTS were 97.22~99.07%, 93.39~99.34%, and 91.17~99.25%, and the relative standard deviations were 5.18~5.94%, 3.08~6.25%, and 2.56~5.47%, respectively. The headspace solid-phase microextraction-gas chromatography-flame photometric method established in this study is stable and reliable and can be used to analyze volatile sulfides in water collected from freshwater lakes.

Author Contributions

All authors contributed to the study and manuscript. Q.S. designed the investigation and research protocol. Q.S., A.W., J.L. and L.J. conducted the field investigation and sampling. Q.B., Q.S. and A.W. analyzed the data. Q.B. and Q.S. drafted and revised the manuscript. All authors have read and agreed to the published version of the manuscript.

Funding

This study was financially funded by the National Key Research and Development Program of China (2022YFC3202703), the Science and Technology Program of Bayan Nur (K202324), National Natural Science Foundation of China (41877488), Science and Technology Achievement Transformation Foundation of Inner Mongolia Autonomous Region (2021CG0013), Key Projects of Ningbo Public Welfare Category Science and Technology Plan Projects (2022S006), and Key Subjects of Ningbo College of Health Sciences (2020Z06).

Institutional Review Board Statement

Not applicable.

Informed Consent Statement

Not applicable.

Data Availability Statement

The data used in this study are available upon request. The data are not publicly available due to privacy.

Conflicts of Interest

The authors declare no conflicts of interest.

References

  1. Wang, C.; Xu, D.; Bai, L.; Zhu, B.; Huang, L.; Jiang, H. Effects of accumulated cyanobacterial bloom biomass contents on the characteristics of surface fluid sediments in a eutrophic shallow lake. J. Environ. Manag. 2022, 308, 114664. [Google Scholar] [CrossRef] [PubMed]
  2. Li, S.; Liu, C.; Sun, P.; Ni, T. Response of cyanobacterial bloom risk to nitrogen and phosphorus concentrations in large shallow lakes determined through geographical detector: A case study of Taihu Lake, China. Sci. Total Environ. 2022, 816, 151617. [Google Scholar] [CrossRef] [PubMed]
  3. Rabalais, N.N.; Díaz, R.J.; Levin, L.A.; Turner, R.E.; Gilbert, D.; Zhang, J. Dynamics and distribution of natural and human-caused hypoxia. Biogeosciences 2010, 7, 585–619. [Google Scholar] [CrossRef]
  4. Carmichael, W. Health Effects of Toxin-Producing Cyanobacteria: “The CyanoHABs”. Hum. Ecol. Risk Assess. Int. J. 2001, 7, 1393–1407. [Google Scholar] [CrossRef]
  5. Qian, R.; Wang, X.; Gao, J.; Yang, H.; Han, J.; Zhang, Q.; Huang, J. A modelling framework to track phosphorus sources of the drinking water intakes in a large eutrophic lake. J. Hydrol. 2022, 607, 127566. [Google Scholar] [CrossRef]
  6. Wang, J.; Chu, Y.-X.; Tian, G.; He, R. Estimation of sulfur fate and contribution to VSC emissions from lakes during algae decay. Sci. Total Environ. 2023, 856, 159153. [Google Scholar] [CrossRef] [PubMed]
  7. Huang, J.; Zhang, Y.; Arhonditsis, G.B.; Gao, J.; Chen, Q.; Peng, J. The magnitude and drivers of harmful algal blooms in China’s lakes and reservoirs: A national-scale characterization. Water Res. 2020, 181, 115902. [Google Scholar] [CrossRef] [PubMed]
  8. Zhang, X.J.; Chen, C.; Ding, J.Q.; Hou, A.; Li, Y.; Niu, Z.B.; Laws, E.A. The 2007 water crisis in Wuxi, China: Analysis of the origin. J. Hazard. Mater. 2010, 182, 130–135. [Google Scholar] [CrossRef]
  9. Reese, B.; Anderson, M. Dimethyl sulfide production in a saline eutrophic lake, Salton Sea, California. Limnol. Oceanogr. 2009, 54, 250–261. [Google Scholar] [CrossRef]
  10. Hu, H.; Mylon, S.; Benoit, G. Volatile organic sulfur compounds in a stratified lake. Chemosphere 2007, 67, 911–919. [Google Scholar] [CrossRef]
  11. Li, Y.; Gong, X.; Zhao, Z.; Shen, Q.; Zhang, L. Distribution and Release of Volatile Organic Sulfur Compounds in Yangcheng Lake. Water 2022, 14, 1199. [Google Scholar] [CrossRef]
  12. Olsson, F.; Mackay, E.B.; Barker, P.; Davies, S.; Hall, R.; Spears, B.; Exley, G.; Thackeray, S.J.; Jones, I.D. Can reductions in water residence time be used to disrupt seasonal stratification and control internal loading in a eutrophic monomictic lake? J. Environ. Manag. 2022, 304, 114169. [Google Scholar] [CrossRef] [PubMed]
  13. Free, G.; Bresciani, M.; Pinardi, M.; Peters, S.; Laanen, M.; Padula, R.; Cingolani, A.; Charavgis, F.; Giardino, C. Shorter blooms expected with longer warm periods under climate change: An example from a shallow meso-eutrophic Mediterranean lake. Hydrobiologia 2022, 849, 3963–3978. [Google Scholar] [CrossRef]
  14. Kincaid, D.W.; Adair, E.C.; Joung, D.; Stockwell, J.D.; Schroth, A.W. Ice cover and thaw events influence nitrogen partitioning and concentration in two shallow eutrophic lakes. Biogeochemistry 2021, 157, 15–29. [Google Scholar] [CrossRef]
  15. Chen, Y.; Li, J.; Hou, X.; Zhang, X.; Yin, H.; Zhang, M.; Zheng, C. Trapping and preconcentration of volatile organic sulfur compounds in water samples by portable and battery-powered trapping device prior to gas chromatography-sulfur chemiluminescence determination. J. Chromatogr. A 2020, 1619, 460947. [Google Scholar] [CrossRef]
  16. Olivera, C.; Tondo, M.L.; Girardi, V.; Fattobene, L.; Herrero, M.S.; Pérez, L.M.; Salvatierra, L.M. Early-stage response in anaerobic bioreactors due to high sulfate loads: Hydrogen sulfide yield and other organic volatile sulfur compounds as a sign of microbial community modifications. Bioresour. Technol. 2022, 350, 126947. [Google Scholar] [CrossRef] [PubMed]
  17. Xu, Z.; Yang, Q.; Jiang, X.; Dong, Y.; Hu, Z.; Shi, L.; Zhao, R. Multi-dimension analysis of volatile sulfur compound emissions from an urban wastewater treatment plant. J. Environ. Manag. 2023, 345, 118632. [Google Scholar] [CrossRef] [PubMed]
  18. Lu, X.; Fan, C.; Shang, J.; Deng, J.; Yin, H. Headspace solid-phase microextraction for the determination of volatile sulfur compounds in odorous hyper-eutrophic freshwater lakes using gas chromatography with flame photometric detection. Microchem. J. 2012, 104, 26–32. [Google Scholar] [CrossRef]
  19. Scarlata, C.J.; Ebeler, S.E. Headspace solid-phase microextraction for the analysis of dimethyl sulfide in beer. J. Agric. Food Chem. 1999, 47, 2505–2508. [Google Scholar] [CrossRef]
  20. Cheng, J.; Liu, K.; Bai, M.; Cheng, C.; Yu, Y.; Zhou, X. Determination of 2-methylisoborneol and geosmin in drinking water using headspace solid phase micro-extraction coupled with gas chromatography-mass spectrometry. Chin. J. Chromatogr. 2015, 33, 1287–1293. [Google Scholar] [CrossRef]
  21. Jiang, Y.; Cheng, B.; Liu, M.; Nie, Y. Spatial and Temporal Variations of Taste and Odor Compounds in Surface Water, Overlying Water and Sediment of the Western Lake Chaohu, China. Bull. Environ. Contam. Toxicol. 2016, 96, 186–191. [Google Scholar] [CrossRef] [PubMed]
  22. Franzmann, P.D.; Heitz, A.; Zappia, L.R.; Wajon, J.E.; Xanthis, K. The formation of malodorous dimethyl oligosulphides in treated groundwater: The role of biofilms and potential precursors. Water Res. 2001, 35, 1730–1738. [Google Scholar] [CrossRef] [PubMed]
  23. Xia, X.; Chen, Q.; Wang, C.; Chen, D.; Zhang, L.; Wu, J.; Zhou, Q.; Wu, Z. Determination of four major odor compounds in black and odorous water by headspace solid phase microextraction combined with gas chromatography-mass spectrometry. Environ. Chem. 2019, 38, 2789–2796. [Google Scholar]
  24. Sun, J.; Wang, R.; Yin, D. Simultaneous determination of nine taste and odor compounds in source water of Chinese cities by headspace solid phase micro-extraction combined with gas chromatography-mass spectrometry. Environ. Chem. 2016, 35, 7. [Google Scholar]
  25. Chen, X.; Luo, Q.; Yuan, S.; Wei, Z.; Song, H.; Wang, D.; Wang, Z. Simultaneous determination of ten taste and odor compounds in drinking water by solid-phase microextraction combined with gas chromatography-mass spectrometry. J. Environ. Sci. 2013, 25, 2313–2323. [Google Scholar] [CrossRef] [PubMed]
  26. Peter, A.; Köster, O.; Schildknecht, A.; von Gunten, U. Occurrence of dissolved and particle-bound taste and odor compounds in Swiss lake waters. Water Res. 2009, 43, 2191–2200. [Google Scholar] [CrossRef] [PubMed]
  27. Yu, C.; Shi, C.; Ji, M.; Xu, X.; Zhang, Z.; Ma, J.; Wang, G. Taste and odor compounds associated with aquatic plants in Taihu Lake: Distribution and producing potential. Environ. Sci. Pollut. Res. 2019, 26, 34510–34520. [Google Scholar] [CrossRef] [PubMed]
  28. Ding, Z.; Peng, S.; Xia, W.; Zheng, H.; Chen, X.; Yin, L. Analysis of Five Earthy-Musty Odorants in Environmental Water by, H.S.-S.P.M.E./.G.C.-M.S. Int. J. Anal. Chem. 2014, 2014, 697260. [Google Scholar] [CrossRef] [PubMed]
  29. Godayol, A.; Alonso, M.; Besalú, E.; Sanchez, J.M.; Anticó, E. Odour-causing organic compounds in wastewater treatment plants: Evaluation of headspace solid-phase microextraction as a concentration technique. J. Chromatogr. A 2011, 1218, 4863–4868. [Google Scholar] [CrossRef]
  30. Hou, X.; Wang, Y.; Liu, T.; Du, M.; Gao, Y.; Jiang, W.; Li, F.; Dong, S.; Li, W.; Jiang, Z. Effects of feeding activities by four common economic bivalves on the production of dimethyl sulfur compounds from isochrysis galbana. Prog. Fish. Sci. 2021, 42, 124–131. [Google Scholar]
  31. Steinke, M.; Hodapp, B.; Subhan, R.; Bell, T.G.; Martin-Creuzburg, D. Flux of the biogenic volatiles isoprene and dimethyl sulfide from an oligotrophic lake. Sci. Rep. 2018, 8, 630. [Google Scholar] [CrossRef] [PubMed]
  32. Sela-Adler, M.; Said-Ahmad, W.; Sivan, O.; Eckert, W.; Kiene, R.P.; Amrani, A. Isotopic evidence for the origin of dimethylsulfide and dimethylsulfoniopropionate-like compounds in a warm, monomictic freshwater lake. Environ. Chem. 2016, 13, 340–351. [Google Scholar] [CrossRef]
  33. Shen, Q.; Zhou, Q.; Shang, J.; Shao, S.; Zhang, L.; Fan, C. Beyond hypoxia: Occcurrence and characteristics of black blooms due to the decomposition of the submerged plant Potamogeton crispus in a shallow lake. J. Environ. Sci. 2014, 26, 281–288. [Google Scholar] [CrossRef] [PubMed]
Figure 1. Peak shape of 100 ng/L dimethyl sulfur-containing compounds by 50/30 µm DVB/CAR/PDMS extraction fiber (a,c,e,g) and 75 µm CAR/PDMS extraction fiber (b,d,f,h).
Atmosphere 15 00484 g001
Figure 2. Effect of ionic strength, extraction time, and extraction temperature on the detection of DMS, DMDS, and DMTS during extraction (the blue line is the trend line and the red line is the fitted curve).
Atmosphere 15 00484 g002
Figure 3. Effect of different orthogonal experimental treatment groups on the detection of DMS, DMDS, and DMTS.
Atmosphere 15 00484 g003
Figure 4. Distribution characteristics of DMSs in the water column of Lake Ulansuhai.
Atmosphere 15 00484 g004
Table 1. Basic properties of dimethyl sulfide compounds.
PropertiesDimethyl MonosulfideDimethyl DisulfideDimethyl Trisulfide
Chemical formula C2H6SC2H6S2C2H6S3
Structural formula (chemistry)Atmosphere 15 00484 i001Atmosphere 15 00484 i002Atmosphere 15 00484 i003
Molar mass/(g·mol)−162.1394.2126.26
States of mattercolorless liquidcolorless/yellow liquidcolorless liquids
OdorsDecaying vegetation, septic, swampy
Density/(g·cm)−30.8461.0631.202
Melting point/(°C)−98−85−68.05
Boiling point/(°C)35~41110170
Olfactory threshold/(ng/L)0.3~1000 [8]200~5000 [21]10 [22]
Table 2. Orthogonal experiments.
Experimental GroupIon Concentration/%Extraction Time/minExtraction
Temperature/°C
1167750
2168755
3169760
4187755
5188760
6189750
7207760
8208750
9209755
Table 3. Standard curves and correlations of DMSs.
Dimethyl SulfidesLinear Range/(ng/L)Regression EquationCoefficient of Determination R2p-Value
DMS100~10,000y = 1.6503x − 3.05020.9967<0.001
DMDS10~1000y = 2.0681x − 0.52190.9907<0.001
DMTS5~1000y = 2.3945x − 3.12690.9994<0.001
Note: x is the logarithmic value of the sulfide concentration (ng/L) and y is the logarithmic value of the instrumental determination of the peak area.
Table 4. Detection limit and quantification limit of dimethyl sulfur-containing compounds.
Dimethyl SulfidesLower Limit of Detection LOD/(ng/L)Lower Limit of Quantification LOQ/(ng/L)Based on Concentration ng/L
DMS2995200
DMDS1.24.1100
DMTS5.017100
Table 5. Spiked recoveries and relative standard deviations of DMS compounds.
Dimethyl SulfidesStandard
Concentration/(ng/L)
Detected
Concentration/(ng/L)
Spiked
Recovery/%
Relative Standard Deviation RSD/%
DMS10099.199.075.18
500486.197.225.94
DMDS5048.596.933.08
10094.294.225.13
500496.799.346.25
DMTS5046.793.394.79
10091.291.175.47
500496.399.252.56
Disclaimer/Publisher’s Note: The statements, opinions and data contained in all publications are solely those of the individual author(s) and contributor(s) and not of MDPI and/or the editor(s). MDPI and/or the editor(s) disclaim responsibility for any injury to people or property resulting from any ideas, methods, instructions or products referred to in the content.

